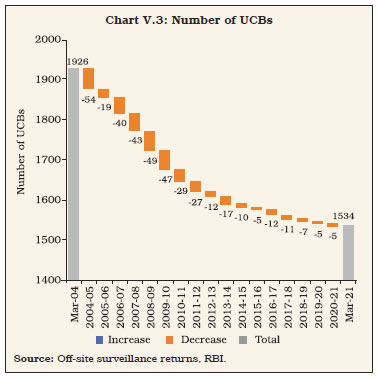
The co-operative banking segment—both urban and rural—remained robust throughout the COVID-19 stress. Although the balance sheet growth of urban co-operatives banks (UCBs) in 2020-21 was driven by deposits on the liabilities side, subdued credit growth prompted acceleration in investments on the assets side. The financial indicators of UCBs, including their capital position and profitability, improved. Among the short-term rural co-operatives, the profitability of state co-operative banks and district central co-operative banks improved, while their asset quality deteriorated. Going forward, structural reforms that address deep-seated fault lines are expected to catalyse change in their operations. 1. Introduction V.1 The co-operative banking sector, especially the rural co-operatives, emerged relatively unscathed from the first wave of the pandemic in 2020-21. Yet, structural impediments emanating from regulatory overlaps, high levels of loan delinquencies and erosion of depositor confidence due to frauds continue to beset the sector. In 2020-21, the Reserve Bank and the government set out to address these issues. The Banking Regulation (Amendment) Act, 2020 gave the Reserve Bank additional powers to regulate this sector. The enhancement in deposit insurance from ₹1 lakh to ₹5 lakh augmented the share of co-operative depositors’ coverage from 42.7 per cent at end- March 2019 to 69.4 per cent at end-March 20211. The creation of Ministry of Co-operation in July 2021 is intended to provide a separate administrative, legal and policy framework for enabling the development of multi-state co-operatives. V.2 Against this background, the rest of the chapter examines the performance of urban and rural co-operative banks during the period under review. The structure of the co-operative banking sector and its regulation are set out in Section 2, followed by a discussion of business operations and financial performance of urban co-operative banks (UCBs) in 2020-21 in Section 3. The financial viability of short-term and long-term rural co-operatives is evaluated in Section 42. Section 5 concludes the chapter with an overall assessment. 2. Structure of the Co-operative Banking Sector V.3 The structure of co-operative banking in India is multi-tiered, with urban and rural co-operatives as its main pillars. UCBs are classified as scheduled and non-scheduled, based on their inclusion or otherwise in the second schedule of the Reserve Bank of India Act, 19343, and their geographical outreach (single-state or multi-state). Rural co-operatives, on the other hand, are classified into two arms—short-term and long-term. At end-March 2021, there were 98,042 co-operatives, consisting of 1,534 UCBs and 96,508 rural co-operatives4 (Chart V.1). 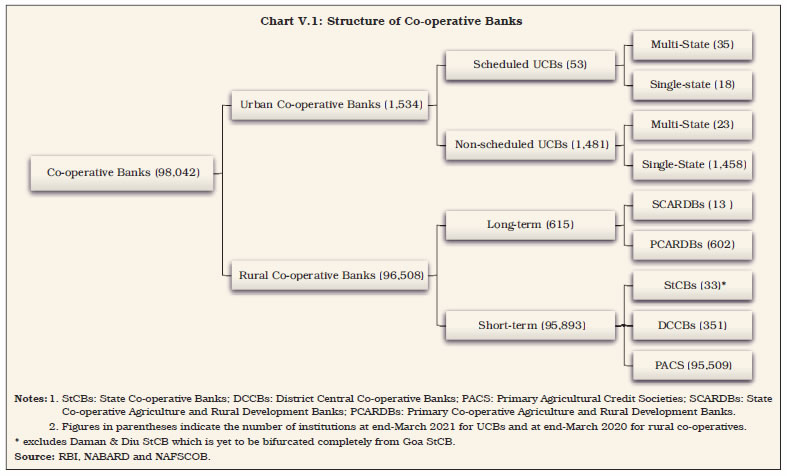 V.4 Over a period of time, the relative size and, consequently, the influence of co-operative banks has been shrinking. The aggregate balance sheet size of the co-operative banking sector at ₹18.8 lakh crore at end-March 2020, was close to 10 per cent of the scheduled commercial banks’ (SCBs’) consolidated balance sheet, down from 19.4 per cent in 2004-05. Rural co-operatives, especially short-term, overshadow their urban counterparts, both in terms of number and total asset size (Chart V.2). 3. Urban Co-operative Banks V.5 Financial liberalisation in the 1990s resonated through the urban co-operative banking sector. Interest rate deregulation provided an incentive for attracting new players with wider operational margins, while a liberal licensing policy eased barriers to entry. The number of UCBs increased from 1,307 in 1991 to 2,105 in 2004, accompanied by an 18 per cent compounded annual growth rate (CAGR) of deposits5. In subsequent years, however, financial weakness in some entities led to concerns about their systemic impact. The Reserve Bank initiated a process of consolidation in the sector, including amalgamation of unviable UCBs with their viable counterparts, closure of non-viable entities and suspension of issuance of new licenses. As a result, the number of UCBs progressively declined to 1,534 by end-March 2021 (Chart V.3). 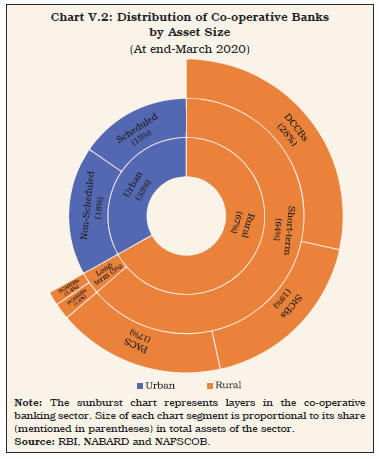
 V.6 Starting 2004-05, the consolidation drive has yielded a total of 136 mergers till March 2021, with more than three-fourths of them in two states, viz. Maharashtra and Gujarat (Chart V.4a). Licence cancellations accompanied the merger process, with a total of 44 UCB licences being cancelled since 2015-16. With most of the amalgamations and closures occurring in the non-scheduled category, the number of scheduled UCBs (SUCBs) has broadly remained constant (Chart V.4b).
V.7 Despite the large localised presence of UCBs, their clientele share is increasingly being taken away by SCBs, leveraging on banking correspondent networks and FinTech. As a result, the total balance sheet size of UCBs as a proportion to that of SCBs has fallen from 5.6 per cent at end-March 2005 to 3.4 per cent at end- March 2021 (Chart V.5a). Their share in deposits and advances has also fallen proportionately (Chart V.5b). V.8 For regulatory purposes, UCBs are classified into Tier-I and Tier-II categories, based on their depositor base6. The Tier-II category has become dominant, mainly on the back of an expansion of their depositor bases (Table V.1). Table V.1: Tier-wise Distribution of Urban Co-operative Banks
(At end-March 2021) | | (Amount in ₹ Crore) | | Tier Type | Number of Banks | Deposits | Advances | Total Assets | | Number | % to Total | Amount | % to Total | Amount | % to Total | Amount | % to Total | | 1 | 2 | 3 | 4 | 5 | 6 | 7 | 8 | 9 | | Tier I | 846 | 55.1 | 33,854 | 6.4 | 19,188 | 6.1 | 44,120 | 6.7 | | Tier II | 688 | 44.9 | 4,93,128 | 93.6 | 2,93,577 | 93.9 | 6,13,731 | 93.3 | | All UCBs | 1,534 | 100.0 | 5,26,982 | 100.0 | 3,12,765 | 100.0 | 6,57,851 | 100.0 | Note: Data are provisional.
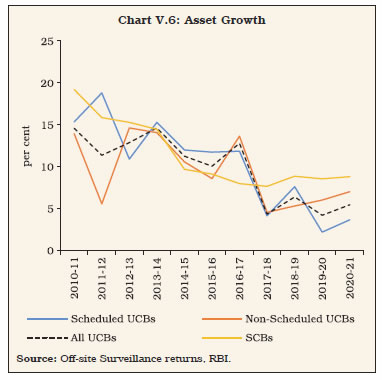
Source: Off-site surveillance returns, RBI. | V.9 Following the failure of a large UCB in 2019, the Reserve Bank initiated supervisory actions to protect depositors’ interests. This episode, however, brought forth issues that were simmering for several years. Legislative amendments to the Banking Regulation Act, 1949 carried out in 2020 and alluded to earlier, are considered as important steps to address such issues. Furthermore, the Expert Committee on UCBs (Chairman: Shri N S Vishwanathan) recommended measures to streamline the sector (Box V.1). 3.1 Balance Sheet V.10 The consolidation drive initiated in 2004-05 yielded encouraging results for nearly a decade, with the combined balance sheet of UCBs expanding at a CAGR of 14 per cent. Since 2017-18, however, a low growth phase took hold right up to 2020-21. From 2013-14 to 2015-16, SUCBs were leaders driving the sector’s growth; since then, however, non-scheduled UCBs (NSUCBs) have picked up steam. Overall, the sector has been growing at a slower pace than SCBs in the last four years (Chart V.6). Box V.1: Report of the Expert Committee on Primary (Urban) Co-operative Banks The Reserve Bank set up an Expert Committee on UCBs (Chairman: Shri N.S. Vishwanathan) in February 2021. In its report submitted on July 31, 2021, the Committee has made the following major recommendations: - Scale-based differential regulation of UCBs by categorizing them into four tiers, based on size of deposits:
| Items | Tier-1 | Tier-2 | Tier-3 | Tier-4 | | Classification basis | All unit UCBs and salary earner’s UCBs, and all UCBs with deposit base up to ₹100 crore | Deposit base between ₹100 crore to ₹1,000 crore | Deposit base between ₹1,000 crore to ₹10,000 crore | Deposit base of over ₹10,000 crore | | Net worth/CRAR | A minimum net worth of ₹2 crore for banks operating in a single district and ₹5 crore for others. Minimum CRAR of 9 per cent, with additional CRAR of 2.5 per cent each for not having the prescribed minimum net worth and not being member of the Umbrella Organisation (UO). | A minimum CRAR of 15 per cent (on credit risk), which may be reduced by 1 per cent upon the bank becoming a member of the UO. | A minimum CRAR of 15 per cent as applicable to SFBs | CRAR as per Basel III norms applicable to universal banks | | Sectoral Exposure Ceilings | Maximum exposure on housing loans, gold loans with bullet repayment terms and unsecured advances to be linked with their Tier 1 capital, subject to regulator-specified ceiling. | Maximum exposure on housing loans, gold loans with bullet repayment terms and unsecured advances to be linked with their Tier 1 capital with their own boardapproved ceiling | As applicable to SFBs | As applicable to universal banks | | Membership of UO | Incentives for membership wherein not being a member attracts higher CRAR requirements. | Voluntary Membership | -
The Committee recommended expediting the operationalisation of an UO for which in-principle approval was granted by the Reserve Bank in 2019. It recommended that for the UO to be financially strong with adequate capital, a minimum capital of ₹300 crore may be maintained, while the organisation may have a regulatory framework similar to the regime for the largest segment of NBFCs; -
Considering the need for listing the securities issued by UCBs, suitable amendments may be made in the Banking Regulation Act, 1949 to enable the Reserve Bank to notify instruments issued by co-operative banks as “securities” for the purpose of Securities Contracts (Regulation) Act, 1956 and the Securities and Exchange Board of India Act, 1992 so as to facilitate their listing and trading on recognised stock exchanges. -
Tier 3 and Tier 4 UCBs equipped with necessary technology and wherewithal may be permitted to issue shares at premium; -
On the Supervisory Action Framework, the Committee recommended adoption of a twin indicator approach, i.e. only net NPA and CRAR as triggers, instead of triple indicators at present viz., asset quality, capital adequacy and profitability; -
As a remedial action for weak UCBs, the Reserve Bank should nudge them towards voluntary merger at an early stage of stress. For cases where prudential requirements are not met within a prescribed timeline and voluntary solutions are not forthcoming, the Committee has recommended mandatory mergers; -
The Committee also recommended issuance of new licences after the UO has stabilised. |
 V.11 UCBs’ balance sheet growth in 2020-21 can be attributed to deposits on the liabilities side and investments on the assets side, both of which were spearheaded by NSUCBs. The increase in operating profits is responsible for the growth in UCBs’ net worth (capital plus reserves and surplus), while the increase in balances with the Reserve Bank and in investments stems from the lack of credit growth despite excess liquidity conditions. In the aftermath of the outbreak of the pandemic, some major SUCBs had borrowed heavily from the Reserve Bank’s repo window under the liquidity adjustment facility (LAF). At end-March 2021, SUCBs’ aggregate borrowings declined on base effect (Table V.2). V.12 The balance sheet composition of SUCBs and NSUCBs differs, with NSUCBs having a larger deposit base and being much less dependent on borrowings. Just like SUCBs, the NSUCBs are also required to maintain CRR and other statutory reserves. Unlike the former, however, the latter have the option of not maintaining it with the Reserve Bank and can maintain it with other specified financial institutions. As a result, they hold more cash with themselves and with banks, as opposed to balances with the Reserve Bank. Table V.2: Balance Sheet of Urban Co-operative Banks
(At end-March) | | (Amount in ₹ Crore) | | Items | Scheduled UCBs | Non-Scheduled UCBs | All UCBs | Rate of Growth (%) | All UCBs | | 2020 | 2021 | 2020 | 2021 | 2020 | 2021 | 2019-20 | 2020-21 | | 1 | 2 | 3 | 4 | 5 | 6 | 7 | 8 | 9 | | Liabilities | | | | | | | | | | 1) Capital | 4,415 | 4,467 | 9,696 | 9,765 | 14,111 | 14,233 | 3.9 | 0.9 | | | (1.5) | (1.5) | (2.9) | (2.7) | (2.3) | (2.2) | | | | 2) Reserves and Surplus | 14,896 | 15,836 | 18,423 | 21,354 | 33,319 | 37,190 | -10.6 | 11.6 | | | (5.1) | (5.3) | (5.5) | (6.0) | (5.3) | (5.7) | | | | 3) Deposits | 2,29,706 | 2,39,576 | 2,71,124 | 2,87,406 | 5,00,830 | 5,26,982 | 3.4 | 5.2 | | | (78.9) | (79.5) | (81.4) | (80.7) | (80.3) | (80.1) | | | | 4) Borrowings | 5,003 | 3,748 | 334 | 314 | 5,337 | 4,062 | -1.0 | -23.9 | | | (1.7) | (1.2) | (0.1) | (0.1) | (0.9) | (0.6) | | | | 5) Other Liabilities and Provisions | 36,950 | 37,913 | 33,518 | 37,471 | 70,467 | 75,385 | 20.4 | 7.0 | | | (12.7) | (12.6) | (10.1) | (10.5) | (11.3) | (11.5) | | | | Assets | | | | | | | | | | 1) Cash in Hand | 1,797 | 1,676 | 4,037 | 4,212 | 5,835 | 5,888 | 8.3 | 0.9 | | | (0.6) | (0.6) | (1.2) | (1.2) | (0.9) | (0.9) | | | | 2) Balances with RBI | 9,804 | 11,121 | 2,792 | 3,418 | 12,595 | 14,539 | -8.4 | 15.4 | | | (3.4) | (3.7) | (0.8) | (1.0) | (2.0) | (2.2) | | | | 3) Balances with Banks | 18,526 | 21,906 | 47,719 | 47,694 | 66,245 | 69,600 | 8.6 | 5.1 | | | (6.4) | (7.3) | (14.3) | (13.4) | (10.6) | (10.6) | | | | 4) Money at Call and Short Notice | 6,260 | 5,087 | 2,135 | 1,792 | 8,395 | 6,879 | 39.8 | -18.1 | | | (2.2) | (1.7) | (0.6) | (0.5) | (1.3) | (1.0) | | | | 5) Investments | 75,175 | 80,278 | 86,328 | 99,872 | 1,61,504 | 1,80,150 | 3.0 | 11.5 | | | (25.8) | (26.6) | (25.9) | (28.0) | (26.0) | (27.4) | | | | 6) Loans and Advances | 1,41,151 | 1,43,201 | 1,64,138 | 1,69,564 | 3,05,289 | 3,12,765 | 0.7 | 2.4 | | | (48.5) | (47.5) | (49.3) | (47.6) | (48.9) | (47.5) | | | | 7) Other Assets | 38,257 | 38,271 | 25,945 | 29,760 | 64,201 | 68,031 | 20.8 | 6.0 | | | (13.2) | (12.7) | (7.8) | (8.4) | (10.3) | (10.3) | | | | Total Liabilities/ Assets | 2,90,970 | 3,01,540 | 3,33,094 | 3,56,311 | 6,24,064 | 6,57,851 | 4.2 | 5.4 | | | (100.0) | (100.0) | (100.0) | (100.0) | (100.0) | (100.0) | | | Notes: 1. Data for March 2021 are provisional.
2. Figures in parentheses are proportion to total liabilities / assets (in per cent).
3. Components may not add up to the whole due to rounding off.
Source: Off- Site surveillance returns, RBI. |
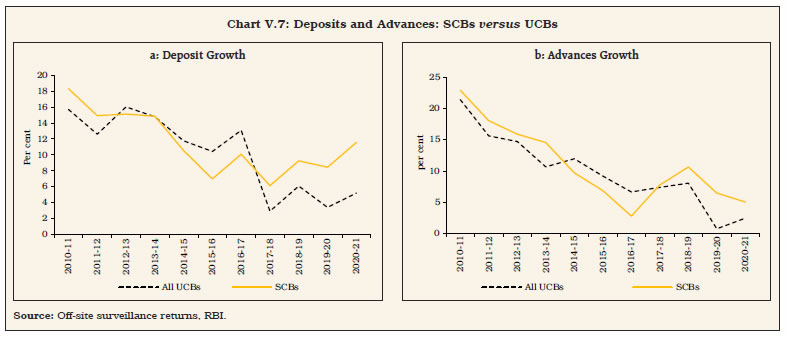 V.13 For more than a decade now, the consolidated balance sheet of UCBs has been decelerating on account of a slowdown in deposits on the liabilities side and loans and advances on the assets side. This trend was, however, reversed during 2020-21, mainly led by NSUCBs. V.14 Until 2016-17, the deposit growth of UCBs was higher than SCBs but the former have been performing progressively worse than the latter in the last four years, partly owing to the entry of new-age banks which provide better returns on deposits (Chart V.7a). V.15 During 2020-21, advances of UCBs picked up marginally even while SCBs’ credit decelerated. The credit contraction experienced by SUCBs during 2019-20 was reversed in the subsequent financial year (Chart V.7b). V.16 The credit-deposit (C-D) ratio has always been significantly lower for UCBs, particularly NSUCBs, than SCBs. This is attributable to relatively lower credit disbursal and higher reliance on deposits. During the last two years, the C-D ratio of SUCBs has declined as credit growth across the board was lower than deposit growth and converged with that of NSUCBs (Chart V.8).
V.17 UCBs’ distribution in terms of asset size has undergone a shift over time, an outcome of the consolidation drive. Since 2015-16, ₹100 crore to ₹250 crore emerged as the modal class, but the distribution has shifted rightward, indicating asset concentration at higher levels (Chart V.9). V.18 The distribution of UCBs in terms of deposits follows the pattern of assets distribution, with ₹100 crore to ₹250 crore as the modal class. Over the years, this distribution has also shifted rightward as a result of an increase in average deposits per customer. In contrast, the advances structure differs, with the modal class being ₹10 crore to ₹25 crore (Table V.3 and Chart V.10). V.19 During 2020-21, credit offtake remained subdued, but deposits accelerated. Co-operative banks – scheduled as well as non-scheduled – increased their investments as an alternative source of income – in fact, investment of NSUCBs grew at 16 per cent, at par with SCBs, led by SLR securities, which more than compensated for the decline in non-SLR investments (Table V.4 and Chart V.11a). Table V.3: Distribution of UCBs by size of Deposits and Advances
(At end-March 2021) | | (Amount in ₹ crore) | | Deposits | No. of UCBs | Amount of Deposits | Advances | No. of UCBs | Amount of Advances | | Number | % Share | Amount | % Share | Number | % Share | Amount | % Share | | 1 | 2 | 3 | 4 | 5 | 6 | 7 | 8 | 9 | 10 | | 0.00 ≤ D < 10 | 105 | 6.8 | 563 | 0.1 | 0.00 ≤ Ad < 10 | 231 | 15.1 | 1,223 | 0.4 | | 10 ≤ D < 25 | 199 | 13.0 | 3,445 | 0.7 | 10 ≤ Ad < 25 | 293 | 19.1 | 4,936 | 1.6 | | 25 ≤ D < 50 | 268 | 17.5 | 9,832 | 1.9 | 25 ≤ Ad < 50 | 289 | 18.8 | 10,176 | 3.3 | | 50 ≤ D < 100 | 282 | 18.4 | 20,132 | 3.8 | 50 ≤ Ad < 100 | 264 | 17.2 | 19,258 | 6.2 | | 100 ≤ D < 250 | 318 | 20.7 | 50,166 | 9.5 | 100 ≤ Ad < 250 | 235 | 15.3 | 37,791 | 12.1 | | 250 ≤ D < 500 | 167 | 10.9 | 57,526 | 10.9 | 250 ≤ Ad < 500 | 110 | 7.2 | 38,472 | 12.3 | | 500 ≤ D < 1000 | 102 | 6.6 | 70,299 | 13.3 | 500 ≤ Ad < 1000 | 62 | 4.0 | 42,783 | 13.7 | | 1000 ≤ D | 93 | 6.1 | 3,15,018 | 59.8 | 1000 ≤ Ad | 50 | 3.3 | 1,58,125 | 50.6 | | Total | 1,534 | 100.0 | 5,26,982 | 100.0 | Total | 1,534 | 100 | 3,12,765 | 100.0 | Notes: 1. Data are provisional.
2. ‘D’ and ‘Ad’ indicates amount of deposits and advances respectively.
3. Components may not add up to the whole due to rounding off.
Source: Off- Site surveillance returns, RBI. |
| Table V.4: Investments by Urban Co-operative Banks | | (Amount in ₹ Crore) | | Item | Amount outstanding (At end-March) | Variation (%) | | 2019 | 2020 | 2021 | 2019-20 | 2020-21 | | 1 | 2 | 3 | 4 | 5 | 6 | | Total Investments (A + B) | 1,56,799 | 1,61,504 | 1,80,150 | 3.0 | 11.6 | | | (100.0) | (100.0) | (100.0) | | | | A. SLR Investments (i to iii) | 1,39,447 | 1,41,901 | 1,60,560 | 1.8 | 13.1 | | | (88.9) | (87.9) | (89.1) | | | | (i) Central Govt. Securities | 98,174 | 96,289 | 1,02,147 | -1.9 | 6.1 | | | (62.6) | (59.6) | (56.7) | | | | (ii) State Govt. Securities | 40,596 | 44,418 | 57,944 | 9.4 | 30.4 | | | (25.9) | (27.5) | (32.2) | | | | (iii) Other approved Securities | 678 | 1,194 | 470 | 76.2 | -60.6 | | | (0.4) | (0.7) | (0.3) | | | | B. Non-SLR Investments | 17,351 | 19,603 | 19,590 | 13.0 | -0.1 | | | (11.1) | (12.1) | (10.87) | | | Note: 1. Data for 2021 are provisional.
2. Figures in parentheses are proportion to total investments (in per cent).
Source: Off-site surveillance returns, RBI. | V.20 At end-March 2021, 89 per cent of total investments of UCBs were in SLR instruments, more than half of which was in central government securities (Chart V.11b). For the last couple of years, low credit demand and the search for returns have prompted investment in state government securities. As a result, the proportion of central government securities in UCBs’ investments declined from 73 per cent at end-March 2016 to 57 per cent at end-March 2021. 3.2 Soundness V.21 Concerns over the financial soundness of UCBs have risen in recent years. An increasing number of UCBs are being placed under the Supervisory Action Framework (SAF) by the Reserve Bank7. Furthermore, instances of penalty imposition increased to 43 during 2020- 21, up from 9 in the previous year (Refer to Table IV.14). Additionally, claims settled by the Deposit Insurance and Credit Guarantee Corporation (DICGC) during the year pertained entirely to co-operative banks. V.22 The CAMELS-based rating system8, which assesses the financial strength of a UCB, was reviewed in 2019. The revised model gives a composite rating of A/B+/B/C/D (in decreasing order of performance) to UCBs, based on the weighted average rating of the individual components of CAMELS. At end-March 2021, ‘B’ category formed the modal class, both number-wise and business-wise, with more than 50 per cent UCBs falling under this rating category (Table V.5). Table V.5: Rating-wise Distribution of UCBs
(End-March 2021) | | (Amount in ₹ crore) | | Ratings | Number | Deposits | Advances | | Banks | % share in Total | Amount | % share in Total | Amount | % share in Total | | 1 | 2 | 3 | 4 | 5 | 6 | 7 | | A | 131 | 8.5 | 36,120 | 6.9 | 21,611 | 6.9 | | B+ | 201 | 13.1 | 82,390 | 15.6 | 48,598 | 15.5 | | B | 792 | 51.6 | 2,74,145 | 52 | 1,66,349 | 53.2 | | C | 324 | 21.1 | 1,10,269 | 20.9 | 64,274 | 20.6 | | D | 86 | 5.6 | 24,058 | 4.6 | 11,933 | 3.8 | | Total | 1,534 | 100 | 5,26,982 | 100 | 3,12,765 | 100 | Notes: 1. Data are provisional.
2. Components may not add up to the whole due to rounding off.
3. Ratings are based on latest available inspection data.
4. Percentage variation could be slightly different because absolute numbers have been rounded off to ₹ crore.
Source: Off-site surveillance returns, RBI. | V.23 Even though the scale of the new rating system is not strictly comparable with the old scale, there has been a marked deterioration in UCBs’ ratings over time. The proportion of UCBs with ‘A’ rating has declined, with a creeping increase in the ‘C’ and ‘D’ rated ones, the latter now comprising of more than 25 per cent of the total number of UCBs. Banking business, calculated as the sum of deposits and advances of UCBs, has followed the distribution of the number of UCBs, and has steadily come down for the ‘A’ rated entities (Chart V.12). 3.3 Capital Adequacy V.24 UCBs are governed by Basel I norms under which they are required to maintain a minimum capital-to-risk weighted assets ratio (CRAR) of 9 per cent. The capital position of SUCBs has been improving since 2009-10, with the number of banks breaching the regulatory minimum declining over the years. In the case of NSUCBs, however, the proportion of banks with CRAR below 9 per cent has increased since 2016- 17, pointing to vulnerabilities in their financial position (Chart V.13).
V.25 On the other end of the spectrum, more than 80 per cent of UCBs in each category maintained strong capital buffers with CRARs higher than 12 per cent (Table V.6 and Appendix Table V.1). Table V.6: CRAR-wise Distribution of UCBs
(End-March 2021) | | (Number of banks) | | CRAR (in Per cent) | Scheduled UCBs | Non-Scheduled UCBs | All UCBs | | 1 | 2 | 3 | 4 | | CRAR < 3 | 4 | 57 | 61 | | 3 <= CRAR < 6 | 0 | 11 | 11 | | 6 <= CRAR < 9 | 0 | 24 | 24 | | 9 <= CRAR < 12 | 4 | 160 | 164 | | 12 <= CRAR | 45 | 1,229 | 1,274 | | Total | 53 | 1,481 | 1,534 | Note: Data are provisional.
Source: Off-site surveillance returns, RBI. | V.26 At end-March 2021, the CRAR of UCBs recorded an improvement over a year ago. NSUCBs, which have better capital positions than SUCBs, reported a further improvement, mostly due to a reduction in their risk-weighted assets (RWAs). Even though other capital requirements mandatory for SCBs such as capital conservation buffer and minimum common equity tier 1 (CET-I) capital are not applicable to UCBs, they maintained adequate levels of tier-1 capital, albeit lower than SCBs, abstracting from the drag from one defaulting UCB (Table V.7). Table V.7: Component-wise Capital Adequacy of UCBs
(At end-March) | | (Amount in ₹ crore) | | | Scheduled UCBs | Non-Scheduled UCBs | All UCBs | | 2020 | 2021 | 2020 | 2021 | 2020 | 2021 | | 1 Capital Funds | 13,407 | 13,794 | 25,408 | 27,610 | 38,815 | 41,404 | | i) Tier I Capital | 7,521 | 8,000 | 22,009 | 24,011 | 29,530 | 32,011 | | ii) Tier II Capital | 5,886 | 5,794 | 3,399 | 3,600 | 9,285 | 9,393 | | 2 Risk-Weighted Assets | 1,42,573 | 1,45,767 | 1,75,015 | 1,68,622 | 3,17,588 | 3,14,388 | | 3 CRAR (1 as % of 2) | 9.4 | 9.5 | 14.5 | 16.4 | 12.2 | 13.2 | | Of which: | | | | | | | | Tier I | 5.3 | 5.5 | 12.6 | 14.2 | 9.3 | 10.2 | | Tier II | 4.1 | 4.0 | 2.0 | 2.1 | 2.9 | 3.0 | | Source: Off-site returns, RBI. | 3.4 Asset Quality V.27 During 2015-16 to 2018-19, SCBs had higher delinquency rates than UCBs. The position reversed during the last two years as SCBs’ gross non-performing assets (GNPA) ratio fell, while for UCBs, it has been on a rising trajectory right up to 2020-21. Within the sector, both SUCBs and NSUCBs faced increasing GNPA ratios, with the latter experiencing sharply higher slippages (Chart V.14). V.28 In January 2020, the SAF for UCBs was revised, making a net NPA ratio greater than 6 per cent a trigger for initiation of corrective action. With rising slippage, this has prompted an increase in provisioning (Table V.8). V.29 Large borrowal accounts i.e., exposure of ₹5 crore and above, exhibit varied behaviour between SCBs and UCBs, as well as among SUCBs and NSUCBs. During 2020-21, 25 per cent of UCBs’ total funded loans and 32 per cent of their NPAs originated from large borrowal accounts as against 51 per cent of loans and 66 per cent of NPAs, respectively, for SCBs. Within UCBs, NSUCBs’ exposure to large borrowers was less than 10 per cent of their total loans during the year as against 44 per cent share of SUCBs. 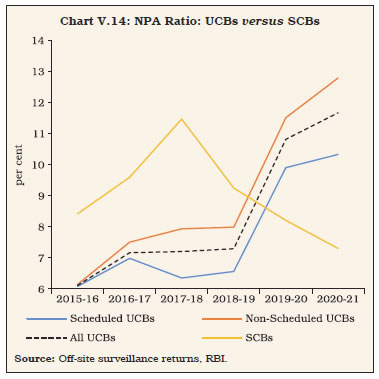 V.30 NPAs emanating from large borrowers have been proportionally higher than lending to such borrowers for all bank groups (Chart V.15). There has, however, been a noticeable reduction in both lending and NPAs in comparison to 2019- 20. This may be attributable to the January 2020 regulation which curtailed large exposures of UCBs, while encouraging small-scale lending. The latter criterion requires that at least 50 per cent of UCBs’ aggregate loans and advances or 0.2 per cent of their tier-I capital, whichever is higher, should be geared towards loan sizes of less than ₹25 lakh9. Table V.8: Non-Performing Assets of UCBs
(At end-March) | | | | Sr. No. | Items | Scheduled UCBs | Non-Scheduled UCBs | All UCBs | | 2019-20 | 2020-21 | 2019-20 | 2020-21 | 2019-20 | 2020-21 | | 1 | 2 | 3 | 4 | 5 | 6 | 7 | 8 | | 1 | Gross NPAs (₹ crore) | 13,779 | 14,785 | 18,443 | 21,674 | 32,222 | 36,459 | | 2 | Gross NPA Ratio (%) | 9.8 | 10.3 | 11.3 | 12.8 | 10.6 | 11.7 | | 3 | Net NPAs (₹ crore) | 5,051 | 5,264 | 8,167 | 7,981 | 13,217 | 13,245 | | 4 | Net NPA Ratio (%) | 3.8 | 3.9 | 5.3 | 5.1 | 4.6 | 4.6 | | 5 | Provisioning (₹ crore) | 8,728 | 9,521 | 10,276 | 13,693 | 19,004 | 23,214 | | 6 | Provisioning Coverage Ratio (%) | 63.4 | 64.4 | 55.7 | 63.2 | 59.0 | 63.7 | Note: Data for 2020-21 are provisional.
Source: Off- site surveillance returns, RBI. |
V.31 All categories of special mention account ratios viz., SMA-0, SMA-1 and SMA-210 as well as NPA ratio of large borrowal accounts are higher for UCBs than for SCBs. During 2020-21, the SMA-0 and SMA-2 ratios deteriorated, signifying stress building up incipiently in the sector (Chart V.16a). This was reflected across both categories of UCBs (Chart V.16b). 3.5 Financial Performance and Profitability V.32 After registering sizeable losses in 2019- 20 – mainly contributed by a large SUCB – the financial performance of UCBs improved in 2020-21 but they are yet to break back into profit levels achieved in 2018-19. With lower borrowings, SUCBs’ interest expenditure contracted, leading to a fall in overall expenditure. Interest income, which had been declining for two consecutive years, picked up during 2020-21, driven by an increase in investments. Coupled with growth in non-interest income, there was acceleration in the total income of UCBs. The uncharacteristically high growth in provisions and contingencies of SUCBs in 2019-20, which led to net losses for the consolidated sector, was reversed, causing an increase in net profits during the year (Table V.9 and Appendix Table V.2). 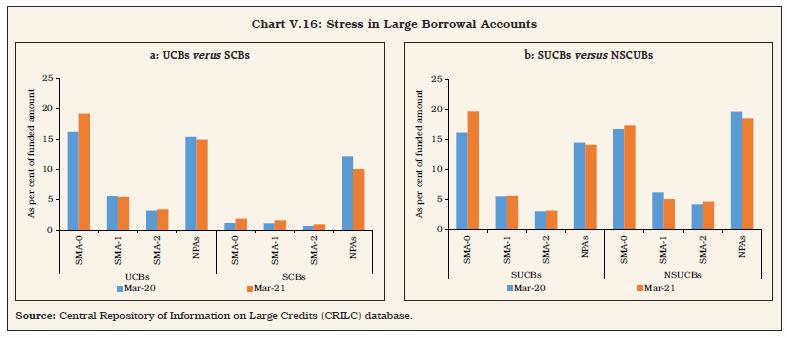
| Table V.9: Financial Performance of Scheduled and Non-scheduled Urban Co-operative Banks | | (Amount in ₹ crore) | | Item | Scheduled UCBs | Non-scheduled UCBs | All UCBs | All UCBs Variation (%) | | 2019-20 | 2020-21 | 2019-20 | 2020-21 | 2019-20 | 2020-21 | 2020-21 | | 1 | 2 | 3 | 4 | 5 | 6 | 7 | 8 | | A. Total Income [i+ii] | 20,307 | 23,430 | 29,777 | 30,348 | 50,084 | 53,778 | 7.4 | | | (100.0) | (100.0) | (100.0) | (100.0) | (100.0) | (100.0) | | | i. Interest Income | 16,920 | 19,524 | 27,811 | 27,887 | 44,731 | 47,411 | 6.0 | | | (83.3) | (83.3) | (93.4) | (91.9) | (89.3) | (88.2) | | | ii. Non-interest Income | 3,387 | 3,905 | 1,966 | 2,462 | 5,353 | 6,367 | 19.0 | | | (16.7) | (16.7) | (6.6) | (8.1) | (10.7) | (11.8) | | | B. Total Expenditure [i+ii] | 20,877 | 19,764 | 25,780 | 25,865 | 46,657 | 45,630 | -2.2 | | | (100.0) | (100.0) | (100.0) | (100.0) | (100.0) | (100.0) | | | i. Interest Expenditure | 14,659 | 13,501 | 18,518 | 18,653 | 33,177 | 32,154 | -3.1 | | | (70.2) | (68.3) | (71.8) | (72.1) | (71.1) | (70.5) | | | ii. Non-interest Expenditure | 6,217 | 6,263 | 7,262 | 7,212 | 13,480 | 13,476 | -0.03 | | | (29.8) | (31.7) | (28.2) | (27.9) | (28.9) | (29.5) | | | of which: Staff Expenses | 2,833 | 2,731 | 3,895 | 3,892 | 6,728 | 6,622 | -1.6 | | C. Profits | | | | | | | | | i. Amount of Operating Profits | -569 | 3,665 | 3,986 | 4,483 | 3,417 | 8,148 | 138.5 | | ii. Provision, Contingencies | 4,722 | 2,007 | 2,977 | 2,073 | 7,699 | 4,080 | -47.0 | | iii. Provision for taxes | 356 | 603 | 927 | 717 | 1,283 | 1,320 | 2.9 | | iv. Amount of Net Profit before Taxes | -5,292 | 1,659 | 1,009 | 2,410 | -4,282 | 4,069 | 195.0 | | v. Amount of Net Profit after Taxes | -5,648 | 1,056 | 82 | 1,693 | -5,566 | 2,749 | 149.4 | Notes: 1. Data for 2020-21 are provisional.
2. Components may not add up to the total due to rounding off.
3. Percentage variation could be slightly different because absolute numbers have been rounded off to ₹ crore.
4. Figures in parentheses are proportion to total income/expenditure (in per cent).
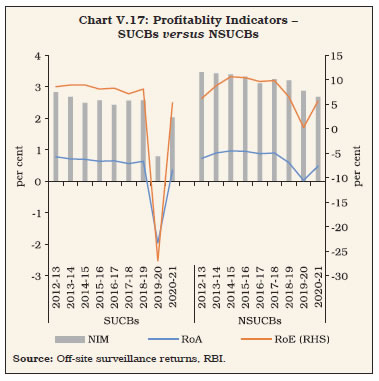
Source: Off-site surveillance returns, RBI. | V.33 Interest income constitutes 88 per cent of the total income of UCBs, while interest expenditure makes up 70 per cent of their total expenditure. The composition of total income is different for the two cohorts – NSUCBs are more dependent on interest income in comparison to SUCBs, whereas expenditure composition is relatively similar for both groups. V.34 All indicators of profitability were in the green in 2020-21. NSUCBs are more profitable than SUCBs. The return on assets (RoA) and return on equity (RoE), which turned negative for SUCBs in 2019-20, moved into positive territory during 2020-21. Net interest margin (NIM) recovered from a trough a year ago (Table V.10 and Chart V.17). 3.6 Priority Sector Advances V.35 Priority sector lending guidelines for UCBs were revised in March 2020. They are required to progressively increase their priority loan portfolio to 75 per cent of their adjusted net bank credit (ANBC) or credit equivalent amount of off-balance sheet exposures (CEOBE), whichever is higher, by end-March 202411. UCBs have historically lent higher than the prescribed targets to the priority sector (Chart V.18). | Table V.10: Select Profitability Indicators of UCBs | | (Per cent) | | Indicators | Scheduled UCBs | Non-Scheduled UCBs | All UCBs | | 2019-20 | 2020-21 | 2019-20 | 2020-21 | 2019-20 | 2020-21 | | 1 | 2 | 3 | 4 | 5 | 6 | 7 | | Return on Assets | -1.96 | 0.36 | 0.03 | 0.49 | -0.91 | 0.43 | | Return on Equity | -26.95 | 5.33 | 0.29 | 5.71 | -11.32 | 5.56 | | Net Interest Margin | 0.79 | 2.03 | 2.87 | 2.68 | 1.89 | 2.38 | Note: Data for 2020-21 are provisional.
Source: Off-site surveillance returns, RBI. |
 V.36 Consequent upon the new norms, a target of 45 per cent of the higher of ANBC or CEOBE was set for priority sector lending during 2020- 21, up by 5 percentage points above the target a year ago. UCBs managed to meet the priority sector target comfortably. Although UCBs adhered to the sub-target of lending 10 per cent of advances to weaker sections, the share of such loans declined in 2020-21. The composition of UCBs’ credit to the priority sector shows that advances to micro, small and medium enterprises (MSMEs) constituted 63 per cent of total priority sector lending, followed by housing at 16 per cent (Table V.11). Table V.11: Composition of Credit to Priority Sectors by UCBs
(At end-March) | | (Amount in ₹ Crore) | | Item | 2020 | 2021 | | Amount | Share in Total Advances (%) | Amount | Share in Total Advances (%) | | 1. Agriculture [(i)+(ii)+(iii)] | 11,716 | 3.8 | 12,245 | 3.9 | | (i) Farm Credit | 8,682 | 2.8 | 8,913 | 2.8 | | (ii) Agriculture Infrastructure | 500 | 0.2 | 676 | 0.2 | | (iii) Ancillary Activities | 2,534 | 0.8 | 2,701 | 0.9 | | 2. Micro and Small Enterprises [(i) + (ii) +(iii) + (iv)] | 95,102 | 31.1 | 1,01,340 | 32.4 | | (i) Micro Enterprises | 31,497 | 10.3 | 34,301 | 11.0 | | (ii) Small Enterprises | 49,569 | 16.2 | 46,128 | 14.8 | | (iii) Medium Enterprises | 13,648 | 4.5 | 20,547 | 6.6 | | (iv) Advances to Khadi and Village Industries (Including ‘Other Finance to MSMEs’) | 387 | 0.1 | 365 | 0.1 | | 3. Export Credit | 378 | 0.1 | 368 | 0.1 | | 4. Education | 2,434 | 0.8 | 2,374 | 0.8 | | 5. Housing | 25,359 | 8.3 | 25,211 | 8.1 | | 6. Social Infrastructure | 923 | 0.3 | 1,185 | 0.4 | | 7. Renewable Energy | 1,476 | 0.5 | 1,291 | 0.4 | | 8. ‘Others’ category under Priority Sector | 16,496 | 5.4 | 17,694 | 5.7 | | 9. Total (1 to 8) | 1,53,886 | 50.4 | 1,61,708 | 51.7 | | of which, Loans to Weaker Sections under Priority Sector | 35,764 | 11.7 | 33,590 | 10.7 | Notes: 1. Data for 2021 are provisional.
2. Percentage shares are with respect to the total credit of UCBs.
3. Components may not add up to total due to rounding off.
Source: Off-site surveillance returns, RBI. | 4. Rural Co-operatives V.37 Rural co-operatives, which comprised around 67 per cent of the assets of all co-operatives at end-March 2020, are distinguished from their urban peers in terms of their area of operations, reach, performance as well as composition of liabilities. While a broad depositor base enables UCBs to raise funds at relatively low cost, rural co-operatives are heavily dependent on borrowings for their operations – at end-March 2020, borrowings constituted around 1 per cent of UCBs’ liabilities, but were as high as 27 per cent for rural co-operatives. V.38 Amongst the rural co-operatives, short-term institutions—comprising State Co-operative Banks (StCBs), District Central Co-operative Banks (DCCBs) and Primary Agricultural Credit Societies (PACS) — were established to provide short-term crop loans and working capital loans to farmers and rural artisans. On the other hand, the mandate of long-term co-operatives— SCARDBs and PCARDBs—is to provide funding for investment in agriculture, including land development, farm mechanisation and minor irrigation, rural industries and housing. For more than a decade now, the share of long-term credit co-operatives in total assets is falling to reach just over 5 per cent by end-March 2020, largely in line with the shrinking share of agriculture investment in total investments (Chart V.19a). Concomitantly, their financial performance has also deteriorated: at end-March 2020, their shares in total NPAs and net losses of rural co-operatives were higher than that in total assets (Chart V.19 b and Table V.12). 4.1 Short-term Rural Co-operatives V.39 Initially formed to provide short-term crop loans, short-term rural co-operatives have been diversifying their operations to cover the non-farm sector, term lending to allied sectors, and personal and housing loans, among others. Currently, 20 states have a three-tier structure, with StCBs at the state level, DCCBs at the district level and PACS functioning at the village level. Among them, Jharkhand and Kerala12 have only one DCCB while the rest were amalgamated with the respective StCBs. In 9 states and 5 union territories, they are arranged in a two-tier structure, consisting of only StCBs and PACS. 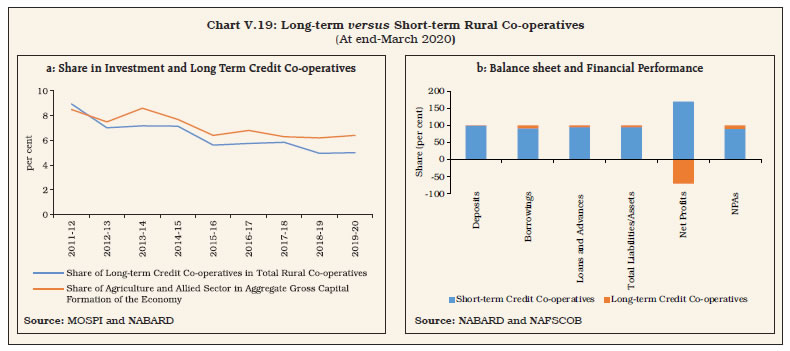
Table V.12: A Profile of Rural Co-operatives
(At end-March 2020) | | (Amount in ₹ Crore) | | Item | Short-term | Long-term | | StCBs | DCCBs | PACS | SCARDBs (P) | PCARDBs (P) | | 1 | 2 | 3 | 4 | 5 | 6 | | A. Number of Cooperatives | 33* | 351** | 95,509 | 13 | 602 | | B. Balance Sheet Indicators | | | | | | | i. Owned Funds (Capital + Reserves) | 21,900 | 43,246 | 43,741 | 4,859 | 3,673 | | ii. Deposits | 2,10,342 | 3,45,682 | 1,65,476 | 2,409 | 1,372 | | iii. Borrowings | 85,723 | 97,448 | 1,38,571 | 13,710 | 16,643 | | iv. Loans and Advances | 1,99,943 | 2,79,272 | 2,14,533 | 20,700 | 15,819 | | v. Total Liabilities/Assets | 3,40,267 | 5,35,977 | 3,25,322 | 27,104 | 31,337 | | C. Financial Performance | | | | | | | i. Institutions in Profits | | | | | | | a. No. | 32 | 291 | 47,027 | 10 | 227 | | b. Amount of Profit | 1,740 | 1,887 | 6,531 | 287 | 86 | | ii. Institutions in Loss | | | | | | | a. No. | 1 | 60 | 37,369 | 3 | 375 | | b. Amount of Loss | 16 | 1,041 | 8,325 | 35 | 657 | | iii. Overall Profits (+)/Loss (-) | 1,724 | 846 | -1,794 | 252 | -571 | | D. Non-performing Assets | | | | | | | i. Amount | 13,477 | 35,298 | 70,160 | 6,836 | 6,815 | | ii. As percentage of Loans Outstanding | 6.7 | 12.6 | 31.0 | 33.0 | 43.1 | | E. Recovery of Loans to Demand Ratio***(Per cent) | 94.4 | 70.2 | 69.3 | 43.1 | 44.1 | Notes: 1. StCBs: State Co-operative Banks; DCCBs: District Central Co-operative Banks; PACS: Primary Agricultural Credit Societies; SCARDBs: State Co-operative Agriculture and Rural Development Banks; PCARDBs: Primary Co-operative Agriculture and Rural Development Banks
2. (P)- Data are provisional.
3. *Data of Daman & Diu StCB (which is yet to be bifurcated completely from Goa StCB) is reported as a part of Goa StCB.
4. **: Excluding Tamil Nadu Industrial Co-operative Bank Limited (TAICO)
5. ***: Denotes the share of outstanding NPAs that have been recovered and on June 30, 2019.
Source: NAFSCOB and NABARD. | V.40 Among short-term rural co-operatives, StCBs are relatively better performers, with a proportionally higher share in net profits and a lower share in NPAs. PACS, on the other hand, are heavily reliant on borrowings, incur larger net losses, and comprise a larger share in NPAs of the rural co-operative sector (Chart V.20a). V.41 In terms of regional presence, StCBs’ branches are concentrated in the southern states. The western region claims the highest share of DCCBs’ branches and PACS. The latter also have a substantial presence in the eastern region, while DCCBs have no presence in the north-eastern states (Chart V.20b). 4.1.1 State Co-operative Banks V.42 State co-operative banks (StCBs) are the apex institutions in the rural co-operative structure and as such they are responsible for providing liquidity and technical assistance to the other two tiers. At end-March 2020, they operated with 2,072 branches across the country, providing credit for a range of agricultural as well as non-agricultural purposes, including loans to MSMEs, housing and education which together comprise more than half of their total lending activities. Balance Sheet Operations V.43 StCBs’ balance sheet grew by over 7 per cent for the second consecutive year in 2019- 20, mainly fuelled by healthy deposit growth. The amalgamation of 13 Kerala DCCBs with the Kerala State Co-operative Bank Ltd. did not alter the broad composition of assets and liabilities of the consolidated balance sheet of the latter. The financial side, however, deteriorated due to accumulated losses of the former (Table V.13). V.44 During 2020-21, StCBs’ credit growth remained subdued, but they performed better than both SCBs and UCBs (Table V.14). Profitability V.45 Both income and expenditure of StCBs declined in 2019-20. The larger decline in expenditure led to an increase in net profits. While interest income declined, non-interest income more than doubled, mainly due to the reversal of reserves and excess provisions, and deferred tax income in the Maharashtra StCB. This was complemented by profit booking on investments and gains in commission exchange and brokerage services by many StCBs during the year. On the expenditure side, a reduced wage bill, accompanied by declining interest expenditure, was offset by sizeable growth in provision and contingencies, causing a diminution in total expenditure (Table V.15). | Table V.13: Liabilities and Assets of State Co-operative Banks | | (Amount in ₹ Crore) | | Item | At end-March | Variation (%) | | 2019 | 2020 | 2018-19 | 2019-20 | | 1 | 2 | 3 | 4 | 5 | | Liabilities | | | | | | 1. Capital | 7,429 | 7,459 | 8.8 | 0.4 | | | (2.3) | (2.1) | | | | 2. Reserves | 13,797 | 14,441 | 10.6 | 4.7 | | | (4.3) | (4.2) | | | | 3. Deposits | 1,92,693 | 2,10,342 | 6.3 | 9.2 | | | (60.7) | (61.8) | | | | 4. Borrowings | 84,074 | 85,723 | 10.2 | 2.0 | | | (26.5) | (25.1) | | | | 5. Other Liabilities | 19,081 | 22,301 | 6.7 | 16.9 | | | (6) | (6.5) | | | | Assets | | | | | | 1. Cash and Bank Balances | 15,168 | 10,229 | 12.4 | -32.6 | | | (4.7) | (3) | | | | 2. Investments | 1,03,131 | 1,12,828 | 0.3 | 9.4 | | | (32.5) | (33.1) | | | | 3. Loans and Advances | 1,83,633 | 1,99,943 | 11.6 | 8.9 | | | (57.9) | (58.7) | | | | 4. Accumulated Losses | 986 | 1,232 | -3.5 | 25.0 | | | (0.3) | (0.3) | | | | 5. Other Assets | 14,156 | 16,035 | 9.3 | 13.3 | | | (4.4) | (4.7) | | | | Total Liabilities/Assets | 3,17,074 | 3,40,267 | 7.6 | 7.3 | | | (100.00) | (100.00) | | | Notes: 1. Figures in parentheses are proportion to total liabilities/assets (in per cent).
2. Y-o-Y variations could be slightly different because absolute numbers have been rounded off to ₹1 Crore.
3. Components may not add up to the total due to rounding off.
4. During 2019-20, 13 DCCBs (except Mallapuram DCCB) in Kerala were amalgamated with Kerala StCB. The data of 13 DCCBs have been added to the StCB totals for previous years to facilitate comparison and compute growth rates.
Source: NABARD. |
| Table V.14: Select Balance Sheet Indicators of Scheduled State Co-operative Banks | | (Amount in ₹ crore) | | Item | 2015-16 | 2016-17 | 2017-18 | 2018-19 | 2019-20* | 2020-21 | | 1 | 2 | 3 | 4 | 5 | 6 | 7 | | Deposits | 79,564 | 90,277 | 98,768 | 1,10,559 | 1,87,456 | 1,97,751 | | | (3.0) | (13.5) | (9.4) | (11.9) | (69.6) | (5.5) | | Credit | 1,07,360 | 1,10,934 | 1,17,989 | 1,31,399 | 1,94,310 | 2,06,322 | | | (3.4) | (3.3) | (6.4) | (11.4) | (47.9) | (6.2) | | SLR Investments | 24,220 | 26,225 | 33,411 | 33,130 | 54,181 | 67,788 | | | (4.0) | (8.3) | (27.4) | (-0.8) | (63.5) | (25.1) | | Credit plus SLR Investments | 1,31,580 | 1,37,159 | 1,51,400 | 1,64,529 | 2,48,492 | 2,74,110 | | | (3.5) | (4.2) | (10.4) | (8.7) | (51.0) | (10.3) | Notes: 1. Data pertains to last reporting Friday of March of the corresponding year.
2. Figures in brackets are growth rates in per cent over previous year.
3. *: The high growth is mainly due to amalgamation of 13 District Central Co-operative Banks with Kerala State Co-operative Bank.
Source: Form B under Section 42 of RBI Act. | V.46 StCBs have stronger presence in the southern region, which also accounts for higher profit than other regions. In growth terms, earnings in the eastern and central states surpassed other regions, culminating in a 41.3 per cent increase in all-India profits (Chart V.21). Asset Quality V.47 StCBs’ asset quality deteriorated in 2019- 20, led by a substantial growth in sub-standard assets (Table V.16). Out of 33 StCBs, 17 reported acceleration in fresh slippages during the year. | Table V.15: Financial Performance of State Co-operative Banks | | (Amount in ₹ Crore) | | Item | As during | Percentage Variation | | 2018-19 | 2019-20 | 2018-19 | 2019-20 | | 1 | 2 | 3 | 4 | 5 | | A. Income (i+ii) | 22,283 | 21,922 | 6.5 | -1.6 | | | (100.0) | (100.0) | | | | i. Interest Income | 21,383 | 20,014 | 6.7 | -6.4 | | | (95.9) | (91.2) | | | | ii. Other Income | 901 | 1,908 | 1.0 | 111.9 | | | (4.0) | (8.7) | | | | B. Expenditure (i+ii+iii) | 21,063 | 20,198 | 4.6 | -4.1 | | | (100.0) | (100.0) | | | | i. Interest Expended | 16,276 | 14,871 | 2.0 | -8.6 | | | (77.2) | (73.6) | | | | ii. Provisions and Contingencies | 1,579 | 2,646 | 6.3 | 67.6 | | | (7.4) | (13) | | | | iii. Operating Expenses | 3,209 | 2,681 | 18.6 | -16.4 | | | (15.2) | (13.2) | | | | Of which, Wage Bill | 1,740 | 1,491 | 5.7 | -14.3 | | | (8.2) | (7.3) | | | | C. Profits | | | | | | i. Operating Profits | 2,360 | 2,974 | 21.4 | 26.0 | | ii. Net Profits | 1,220 | 1,724 | 55.3 | 41.3 | Notes: 1. Figures in parentheses are proportion to total income/ expenditure (in per cent).
2. Y-o-Y variations could be slightly different because absolute numbers have been rounded off to ₹1 Crore in the table.
3. Components may not add up to the total due to rounding off.
4. During 2019-20, 13 DCCBs (except Mallapuram DCCB) in Kerala were amalgamated with Kerala StCB. The data of 13 DCCBs have been added to the StCB totals for previous years to Facilitate comparison and compute growth rates.
Source: NABARD. | 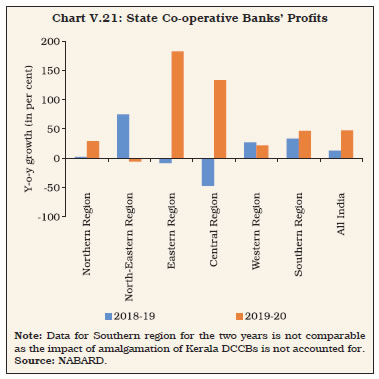 V.48 On asset quality, StCBs in Arunachal Pradesh, Jharkhand, Andaman and Nicobar Islands, Manipur and Puducherry have high NPA ratios (Appendix Table V.3). | Table V.16: Soundness Indicators of State Co-operative Banks | | (Amount in ₹ crore) | | Item | At end-March | Percentage Variation | | 2019 | 2020 | 2018-19 | 2019-20 | | 1 | 2 | 3 | 4 | 5 | | A. Total NPAs (i+ii+iii) | 9,968 | 13,477 | 5.2 | 35.2 | | i. Sub-standard | 4,712 | 7,883 | 9.6 | 67.3 | | | (47.2) | (58.4) | | | | ii. Doubtful | 4,011 | 4,400 | 9.2 | 9.7 | | | (40.2) | (32.6) | | | | iii. Loss | 1,245 | 1,195 | -17.2 | -4.1 | | | (12.4) | (8.8) | | | | B. NPAs to Loans Ratio (%) | 5.4 | 6.7 | - | - | | C. Recovery to Demand Ratio (%) | 93.9 | 94.4 | - | - | Notes: 1. Figures in parentheses are shares in total NPA (%).
2. Absolute numbers have been rounded off, leading to slight variations in per cent.
3. Components may not add-up to the total due to rounding off.
4. During 2019-20, 13 DCCBs (except Mallapuram DCCB) in Kerala were amalgamated With Kerala StCB. The data of 13 DCCBs have been added to the StCB totals for previous years to facilitate comparison and compute growth rates.
5. Recovery Position as on 30th June of the corresponding FY
Source: NABARD. | 4.1.2 District Central Co-operative Banks V.49 District central co-operative banks (DCCBs) are the intermediate tier in the short-term rural co-operative structure, mobilising funds through public deposits, borrowing from StCBs and refinance from NABARD. DCCBs lend to individual borrowers as well as to PACS. In practice, however, they are less dependent on borrowings in comparison to StCBs, as they can leverage their extensive branch network to garner deposits. This also translates to lower C-D ratios than StCBs, although the outstanding credit of DCCBs is larger (Chart V.22). V.50 During the year, 13 DCCBs in Kerala were amalgamated with the Kerala State Co-operative Bank Ltd. and a DCCB in Bihar, viz., Supaul DCCB was granted banking license, taking their total to 351 at end-March 2020, with a network of 13,589 branches. Balance Sheet Operations V.51 The consolidated balance sheet of DCCBs decelerated to 6.9 per cent in 2019-20, led by slowdown in deposit growth on the liabilities side and loans and advances on the assets side. The contraction in cash and bank balances—due to lower CRR requirements13—was matched by an acceleration in investments (Table V.17). 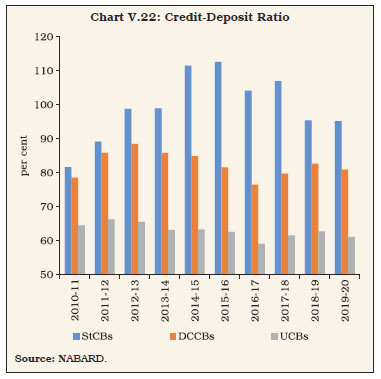
| Table V.17: Liabilities and Assets of District Central Co-operative Banks | | (Amount in ₹ Crore) | | Item | At end-March | Percentage Variation | | 2019 | 2020 | 2018-19 | 2019-20 | | 1 | 2 | 3 | 4 | 5 | | Liabilities | | | | | | 1. Capital | 20,122 | 20,913 | 9.3 | 3.9 | | | (4) | (3.9) | | | | 2. Reserves | 20,780 | 22,332 | 5.5 | 7.5 | | | (4.1) | (4.1) | | | | 3. Deposits | 3,20,947 | 3,45,682 | 10.6 | 7.7 | | | (63.9) | (64.4) | | | | 4. Borrowings | 92,962 | 97,448 | 7.9 | 4.8 | | | (18.5) | (18.1) | | | | 5. Other Liabilities | 46,762 | 49,602 | 9.4 | 6.1 | | | (9.3) | (9.2) | | | | Assets | | | | | | 1. Cash and Bank Balances | 25,637 | 23,409 | 11.3 | -8.7 | | | (5.1) | (4.3) | | | | 2. Investments | 1,69,554 | 1,86,745 | 8.4 | 10.1 | | | (33.8) | (34.8) | | | | 3. Loans and Advances | 2,65,026 | 2,79,272 | 8.4 | 5.4 | | | (52.8) | (52.1) | | | | 4. Accumulated Losses | 6,139 | 6,721 | 15.6 | 9.5 | | | (1.2) | (1.2) | | | | 5. Other Assets | 35,217 | 39,830 | 26.2 | 13.1 | | | (7) | (7.4) | | | | Total Liabilities/Assets | 5,01,573 | 5,35,977 | 9.7 | 6.9 | | | (100.00) | (100.00) | | | Notes: 1. Figures in parentheses are proportion to total liabilities/assets (in per cent).
2. Y-o-Y variations could be slightly different because absolute numbers have been rounded off to ₹1 Crore in the table.
3. Components may not add up to the total due to rounding off.
4. During 2019-20, 13 DCCBs (except Mallapuram DCCB) in Kerala were amalgamated with Kerala StCB. The data of 13 DCCBs have been deducted from the DCCB totals for previous years to facilitate comparison and compute growth rates.
Source: NABARD. | Profitability V.52 DCCBs have a higher wage bill burden than StCBs, which pushes up their operating expenses (Chart V.23). During 2019-20, a deceleration in operating expenses, especially the wage bill, helped in building up their operating profits. An acceleration in interest income more than compensated for an increase in interest expenses, and accompanied by a slowdown in provisions and contingencies, produced a surge in net profits in 2019-20 after a contraction for three consecutive years (Table V.18). V.53 Typically, DCCBs in the southern and eastern regions contribute the lion’s share in all-India net profits. During 2019-20, however, profits of the western region, especially Maharashtra, accelerated, surpassing the eastern region (Chart V.24). DCCBs in Tamil Nadu posted the highest net profits while those in Madhya Pradesh registered the highest net losses. Out of 351 DCCBs, 60 were loss-making during 2019-20, with a cumulative loss of ₹1,041 crore (Appendix Table V.4.). | Table V.18: Financial Performance of District Central Co-operative Banks | | (Amount in ₹ Crore) | | Item | As during | Percentage Variation | | 2018-19 | 2019-20 | 2018-19 | 2019-20 | | 1 | 2 | 3 | 4 | 5 | | A. Income (i+ii) | 35,778 | 38,398 | 5.3 | 7.3 | | | (100.00) | (100.00) | | | | i. Interest Income | 33,995 | 36,473 | 4.8 | 7.3 | | | (95) | (94.9) | | | | ii. Other Income | 1,782 | 1,924 | 14.6 | 8.0 | | | (4.9) | (5) | | | | B. Expenditure (i+ii+iii) | 35,119 | 37,552 | 6.8 | 6.9 | | | (100.00) | (100.00) | | | | i. Interest Expended | 23,014 | 24,830 | 3.3 | 7.9 | | | (65.5) | (66.1) | | | | ii. Provisions and Contingencies | 3,596 | 3,886 | 17.2 | 8.0 | | | (10.2) | (10.3) | | | | iii. Operating Expenses | 8,508 | 8,836 | 12.9 | 3.9 | | | (24.2) | (23.5) | | | | Of which, Wage Bill | 5,374 | 5,663 | 12.2 | 5.4 | | | (15.3) | (15) | | | | C. Profits | | | | | | i. Operating Profits | 3,784 | 4,229 | 2.7 | 11.8 | | ii. Net Profits | 659 | 846 | -39.8 | 28.4 | Notes: 1. Figures in parentheses are in proportion to total income/ expenditure (in per cent).
2. Y-o-Y variations could be slightly different because absolute numbers have been rounded off to ₹ 1 Crore in the table.
3. Components may not add up to the total due to rounding off.
4. During 2019-20, 13 DCCBs (except Mallapuram DCCB) in Kerala were amalgamated with Kerala StCB. The data of 13 DCCBs have been deducted from the DCCB totals for previous years to facilitate comparison and compute growth rates.
Source: NABARD. | Asset Quality V.54 DCCBs have faced higher asset quality stress than StCBs for more than a decade now. Both have been worsening since 2016-17 when a number of states announced farm debt waiver schemes, partly affecting the credit culture and the recovery-to-demand ratio (Chart V.25). V.55 The deterioration in the asset quality of DCCBs continued in 2019-20 (Table V.19). A deceleration in sub-standard assets and acceleration in doubtful assets is indicative of aging of bad assets and stress becoming entrenched. Weak credit culture, governance issues and poor management practices in some DCCBs play a major role in worsening asset quality. Five states viz., Jharkhand, Jammu and Kashmir, Madhya Pradesh, Himachal Pradesh and Maharashtra have NPA to loan ratios exceeding 20 per cent (Appendix Table V.4). V.56 As per provisional data from NABARD for 2020-21, financial indicators of StCBs and DCCBs suggest that their performance had improved despite the pandemic due to regulatory and fiscal support from the Reserve Bank as well as government agencies (Box V.2). 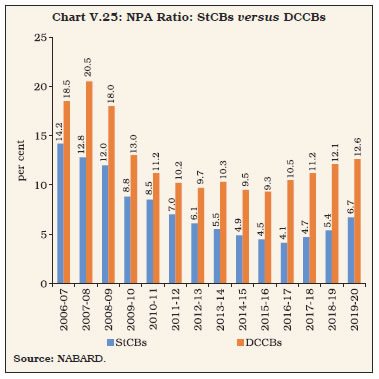
| Table V.19: Soundness Indicators of District Central Cooperative Banks | | (Amount in ₹ Crore) | | Item | At end-March | Percentage Variation | | 2019 | 2020 | 2018-19 | 2019-20 | | 1 | 2 | 3 | 4 | 5 | | A. Total NPAs (i+ ii + iii) | 31,998 | 35,298 | 15.7 | 10.3 | | i) Sub- standard | 15,641 | 15,885 | 19.5 | 1.6 | | | (48.8) | (45.0) | | | | ii) Doubtful | 13,918 | 16,990 | 15.0 | 22.1 | | | (43.4) | (48.1) | | | | iii) Loss | 2,439 | 2,423 | -0.9 | -0.6 | | | (7.6) | (6.8) | | | | B. NPAs to Loans Ratio (%) | 12.1 | 12.6 | - | - | | C. Recovery to Demand Ratio (%) | 72.0 | 70.2 | - | - | Notes: 1. Figures in parentheses are proportion to total NPAs (in per cent).
2. Y-o-y variations could be slightly different because absolute numbers have been rounded off to ₹1 Crore in the table.
3. Components may not add up to the total due to rounding off.
4. During 2019-20, 13 DCCBs (except Mallapuram DCCB) in Kerala were amalgamated with Kerala StCB. The data of 13 DCCBs have been deducted from the DCCB totals for previous years to facilitate comparison and compute growth rates.
5. Recovery Position as on 30th June of corresponding FY.
Source: NABARD. | 4.1.3 Primary Agricultural Credit Societies V.57 Primary Agricultural Credit Societies (PACS) constitute the third tier in the rural co-operative structure. They primarily engage in providing short-term and medium-term agricultural credit, along with arranging for the supply of agricultural inputs, distribution of consumer articles and marketing of produce for their members. V.58 PACS had a reach into 6,44,089 villages, serving 13.8 crore members and 5.3 crore borrowers, with dominant presence in the western region at end-March 2020. The borrower-to-member ratio—a metric to gauge credit penetration of PACS—has progressively declined from 39.6 per cent in 2016-17 to 38 per cent in 2019-20. They are conduits of financial inclusion at the grassroot level as majority of their borrowers as well as members are marginal farmers (Appendix Table V.7). Box V.2: Impact of COVID-19 on Rural Co-operative Banks StCBs and DCCBs together have over 78 per cent of their branches in rural/semi-urban areas and agricultural loans constitute over 40 per cent and 50 per cent, respectively, of their outstanding loan portfolio. As compared to SCBs, StCBs and DCCBs were thus operating in favourable geographies and sectors in managing the pandemic. The share of co-operative banks in ground level credit to agriculture has been declining consistently as SCBs made inroads in this segment. In 2020-21, however, the share of the former increased on sharp acceleration in fresh loans provided (Table 1). 94 per cent of StCBs and 88 per cent of DCCBs14 reported profits in 2020-21 as compared with 97 per cent and 83 per cent, respectively, in 2019-20. | Table 1: Share in Credit Flow to Agriculture (%) | | Year | Co-operative banks | RRBs | Commercial Banks | | 2015-16 | 16.7 | 13.0 | 70.2 | | 2016-17 | 13.4 | 11.6 | 75.0 | | 2017-18 | 12.9 | 12.1 | 74.9 | | 2018-19 | 12.1 | 11.9 | 76.0 | | 2019-20 | 11.3 | 11.9 | 76.8 | | 2020-21* | 12.0 | 12.2 | 75.8 | Note: *-Data are provisional.
Source: Data submitted by Banks on ENSURE portal of NABARD. | Rural co-operative institutions employed innovative tools and strategies to deal with the pandemic as presented below: | Table 2: Challenges and Strategies in the Face of the Pandemic | | Impact on | Strategies Adopted | | Lending Operations | -
The RuPay KCC helped farmers to access timely credit. -
Online workshops were conducted for staff. -
Closed User Groups (CUG) were formed to monitor day to day activities of branches and field staff. -
Review meetings were conducted through video conferencing to monitor progress in credit business. | | Liquidity | -
Reduction in CRR by 100 bps. -
Enhanced borrowing under the Marginal Standing Facility (MSF) -
NABARD’s Special Liquidity Facility which disbursed ₹16,800 crore to rural co-operatives. | | Capital Adequacy | -
Recapitalisation by some state governments helped in shoring up capital buffers. -
Some augmented their capital through internal accruals and share capital contribution from individual members or credit societies. | | Source: NABARD | StCBs and DCCBs weathered the first wave of the pandemic well, but early indicators suggest that the impact of the second wave has been more pronounced and stress is likely to rise in 2021-22 on account of fresh slippages. | V.59 A healthy growth in deposits was matched by expansion of loans, with short-term outstanding loans doubling (Appendix Table V.5). Borrowings, on the other hand, contracted marginally. There was also a substantial reduction in the government’s contribution to PACS’ owned funds. V.60 Both agricultural and non-agricultural lending expanded at similar rates, which helped maintain the dominant share of agricultural loans in total lending at 81 per cent in 2019-20. While half of the total PACS were profitable during the year, the losses incurred by the other half outweighed profits. The bulk of the losses stemmed from the southern region, especially Andhra Pradesh and Kerala (Appendix Table V.6). 4.2 Long Term Rural Co-operatives V.61 Long-term co-operatives provide term finance for capital formation and rural non-farm projects. Their structure, consisting of state co-operative agriculture and rural development banks (SCARDBs) operating at the state level and primary co-operative agriculture and rural development banks (PCARDBs) operating at the district/block level, does not follow a uniform pattern across states. Currently, five (Gujarat, Jammu and Kashmir, Puducherry, Tripura and Uttar Pradesh) out of thirteen fully functional SCARDBs, are unitary, i.e., they lend directly without separate PCARDBs. Six (Haryana, Karnataka, Kerala, Punjab, Rajasthan and Tamil Nadu) are federal in nature, i.e., they lend through PCARDBs, and two (Himachal Pradesh and West Bengal) have mixed structures, i.e., they lend through PCARDBs as well as through their own branches. 4.2.1 State Co-operative Agriculture and Rural Development Banks (SCARDBs) V.62 Functioning with 791 branches across 13 states/UTs, the consolidated balance sheet of SCARDBs contracted for the third consecutive year in 2019-20, dragged down by investments on the assets side and borrowings on the liabilities side (Appendix Table V.8). Turning their financial position around, they reported net profits after a gap of three years, with SCARDBs in Uttar Pradesh and Haryana completely reversing their losses reported in 2018-19 (Appendix Table V.11). Operating profits doubled as operating expenses and interest expenditure declined, and non-interest income grew by 150 per cent (Appendix Table V.9). However, asset quality continued to deteriorate as sub-standard and doubtful assets grew by 19 per cent and 29 per cent, respectively, along with a marginal reduction in recovery-to-demand ratio (Appendix Table V.10). 4.2.2 Primary Co-operative Agriculture and Rural Development Banks (PCARDBs) V.63 At end-March 2020, there were 602 PCARDBs functioning across eight states. The consolidated balance sheet of PCARDBs expanded in 2019-20 on the back of higher borrowings and reserves on the liabilities side and loans and advances and investments on the assets side (Appendix Table V.12). Both interest and non-interest income rose; however, the substantial increase in provisions and contingencies on the expenditure side led to net losses for PCARDBs, with Kerala reporting the highest absolute losses (Appendix Table V.13). The NPA ratio of PCARDBs worsened, with the northern states reporting the highest NPA ratios. (Appendix Table V.14 and V.15). 5. Overall Assessment V.64 Early indicators suggest that co-operative banks weathered the first wave of the pandemic well. Structural reforms that address deep-seated fault lines are expected to catalyse change in their operations. UCBs are increasingly adopting technology to address competitive pressures from other niche banking segments such as SFBs. Matters of inadequate governance are being addressed through regulatory as well as enforcement actions. Going forward, with a turnaround in economic activity, it is expected that the sector may build on its resilience and leverage on recent financial improvements to expand its footprint in order to reach finance to grassroot levels.
|