Press Release RBI Working Paper Series No. 05 Reassessing Investment Dynamics – Newer Insights into Leverage and Investment of the Indian Corporate Sector Deba Prasad Rath and Sujeesh Kumar@ Abstract * Given the criticality of investment in achieving durable growth in the context of ongoing subdued investment, globally as well as in India, this paper revisits investment dynamics in India from the standpoint of the ‘augmented accelerator’ hypothesis and examines whether a combination of macro and financial factors explains better the investment trends in the Indian economy. On an analysis of Indian corporate data for the period 1980-81 to 2018-19, we found that financial variables are assuming a greater role in determining the investment dynamics of the Indian corporate sector together with business expectations of the corporates and economic policy uncertainties. Cash holdings of the companies have a negative impact on fixed investment, implying cash holdings not to be realising into fixed assets. Furthermore, the paper attempts to provide a model-driven estimate of a threshold for Indian corporate leverage - estimated at around 60 per cent for debt to equity ratio and 28 per cent for debt to asset ratio, beyond which corporate leverage drags growth. JEL Classification: E220, E710, G310, G380, Y10 Keywords: Investment, GDP, accelerator, business investment, policy uncertainty, business expectations. Introduction After the global financial crisis (GFC) in 2008, the slowdown in investment has been observed across the globe, including both advanced economies (AEs) and emerging market economies (EMEs) mainly due to lack of active involvement of the private corporate sector – the main drivers of the investment. A vast literature covering both country-specific and cross-country studies has emerged after the GFC concluding that the net effect of the crisis was the global growth slowdown mainly due to subdued investment activity (Chen et al., 2019; World Bank, 2010; Kumar and Pankaj, 2009). Despite the policy measures pursued, particularly with regard to foreign investments and easy availability of finance, external borrowings, initiatives to ease of doing business and effective foreign exchange management, the investment slowdown witnessed after the GFC has not been fully recovered so far, thus raising the question whether the decline in investment is a result of weaker economic environment solely. Another key question is the extent to which corporate debt, which has increased post-GFC in many advanced and emerging market economies due to a credit boom in the pre-crisis period is acting as a drag on investment. In the Indian context, Nagaraj (2013) observed that the growth in the Indian economy from 2003 to 2008 was a private corporate debt-driven growth before getting subdued after the GFC period. Globally, corporates resorted to bank borrowing for investment in infrastructure and commodity-related business. The slump in these sectors hit corporate profits to new lows, and with corporates not being able to repay, debt ballooned in the balance sheets of the corporates, which turned as bad assets in the books of the creditors. Consensus is veering towards the conclusion, as shown by several studies, that the reasons for the investment slowdowns include macro-fundamentals, excessive borrowings, policy uncertainties and lack of business confidence. In addition, investment and leverage are seen to have a non-linear relationship implying that there will be a threshold of debt beyond which the investment may fall. Corporate leverage tends to amplify shocks, as corporate deleveraging could lead to depressed investment and higher unemployment, and corporate defaults could trigger losses and curb lending (IMF, 2019). Elevated corporate debt reflecting rising debt and often weak debt service capacity could lead to a rise in the debt-at-risk measures like interest coverage ratio, net debt to asset ratio. This could result in losses for banks and non-bank financial institutions with significant exposures to highly indebted non-financial firms. In the Indian context, few studies have mentioned the negative impact of excess leverage in investment (Shukla and Shaw, 2020; RBI, 2018). Notwithstanding several studies in India at the sectoral level on the relationship between debt and investment, there is a dearth of empirical studies at the aggregate level on the relationship between investment and leverage; the present study seeks to fill this gap in the literature. With this backdrop, the objective of the study is manifold. Firstly, the study examines how the financial variables impact the investment trends in India. Secondly, the relationship between investment and leverage is studied at the aggregate level of the Indian corporate sector to establish if there exists a threshold level of corporate leverage in India. Thirdly, the study analyses the role of policy uncertainty and business confidence in determining the revival of stalled investments. Finally, the study also presents some of the key drivers of investment in the Indian context. The sequence of the paper is organised into six sections. Section II presents a brief review of the existing literature on corporate investment and leverage. Some of the stylised facts related to Investment are presented in Section III. The methodology and modelling approach including data sources are presented in Section IV. Section V deals with the empirical analysis followed by discussions; and finally, concluding observations are given in Section VI. II. Review of Literature Corporates generally finance their investment activities using external funds or/and internal funds. Both have pros and cons. Debt funds are mainly long-term borrowings from banks or financial institutions and equity funds raised through public subscriptions. Lack of funds for investment implies that firms are constrained in obtaining external funds and unable to manage enough internal funds. Firms often prefer using internal funding to finance investment if it is cheaper than external funds, the latter seen in respect of specific sectors like technology and mining (Fazzari et al., 1988). The finance literature establishes both negative and positive effects of financing investment through debt. The positive effect of debt financing is the tax advantages of the firms as compared to other sources of financing (Modigliani and Miller, 1963) whereas, on the negative side, high corporate indebtedness causes higher interest expenses and thus lowers funds available for investment. The intention to clean up weak balance sheets to lower external finance costs leads firms to increase savings and to waive possibly profitable investment opportunities (Myers, 1977). In the case of developed and emerging economies, the level of financial development is good only up to a point, after which it becomes a drag on growth. Specifically, more finance leads to an inverted U-shaped effect on growth (Reinhart and Rogoff, 2009; Cecchetti et al., 2012; Cecchetti and Kharroubi, 2012). However, studies proved that higher levels of financial development do better in the allocation of capital investment, which enables growth (Marconi and Christian, 2017). A strand of the literature has established that in the post-GFC, highly leveraged companies are seen to be a drag on investment with the relation between debt and investment being non-linear i.e., there will be a threshold beyond which firms’ indebtedness might be negatively related to investment. If debt levels are below a certain threshold, it positively affects investment to the extent that the costs of holding debt are lower than marginal returns from further investment. However, high debt levels on firms’ balance sheets exert a negative effect on investment, as costs associated with high debt holdings increase significantly and thus reduce marginal returns on investment (Cecchetti et al., 2012; ECB, 2013; and Kalemli-Ozcan et al., 2015). The non-linear relationship between leverage and firm’s investment can also be attributed to agency cost of debt; these are internal costs incurred due to the competing interests of shareholders (principals) and the management team (agents) - expenses incurred for fear of agency cost problems arising from the separation of ownership and control that are associated with resolving this disagreement and managing the relationship. A higher level of debt, maybe beyond the threshold level, increases the bankruptcy cost too, even though increased levels of debt reduce the agency cost of free cash flow (Li and Cui, 2003; Zhang and Li, 2008). The behaviour of firms may be distinguished between those having high leverage and low leverage ratio. In times of financial distress, firms with high leverage are concerned about default risk and their focus will be restoring the leverage threshold and they may give up their investment opportunities. But low leveraged firms face low financial constraints, and they may utilise their borrowing power (Modigliani and Miller, 1963). A vast empirical literature on investment and leverage can be found evidencing high corporate leverage to be having negative effects on investment (Vermeulen, 2002; Benito and Hernando, 2007; Martinez-Carrascal and Ferrando, 2008; Pal and Ferrando, 2010; Kalemli-Ozcan et al., 2015; and Barbiero et al., 2016). Many of these findings emerged after the global financial crisis in 2008. Due to excessive borrowings by corporates, the indebtedness has gone up drastically resulting in firms struggling to service their debt as the return from their investment is getting curtailed. A plausible explanation of low investment in a fixed asset is uncertainty in return due to the low degree of business expectations which lack profitable investment opportunities. Increases in uncertainty make firms reluctant to undertake investment (Bloom et al., 2007; Guiso and Parigi, 1999). In advanced countries like the United States, even though firms are confident of the future demand conditions, hesitate to invest in new projects. With the strong growth of debt and equity issuance, firms use new debt to finance share buybacks (Rixtel and Villegas, 2015). An IMF study (2018a) based on non-financial corporates across major industrialised countries suggests that large firms accumulated higher gross corporate savings, which have not supported a proportionate increase in fixed capital investment but led to a build-up of liquid financial assets, over the last two decades. The findings of a recent study by Joseph, et.al., (2019) suggested that firms with high cash holdings have a significant role in the investment activities as compared with those who are cash-poor, especially during the recovery period after the GFC. Cash-rich firms continued their investment and accumulated more profits over the long run whereas cash-poor firms failed to survive in the post-GFC period. Akin to the global research on trends in corporate leverage, there are a few studies focused on Indian corporate leverage (Bhaduri, 2008; Chauhan, 2017; Herwadkar, 2019; Shukla and Shaw, 2020; and Sony and Bhaduri, 2021). In contrast to other developed and other developing countries, studies on India indicated that due to increasing number of non-manufacturing firms requiring low capital leads to maintaining a low leverage ratio. Moreover, Indian firms are more conservative as they use internal funds and many times do not substitute debt by raising more equity to finance their capital requirements. Therefore, the debt ratios are low as compared with other developing countries. Apart from the firm-specific factors, institutional and other country-specific factors like the underdevelopment of credit markets also significantly explain the decline in debt ratios in India (Chauhan, 2017). Note that this study is based on a small sample of 371 companies during the period 2003 to 2016 on monthly data. However, in the aftermath of the GFC 2008, the debt ratio of the corporates has increased in the EMEs. Herwadkar (2019) examined corporate leverages of EMEs including Indian firms based on annual accounts data during the period 1996-2014, comparing the determinants of corporate leverage between pre-GFC and post-GFC period across EMEs. The study found that a changing macroeconomic environment led to the sharp rise in corporate leverage in EMEs in the post-crisis period. International factors are responsible for the corporate leverage than firm-specific factors in the post-crisis period. Similar research concluded that global financial conditions are responsible for the rising corporate leverage in EMEs. This is more pronounced for financially constrained firms, such as small- and medium-sized enterprises (Alter and Elekdag, 2020). The relationship between leverage and investment in connection with financial constraints of Indian manufacturing firms studied by Bhaduri (2008), points that financially constrained1 firms exhibit a much higher investment-cash flow sensitivity than that of financially unconstrained. Specifically, leverage has a negative influence on the investment decision for financially constrained firms, while it has a positive impact on investment for financially unconstrained firms. Further, though it is not related to investment leverage dynamics, Bhaduri (2005) on an analysis of the investment patterns of 362 Indian manufacturing firms during the period 1989-1990 to 1994-1995 found that the liberalisation effort succeeded in relaxing financial constraints faced by the Indian firms. As indicated earlier, excess leverage is expected to have a negative impact on investment. Shukla and Shaw (2020) analysed the firm’s leverage on corporate investment in India based on the firm-level data during the period 2004-2017. Their result concluded that the high leverage of firms has an adverse impact on their capital expenditure. Furthermore, they found a non-linear relationship between leverage and firm investment using a cubic regression indicating a firm’s leverage adversely affects its investment activity after a higher threshold. However, they have not explicitly estimated the threshold level of the corporate investment. Most of the studies cited above highlighted the positive and negative effects of debt funds on investment, the impact of excess financing on growth, the determinant of leverage, financing choices between debt and equity, the relationship between debt and investment, and the impact of cash holdings on investment especially for the private non-financial corporates. As we have already alluded to, the objective of our study is manifolds - one of them is to find a threshold for corporate leverage in India, which can be considered as a benchmark and could be considered as useful for policymakers and analysts. If the leverage exceeds the benchmark, it could have adverse implications in financial stability. To the best of our knowledge, no studies are found in the Indian context arriving at a threshold of debt at an aggregate level, which as such, is our contribution to the literature. III. Some Stylised Facts Few stylised facts relating to credit, savings, leverage and investment are set out below. III.1 Credit and Investment The virtuous cycles enable animal spirit in the economy, which mutually reinforce investment, productivity growth, job creation, demand and exports (GoI, 2019). Ample credit availability is an indication of financial development that may be a leading financial indicator of growth. Investment in fixed assets, generally reflected as gross fixed capital formation (GFCF) in the National Accounts, could be influenced by decisions to postpone capital expenditure (capex) on weak demand conditions, volatility of factors affecting profit expectations and availability of external financing. Bank credit is one of the main financing sources for capex projects and this source has traditionally supported financing for high value capex projects as well as small ticket investments in India. The infrastructure sector attracts the highest share among the total industrial credit extended by the banking sector in India. 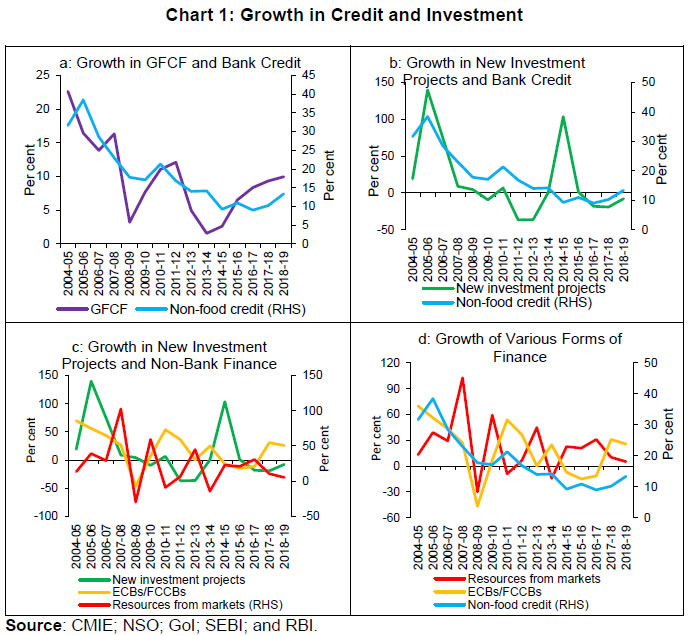 Though the credit growth in this sector has been decelerating in recent years due to subdued demand and low investment activities, credit growth in the infrastructure segment was around 40 per cent in 2009-10. Although the banking sector has been beset with non-performing assets (NPAs)2 at 8.4 per cent in 2019-20, the impact of declining bank credit has been significantly counterbalanced by other sources of funds like external commercial borrowings (ECBs) and resource mobilisation from the capital market3. Therefore, in the Indian scenario, the alternate sources of finance mainly substitute the traditional form of bank credit4 and co-movements can be found between credit growth and realised investment growth (Chart 1). Growth in new investment5 projects and credit growth are much closer than the co-movement between bank credit growth and realised investment. Other forms of finance also move in tandem with credit and investment. III.2 Savings in India Savings constitute a key determinant of economic growth and of financing investment. Emerging market economies’ savings are significantly higher than that of advanced economies such as the US and the UK as reflected in the savings/GDP ratio for the advanced economies (AEs) and emerging market and developing economies (EMDEs) which stood at 22.7 per cent and 32.5 per cent, respectively in 2019. Emerging and developing Asian countries’ saving rates are even higher (39.6 per cent in 2019) than the AEs and EMDEs (IMF, 2020). Since 2002-03, the share of gross domestic savings to GDP ratio of India was on an increasing trend, supporting high growth as seen typically during high growth periods in India. However, a decline in aggregate saving rate was found since 2007-08 followed by some uptick in 2010-11 (Chart 2). If we look at the disaggregated level, a similar trend can be seen in the case of household savings, whereas corporate sector savings continued to increase after a fall in 2007-08. Even though Indian households are net savers as opposed to the corporate sector, the trend has reversed after the global financial crisis. Literature suggests that corporate savings have been increasing over the last 15 years in advanced economies across the countries. The increased savings can be reflected in the cash holdings of the corporate sector. The increasing trends in cash holdings are evidenced in non-financial firms, especially in large firms across industries. However, studies evidenced that higher corporate savings resulted in accumulating liquid financial assets rather than fixed investments. In the Indian context, cash holdings of both public limited and private limited companies, as a percentage of their total assets, have been plotted in Chart 3 from 1980-81 to 2018-19 based on their financial statements. An upward trend in cash holdings can be found in the recent period in the case of private limited companies, whereas an opposite trend has been seen in the case of public limited companies. III.3 Trend in Investments Sluggish growth, mainly due to muted investment activity, was a major concern for most of the economies in the post GFC period. Investments in fixed assets have significant implications for economic growth, especially in the emerging market economies (EMEs) including India as sustainable growth of an economy is critically dependent on the sustainability of the large investment projects undertaken by the corporates. The financial turbulence triggered by GFC, which had impacted the investments, has not settled down so far. Revival of the investment cycle is yet to happen in most of the developed economies and EMEs including India. Despite several policy initiatives by authorities to strengthen investments, the growth of real investment has not yet reached the pre-GFC level (Chart 4). III.4 Policy Uncertainty, Business Expectations and Investment Policy-related uncertainty has important economic consequences. A business decision is subject to various factors such as uncertainty regarding the timing of business investment, potential impact of policy decisions, political conditions etc. The role of economic policy uncertainty6 and business expectations7 in corporate investments have been studied recently by various researchers (Anand and Tulin, 2014; Gulen and Ion, 2016; Gennaioli et al., 2016; Klaus et al., 2016). Several studies documented the importance of policy uncertainties, as a high degree of economic policy uncertainties may be a drag on investment. Gulen and Ion (2016) indicated in their study based on the US corporations that a strong negative relationship between policy uncertainty and capital investment of the US public corporations. They also mentioned that the relationship between uncertainty and investment is not uniform across firms. In a study done by Klaus et al., 2016 in Swiz firms, they evidenced an increase in policy uncertainty leads firms to reduce their investment plans. Higher economic policy uncertainties pull-down investment growth, while higher business confidence index or positive business expectations promote higher investment growth (Chart 5). 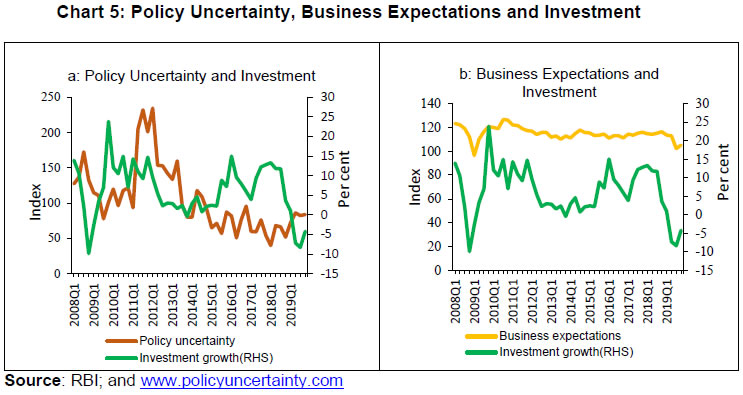 III.5 Two Measures of Leverage Leverage or financial leverage is referred to as the amount of debt a firm uses to finance its assets. It is commonly presented as debt to equity ratio or debt to asset ratio. However, there is no consensus in the literature as to, which is the best form of leverage due to the different components appearing in the numerator and denominator of these ratios. The most important leverage measures are ratio of debt to equity and the ratio of debt to total assets8. The GFC led to an increase in leverage, especially in the private corporate sector. This in turn reduced the ability of private firms to raise funds for their investment projects. Country specific studies found evidence in holding back of investment due to high debt by the corporates. However, for firms with low levels of debt, the relationship between debt and investment is less robust and depends on a number of firm-specific characteristics and the macroeconomic environment (IMF, 2017). The Indian corporate sector leverage measures are presented in Chart 6. Both measures have shown co-movement over the period. From the year 2015-16 both the leverage measures have declined reflecting deleveraging undertaken by the Indian corporate sector notwithstanding a mild increase in 2018-19. Based on the annual accounts data, the debt-equity ratio and debt asset ratio of the Indian corporate sector are around 48 per cent and 19 per cent respectively in 2018-19. 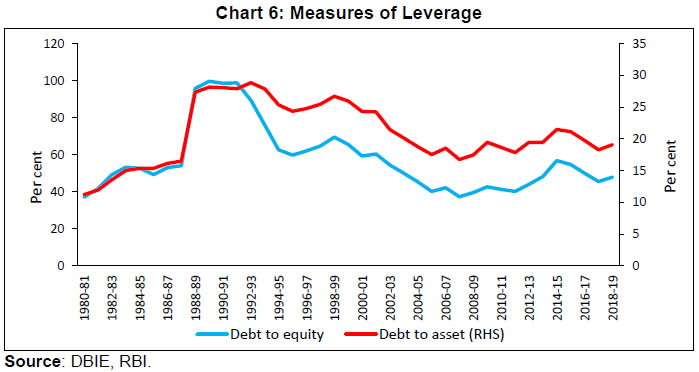 IV. Data and Methodology The study has used both annual and quarterly data on corporate investment at an aggregate level. The annual data are based on audited annual accounts of the non-government non-financial public limited companies and private limited companies registered with the Ministry of Corporate Affairs (MCA). Aggregate variables such as investment, cash holdings, debt to equity, debt to asset etc. derived from the balance sheets of the non-government non-financial public limited companies and non-government non-financial private limited companies. The data covers the period 1980-81 to 2018-19 published by the RBI9. The quarterly data has been sourced from CMIE capex and Prowess database for obtaining the stalled investment projects and some of the quarterly financial variables of the companies in order to model the investment. Further, data on gross domestic product (GDP), gross fixed capital formation (GFCF) and bank credit has been sourced from DBIE – the data warehouse of RBI. Survey based indices are collected from the various issues of RBI bulletins. Data on economic policy uncertainty index are obtained from the website of the Economic Policy Uncertainty. Information about the variables and their definitions along with the duration of data etc. are mentioned in Annex Table A5. The descriptive statistics of the annual and quarterly variables are mentioned in Annex Tables A3 and A4 respectively. Two modelling approaches, namely the accelerator approach and a threshold approach, have been used in the study. Following IMF (2018b), the augmented accelerator model specification for investment is as follows: The baseline specification (3) allows modelling the dynamics of investment based solely on output developments. The baseline model has been augmented with additional determinants of the investment as follows: We have used financial variables derived from the balance sheet and profit and loss statements of the Indian companies. The major variables used are leverage ratios, profitability ratios, size of the firms, cash balances etc., which are listed in Annex Table A5. For estimating the threshold values of the corporate leverage, a threshold regression model (Hansen 1999, 2011) was employed by empirically modelling the relationship between investment and corporate leverage and estimating the threshold levels of leverage, as follows: V. Empirical Analysis We use a multi-layer framework to analyse the corporate leverage and investment dynamics in India. Our approach is based on two-step accelerator modelling wherein the investment dynamics are examined through the output variable first (accelerator model) and then augmented with financial variables in the baseline accelerator model (Barkbu et al., 2015; WEO 2015; and IMF, 2018b). To begin with, the modelling was carried out on India’s real investment, proxied by gross fixed capital formation (GFCF) and real output, i.e. gross domestic product (GDP), using the quarterly data during the period 1998Q1 to 2019Q4. The estimation results of the baseline accelerator model with 8 quarterly lags show that the dynamics of the investment are significantly explained by the output as expected. The R-square value of the baseline accelerator model indicated that around 30 per cent of the investment dynamics are explained by the changes in output, which is only a partial explanation. The residual of the model also shows a large variation and found a wide gap between the estimates by the model and the actual observed values. In the second stage, we have included some of the financial variables like interest coverage ratio, profitability, and credit growth augmented with the baseline accelerator model. We observed the explanatory power of the model increased by around 30 per cent. We also tried with another set of market variables like market volatility, short term interest rates and another set of expectations and uncertainty indicators in the baseline accelerator model. The net effect is the improvement of the baseline accelerator model in terms of its goodness of fit. The baseline and augmented accelerator model estimates are given in Annex Table A1 and Table A2 respectively. The above analysis established the fact that the investment in India follows an augmented accelerator model. Having verified by the accelerator hypothesis in the Indian context based on output and financial variables, we proceed with the corporate data to model the investment dynamics of the Indian corporate sector. The insights gained from the previous exercise ensured that the importance of financial variables, which essentially accelerate the investment scenario of the corporate sector. In the next step, we have used two sets of models each with gross investment10 and net investment as dependent variables. The lagged and contemporaneous financial variables have been used as determinants. The estimated coefficients of each investment model have been given in Table 1 below. | Table 1: Estimated Coefficients of Corporate Investment Model | | Independent Variables | Model 1 | Model 2 | Model 3 | Model 4 | Model 5 | Model 6 | | Gross Investment | Net Investment | | Constant | 1.010*** | 1.010*** | 1.15*** | 0.644*** | 0.630*** | 0.584*** | | Debt to equityt | | | | | -0.003*** | | | Debt to equityt-1 | -0.002** | -0.003*** | | -0.003*** | | | | Debt to assett | | | | | 0.014*** | | | Debt to assett-1 | 0.009** | 0.014*** | 0.006** | 0.014*** | | 0.003** | | ICRt | 0.045*** | 0.013 | .029*** | | 0.016** | | | ICRt-1 | | | | 0.013 | | 0.027** | | DSCRt | -0.530** | | | | -0.375*** | | | DSCRt-1 | | -0.241 | 1.016 | -0.336** | | -0.417** | | Cash holdingst | | 0.628 | | | -0.512 | | | Cash holdingst-1 | -2.691** | | -2.324** | -0.637 | | -1.301* | | Sizet | | -0.059*** | -0.061*** | | -0.029*** | | | Size t-1 | -0.050*** | | | -0.031 | | -0.019*** | | R-square | 0.81 | 0.82 | 0.80 | 0.82 | 0.82 | 0.65 | | ARCH test (p-value) | 0.697 | 0.697 | 0.135 | 0.703 | 0.744 | 0.220 | Note: Gross investment is the dependent variable for models 1, 2 and 3; and Net investment is the dependent variable for models 4, 5 and 6. ***and ** denote the significance at 1 per cent and 5 per cent, respectively.
Source: Authors’ calculations. | The coefficients of the leverage measure, as proxied by debt to equity ratio show a negative relation with investment as expected as per the existing literature However, it is to be noted here that in our model, this relationship holds at the aggregate level corporate data. At the firm level, leverage of a firm can affect the investment either negatively or positively depending upon the size of the firm or sector in which the firm operates. However, the standard results in the literature suggest that debt to equity ratio negatively affects investment. Another proxy of leverage, debt to asset is found to be positively associated with the investment. Studies also show that debt ratios (debt to assets) affect either positively or negatively or both on investment and other profitability measures like gross profit, return on equity etc. depending on the magnitude of the debt ratios (Gebauer et.al., 2017; Berger and Bonaccorsi, 2006; Nunes, et.al., 2009; Kajananthan and Nimalthasan, 2013; Phan, 2018). Shukla and Shaw (2020) reported that besides debt to equity, debt to asset ratio has a negative influence on investment in Indian firms. Keeping this result in view, we have excluded the debt to equity ratio from our investment model and estimated the model parameters separately (listed in model 3 and model 6 in Table 1). We found that the coefficients of debt to asset ratio are consistently positive across the models. This may be due to the low debt ratio generally observed in the Indian context. As we have already mentioned in our paper, debt ratio of EMEs and AEs are higher as compared with debt ratio of the Indian non-financial corporate sector. There are several reasons for low debt ratios in India. Chauhan (2017) highlighted various reasons for having a lower debt ratio for Indian companies. In the next section of the paper, we have addressed the non-linear effect of leverage on investment. Apart from the leverage measures, cash holding of the corporates is also conceptualised as a key determinant of investment in the empirical literature. Empirical studies suggest that firms with high cash holdings have a significant role in the investment activities as compared with those who are cash-poor, especially in the recovery period after the GFC. Cash-rich firms can continue their investment and accumulate more profits over the long run when cash-poor firms could fail to survive in the post GFC period (Joseph et al., 2019). But at the same time, cash holding may not necessarily materialise into the fixed investment. This being an empirical question, in view of this finding, we have also included cash holding of the corporates in the corporate investment model. We found that cash holding of the companies has a negative impact on investment in the Indian context, implying cash holdings are not realising into fixed assets suggesting that Indian companies when in a cash rich position might be investing in other financial assets rather than fixed assets. Moreover, the interest coverage ratio (ICR) has a positive impact on investment and the debt service coverage ratio (DSCR) has a negative influence on investment. Though ICR is sometimes referred to as a leverage measure, it is incurred as an expenditure for interest payments. It is only dealing with the serviceability of interest. But DSCR is a debt service ratio, which takes into account the serviceability of debt including the interest expenses. Higher the values of both measures, better is the firm’s ability to repay the interest or debt. However, in view of the investment ability of a firm, higher DSCR may negatively affect the investment as serviceability of the outstanding debt (repayments and prepayments) or deleveraging may lead to a cut back in their investment, thereby negatively impacting investment. Estimation of Threshold Debt for Corporate Investment As indicated earlier, this exercise is motivated by a strand of literature that suggests that leverage could have a non-linear relation with investment depending on how large the former is, throwing up the question: is there any threshold of leverage beyond which the investment can turn negative? This relationship has been established in the literature for several advanced and emerging market economies. In the Indian case, we have attempted to find out if there exists a threshold for Indian corporate leverage. Our corporate investment models suggest that there exists a negative relationship between leverage and investment at the aggregate level. The threshold regression model suggests that for a debt to equity ratio of around 60 per cent and above, the investment tended to turn negative. Therefore, this can be a threshold for the Indian context. However, it may be noted here that the debt to equity ratio can be higher for highly capital-intensive industrial companies. This may be verified with various industrial sectors using sectoral data in a panel set-up, which is not addressed in this study. The threshold level of debt to asset ratio is also determined in the same manner where non-linear relation with investment is again seen to exist. The estimated threshold for the debt to asset ratio of the Indian corporate sector is about 28 per cent, though investment in the above threshold is not statistically significant. However, we have considered 28 per cent as a threshold level for the debt to asset ratio of the corporate sector. The covariates which are used as non-threshold variables in the models are the lagged values of interest coverage ratio (ICR), debt serviceability ratio (DSCR), cash holdings, profitability and size of the firm. The statistically significant coefficients of the non-threshold variables are in line with the expectations and previous empirical findings. ICR is positively affecting the investment, while DSCR is negatively affecting investment. Profitability has a positive impact on investment as expected whereas the firm size is negatively affecting investment. Though cash holding has shown a mixed effect on investment, it is not statistically significant. The threshold regression estimates are given in Table 2. | Table 2: Threshold Regression Estimates | | Dependent Variable: Net Investment | | Variable | Model 1 | Model 2 | Variable | Model 3 | Model 4 | | Debt to equity < 59.87 | Debt to asset < 27.87 | | Debt to equityt-1 | 0.0036*** | 0.0055*** | Debt to assett-1 | 0.0083*** | 0.0086*** | | Constant | 0.1527* | 0.2193*** | Constant | 0.4927*** | 0.4354*** | | Debt to equity >= 59.87 | Debt to asset >= 27.87 | | Debt to equityt-1 | -0.0019*** | -0.0013*** | Debt to assett-1 | 0.0370 | 0.0358 | | Constant | 0.4936*** | 0.6412*** | Constant | 0.3985 | 0.4169 | | Non-Threshold Variables | | ICRt-1 | 0.0221** | 0.0174*** | ICRt-1 | 0.0138*** | | | DSCRt-1 | -1.2294*** | | DSCRt-1 | -0.2486** | -0.0108 | | Sizet-1 | | -0.0164*** | Sizet-1 | -0.0258*** | -0.0239*** | | Cash holdingst-1 | -0.3513 | -0.0030 | Cash holdingst-1 | | 0.2638 | | Profitabilityt-1 | 3.8690*** | | | | | | R-square | 0.77 | 0.81 | R-square | 0.82 | 0.79 | | ARCH-Test (p-value) | 0.51 | 0.92 | ARCH-Test (p-value) | 0.91 | 0.69 | Note: Dependent variable: net investment/total assets. Debt to equity ratio is the threshold variable for model 1 and model 2; and debt to asset ratio is the threshold variable for model 3 and model 4. *** and ** denote the significance at 1 per cent and 5 per cent respectively.
Source: Authors’ calculations. | Stalled Investment in India The investment projects in India that were stalled during the implementation phase continues to grow since 2008. The trend can be observed in both government and private sector projects. The rate of stalling measured as the ratio of stalled projects to under implementation projects shows a consistent increase from 2006-07 (Chart 7). However, the ratio fell only marginally in 2018-19. The rate of stalling of private sector projects is much higher than government projects. 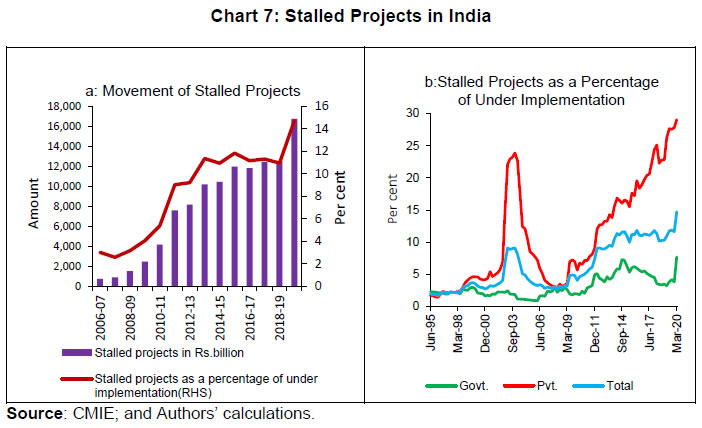 According to CMIE data, reasons for stalling of projects in India are varied covering: (i) lack of clearances11, (ii) unfavourable market conditions, (iii) lack of promoters’ interest, (iv) land acquisition problems, (v) lack of funds and (vi) lack of raw materials/fuel supply problems. An analysis of the annual time series data on stalled projects from 2006-07 to 2019-20 suggests that stalling of projects started post-GFC, i.e., after 2008-09 and the trend has increased continuously since then. The shares of cost of stalled projects to the total cost of projects are plotted in Chart 8. Among various reasons for stalling of projects in India, projects have stalled due to lack of clearances, lack of funds and land acquisition problems are found more prominent in recent years (Chart 8). Role of Uncertainty and Expectations on Investment The significant role of economic policy uncertainties and business expectations on India’s investment has been examined by considering two different variables namely, stalled investment projects and unrealised investment intentions to capture non-financial factors for determinants of investment decisions. There are various reasons for stalling of investment projects - mainly either policy related or regulatory related and financial conditions mainly contributing to the increased rate of stalling of investments projects (Chart 8). In view of this, stalled investment is considered as a dependent variable, with business expectations and policy uncertainties along with industrial capacity utilisation are considered as determinants of stalled projects. Similarly, we construct another proxy of stalled investment which is the gap between the investment intentions and the realised investments. The gap will give the unrealised investment, probably stalled investment ascribing to various reasons. The regression results are presented in Table 3. In the modelling exercise, we found policy uncertainty has a significant role in stalling investment projects. Similar results are also found in the case of the second proxy variable, i.e., un-realised investment intentions. The model also suggests that the increased uncertainty may increase the gap between the investment intentions and realisations. Business expectations also have a similar role in the investment with positive business expectations having a negative influence on stalling of projects. On including inflation expectations of the households in the model, the sign of the coefficient is found to be negative as expected, but with no statistical significance. This might be due to the household expectations being different from industry expectations on inflation. Capacity utilisation is found to be insignificant in explaining stalling of projects. This might be true if the investment is stalled due to low demands or unfavourable business conditions, resulting in the installed capacity neither being used for production nor for further expansion. | Table 3: Estimated Coefficients of Uncertainties and Expectations | | Variable | Stalled Investments (Model 1) | Gap between Investment Intentions and Realised Investment (Model 2) | | | Coefficient | Prob. | Coefficient | Prob. | | Constant | 0.449 | 0.179 | 4.292 | 0.451 | | Capacity utilisation | 0.007 | 0.245 | -0.005 | 0.953 | | Inflation expectations | -0.001 | 0.302 | -0.008 | 0.521 | | Policy uncertainty | 0.001** | 0.016 | 0.015*** | 0.002 | | Business expectations | -0.008** | 0.018 | -0.036 | 0.538 | | R-square | 0.22 | | 0.20 | | | ARCH Test (p-value) | 0.91 | | 0.40 | | Note: *** and ** denote the significance at 1 per cent and 5 per cent respectively.
Source: Authors’ calculations. | Key Drivers of Investment This section presents some of the key determinants of investment especially during the period 1998 - 2019 based on quarterly data in a simple and flexible regression model for modelling investment. Change in real investment has been used as the dependent variable and expressed over different time horizons of zero to five quarters. We adopted this framework for India from Banerjee et al. (2015) as they have been used for estimating business investment dynamics for G-7 economies. Our purpose here is to examine whether the financial variables used in the accelerator model explains the same dynamics based on the quarterly data model, though the samples used in the quarterly model are different from the annual data model. Moreover, we have also used several market variables in the quarterly model to see the investment dynamics. These explanatory variables have been selected based on the existing financial literature, which can influence the investment. The details of variables are listed in Annex Table A5. The regression results are presented in Table 4. | Table 4: Key Drivers of Investment | | Variable | Investmentt | Investmentt+1 | Investmentt+2 | Investmentt+3 | Investmentt+4 | Investmentt+5 | | Investmentt-1 | -0.270 | -0.327 | -0.143 | -0.489* | -0.508* | -0.489** | | Investmentt-2 | -0.330 | -0.262 | -0.175 | -0.271 | -0.344* | -0.322** | | Policy uncertaintyt | -0.026 | -0.021** | 0.013 | 0.009 | 0.004 | -0.026 | | Business expectationst | 0.003 | -0.001 | 0.008** | 0.001 | 0.008** | -0.002 | | Inflation expectationst | 0.000 | 0.000 | -0.001 | 0.000 | 0.000 | 0.000 | | Capacity utilisationt | -0.012* | 0.011** | -0.014** | -0.001 | -0.005 | 0.015** | | Profitabilityt | -0.036** | -0.004 | -0.002 | 0.005 | -0.015 | 0.007 | | Interest coverage ratiot | 0.320** | 0.045 | 0.059 | 0.000 | 0.006 | 0.014 | | Call rate (WACMRt) | 0.002 | 0.016** | -0.002 | -0.002 | -0.009 | 0.004 | | Term spreadt | 0.017 | 0.023 | 0.003 | -0.029 | 0.013 | 0.001 | | Market volatilityt | -0.003** | 0.003 | -0.004** | 0.003 | 0.001 | -0.000 | | Credit growtht | 0.001 | -0.001 | 0.005** | 0.001 | 0.002 | -0.004** | | Constant | 0.315 | -0.708 | -0.224 | 0.178 | -0.145 | -0.898 | | R-square | 0.51 | 0.47 | 0.55 | 0.35 | 0.38 | 0.70 | | ARCH Test (p-value) | 0.40 | 0.70 | 0.95 | 0.40 | 0.61 | 0.70 | Note: (i) Results are based on regression model taking real investment (GFCF) as dependent variable and variables which are commonly considered as the determinants of investments in the literature are taken as independent variables.
(ii) ***and ** denote the significance at 1 per cent and 5 per cent respectively.
(ii) Profitability and interest coverage ratio have been derived from the quarterly financial statements of select companies obtained from the CMIE Prowess database.
Source: Authors’ calculations. | The regression results suggest that policy uncertainty has a negative impact on investment and the business expectations have a positive impact. This result is in line with the existing literature. The capacity utilisation12, interest coverage ratio and credit growth have a positive impact on investment as expected, though these variables have shown negative impact at some time horizons. Weighted average call rate is found to be negatively affecting investment, as expected, implying a higher interest rate would increase the cost of funds for the investment. The regression results also show that a highly volatile market has a negative impact on investment. The term spread coefficient is found to be not statistically significant in the Indian context. VI. Conclusion The extended accelerator model suggests that financial conditions have a significant impact on investment. The decline in investment in India especially after the global financial crisis (GFC) cannot be explained solely by the weaker economic environment, but in combination with the financial conditions of the Indian corporate sector. The leverage has a greater role in determining the investment pattern of the corporates with there being a negative relation between the two. In the Indian context, our results suggest that leverage measured as debt to equity ratio gives 60 per cent as the threshold level beyond which debt is found to be negatively affecting investment. The current level of leverage of around 48 per cent, as per latest available data (2018-19), suggests that there exists a further space for corporate borrowing which will lead to higher investment in a scenario where macro-economy is conducive and better financial conditions prevail. Similarly, the estimated threshold for the debt to asset of Indian corporate sector is about 28 per cent, which gives more space to reach the debt threshold from the current debt to asset ratio of 19 per cent. These findings provide a macro-level threshold for the leverage measures for the Indian corporate sector which could be useful for the policy makers and researchers. Our results also suggest that cash holdings of the companies have a statistically significant negative relation with the fixed investment. This implies cash holdings are not realising into fixed assets as Indian companies might be investing in other financial assets rather than fixed assets for corporates with higher cash holdings. It is to be stated here that, Joseph et.al. (2019) suggests that firms with high cash holdings have a significant role in investment activities as compared with those who are cash-poor, especially in the recovery period after the GFC. Cash-rich firms with accumulated profits over long run are able to continue their investment whereas cash-poor firms fail to survive in the post-GFC period. However, our study does not segregate the investment based on cash holdings pattern of the firms. This could be a further research topic so as to get a better idea of the investment dynamics based on the distribution of cash holding across firms. Coming to the behavioural aspects of the corporates, we found that a high degree of economic policy uncertainties may drag the investment down - either cut down the investment intentions or stall the investment projects under implementation. Business expectations and capacity utilisations of the firms are also having a significant role in deciding or postponement of investment activities. In our study, we found that policy uncertainty has a significant role in stalling of investment projects. If the economic policy uncertainty persists continuously in the economy, investment intentions may not materialise. Moreover, we found if the business expectations improve, it is likely that revival of investment happens sooner, and the positive business expectations narrow the gap between investment intention and its realisation. Some of the key drivers of the investment viz. capacity utilisation, interest coverage ratio and credit growth have a positive impact on investment, though these variables have shown negative impact at some time horizons. Furthermore, our results also show that a highly volatile market has a negative impact on investment and call rate has a negative effect on investment at some time horizons implying a higher interest rate would increase the cost of funds for the investment.
References Abel, A. B. (1981), A Dynamic Model of Investment and Capacity Utilization, Quarterly Journal of Economics, 96, 379–403. Alte, A. & Elekdag, S. (2020). Emerging market corporate leverage and global financial conditions. Journal of Corporate Finance, 62, 101590. Anand, R. & Tulin,V. (2014). Disentangling India’s Investment Slowdown. IMF Working Paper,14/47. Banerjee, R., Kearns, J. & Lombardi, M. (2015). (Why) Is investment weak?, BIS Quarterly Review, 67-82. Barbiero, F., Brutscher, P. B., Kolev, A., Popov, M., & Wolski, M. (2016). Misallocation of investment in Europe: Debt overhang, credit market distress, or weak demand?, European Investment Bank. mimeo. Barkbu, B., Berkmen, P., Lukyantsau, P., Saksonovs, S., & Schoelermann, H. (2015). Investment in the Euro Area: Why Has It Been Weak, IMF Working Paper 15/32, International Monetary Fund, Washington. Benito, A. & Hernando, I. (2007). Firm behaviour and financial pressure: Evidence from Spanish Panel Data, Bulletin of Economic Research, 59(4): 283–311. Berger A. & Bonaccorsi di Patti E. (2006). Capital structure and firm performance: A new approach to testing agency theory and an application to the banking industry”, Journal of Banking & Finance (30), pp. 1065- 1102. Bhaduri, S.N. (2005). Investment, financial constraints and financial liberalization: Some stylized facts from a developing economy, India, Journal of Asian Economics,16(4):704-718. Bhaduri, S.N. (2008). Investment and Capital Market Imperfections: Some Evidence from a Developing Economy, India, Review of Pacific Basin Financial Markets and Policies, 11(3):411-428. Bloom, N. Bond, S. & Reenen, J.V. (2007). Uncertainty and investment dynamics, Review of Economic Studies, 74,391–415. Cecchetti, S. & E. Kharroubi (2012). Reassessing the Impact of Finance on Growth BIS Working Paper, no 381. Cecchetti,S.G; Mohanty,M.S. & Zampolli,F.(2012). The real effects of debt, BIS Working Papers, No 352. Chauhan G.S. (2017). Corporate financing and deleveraging of firms in India, IIMB Management Review, 29,170–187. Chen,W., Mrkaic, M. & Nabar,M. (2019). The Global Economic Recovery 10 Years after the 2008 Financial Crisis (April 2019). IMF Working Paper, No. 19/83, Available at SSRN: https://ssrn.com/abstract=3397541. ECB (2013). Corporate finance and economic activity in the euro area, Structural Issues Report 2013, ECB Occasional Paper, 151. Government if India (GoI). (2019). Economic Survey 2018–19. Fazzari, S., Hubbard, R. & Petersen, B. (1988). Financing constraints and corporate investment, Brookings Papers on Economic Activity, 19,141–206. Ferrando, A., Marchica, M. T., & Mura, R. (2017). Financial Flexibility and Investment Ability Across the Euro Area and the UK. European Financial Management, 23(1), 87–126. Gebauer,S. Setzer, R., & Westphal,A. (2017). Corporate debt and investment: A firm-level analysis for stressed euro area countries. ECB Working Paper Series, No 2101, September, ECB. Gennaioli, N., Yueran. M. & Shleifer, A. (2016). Expectations and Investment, NBER Macroeconomics Annual, University of Chicago Press, vol. 30(1), 379-431. Gordon, R. A. Business Fluctuations. 2d ed. New York: Harper, 1961. Guiso, L. & Parigi, G. (1999). Investment and demand uncertainty, Quarterly Journal of Economics, 114, (1)185–227. Gulen,H. & Ion, M.,( 2016). Policy Uncertainty and Corporate Investment, The Review of Financial Studies, Vol. 29(3) 523-56. Hansen, B. (1999). Testing for Linearity. Journal of Economic Surveys, 13, 551 576. Hansen, B. (2011). Threshold Autoregression in Economics, Statistics and Its Interface, 4, 123–127. Herwadkar, S. (2017), Corporate Leverage in EMEs: Has the Global Financial Crisis Changed the Determinants?, Reserve Bank of India Working Paper, no.4 IMF (2015), World Economic Outlook. IMF (2018a), The Rise in Corporate Saving and Cash Holding in Advanced Economies: Aggregate and Firm Level Trends. IMF Working Paper,18/262. — (2018b), Investment Slowdown in Denmark: Diagnosis and Policy Options, July, 2018, IMF Working Paper,18/161. — (2019), Global Financial Stability Report: Lower for Longer. Washington, DC, October. — (2020), World Economic Outlook. Joseph, A., Knee, C., Horen, N & Saleheen, J. (2019), “All you need is cash: corporate cash holdings and investment after the financial crisis”, Working Paper No. 843, Bank of England, December. Kajananthan, R. & Nimalthasan, P. (2013). Capital structure and study on Sri Lankan listed manufacturing companies”, Merit Research Journal of Business and Management,1(2), 037-044. Kalemli-Ozcan, S., Laeven, L. & Moreno, D. (2015). Debt Overhang, Rollover Risk and Investment in Europe. Mimeo, ECB and University of Maryland. Klaus, A., Andreas, D., Michael,S. & Egbert, S. (2016). The effect of policy uncertainty on investment plans: Evidence from the unexpected acceptance of a far-reaching referendum in Switzerland, KOF Working Papers, No.406, ETH Zurich, KOF Swiss Economic Institute, Zurich. Kumar, R. & Pankaj, V. (2009). The Global Economic Crisis: Impact on India and Policy Responses, ADBI Working Paper, No. 164, Asian Development Bank Institute, Tokyo. Li H, Cui L. (2003). Empirical study of capital structure on agency costs in Chinese listed firms. Nature and Science,1(1), 12-20. Marconi, D & Christian, U. (2017). Capital misallocation and financial development: a sector-level analysis, Number 1143 - October 2017, Bank of Italy. Martinez-Carrascal, C. & Ferrando, A. (2008). The impact of financial position on investment: An analysis for non-financial corporations in the Euro Area. ECB Working Paper Series, 943. Modigliani, F. & Miller, M. H. (1963). Corporate income taxes and the cost of capital: A correction, American Economic Review, 53(3), 437–434. Morgan, W.D & Mercer, L. J. (1972). The American Automobile Industry: Investment Demand, Capacity, and Capacity Utilization, 1921-1940, Journal of Political Economy, 80(6), 1214-1231 Myers, S. C. (1977). Determinants of corporate borrowing, Journal of Financial Economics, 5(2),147–175. Nagaraj, R. (2013). India's Dream Run, 2003-08: Understanding the Boom and its Aftermath. Economic & Political Weekly, XLVIII (20), 39-51. Patnaik, I., & Pandey, R. (2019), Savings and capital formation in India, NIPFP Working Paper (No. 19/271). Nunes P. J. M., Serrasqueiro Z. M. & Sequeira T. N. (2009). Profitability in Portuguese service industries: a panel data approach, The Service Industries Journal, 29(5), 693-707. Pal, R. & Ferrando, A. (2010). Financing constraints and firms cash policy in the euro area, The European Journal of Finance, 16(2),153–171. Phan,Q.T. (2018). Corporate debt and investment with financial constraints: Vietnamese listed firms, Research in International Business and Finance, 46, 268–280. RBI (2018), Monetary Policy Report, October. Reinhart, C & K Rogoff (2009). This time is different. Eight centuries of financial folly, Princeton University Press. Shukla, A.K. & Shaw, T. S. (2020). Impact of Leverage on Firms’ Investment: Decoding the Indian Experience, Reserve Bank of India working paper, no.7. Sony, B & Bhaduri, S. (2021). Information asymmetry and financing choice between debt, equity and dual issues by Indian firms, International Review of Economics and Finance,72, 90–101. Van Rixtel, A. & Villegas, A. (2015). Equity issuance and share buybacks, BIS Quarterly Review, March, 28–29. Vermeulen, P. (2002). Business fixed investment: Evidence of a financial accelerator in Europe, Oxford Bulletin of Economics and Statistics, 64(3), 217–235. World Bank (2010). The Impact of the Global Financial Crisis on Investments in the Electric Power Sector: The Experience of India, Pakistan, and Bangladesh - Final Report. No. 56849-SAS, World Bank. https://openknowledge.worldbank.org/handle/10986/2919 Zhang, H. & Li, S. (2008). The Impact of Capital Structure on Agency Cost: Evidence From UK Public Companies. Proceedings of the 16th Annual Conference on Pacific Basin Finance Economics Accounting Management, PBFEAM Conference.
Annex | Table A1: Estimated Coefficients of Baseline Accelerator Model | | | β1 | β2 | β3 | β4 | β5 | β6 | β7 | β8 | ∑β# | | Coefficient | 0.322***
(0.001) | 0.260***
(0.001) | 0.210***
(0.001) | 0.131**
(0.006) | 0.106**
(0.105) | 0.083
(0.201) | 0.067
(0.261) | 0.075
(0.062) | 10.56**
(0.00) | | R square | 0.28 | 0.18 | 0.12 | 0.05 | 0.04 | 0.02 | 0.01 | 0.01 | | Note: Dependent variable: change in gross fixed capital formation. Estimation results of the baseline accelerator model using 8 quarterly lags of change in output. Values in parenthesis indicate p-values and **** and ** denote the significance at 1 per cent, 5 per cent, respectively. #The Wald test suggests that the sum of the coefficients is significant at 1 per cent level. The value of t-statistic is indicated in the last column. Estimations are performed using quarterly data for the period 1998Q1 to 2019Q4.
Source: Authors’ calculations. | Estimated coefficients of the baseline accelerator model are presented in Table A1. Many of the coefficients of the lagged output variables and the sum of the coefficients are statistically significant meaning that it is supported by the accelerator hypothesis. | Table A2: Estimated coefficients of Augmented Accelerator Models | | Model 1 | Model 2 | Model 3 | | Variables | Coeff. | Variables | Coeff. | Variables | Coeff. | | Constant | 0.258*** | Constant | -0.442*** | Constant | 0.261*** | | Output | 0.529*** | Output | 0.506*** | Output | 0.527*** | | ICR | 0.016*** | Capacity Utilisation | 0.006*** | ICR | 0.016*** | | Profitability | -0.014*** | Policy uncertainty | 0.001*** | Profitability | -0.014*** | | Credit Growth | -0.004*** | Short term rate | 0.001 | Credit Growth | -0.004*** | | | | Market Volatility | 0.001 | Stalled investment | -0.039 | | R-Square | 0.520 | | 0.480 | | 0.520 | Note: Dependent variable: investment and independent variables are different combinations of financial and market variables in different models. **** and ** denote the significance at 1 per cent and 5 per cent respectively.
Source: Authors’ calculations. | The estimated coefficients of the augmented accelerator models are shown in Table A2. This approach establishes the fact that the investment dynamics are not only explained by output, but financial variables also have a major role in investment. | Table A3: Descriptive Statistics (Annual Data) | | Statistics | Gross Investment | Net Investment | Cash Holdings | Total Assets | Debt to Equity | Debt to assets | ICR | DSCR | Profitability | | Mean | 1078333.0 | 770565.0 | 110403.7 | 2204033.0 | 57.290 | 20.771 | 2.745 | 0.260 | 0.091 | | Median | 267043.5 | 189606.5 | 14065.9 | 393095.0 | 53.058 | 19.479 | 2.107 | 0.248 | 0.090 | | Maximum | 5862554.0 | 4094665.0 | 545313.0 | 12671210.0 | 99.698 | 28.859 | 6.718 | 0.419 | 0.128 | | Minimum | 14423.0 | 7924.3 | 863.9 | 21771.9 | 37.131 | 11.232 | 1.441 | 0.146 | 0.047 | | Std. Dev. | 1698475.0 | 1229081.0 | 173889.3 | 3688797.0 | 17.789 | 4.881 | 1.466 | 0.065 | 0.018 | | Skewness | 169.4 | 167.9 | 143.3 | 172.8 | 1.250 | 0.059 | 1.485 | 0.747 | -0.036 | | Kurtosis | 448.2 | 440.5 | 350.1 | 458.8 | 3.637 | 2.003 | 4.120 | 3.058 | 2.890 | Note: Amounts are in Rs. Crore. Data coverage is from 1980-81 to 2018-19. Net investment is gross investment minus depreciation.
Source: Authors’ calculations. |
| Table A4: Descriptive Statistics (Quarterly Data) | | | Business Expectations | Inflation Expectations | Policy Uncertainty | Capacity Utilisation | Change in Investment | Change in Output | Change in stalled
investment | Change in Volatility | Call Rate | Credit Growth | ICR | Profitability | | Mean | 114.9 | 12.5 | 106.1 | 74.3 | 0.013 | 0.018 | 0.038 | 0.766 | 6.6 | 13.0 | 1.8 | 6.7 | | Median | 114.7 | 10.1 | 94.5 | 74.0 | 0.010 | 0.020 | 0.021 | -0.460 | 6.7 | 12.5 | 1.7 | 6.6 | | Maximum | 126.5 | 121.5 | 234.5 | 82.7 | 0.109 | 0.097 | 0.415 | 60.883 | 9.5 | 27.2 | 2.5 | 10.6 | | Minimum | 96.4 | 5.3 | 39.9 | 68.6 | -0.092 | -0.081 | -0.123 | -17.230 | 3.2 | 4.0 | 1.3 | 0.8 | | Std. Dev. | 5.4 | 16.3 | 46.6 | 3.2 | 0.051 | 0.045 | 0.096 | 10.184 | 1.6 | 5.5 | 0.3 | 2.2 | | Skewness | -0.7 | 6.5 | 1.1 | 0.5 | -0.144 | -0.414 | 1.493 | 4.292 | -0.5 | 0.6 | 0.6 | -0.4 | | Kurtosis | 5.3 | 43.9 | 3.8 | 2.9 | 2.369 | 2.452 | 6.691 | 26.736 | 2.6 | 2.9 | 2.3 | 3.3 | Note: Data coverage is from 2008Q1 to 2019Q4.
Source: Authors’ calculations. |
| Table A5: Variables- Definitions and Source of Data | | Sr. No | Variables | Definition | Source | | 1 | Annual data (1980-81 to 2018-19) | | 1.1 | Net Investment | Gross fixed assets – Depreciation | DBIE, RBI | | 1.2 | Debt to equity | Debt (long-term)/ Equity | DBIE, RBI | | 1.3 | Debt to asset | Debt (long-term)/Total assets | DBIE, RBI | | 1.4 | Interest coverage ratio (ICR) | Earnings Before Interest and Taxes (EBIT)/Interest expenses | DBIE, RBI | | 1.5 | Debt service coverage ratio (DSCR) | EBIT/Debt | DBIE, RBI | | 1.6 | Cash holdings | (Cash in hand+ fixed deposit with banks+ other bank balances) | DBIE, RBI | | 1.7 | Size of the company | Log (total assets) | DBIE, RBI | | 1.8 | Stalled projects* | Projects which are stalled during the implementation phase | CMIE, capex | | 2 | Quarterly data (2008: Q1 to 2019: Q4) | | | 2.1 | Investment | Change in real gross fixed capital formation (GFCF) | DBIE, RBI | | 2.2 | Policy uncertainty | Economic policy uncertainty index based on news and other policy related information | https://www.policyuncertainty.com/ | | 2.3 | Business expectations | Business expectations index based on qualitative assessments of the business climate by companies in India’s manufacturing sector | DBIE, RBI | | 2.4 | Inflation expectations | 1-year ahead inflation expectations by household surveys conducted in 18 major cities in India | DBIE, RBI | | 2.5 | Capacity Utilisation | Capacity Utilisation in per cent based on Order Books, Inventories and Capacity Utilisation Survey (OBICUS) for manufacturing companies in India. | DBIE, RBI | | 2.6 | Profitability | Profit after tax (PAT)/Income | CMIE, Prowess | | 2.7 | Interest coverage ratio (ICR) | PBIT/ Interest expenses | CMIE, Prowess | | 2.8 | WACMR | Weighted average call money rate | DBIE, RBI | | 2.9 | Term spread | Quarterly change in the difference between the 10-year government bond yield minus the 3-month treasury bill rate | Bloomberg | | 2.10 | Market volatility | Quarterly change in VIX index | Bloomberg | | 2.11 | Credit growth | Non-food credit growth | Data warehouse, RBI | | 2.12 | Investment Intentions | Filing of proposed Industrial Investments | https://dipp.gov.in/GOI | | Note: *Stalled projects data is for the period 2008-09 to 2019-20. | |