Press Release RBI Working Paper Series No. 12 Bank Capital and Monetary Policy Transmission in India Silu Muduli and Harendra Behera@ Abstract *This paper examines the role of bank capital in monetary policy transmission in India during the post-global financial crisis period. Empirical results show that banks with higher capital to risk-weighted assets ratio (CRAR) raise funds at a lower cost. Additionally, banks with higher CRAR transmit monetary policy impulses smoothly, while stressed assets in the banking sector hinder transmission. Recapitalization to raise CRAR can improve transmission; however, CRAR above a certain threshold level may not help as the sensitivity of loan growth to monetary policy rate reduces for banks with CRAR above the threshold. Therefore, it can be concluded that monetary policy can influence credit supply of banks depending on their capital position. JEL Classification: E44, E51, E52 Keywords: Monetary policy transmission, bank capital and bank lending Introduction The degree and speed of monetary policy transmission have been debated over the years in India. Banks often face many structural and frictional issues which dampen the transmission of monetary policy. The impediments to transmission are many, but the scourge of high non-performing assets (NPAs) of banks has played a major role in blocking the transmission. In an environment of sustained asset quality stress impacting the capacity of banks to lend, the government has infused capital in public sector banks to improve their capital position and facilitate credit extension. The RBI has also deferred the implementation of the last tranche of Capital Conservation Buffer (CCB) up to April 1, 2021 to provide some respite to banks facing difficulty in raising additional capital in a situation of already high provisioning requirements due to asset quality corrosion. Though these measures have helped some public sector banks to come out of regulator’s critical purview, the bank credit grew by only 13.4 per cent in 2018-19 and 6.1 per cent in 2019-20. Set against the above background, it is important to examine whether bank capital matters at all in altering monetary policy transmission in India. The recent literature recognised that the health and the behaviour of the banking sector can alter the monetary policy effects on growth and inflation (Gambacorta & Shin, 2018; Markovic, 2006; Van den Heuvel, 2002). There are two different ways in which the bank capital can change the impact of monetary policy shocks on credit supply – (a) bank lending channel, and (b) bank capital channel. The bank lending channel operates through monetary policy shocks directly impacting the supply of bank credit and thereby the real economy. For example, a contractionary monetary policy by reducing the availability of funds with the banks may force them to readjust their portfolio by reducing their loan supply. However, the bank lending channel turns ineffective when bank equity is at or below the regulatory minimum level for a sizeable fraction of banks (Bernanke et al., 1991; Kashyap & Stein, 1995). This is because the banks cannot expand credit even in the context of monetary easing if they do not have an adequate level of capital, as their ability to lend is linked to maintenance of risk-based capital requirements. According to Van den Heuvel (2002), “...bank equity can affect the strength of the lending channel is by mitigating the adverse-selection or moral-hazard problems in the market for non-reservable bank liabilities”. Therefore, bank capital matters in monetary policy transmission. Thus, the bank capital channel explains how monetary policy can affect bank lending based on the overall capital position of a bank. Particularly, in a monetary policy tightening phase, firms may not finance their projects with a lower internal rate of return. Also, the value of marketable collaterals of firms may fall. As a result, the banks may reduce their lending to these firms, which adversely affect their profits with a lag. Additionally, monetary policy tightening may increase bank’s short term borrowing cost and reduce its interest margin as it adjusts interest rate with lag (i.e., interest rates on outstanding loan contracts are sticky) (Bhatia, 2019). As retained earnings are part of Tier I capital in Basel III regulation, a reduction in profits of a bank may affect the growth of its equity capital and increase the likelihood of hitting the binding capital constraint. In such a case, banks may either have to raise fresh equity capital or reduce their loan supply to private sectors. Hence, an increase in the policy interest rate leads to a contraction in lending by banks. The bank capital channel of monetary policy transmission also works indirectly by impacting the cost of funds for the banks. The sensitivity of the cost of funds to bank capital determines the effectiveness of monetary policy transmission through this channel. A fall in cost of funds due to a rise in bank capital followed by monetary easing could help banks to increase their credit supply. While the bank lending channel of monetary policy is extensively examined in the literature, there are only a few studies in the context of the bank capital channel (e.g. Van den Heuvel, 2002; Gambacorta & Shin, 2018; Carlson & Warusawitharana, 2013; Bhatia, 2019). To the best of our knowledge, there is only one study in the Indian context that examines the bank capital channel of monetary policy transmission (i.e. Bhatia, 2019). In this paper, we try to empirically examine the benefits of bank capital, specifically capital to risk-weighted assets ratio (CRAR), in banks’ lending behaviour in the presence of the NPAs. In line with Gambacorta & Shin (2018), our study portrays the impact of bank capital on banks’ cost of funds and then examines whether the lower cost of funds enable well-capitalised banks to extend more credit. Moreover, this study also reflects on the bank capital channel of monetary policy transmission by incorporating the NPAs of banks in India. The paper is organised as follows. The next section discusses the literature on bank capital channel of monetary policy transmission along with a brief overview of bank capital regulation in India. A basic model has been presented in Section III to explain the role of equity in the credit expansion. Data, methodology and empirical results are set out in Sections IV and V. Concluding observations are discussed in Section VI. II. Related Literature The bank lending channel of monetary policy transmission stands on the view that central banks can alter the banks’ credit supply by tightening monetary policy either through increasing reserve requirement or raising short term interest rate. This can cut down access to loanable funds and reduce loan extension by the banks. Although this channel looks straightforward, sometimes certain regulatory frameworks imposed by regulators add frictions for this channel. One of them is Basel capital regulation in 1988. Over time, several amendments have been made to this regulation such as Basel I, Basel II, and Basel III. Under the current Basel III regulation, banks are advised to maintain 8 per cent CRAR and 2.5 per cent CCB during normal business cycle phases. Van den Heuvel (2002) argues that in the presence of capital regulation when a central bank goes for expansionary monetary policy by reducing policy rate, banks with the binding capital requirement may not channelize those additional reserves to the private sector by extending credits. According to his argument, when banks extend credit to risky private sector, the risk-weighted assets increase and lead to lower CRAR. Since banks face binding capital constraint, they will fall short of regulatory capital requirement. Instead of lending to the private sector, banks will search for risk-free investment in government bonds. This argument is known as the capital threshold effect1 (Borio & Zhu, 2012). This effect weakens the bank lending channel of monetary policy transmission. Banks with higher CRAR are expected to transmit monetary policy smoothly relative to banks with lower CRAR. Weakly capitalised banks also find it difficult to extend credit during a monetary tightening phase because of binding capital constraint and rise in funding costs. Therefore, the pace of transmission is expected to be higher for weakly capitalised banks during monetary tightening phase while the opposite is likely to be the case in the monetary easing cycle. Banks can raise funds by selling bonds, certificate of deposits (CDs) etc. in the capital market and thereby can meet the funding requirement from the market when the central bank money turns costlier (Kashyap & Stein, 1995). Bank capital plays an important role in reducing the cost of these funds by reducing the external risk premium. It is expected that banks with less leverage are likely to face lower external risk premium and vice-versa. Gambacorta & Shin (2018) find evidence of a lower risk premium for less leveraged banks for fourteen developed countries. After the Basel Accord 1988, CRAR became one important indicator of a bank’s stability. Banks with adequate capital ratio can raise funds with less cost and hence could maintain high loan growth (Admati & Hellwig, 2014; Ellis & Flannery, 1992). For instance, Altunbas et al. (2010) note that banks with higher capital have lower credit risk, hence face a lower risk premium. Carlson et al. (2013) establish a non-linear association between bank lending growth and capital for U.S. banks. They find that banks with relatively lower capital ratio have a higher elasticity of lending growth to capital ratio establishing the differentiated impact of bank capital. Thus, bank capital being a buffer against losses helps the bank to raise funds with less risk premium and unlock the lending channel (Kishan & Opiela, 2006). Besides the bank-specific characteristics, macroeconomic cycles also play an important role in raising funds by a bank. It is always expected that for a stable financial system, banks’ equity should be positively associated with real GDP growth. Opposite relationship may hold when banks adjust their payments for smoothing book value of equity (Adrian et al., 2015; Gambacorta & Shin, 2018). Thus, the monetary policy transmission under the bank capital channel might be impacted by the macroeconomic conditions. The bank lending channel supports the need for higher capital above the regulatory requirement. At the same time, as found by Carlson et al. (2013), the loans of banks with CRAR around the capital requirement are sensitive to bank capital adjustments. These two views bring the notion of optimal capital ratio. This optimal capital may not be static and may change along with the business cycle (Estrella, 2004). During boom phases, the profitability of banks may increase, which in turn may increase the retained earnings. Since retained earnings is a part of regulatory capital, this increase in the capital of banks helps in higher credit expansion. While in recession, it may work in reverse direction. During a recession, capital may decline or banks may need to keep provisions for expected future defaults. Therefore, banks with momentarily binding capital requirement may fall short of capital. Moreover, during this phase, raising equity also becomes costly. Therefore, this cyclical nature of capital makes it an “automatic destabiliser” (Van den Heuvel, 2002). From the perspective of leverage, during boom phases banks may borrow to extend credit. Therefore, leverage might be cyclical. While Adrian et al. (2015) argue that instead of extending credit in the boom phase, banks may pay-out some debt liabilities (by reducing equity) to lessen the leverage. In this particular case, leverage might become countercyclical or acyclic. Another friction that may come into play in determining the cyclical behaviour is relationship lending and loan commitment (Bolton et al., 2016; Thakor, 2005). Using a theoretical model, Bolton et al. (2016) show that despite the decline in equity during a recession, banks may not cut lending to their borrowers in relationship-based lending. In the Indian context, the relationship-based lending insulates borrower even during tighter phase of monetary policy (Bhardwaj et al., 2015). These commitments to borrowers open up another new arena to look at bank lending from the bank capital perspective. Because of banks’ commitment to their borrowers to lend, banks with higher capital can borrow through external financing route to retain their creditworthy borrowers, even during monetary tightening. Thus, capital helps in preserving the credit culture by retaining good borrowers. To meet the credit demand for both relationship-based and transaction-based borrowers, bank capital is crucial in raising external funds. In the Indian context, studies on monetary policy transmission have mainly focused on interest rate, credit, asset price, and exchange rate channels (Kapur & Behera, 2012; Khundrakpam & Jain, 2012). Mishra et al. (2016) present evidence on the existence of the credit channel in monetary policy transmission; however, they do not find any evidence on other channels. Our study will revisit the credit channel with capital and NPAs as explanatory variable. Pandit et al. (2006) in their study found the existence of the credit channel through both interest rate and cash reserve ratio (CRR). Moreover, they find public sector banks to be more active in transmitting policy shocks than the private and foreign banks. From the bank capital channel perspective, the authors provide evidence that banks with higher CRAR extend less credit. This finding contradicts the argument provided for the bank lending channel. However, they did not incorporate the bank lending channel from banks’ fundraising perspective. In this paper, we try to fill this gap by bringing the role of CRAR as well as NPAs in raising funds from the capital market and loan growth for banks operating in India. II.1 Capital Regulation and Bank Behaviour in India Before examining the role of bank capital in monetary policy transmission, we provide a few stylized facts on bank capital regulation in India. At the time when Basel II was on the verge of its implementation in major economies, the financial crisis hit the globe and brought adverse shocks in its path of implementation. After the global financial crisis, the Basel Committee on Banking Supervision (BCBS) amended Basel II and came up with Basel III capital regulation. Basel III recommended maintaining 8 per cent CRAR as Basel II but modified the definitions of Tier 1 and Tier 2 capital. Tier 1 capital, also known as going concern capital, absorbs bank’s losses with the continuation of its activity. While Tier 2 capital is gone concern capital, i.e., it absorbs losses when the bank seizes its business activities. In India, Basel III implementation started from April 1, 2013. Instead of 8 per cent, the RBI recommended 9 per cent of CRAR, 2.5 per cent of CCB, and countercyclical capital buffer of 0-2.5 per cent. As of date, 1.875 percentage points of CCB has been met out of 2.5 per cent, and the last tranche has to be maintained by April 1, 2021. Looking back to the past CRAR maintained by banks in India, the left side plot in Figure 1 shows the Kernel density plot of CRAR for banks in our sample from 2009 onwards. Till 2013, CRAR has been taken as per the Basel II norms, and 2014 onwards as per Basel III norms. In the density plot, all the banks in our sample have CRAR of above 8 per cent as recommended by BCBS. After 2013, there was a downward shift in distribution towards left. This may be due to the adoption of Basel III and consequent revision in the calculation of Tier 1 and Tier 2 capital, and exemption of capital that earlier was included against market risks. At the same time, it can be observed that the range of CRAR distribution has increased and it is mostly bi-modal. This implies that it is at the binding level for some banks and excess for others. This is visible on the right side of the plot (Figure 1b). In this plot, CRAR distribution of public sector banks and private sector banks are fully clustered in extremes, and foreign banks have distribution lying in these two extremes. Public sector banks are maintaining CRAR near requirement as prescribed by the regulator, while private sector banks have excess CRAR. If the bank lending channel arguments hold, one can raise a question, whether this excess capital in private sector banks’ balance sheet helps in smoother transmission of monetary policy? 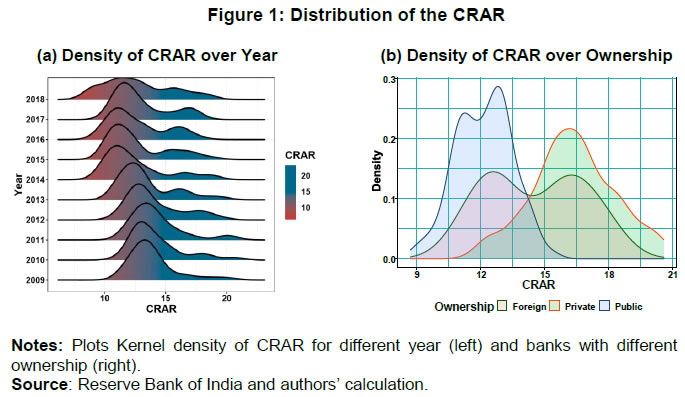 At the economy level, the RBI has followed an easy monetary policy since January 2014 by reducing policy rate (except a monetary policy rate hike in August 2018) and to provide more liquidity to the banking system through reduction in statutory liquidity ratio (SLR). However, Figure 2 shows that credit growth has not picked up with the adopted expansionary monetary policy during this period. This signals weakening of bank lending channel of monetary policy transmission. This evidence for India looks similar to that of the United States in the early 2000s (Kishan & Opiela, 2006). This type of unconventional behaviour of credit growth is explained by Kashyap & Stein (1995) through the cost of raising non-deposit contracts in an imperfect capital market. According to their argument, raising capital in an imperfect capital market may be costly for banks; therefore, banks may not meet all the credit demand arising from the real sector. This led to lower credit growth. Watanabe (2007) corroborates this view for Japanese banks and finds that one per cent short-fall in bank capital reduces credit growth by 2.8 per cent. This important observation needs to be examined in the Indian context to know whether the cost of funds lock the bank lending channel. This will bring the role of bank capital in liquidity creation and transmission of monetary policy. In this paper, we examine the role of bank capital in monetary policy transmission in India. 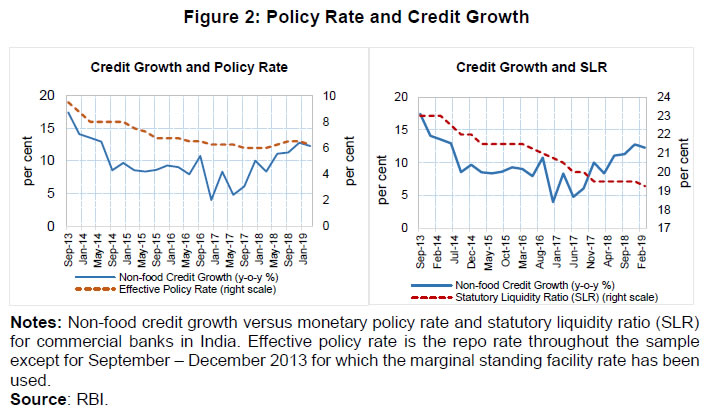 III. The Model An increase in funding cost through external interest rate i decreases the credit growth. As the cost of funds increases, for given two independent projects banks extend less credit to maximize the pay-off. Part of this cost of funds is determined by the monetary policy rate. When the central bank raises the interest rate, it gets transmitted to the short-term money market, and in turn, raises the cost of funds for the bank. Additionally, other bank-specific characteristics influence i in terms of risk premium. One of these characteristics is capital. It is expected that a bank with higher capital is expected to face a lower risk premium. This will be examined empirically for Indian case whether well-capitalized banks face a lower cost of funds. Binding Capital Constraint In case of binding regulatory constraint, μ > 0 and k(w1k1+ w2k2) = e. the first-order conditions are: IV. Empirical Analysis We have used panel regressions - both dynamic panel model and fixed effect panel threshold model - to study the role of bank capital in monetary policy transmission in India. We start the empirical analysis by documenting a few stylised facts. First, we look at the descriptive statistics to understand the nature of bank capitalisation and asset quality of banks. Second, we examine whether bank capital reacts to variation in business cycles. As discussed earlier, the macroeconomic situation can influence monetary policy transmission by impacting bank equity. Therefore, it is important to know the nature of bank capital, i.e., whether procyclical or countercyclical. IV.1. Dynamic Panel Regression To examine the procyclical hypothesis, we use a dynamic panel model as proposed by Arellano & Bond (1991). Formally, IV.2. Threshold Regression We employ fixed-effect panel threshold regression model (Hansen, 1999; Wang, 2015) to estimate the threshold level of GNPA, CRAR and TA/CE (total assets to total common equity ratio). Formally, the model is represented by: Corresponding to the above hypothesis, a F-test is undertaken for inference. This F-statistics also follows a non-standard distribution. Hansen (1996) developed a bootstrapping method for estimation of F value and test the hypothesis. IV.3 Data Description The paper uses annual data for the period 2008-09 to 2017-18, taken from the Database on Indian Economy of the Reserve Bank of India (RBI). The sample consists of bank-level profit/loss account and balance sheet data. Top 30 banks (21 public sector banks, 7 private banks, and 2 foreign banks), constituting 91 per cent share in total bank loans and advances during 2017-18, are chosen for the analysis. Of which, 74 per cent of total credit is by public sector banks, 16 per cent by private sector banks, and 1 per cent by foreign banks. CRAR values for 2009-2013 are as per the Basel II norms, and from 2014 onwards are as per Basel III norms. For business cycle proxy, Hodrick-Prescott filtered based GDP cycle has been used. Summary statistics of the panel of 30 banks for the 10 years has been shown in Table 1. The average CRAR level of banks in the sample has been remained around13.30 per cent, above the regulatory requirement of 9 per cent. Gross non-performing assets (GNPA) ratio has been positively skewed with a mean 5.39 per cent, implying the majority of the banks have GNPAs below the mean level over the sample period. A very high standard deviation of GNPA indicates the diverse nature of asset quality across banks. The average cost of funds (defined by interest paid to debt outstanding) for the banks remains around 6 per cent. | Table 1: Summary statistics | | Variable | Observations | Mean | Std. Dev. | Skewness | Kurtosis | | Total Assets (in Crore) | 300 | 463.19 | 546.77 | 2.73 | 12.84 | | CRAR (in per cent) | 300 | 13.30 | 2.36 | 0.82 | 3.23 | | GNPA Ratio (in per cent) | 300 | 5.39 | 5.35 | 1.76 | 5.72 | | Leverage (Debt/ Total Assets) | 300 | 0.88 | 0.06 | -2.47 | 9.66 | | Loan Growth Rate | 270 | 0.12 | 0.12 | 0.00 | 4.41 | | Borrowing Growth Rate | 270 | 0.17 | 0.40 | 0.42 | 6.03 | | Cost of Debt Funding | 300 | 0.06 | 0.01 | -0.44 | 3.08 | Hypotheses for the bank capital channel are examined as follows. First of all, we examine whether banks extend credit through borrowing (issuing new debt) or through their excess capital. In case banks extend credit by borrowing, whether higher capital helps in lowering the cost of funds (debt funding) and hence they borrow more to extend credit. Finally, we examine how monetary policy affects the loan growth rate through this channel, and estimate the threshold level of CRAR that facilitates smooth transmission of monetary policy. IV.4. Business Cycle and Bank Equity A bank can finance its lending by issuing new debt or with excess equity capital. If banks issue new debt to finance their credit, then leverage (defined by total debt to total assets ratio) should be procyclical. Otherwise, if they finance through excess capital, then equity should be procyclical. These two hypotheses are examined for the overall sample as well as for sub-sample covering only public sector banks (Table 2). Negative and statistically significant coefficients of the output gap (in columns 2 and 4) suggest that bank capital is countercyclical. On the other hand, a positive and statistically significant coefficient of output gap with leverage (in column 3) indicates that leverage is procyclical for the overall sample. In the case of public sector banks, leverage is not sensitive to the business cycle. As asset quality deteriorated and banks were required to maintain higher provisioning during the time period considered for our analysis, it is important to know how it has impacted the equity growth of banks while examining the sensitivity of equity to the business cycle. Empirical results show that asset quality deterioration (i.e., GNPA ratio) is positively associated with equity growth. This positive association may be due to higher provisioning requirement and recapitalisation efforts of the government for public sector banks, which accounts for 70 per cent of the sample. The overall results suggest that equity is countercyclical and leverage is procyclical. Given the fact that Indian banking system is dominated by public sector banks and they do not have excess capital as given in Figure 1, it is difficult for them to extend credit without improving their capital position during the downturn of the current business cycle. Also, the countercyclical nature of capital provides evidence that the banks are trying to raise capital to meet provisioning requirements during the downturn. Thus, the loan growth by the banks might depend on their ability to raise fund by issuing debt contracts in the capital market to meet the credit demand. A procyclical nature of leverage suggests that banks finance their lending by issuing debt. Hence, we examine whether capital helps the bank in raising external fund by lowering their cost of funds. | Table 2: Business cycle and bank equity | | Dependent Variable | Overall Sample | Public Sector Banks | | ∆log(Equity) i,t | Leverage i,t | ∆log(Equity) | Leveragei,t | | ∆log(Equity) i,t-1 | -0.0857*** | | -0.0118 | | | | (0.00400) | | (0.0156) | | | Output Gapt | -0.0438*** | 0.000730** | -0.0470*** | -0.000392 | | | (0.00470) | (0.000298) | (0.00664) | (0.000538) | | GNPA Ratio i,t-1 | 0.0147*** | -0.0000772*** | 0.0140*** | -0.000117*** | | | (0.000348) | (0.0000119) | (0.000433) | (0.0000206) | | Leverage i,t-1 | | 0.906*** | | 0.612*** | | | | (0.00306) | | (0.0638) | | Constant | 0.00576*** | 0.0863*** | -0.00166 | 0.356*** | | | (0.00213) | (0.00251) | (0.00313) | (0.0585) | | N | 240 | 270 | 168 | 189 | | AR1 p-value | 0.007 | 0.005 | 0.008 | 0.0003 | | AR2 p-value | 0.0764 | 0.980 | 0.0853 | 0.0535 | | Hansen J-Test p-value | 0.730 | 0.803 | 0.968 | 0.953 | | Note: The figures in parentheses are standard errors. * p < 0.1, ** p < 0.05, *** p < 0.01 | IV.5. Bank Capital and Cost of Funds In this section, we examine the role of equity (CRAR) in cost of debt funding. Particularly, we try to test whether a rise in equity or a fall in leverage leads to a reduction in the cost of funds for banks. The debt funding includes the deposits and other borrowings (such as bond, interbank borrowings, etc.). In line with Gambacorta & Shin (2018), we measure the cost of funds by using the following formula: Interest expenses used in the analysis are the sum of interests paid on deposits, RBI/ interbank borrowings, and others. The following model has been estimated to examine the impact of CRAR on cost of funds.  where xi,t are control variables. Before proceeding to empirical exercise, we have provided the relationship between the cost of funds and CRAR in the form of a scatter plot in Figure 3. The plot shows a negative relationship between CRAR and cost of funds for three ownership structure (public, private, and foreign). Slopes for public sector and private sector banks look almost similar though it is relatively flat for the latter. Also, the clustering is observed for all the three ownership categories, which suggests for controlling bank-specific fixed effects in the empirical analysis to establish a robust relationship between cost of funds and CRAR. Additionally, we consider the policy interest rate as an explanatory variable as a rise (fall) in policy rate raises (reduces) cost of funds. Lagged dependent variable is included in Equation (9) to make errors free from serial correlation. A dynamic panel GMM model has been employed to provide efficient and consistent estimators of the above model (Arellano & Bond, 1991). The estimated results are presented in Table 3. The results show that a tight monetary policy leads to higher cost of funds. An increase in leverage raises the cost, while a rise in capital position of banks as captured in CRAR reduces the cost. Results are in line with the literature which suggests that well-capitalised banks with lower leverage face a lower cost of funds (Altunbas et al., 2010). This is one of the benefits that banks enjoy from maintaining high capital. Hence, it can be argued that banks should maintain higher capital to reap the benefits of lower cost of debt funding. 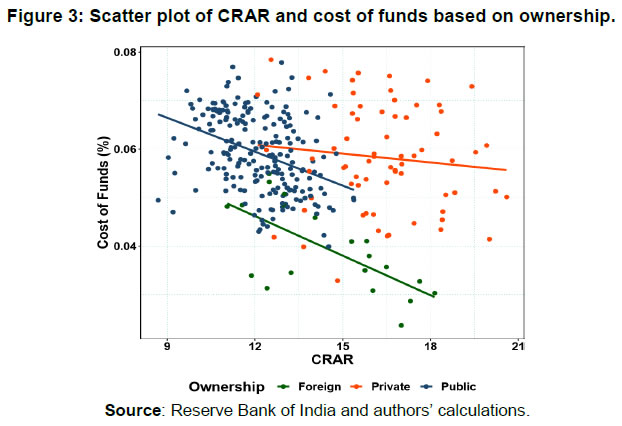 In the case of public sector banks, the sign of the CRAR coefficient is positive but statistically insignificant. This result is in contrast to what can be viewed from Figure 3 and possibly reflects the rise in the capital because of a deterioration in the asset quality of the public sector banks. To remove this endogeneity, we controlled the asset quality issue by interacting GNPAs with CRAR in a threshold regression. The estimated threshold regression results imply that an increase in CRAR reduces the cost of funds for public sector banks. A similar result is also found for the overall sample though the sensitivity of CRAR is higher for public sector banks as compared to all banks in our analysis. Moreover, the sensitivity of CRAR to cost of funds is higher if the banks have a large amount of stressed assets. Particularly, for banks having GNPA ratio above 4.98 per cent (6.54 per cent for public sector banks), a rise in CRAR could result in a significant reduction in costs. This implies that the market upgrades a severely stressed bank by observing an improvement in its capital position, which rewards the bank in the form of a reduction in its risk premia. | Table 3: CRAR and cost of funds | | Dependent Variable | Overall Sample | Public Sector Banks | | Cost of Funds i,t | Cost of Funds i,t | Cost of Funds i,t | Cost of Funds i,t | Cost of Funds i,t | Cost of Funds i,t | | Cost of Fundsi,t-1 | 0.442*** | 0.445*** | 0.229*** | 0.407*** | 0.535*** | -0.0696 | | | (0.00854) | (0.0131) | (0.0718) | (0.0255) | (0.0125) | (0.0858) | | CRAR i,t-1 | -0.000503*** | | | 0.0000920 | | | | | (0.0000369) | | | (0.000113) | | | | Monetary Policy Rate i,t-1 | 0.00241*** | 0.00240*** | 0.0315*** | 0.00453*** | 0.00284*** | 0.00289*** | | | (0.0000521) | (0.0000603) | (0.00263) | (0.0000814) | (0.0000770) | (0.000316) | | Leverage i,t-1 | | 0.0315*** | | | -0.0452 | | | | | (0.00263) | | | (0.0388) | | | CRA i,t-1× IGNPA≤γ | | | -0.000597* | | | -0.00126*** | | | | | (0.000338) | | | (0.000387) | | CRARi,t-1× IGNPA>γ | | | -0.000883** | | | -0.00170*** | | | | | (0.000364) | | | (0.000419) | | Constant | 0.0227*** | -0.0118*** | 0.0420*** | 0.00365 | 0.0495 | 0.0607*** | | | (0.000960) | (0.00232) | (0.00669) | (0.00305) | (0.00235) | (0.00788) | | N | 270 | 270 | 270 | 189 | 189 | 189 | | AR(1) Test p-value | < 0.01 | < 0.01 | | < 0.01 | < 0.01 | | | AR(2) Test p-value | 0.328 | 0.268 | | 0.541 | 0.599 | | | Hansen J-Test p-value | 0.801 | 0.436 | | 0.611 | 0.874 | | | Threshold Effect Test p-value | | | 0.07 | | | < 0.01 | | Threshold Value (γ) | | | 4.98 | | | 6.54 | | R2 | | | 0.41 | | | 0.30 | | Note: The figures in parentheses are standard errors. * p < 0.1, ** p < 0.05, *** p < 0.01 | All the above evidences justify the benefits of implementing public sector recapitalisation policy to revive the health of the banking sector. This result goes in line with the argument from the risk-taking channel perspective by Altunbas et al. (2012), in which capital may be enough to absorb losses of banks in case banks have excessive stressed assets in their balance sheets. Therefore, additional capital is required to improve the health of bank balance sheet. Thus, capital infusion by the government can reduce the cost of debt and may help banks to meet the credit demand by raising debt at lower cost. In such a scenario, it is important to see whether a well-capitalised bank finds it easy to borrow externally to extend loans. In the following sub-section, we examine the effect of CRAR and GNPAs on bank borrowings from the capital market. This evidence will establish the hypothesis that banks with higher CRAR borrows more to extend more credit. IV.6. Do Well-capitalised Banks get more funding? The objective of maintaining CRAR is to make a bank healthier to sustain in a risky environment. Therefore, investors buy debt contracts from this type of banks with less risk premium, which subsequently helps the banks to meet the excess credit demand by selling debt contracts with lower costs. At the same time, a bank with eroded balance sheet finds it difficult to raise funds from the market with rise in risk premia as well as market participants avoiding such banks to invest or deposit money in that bank. Therefore, we investigate whether banks with higher CRAR or lower GNPA have higher debt growth. The relationship between annual debt growth and CRAR as well as GNPAs is examined by estimating the following equations. 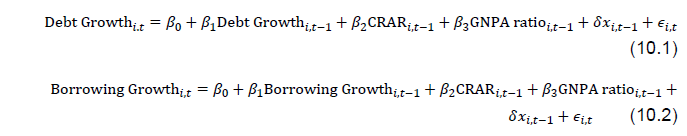 where debt refers to total outstanding borrowings of a bank through debt instruments, borrowing includes funds raised through debt instruments, interbank borrowing, borrowings from the RBI and deposits, and xi,t are control variables, viz. operating profit growth. Both the equations are estimated using the two-step system GMM to deal with endogeneity (proposed by, Arellano & Bond, 1991; Blundell & Bond, 1998). Results shown in Table 4.A and Table 4.B indicate that CRAR helps in raising funds through debt instruments as well as other instruments. This may be due to the indirect impact of a reduction in the cost of funds. As discussed earlier, higher CRAR signals the investor about the soundness of the bank and hence they supply more funding at lower cost. Results show that a one percentage point rise in CRAR increases debt growth rate by 1.8 percentage points (3.5 percentage points for public sector banks). When we controlled for stressed assets, it reduces to 1.4 percentage points (3 percentage points for public sector banks). Similarly, the sensitivity of borrowing growth to CRAR reduces from 6.8 percentage points to 5.5 percentage points in the presence of GNPAs, while for public sector banks it reduces from 9.3 to 6.8 percentage points. | Table 4.A: Debt growth | | Dependent Variable | Overall Sample | Public Sector Banks | | Debt Growth Rate i,t | Debt Growth Rate i,t | Debt Growth Rate i,t | Debt Growth Rate i,t | Debt Growth Rate i,t | Debt Growth Rate i,t | | Debt Growth Rate i,t-1 | 0.382*** | 0.187*** | 0.248*** | 0.360*** | 0.242*** | 0.294*** | | | (0.00197) | (0.0227) | (0.0294) | (0.0420) | (0.0702) | (0.0369) | | CRAR i,t-1 | 0.0175*** | 0.0141*** | 0.0135*** | 0.0352*** | 0.0298*** | 0.0278*** | | | (0.000706) | (0.000515) | (0.00139) | (0.00302) | (0.00354) | (0.00297) | | GNPA Ratio i,t-1 | | -0.00834*** | -0.00606*** | | -0.00335*** | -0.00386*** | | | | (0.000309) | (0.000831) | | (0.00112) | (0.000804) | | Operating Profit i,t-1 | | | 0.000000131*** | | | 0.000000132*** | | | | | (9.48e-09) | | | (1.32e-08) | | Constant | -0.165*** | -0.0522*** | -0.0707*** | -0.375*** | -0.276*** | -0.261*** | | | (0.0101) | (0.00774) | (0.0192) | (0.0352) | (0.0429) | (0.0447) | | N | 240 | 240 | 240 | 168 | 168 | 168 | | AR(1) Test p-value | 0.002 | 0.002 | 0.001 | 0.001 | 0.004 | 0.0007 | | AR (2) test p-value | 0.448 | 0.591 | 0.526 | 0.171 | 0.174 | 0.177 | | Hansen J-Test p-value | 0.356 | 0.348 | 0.913 | 0.850 | 0.861 | 0.999 | | Note: The figures in parentheses are standard errors. * p < 0.1, ** p < 0.05, *** p < 0.01 |
| Table 4.B: Borrowing growth | | Dependent Variable | Overall Sample | Public Sector Banks | | Borrowing Growth i,t | Borrowing Growth i,t | Borrowing Growth i,t | Borrowing Growth i,t | Borrowing Growth i,t | Borrowing Growth i,t | | Borrowing Growth i,t-1 | -0.136*** | -0.184*** | -0.217*** | -0.0830 | -0.0893 | -0.129* | | | (0.0125) | (0.0122) | (0.0358) | (0.0663) | (0.0660) | (0.0767) | | CRAR i,t-1 | 0.0684*** | 0.0550*** | 0.0533*** | 0.0932*** | 0.0684*** | 0.0923*** | | | (0.00402) | (0.00234) | (0.00691) | (0.0143) | (0.0157) | (0.00688) | | GNPA Ratio i,t-1 | | -0.0195*** | -0.0205*** | | -0.0102*** | -0.00774*** | | | | (0.00187) | (0.00353) | | (0.00273) | (0.00280) | | Operating Profit i,t-1 | | | -6.96e-08 | | | -9.63e-08 | | | | | (8.83e-08) | | | (0.000000118) | | Constant | -0.722*** | -0.439*** | -0.411*** | -1.006*** | -0.630*** | -0.929*** | | | (0.0566) | (0.0220) | (0.102) | (0.167) | (0.193) | (0.0813) | | N | 240 | 240 | 240 | 168 | 168 | 168 | | AR(1) Test p-value | 0.0009 | 0.0009 | 0.002 | 0.011 | 0.013 | 0.016 | | AR(2) Test p-value | 0.377 | 0.508 | 0.621 | 0.596 | 0.603 | 0.717 | | Hansen J-Test p-value | 0.531 | 0.419 | 0.928 | 0.894 | 0.989 | 0.999 | | Note: The figures in parentheses are standard errors. * p < 0.1, ** p < 0.05, *** p < 0.01 | The sensitivity of borrowings by the banks to CRAR is much higher for public sector banks as compared to all banks in the sample. The argument behind the channel is that higher capital helps in borrowing by the bank to meet the credit demand. Since public sector banks lie in the lower side of the CRAR distribution and they have implicit insurance from their ownership, additional CRAR might result in higher borrowings compared to banks with private and foreign ownership. This non-linear association was also observed indirectly in the literature that loan growth is more sensitive to capital for banks lying in the lower side of the capital distribution (see, Carlson et al., 2013). The rise in stressed assets significantly lowers the debt growth as well as borrowing growth. For one percentage point increase in GNPA ratio results in a reduction in debt growth and non-deposit borrowing growth by 0.8 percentage points and 1.9 percentage points, respectively. In the case of public sector banks, it is 0.3 and 1, respectively. The lower sensitivity of borrowings to asset quality of public sector banks reflects their ownership structure providing them an implicit insurance to access cheap funds, despite asset quality deterioration. While a higher CRAR helps the bank in getting more funding, but accumulated stressed assets may constraint the channel. Therefore, it is expected that a bank with higher GNPAs are more likely to have lower credit growth because of lesser borrowings and higher provisioning requirement. Although a bank may be relatively well capitalised than others, if the bank needs to keep higher provisioning for rising GNPAs, then it will have lesser loanable fund leading to low credit growth. V. Bank Capital and Monetary Policy Transmission While higher CRAR helps banks to access funds with lesser cost, it is worthwhile to examine whether these funds ultimately channelize into the credit. In this section, we examine the differential impact of monetary policy to credit supply in the presence of different levels of CRAR. Before studying this hypothesis, we first investigate the relationship between capital and loan growth as shown in Figure 4. On an average, there is a positive association between banks’ loan growth rate and their CRAR. Moreover, Figure 4 indicates that public sector banks’ loan growth rate is more sensitive to CRAR relative to private sector banks, while foreign banks show a negative association. Overall, this graphical evidence suggests that the sensitivity of loan growth is higher for banks lying in the lower side of CRAR distribution, as similar to Carlson et al. (2013). This view supports the bank lending channel which argues that the rise in capital ratio helps in better monetary policy transmission. At the same time, the presence of significant amount of stressed assets could limit credit supply. Therefore, it needs to be examined whether the sensitivity of credit supply to CRAR reduces in presence of GNPAs. The following dynamic panel models are estimated controlling for GNPAs to examine the effectiveness of monetary policy. 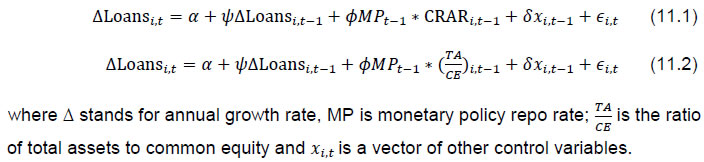
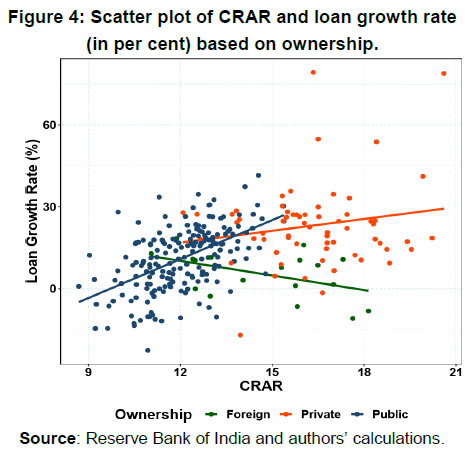
| Table 5: Bank capital and loan supply | | Dependent Variable | Overall Sample | Public Sector Banks | | Loan Growth Rate i,t | Loan Growth Rate i,t | Loan Growth Rate i,t | Loan Growth Rate i,t | | Loan Growth Ratei,t-1 | 0.0778*** | 0.282*** | 0.156** | 0.271*** | | | (0.0195) | (0.0251) | (0.0751) | (0.0677) | | CRAR i,t-1 | 0.0781*** | | 0.121*** | | | | (0.00726) | | (0.0367) | | | GNPA Ratio i,t-1 | -0.00861*** | -0.0134*** | -0.00554** | -0.0115*** | | | (0.000452) | (0.000755) | (0.00251) | (0.00122) | | MP × CRAR i,t-1 | -0.00577*** | | -0.0115** | | | | (0.000963) | | (0.00490) | | | MP ×CE/TA i,t-1 | | -0.00000775*** | | -0.00000507* | | | | (0.00000160) | | (0.00000300) | | Constant | -0.809*** | 0.286*** | -1.339*** | 0.296*** | | | (0.101) | (0.0130) | (0.485) | (0.0258) | | N | 240 | 240 | 168 | 168 | | AR(1) test p-value | 0.001 | 0.0001 | 0.0004 | 0.0008 | | AR(2) test p-value | 0.204 | 0.282 | 0.109 | 0.155 | | Hansen J-test p-value | 0.553 | 0.710 | 0.300 | 0.978 | | Note: The figures in parentheses are standard errors. * p < 0.1, ** p < 0.05, *** p < 0.01 | Results of the above models are reported in Table 5. A positive and statistically significant value of CRAR implies that an increase in CRAR leads to higher loan growth. This provides the evidence of unlocking of the bank lending channel. For each one percentage point increase in CRAR, there is 7.8 percentage points rise in loan growth rate. On the contrary, one percentage point increase in GNPA ratio reduces the loan growth rate by 0.9 percentage points. Therefore, it is always an optimal strategy for any bank to go for higher capital and lower GNPAs to experience better loan growth. As expected, tighter monetary policy negatively influences the loan growth rate. This effect is larger for banks with higher CRAR as captured through the interaction term (a product of MP with CRAR). However, a statistically significant and negative coefficient of GNPA ratio signifies the weakening of monetary policy transmission in the presence of large stressed assets. Hence, it can be concluded that higher CRAR helps in smooth transmission of monetary policy whereas massive GNPAs in banking sector adversely influences the channel. On the other hand, the effect of a monetary tightening is found to be larger for a highly leveraged bank as compared to less leveraged bank as observed from the interaction term MP*TA/CE. In line with the argument on the bank lending channel, higher CRAR helps in unlocking the credit channel3. On the other hand, the bank capital channel provides another justification as to why banks with lower capital can still transmit monetary policy shocks significantly. To examine the above arguments, we adopt the threshold regression approach in estimating the impact of monetary policy on the loan growth rate. As shown in Table 6, the threshold variable is CRAR for the first model (in columns 2 and 4) and total assets to common equity in the second model (in columns 3 and 5). For all banks, monetary policy is 1.5 times more effective if CRAR is below 12.17 per cent. The result is similar for public sectors banks, but the sensitivity is relatively higher as compared to the overall sample. The results are not qualitatively different when we consider the threshold variable TA/CE. However, the magnitude is lower when TA/CE is below the threshold level, i.e., the banks with a higher level of common equity relative to debt weakly transmit monetary policy. In sum, the results imply that banks are more sensitive to monetary policy shocks if their capital position is not much greater than their regulatory requirement level. After a threshold level, the effectiveness of monetary policy in influencing credit supply of banks declines as monetary policy may have only a negligible effect on their profits and thereby on their capital position. | Table 6: Threshold regression model results | | Dependent Variable | Overall Sample | Public Sector Banks | | Loan Growth Rate i,t | Loan Growth Rate i,t | Loan Growth Rate i,t | Loan Growth Rate i,t | | Loan Growth Rate i,t-1 | 0.173** | 0.197*** | 0.145 | 0.143 | | | (0.0711) | (0.0724) | (0.112) | (0.113) | | GNPA Ratio i,t-1 | -0.00827*** | -0.0100*** | -0.00947*** | -0.0112*** | | | (0.00177) | (0.00176) | (0.00250) | (0.00248) | | MP×I(CRAR≤γ) | -0.0260*** | | -0.0283*** | | | | (0.00499) | | (0.00588) | | | MP×I(CRAR>γ) | -0.0179*** | | -0.0201*** | | | | (0.00527) | | (0.00648) | | | MP ×I(TA≤γ) | | -0.0221*** | | -0.0206*** | | | | (0.00523) | | (0.00673) | | MP ×I(TA>γ) | | -0.0315*** | | -0.0318*** | | | | (0.00612) | | (0.00597) | | Constant | 0.273*** | 0.298*** | 0.292*** | 0.345*** | | | (0.0405) | (0.0407) | (0.0544) | (0.0536) | | N | 240 | 240 | 168 | 168 | | Threshold Effect Test | 0.002 | 0.60 | 0.02 | 0.26 | | Threshold Value | 12.17 | 778.50 | 12.17 | 97.56 | | R2 | 0.48 | 0.40 | 0.54 | 0.50 | | Note: The figures in parentheses are standard errors. * p < 0.1, ** p < 0.05, *** p < 0.01 | VI. Conclusions The study finds evidence on the existence of the bank capital channel of monetary policy transmission for India. There is a positive association between bank equity and credit growth. This finding calls for the need for countercyclical capital buffer for the Indian banks to protect their balance sheet against losses from changes in economic conditions during the recessionary phase. Also, banks with higher CRAR face a lower cost of funds. The pro-cyclical nature of leverage shows that banks lend during economic boom by raising debt funds (through deposits, borrowings) rather than using their excess capital. Higher CRAR unlocks the bank lending channel and helps in smooth transmission of monetary policy. However, the magnitude of transmission of monetary policy was found to be weak for banks with CRAR higher than a certain threshold level. Presence of non-performing assets in a bank also weakens monetary policy transmission and lowers the loan growth rate. These results support the need for bank capital regulation in India. Low level of CRAR not only hampers bank health but also restricts smooth transmission of monetary policy. Injection of capital by the Government of India in public sector banks is likely to increase the credit flow to the real sector and help in smoother transmission of monetary policy.
References Admati, A., & Hellwig, M. (2014). The Bankers’ New Clothes: What’s Wrong with Banking and What to Do about It-Updated Edition. Princeton University Press. Adrian, T., Boyarchenko, N., & Shin, H.-S. (2015). The cyclicality of leverage (Tech. Rep.). New York, NY: Staff Report, Federal Reserve Bank of New York. Altunbas, Y., Gambacorta, L., & Marques-Ibanez, D. (2010). Bank risk and monetary policy. Journal of Financial Stability, 6(3), 121–129. Altunbas, Y., Gambacorta, L., & Marques-Ibanez, D. (2012). Do bank characteristics influence the effect of monetary policy on bank risk? Economics Letters, 117(1), 220–222. Arellano, M., & Bond, S. (1991). Some tests of specification for panel data: Monte Carlo evidence and an application to employment equations. The Review of Economic Studies, 58(2), 277–297. Bernanke, B. S., Lown, C. S., & Friedman, B. M. (1991). The credit crunch. Brookings papers on economic activity, 1991(2), 205–247. Bhardwaj, A., Subramanian, K., & Tantri, P. L. (2015). Relationship Banking and Monetary Policy Transmission: Evidence from India (No. 2691556). Indian School of Business Working Paper. Bhatia, S. (2019). Bank capital structure and monetary policy transmission: Evidence from India. 15th Annual Conference on Economic Growth and Development, Indian Statistical Institute, New Delhi. Blundell, R., & Bond, S. (1998). Initial conditions and moment restrictions in dynamic panel data models. Journal of Econometrics, 87(1), 115–143. Bolton, P., Freixas, X., Gambacorta, L., & Mistrulli, P. E. (2016). Relationship and Transaction Lending in a Crisis. The Review of Financial Studies, 29(10), 2643–2676. Borio, C., & Zhu, H. (2012). Capital regulation, risk-taking and monetary policy: a missing link in the transmission mechanism? Journal of Financial Stability, 8(4), 236–251. Carlson, M., Shan, H., & Warusawitharana, M. (2013). Capital ratios and bank lending: A matched bank approach. Journal of Financial Intermediation, 22(4), 663–687. Ellis, D. M., & Flannery, M. J. (1992). Does the debt market assess large banks, risk?: Time series evidence from money center CDs. Journal of Monetary Economics, 30(3), 481–502. Estrella, A. (2004). The cyclical behavior of optimal bank capital. Journal of Banking & Finance, 28(6), 1469–1498. Gambacorta, L., & Shin, H. S. (2018). Why bank capital matters for monetary policy. Journal of Financial Intermediation, 35, 17–29. Hansen, B. E. (1996). Inference when a nuisance parameter is not identified under the null hypothesis. Econometrica: Journal of the Econometric Society, 413–430. Hansen, B. E. (1999). Threshold effects in non-dynamic panels: Estimation, testing, and inference. Journal of Econometrics, 93(2), 345–368. Hansen, L. P. (1982). Large sample properties of generalized method of moments estimators. Econometrica: Journal of the Econometric Society, 50(4), 1029–1054. Kapur, M., & Behera, H. K. (2012). Monetary transmission mechanism in India: A quarterly model (No. 09). Reserve Bank of India Working Paper. Kashyap, A. K., & Stein, J. C. (1995). The impact of monetary policy on bank balance sheets. In Carnegie-rochester conference series on public policy (Vol. 42, pp. 151–195). Khundrakpam, J. K., & Jain, R. (2012). Monetary policy transmission in India: A peep inside the black box. Reserve Bank of India Working Paper No. 11/2012. Kishan, R. P., & Opiela, T. P. (2006). Bank capital and loan asymmetry in the transmission of monetary policy. Journal of Banking & Finance, 30(1), 259–285. Markovic, B. (2006). Bank capital channels in the monetary transmission mechanism. Mishra, P., Montiel, P., & Sengupta, R. (2016). Monetary transmission in developing countries: Evidence from India. In Monetary Policy in India (pp. 59–110). Springer. Pandit, B. L., Mittal, A., Roy, M., & Ghosh, S. (2006). Transmission of monetary policy and the bank lending channel: analysis and evidence for India. Development Research Group Study, 25. Thakor, A. V. (2005). Do Loan Commitments Cause Overlending? Journal of Money, Credit and Banking, 37(6), 1067–1099. Van den Heuvel, S. (2002). Does bank capital matter for monetary transmission? Economic Policy Review, 8(1), 259–265. Verma, R., & Herwadkar, S. (2019). Bank recapitalisation and credit growth: The Indian case (No. 97394). Munich Personal RePEc Archive. Wang, Q. (2015). Fixed-effect panel threshold model using Stata. The Stata Journal, 15(1), 121–134. Watanabe, W. (2007). Prudential regulation and the “credit crunch”: Evidence from Japan. Journal of Money, Credit and Banking, 39(2-3), 639–665. |