Today, the Reserve Bank released the results of the 90th round of the Industrial Outlook Survey (IOS) conducted during April-June, 2020. The survey encapsulates qualitative assessment of the business climate by Indian manufacturing companies for Q1:2020-21 and their expectations for Q2:2020-211. In all, 802 companies responded in this round of the survey. Owing to uncertainty driven by the Covid-19 pandemic, an additional block was included in this round of the survey for assessing the outlook on key parameters for two quarters ahead as well as one year ahead. Highlights: A. Assessment for Q1: 2020-21 -
Manufacturing companies assessed faltering of major demand indicators like production, order books and employment conditions in Q1:2020-21; the perception of external demand conditions was also pessimistic. -
Sentiment for overall financial situation was negative, largely driven by downfall in internal accruals. -
Cost pressures stemming from interest payments on borrowings and purchase of inputs were assessed to soften; salary expenses also eased. -
Respondents polled reduction in selling prices and plunge in profit margins. -
The Business Assessment Index (BAI)2 fell sharply to all-time low at 55.3 in Q1:2020-21 from 102.2 in the previous quarter. B. Expectations for Q2: 2020-21 -
Manufacturers expected improvements in production and order books in Q2:2020-21; the sentiments on job landscape and external demand, however, remained weak. -
Outlook on overall financial situation portrayed some optimism. -
Respondents tempered their expectations on selling prices on the back of lower cost burdens from inputs and salary outgo. -
Sentiments on profit margins remain highly negative during Q2:2020-21 also. -
The business expectations index (BEI) dipped into contraction zone and stood at 99.5 for Q2:2020-21. 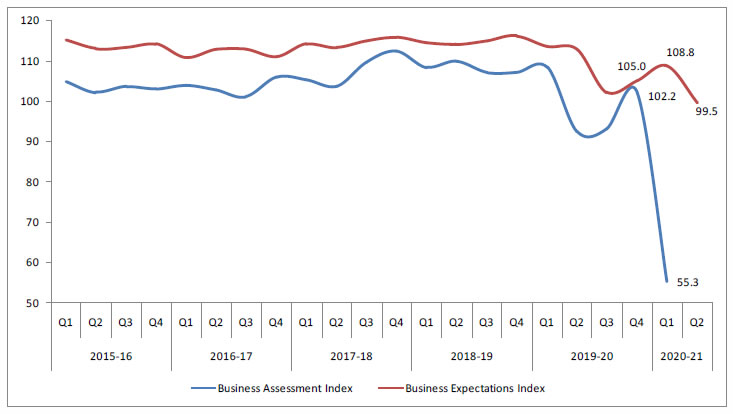
| Table A: Summary of Net responses3 on Survey Parameters | | (per cent) | | Parameters | Assessment period | Expectations period | | Q4:2019-20 | Q1:2020-21 | Q1:2020-21 | Q2:2020-21 | | Production | 13.8 | -63.9 | 23.7 | 11.2 | | Order Books | 10.0 | -54.9 | 18.4 | 8.0 | | Pending Orders | 14.4 | 41.2 | 11.6 | 26.0 | | Capacity Utilisation | 2.0 | -61.6 | 11.3 | 7.6 | | Inventory of Raw Materials | -5.1 | -7.8 | -2.9 | -5.9 | | Inventory of Finished Goods | -6.5 | -12.6 | -4.3 | -7.6 | | Exports | 5.8 | -41.7 | 11.0 | -3.8 | | Imports | 4.7 | -32.9 | 6.6 | -1.0 | | Employment | 2.0 | -28.6 | 5.2 | -7.7 | | Financial Situation (Overall) | 12.8 | -48.9 | 24.3 | 11.4 | | Availability of Finance (from internal accruals) | 13.7 | -30.8 | 17.0 | 6.4 | | Availability of Finance (from banks & other sources) | 10.8 | -3.0 | 11.7 | 10.6 | | Availability of Finance (from overseas, if applicable) | 2.8 | -10.3 | 4.0 | -2.0 | | Cost of Finance | -6.6 | -0.4 | -6.1 | -6.7 | | Cost of Raw Material | -34.1 | -29.3 | -33.6 | -32.0 | | Salary/ Other Remuneration | -24.8 | 9.6 | -33.1 | -4.0 | | Selling Price | 2.5 | -17.1 | 8.3 | -6.0 | | Profit Margin | -11.6 | -56.8 | -2.9 | -26.8 | | Overall Business Situation | 15.7 | -60.2 | 28.2 | 15.7 | | Note: Please see the excel file for time series data | C. Expectations for Q3:2020-21 and Q1:2021-22 | Table B: Business Expectations of Select Parameters for extended period – Net response | | (per cent) | | Parameters | Round 89 | Round 90 | | Q1:2020-21 | Q2:2020-21 | Q3:2020-21 | Q1:2021-22 | | Overall Business Situation | 28.2 | 15.7 | 17.3 | 22.4 | | Production | 23.7 | 11.2 | 19.1 | 24.6 | | Order Books | 18.4 | 8.0 | 17.6 | 22.9 | | Capacity Utilisation | 11.3 | 7.6 | 20.0 | 20.6 | | Employment | 5.2 | -7.7 | 5.0 | 10.7 |
| Table 1: Assessment and Expectations for Production | | (Percentage responses) | | Quarter | Total response | Assessment | Expectations | | Increase | Decrease | No change | Net response | Increase | Decrease | No change | Net response | | Q1:2019-20 | 1,231 | 38.6 | 15.6 | 45.8 | 23.0 | 42.1 | 9.3 | 48.5 | 32.8 | | Q2:2019-20 | 481 | 26.5 | 28.4 | 45.2 | -1.9 | 40.1 | 11.0 | 48.9 | 29.1 | | Q3:2019-20 | 775 | 28.7 | 28.3 | 43.1 | 0.4 | 34.8 | 21.0 | 44.2 | 13.9 | | Q4:2019-20 | 860 | 33.6 | 19.8 | 46.6 | 13.8 | 35.4 | 18.2 | 46.4 | 17.2 | | Q1:2020-21 | 802 | 8.3 | 72.2 | 19.5 | -63.9 | 37.8 | 14.1 | 48.1 | 23.7 | | Q2:2020-21 | | | | | | 41.4 | 30.2 | 28.5 | 11.2 | ‘Increase’ in production is optimistic.
Note: The sum of components may not add up to total due to rounding off (This is applicable for all tables). |
| Table 2: Assessment and Expectations for Order Books | | (Percentage responses) | | Quarter | Total response | Assessment | Expectations | | Increase | Decrease | No change | Net response | Increase | Decrease | No change | Net response | | Q1:2019-20 | 1,231 | 34.1 | 15.4 | 50.5 | 18.8 | 38.5 | 8.6 | 52.8 | 29.9 | | Q2:2019-20 | 481 | 27.4 | 30.2 | 42.5 | -2.8 | 31.6 | 11.1 | 57.3 | 20.5 | | Q3:2019-20 | 775 | 26.9 | 26.6 | 46.5 | 0.3 | 34.3 | 20.4 | 45.3 | 13.9 | | Q4:2019-20 | 860 | 30.1 | 20.1 | 49.9 | 10.0 | 33.6 | 17.0 | 49.3 | 16.6 | | Q1:2020-21 | 802 | 8.9 | 63.8 | 27.3 | -54.9 | 33.5 | 15.1 | 51.4 | 18.4 | | Q2:2020-21 | | | | | | 36.4 | 28.4 | 35.3 | 8.0 | | ‘Increase’ in order books is optimistic. |
| Table 3: Assessment and Expectations for Pending Orders | | (Percentage responses) | | Quarter | Total response | Assessment | Expectations | | Above Normal | Below Normal | Normal | Net response | Above Normal | Below Normal | Normal | Net
response | | Q1:2019-20 | 1,231 | 6.0 | 15.7 | 78.3 | 9.6 | 6.1 | 10.4 | 83.5 | 4.3 | | Q2:2019-20 | 481 | 4.5 | 25.5 | 70.0 | 21.0 | 16.1 | 9.4 | 74.5 | -6.7 | | Q3:2019-20 | 775 | 3.4 | 25.5 | 71.1 | 22.1 | 3.9 | 18.3 | 77.8 | 14.4 | | Q4:2019-20 | 860 | 4.1 | 18.5 | 77.4 | 14.4 | 3.7 | 19.5 | 76.8 | 15.9 | | Q1:2020-21 | 802 | 6.1 | 47.3 | 46.6 | 41.2 | 4.6 | 16.2 | 79.1 | 11.6 | | Q2:2020-21 | | | | | | 5.8 | 31.8 | 62.4 | 26.0 | | Pending orders ‘Below Normal’ is optimistic. |
| Table 4: Assessment and Expectations for Capacity Utilisation (Main Product) | | (Percentage responses) | | Quarter | Total response | Assessment | Expectations | | Increase | Decrease | No change | Net response | Increase | Decrease | No change | Net
response | | Q1:2019-20 | 1,231 | 22.8 | 13.4 | 63.8 | 9.4 | 27.2 | 7.7 | 65.1 | 19.6 | | Q2:2019-20 | 481 | 15.9 | 24.9 | 59.2 | -9.0 | 23.1 | 9.2 | 67.7 | 13.9 | | Q3:2019-20 | 775 | 17.5 | 25.8 | 56.7 | -8.3 | 24.4 | 20.0 | 55.6 | 4.4 | | Q4:2019-20 | 860 | 21.0 | 19.0 | 60.0 | 2.0 | 23.1 | 15.2 | 61.6 | 7.9 | | Q1:2020-21 | 802 | 6.0 | 67.6 | 26.3 | -61.6 | 25.5 | 14.2 | 60.3 | 11.3 | | Q2:2020-21 | | | | | | 36.2 | 28.6 | 35.2 | 7.6 | | ‘Increase’ in capacity utilisation is optimistic. |
| Table 5: Assessment and Expectations for Level of CU (compared to the average in last 4 quarters) | | (Percentage responses) | | Quarter | Total response | Assessment | Expectations | | Above Normal | Below Normal | Normal | Net response | Above Normal | Below Normal | Normal | Net response | | Q1:2019-20 | 1,231 | 9.6 | 14.8 | 75.7 | -5.2 | 12.2 | 8.2 | 79.6 | 4.0 | | Q2:2019-20 | 481 | 8.1 | 26.6 | 65.3 | -18.6 | 9.2 | 8.8 | 82.0 | 0.3 | | Q3:2019-20 | 775 | 6.6 | 26.9 | 66.5 | -20.3 | 9.3 | 21.7 | 69.0 | -12.4 | | Q4:2019-20 | 860 | 7.6 | 21.6 | 70.7 | -14.0 | 7.9 | 18.5 | 73.6 | -10.6 | | Q1:2020-21 | 802 | 2.7 | 63.6 | 33.7 | -60.9 | 9.1 | 16.4 | 74.5 | -7.3 | | Q2:2020-21 | | | | | | 5.8 | 39.2 | 55.0 | -33.5 | | ‘Above Normal’ in Level of capacity utilisation is optimistic. |
| Table 6: Assessment and Expectations for Assessment of Production Capacity (with regard to expected demand in next 6 months) | | (Percentage responses) | | Quarter | Total response | Assessment | Expectations | | More than adequate | Less than adequate | Adequate | Net response | More than adequate | Less than adequate | Adequate | Net response | | Q1:2019-20 | 1,231 | 11.0 | 6.7 | 82.2 | 4.3 | 12.2 | 6.2 | 81.6 | 6.0 | | Q2:2019-20 | 481 | 15.1 | 14.2 | 70.7 | 0.9 | 13.5 | 6.9 | 79.6 | 6.6 | | Q3:2019-20 | 775 | 15.8 | 11.7 | 72.5 | 4.2 | 15.3 | 12.4 | 72.2 | 2.9 | | Q4:2019-20 | 860 | 14.3 | 9.5 | 76.2 | 4.8 | 14.6 | 11.4 | 74.0 | 3.2 | | Q1:2020-21 | 802 | 19.0 | 24.5 | 56.5 | -5.6 | 13.7 | 8.8 | 77.5 | 4.9 | | Q2:2020-21 | | | | | | 18.7 | 17.3 | 64.0 | 1.3 | | ‘More than adequate’ in Assessment of Production Capacity is optimistic. |
| Table 7: Assessment and Expectations for Exports | | (Percentage responses) | | Quarter | Total response | Assessment | Expectations | | Increase | Decrease | No change | Net response | Increase | Decrease | No change | Net response | | Q1:2019-20 | 1,231 | 24.6 | 11.5 | 64.0 | 13.1 | 25.7 | 8.0 | 66.2 | 17.7 | | Q2:2019-20 | 481 | 21.3 | 21.3 | 57.5 | 0.0 | 24.0 | 8.2 | 67.8 | 15.8 | | Q3:2019-20 | 775 | 18.3 | 19.2 | 62.5 | -0.9 | 24.3 | 17.0 | 58.7 | 7.3 | | Q4:2019-20 | 860 | 20.1 | 14.3 | 65.5 | 5.8 | 22.4 | 13.8 | 63.9 | 8.6 | | Q1:2020-21 | 802 | 8.7 | 50.4 | 40.9 | -41.7 | 22.5 | 11.5 | 66.0 | 11.0 | | Q2:2020-21 | | | | | | 23.1 | 26.9 | 50.0 | -3.8 | | ‘Increase’ in exports is optimistic. |
| Table 8: Assessment and Expectations for Imports | | (Percentage responses) | | Quarter | Total response | Assessment | Expectations | | Increase | Decrease | No change | Net response | Increase | Decrease | No change | Net response | | Q1:2019-20 | 1,231 | 18.2 | 8.3 | 73.4 | 9.9 | 19.2 | 6.2 | 74.6 | 13.0 | | Q2:2019-20 | 481 | 16.0 | 14.5 | 69.6 | 1.5 | 18.4 | 7.4 | 74.2 | 11.1 | | Q3:2019-20 | 775 | 13.2 | 12.3 | 74.5 | 0.9 | 18.1 | 11.7 | 70.2 | 6.4 | | Q4:2019-20 | 860 | 16.0 | 11.3 | 72.7 | 4.7 | 15.7 | 10.2 | 74.1 | 5.4 | | Q1:2020-21 | 802 | 7.6 | 40.5 | 51.8 | -32.9 | 16.9 | 10.3 | 72.8 | 6.6 | | Q2:2020-21 | | | | | | 19.9 | 21.0 | 59.1 | -1.0 | | ‘Increase’ in imports is optimistic. |
| Table 9: Assessment and Expectations for level of Raw Materials Inventory | | (Percentage responses) | | Quarter | Total response | Assessment | Expectations | | Above average | Below average | Average | Net response | Above average | Below average | Average | Net response | | Q1:2019-20 | 1,231 | 13.9 | 5.7 | 80.4 | -8.3 | 12.0 | 3.7 | 84.3 | -8.3 | | Q2:2019-20 | 481 | 17.1 | 8.4 | 74.5 | -8.6 | 11.8 | 4.2 | 84.0 | -7.7 | | Q3:2019-20 | 775 | 13.9 | 7.7 | 78.4 | -6.2 | 13.2 | 6.6 | 80.3 | -6.6 | | Q4:2019-20 | 860 | 12.9 | 7.8 | 79.3 | -5.1 | 10.6 | 7.0 | 82.4 | -3.6 | | Q1:2020-21 | 802 | 21.3 | 13.5 | 65.2 | -7.8 | 9.8 | 6.9 | 83.3 | -2.9 | | Q2:2020-21 | | | | | | 15.5 | 9.7 | 74.8 | -5.9 | | ‘Below average’ Inventory of raw materials is optimistic. |
| Table 10: Assessment and Expectations for level of Finished Goods Inventory | | (Percentage responses) | | Quarter | Total response | Assessment | Expectations | | Above average | Below average | Average | Net response | Above average | Below average | Average | Net response | | Q1:2019-20 | 1,231 | 13.5 | 6.7 | 79.8 | -6.8 | 10.5 | 4.9 | 84.6 | -5.6 | | Q2:2019-20 | 481 | 22.5 | 8.0 | 69.5 | -14.5 | 13.0 | 6.0 | 81.0 | -7.0 | | Q3:2019-20 | 775 | 18.3 | 7.3 | 74.4 | -11.0 | 15.7 | 5.0 | 79.3 | -10.7 | | Q4:2019-20 | 860 | 13.3 | 6.7 | 80.0 | -6.5 | 12.9 | 6.2 | 80.9 | -6.7 | | Q1:2020-21 | 802 | 27.0 | 14.3 | 58.7 | -12.6 | 10.4 | 6.2 | 83.4 | -4.3 | | Q2:2020-21 | | | | | | 17.2 | 9.5 | 73.3 | -7.6 | | ‘Below average’ Inventory of finished goods is optimistic. |
| Table 11: Assessment and Expectations for Employment | | (Percentage responses) | | Quarter | Total response | Assessment | Expectations | | Increase | Decrease | No change | Net response | Increase | Decrease | No change | Net response | | Q1:2019-20 | 1,231 | 15.9 | 7.3 | 76.8 | 8.6 | 17.1 | 4.8 | 78.1 | 12.3 | | Q2:2019-20 | 481 | 13.4 | 14.2 | 72.4 | -0.9 | 16.6 | 5.7 | 77.7 | 10.9 | | Q3:2019-20 | 775 | 12.2 | 13.8 | 74.0 | -1.6 | 12.1 | 11.4 | 76.5 | 0.7 | | Q4:2019-20 | 860 | 13.4 | 11.3 | 75.3 | 2.0 | 12.5 | 10.7 | 76.8 | 1.8 | | Q1:2020-21 | 802 | 3.9 | 32.5 | 63.7 | -28.6 | 14.3 | 9.0 | 76.7 | 5.2 | | Q2:2020-21 | | | | | | 11.0 | 18.7 | 70.3 | -7.7 | | ‘Increase’ in employment is optimistic. |
| Table 12: Assessment and Expectations for Overall Financial Situation | | (Percentage responses) | | Quarter | Total response | Assessment | Expectations | | Better | Worsen | No change | Net response | Better | Worsen | No change | Net response | | Q1:2019-20 | 1,231 | 29.7 | 8.6 | 61.7 | 21.1 | 35.0 | 5.7 | 59.3 | 29.3 | | Q2:2019-20 | 481 | 21.2 | 22.2 | 56.6 | -1.1 | 34.3 | 6.1 | 59.6 | 28.3 | | Q3:2019-20 | 775 | 24.6 | 19.3 | 56.1 | 5.3 | 30.6 | 14.8 | 54.7 | 15.8 | | Q4:2019-20 | 860 | 26.5 | 13.6 | 59.9 | 12.8 | 31.2 | 11.7 | 57.1 | 19.5 | | Q1:2020-21 | 802 | 8.7 | 57.6 | 33.6 | -48.9 | 33.1 | 8.8 | 58.0 | 24.3 | | Q2:2020-21 | | | | | | 34.6 | 23.2 | 42.2 | 11.4 | | ‘Better’ overall financial situation is optimistic. |
| Table 13: Assessment and Expectations for Working Capital Finance Requirement | | (Percentage responses) | | Quarter | Total response | Assessment | Expectations | | Increase | Decrease | No change | Net response | Increase | Decrease | No change | Net response | | Q1:2019-20 | 1,231 | 28.5 | 5.4 | 66.1 | 23.2 | 29.6 | 4.1 | 66.3 | 25.6 | | Q2:2019-20 | 481 | 28.4 | 10.7 | 60.9 | 17.7 | 27.7 | 5.5 | 66.8 | 22.1 | | Q3:2019-20 | 775 | 27.4 | 8.7 | 63.9 | 18.7 | 29.3 | 5.5 | 65.3 | 23.8 | | Q4:2019-20 | 860 | 28.3 | 6.4 | 65.4 | 21.9 | 27.3 | 5.7 | 66.9 | 21.6 | | Q1:2020-21 | 802 | 36.9 | 18.8 | 44.4 | 18.1 | 28.8 | 5.7 | 65.5 | 23.1 | | Q2:2020-21 | | | | | | 37.2 | 11.5 | 51.3 | 25.7 | | ‘Increase’ in working capital finance is optimistic. |
| Table 14: Assessment and Expectations for Availability of Finance (from Internal Accruals) | | (Percentage responses) | | Quarter | Total response | Assessment | Expectations | | Improve | Worsen | No change | Net response | Improve | Worsen | No change | Net response | | Q1:2019-20 | 1,231 | 23.2 | 7.2 | 69.6 | 16.0 | 25.5 | 5.0 | 69.5 | 20.5 | | Q2:2019-20 | 481 | 19.6 | 12.7 | 67.7 | 6.9 | 23.0 | 5.7 | 71.3 | 17.3 | | Q3:2019-20 | 775 | 19.0 | 12.4 | 68.6 | 6.6 | 21.4 | 8.1 | 70.5 | 13.2 | | Q4:2019-20 | 860 | 23.1 | 9.5 | 67.4 | 13.7 | 22.1 | 8.8 | 69.1 | 13.4 | | Q1:2020-21 | 802 | 7.2 | 38.0 | 54.8 | -30.8 | 23.1 | 6.0 | 70.9 | 17.0 | | Q2:2020-21 | | | | | | 22.5 | 16.1 | 61.3 | 6.4 | | ‘Improvement’ in availability of finance is optimistic. |
| Table 15: Assessment and Expectations for Availability of Finance (from banks and other sources) | | (Percentage responses) | | Quarter | Total response | Assessment | Expectations | | Improve | Worsen | No change | Net response | Improve | Worsen | No change | Net response | | Q1:2019-20 | 1,231 | 17.9 | 6.0 | 76.1 | 11.9 | 19.3 | 5.0 | 75.7 | 14.2 | | Q2:2019-20 | 481 | 14.3 | 10.0 | 75.8 | 4.3 | 17.4 | 4.4 | 78.2 | 13.0 | | Q3:2019-20 | 775 | 14.6 | 7.4 | 78.1 | 7.2 | 18.7 | 6.0 | 75.3 | 12.7 | | Q4:2019-20 | 860 | 16.9 | 6.1 | 76.9 | 10.8 | 17.7 | 5.9 | 76.4 | 11.7 | | Q1:2020-21 | 802 | 12.9 | 15.8 | 71.3 | -3.0 | 18.1 | 6.4 | 75.4 | 11.7 | | Q2:2020-21 | | | | | | 20.4 | 9.8 | 69.8 | 10.6 | | ‘Improvement’ in availability of finance is optimistic. |
| Table 16: Assessment and Expectations for Availability of Finance (from overseas, if applicable) | | (Percentage responses) | | Quarter | Total response | Assessment | Expectations | | Improve | Worsen | No change | Net response | Improve | Worsen | No change | Net response | | Q1:2019-20 | 1,231 | 8.2 | 4.0 | 87.8 | 4.3 | 9.5 | 3.5 | 87.0 | 6.0 | | Q2:2019-20 | 481 | 6.9 | 4.1 | 89.1 | 2.8 | 13.1 | 3.5 | 83.5 | 9.6 | | Q3:2019-20 | 775 | 7.5 | 5.0 | 87.6 | 2.5 | 9.2 | 4.1 | 86.7 | 5.1 | | Q4:2019-20 | 860 | 7.2 | 4.4 | 88.4 | 2.8 | 7.3 | 4.3 | 88.4 | 3.0 | | Q1:2020-21 | 802 | 3.2 | 13.5 | 83.3 | -10.3 | 7.9 | 4.0 | 88.1 | 4.0 | | Q2:2020-21 | | | | | | 7.9 | 9.9 | 82.2 | -2.0 | | ‘Improvement’ in availability of finance is optimistic. |
| Table 17: Assessment and Expectations for Cost of Finance | | (Percentage responses) | | Quarter | Total response | Assessment | Expectations | | Increase | Decrease | No change | Net
response | Increase | Decrease | No change | Net response | | Q1:2019-20 | 1,231 | 22.4 | 4.9 | 72.7 | -17.6 | 20.2 | 5.8 | 74.0 | -14.4 | | Q2:2019-20 | 481 | 21.3 | 8.1 | 70.6 | -13.1 | 22.5 | 7.1 | 70.4 | -15.4 | | Q3:2019-20 | 775 | 16.9 | 8.2 | 74.9 | -8.7 | 18.5 | 8.4 | 73.1 | -10.0 | | Q4:2019-20 | 860 | 15.0 | 8.4 | 76.6 | -6.6 | 15.0 | 7.1 | 77.9 | -7.9 | | Q1:2020-21 | 802 | 16.3 | 15.9 | 67.8 | -0.4 | 12.7 | 6.6 | 80.6 | -6.1 | | Q2:2020-21 | | | | | | 17.6 | 10.9 | 71.5 | -6.7 | | ‘Decrease’ in cost of finance is optimistic. |
| Table 18: Assessment and Expectations for Cost of Raw Materials | | (Percentage responses) | | Quarter | Total response | Assessment | Expectations | | Increase | Decrease | No change | Net
response | Increase | Decrease | No change | Net response | | Q1:2019-20 | 1,231 | 46.4 | 3.1 | 50.5 | -43.3 | 37.2 | 3.5 | 59.2 | -33.7 | | Q2:2019-20 | 481 | 42.4 | 7.1 | 50.5 | -35.3 | 31.4 | 3.8 | 64.8 | -27.6 | | Q3:2019-20 | 775 | 37.2 | 11.1 | 51.7 | -26.1 | 37.0 | 6.2 | 56.8 | -30.8 | | Q4:2019-20 | 860 | 41.1 | 7.1 | 51.8 | -34.1 | 35.6 | 5.6 | 58.8 | -30.0 | | Q1:2020-21 | 802 | 39.9 | 10.7 | 49.4 | -29.3 | 38.9 | 5.3 | 55.7 | -33.6 | | Q2:2020-21 | | | | | | 37.8 | 5.7 | 56.5 | -32.0 | | ‘Decrease’ in cost of raw materials is optimistic. |
| Table 19: Assessment and Expectations for Salary/Other Remuneration | | (Percentage responses) | | Quarter | Total response | Assessment | Expectations | | Increase | Decrease | No change | Net response | Increase | Decrease | No change | Net response | | Q1:2019-20 | 1,231 | 38.8 | 1.6 | 59.6 | -37.2 | 34.0 | 1.1 | 64.9 | -32.9 | | Q2:2019-20 | 481 | 38.6 | 2.6 | 58.8 | -36.0 | 34.5 | 0.9 | 64.6 | -33.7 | | Q3:2019-20 | 775 | 30.6 | 3.6 | 65.8 | -27.0 | 25.0 | 1.8 | 73.2 | -23.2 | | Q4:2019-20 | 860 | 27.1 | 2.3 | 70.6 | -24.8 | 25.1 | 3.0 | 71.9 | -22.1 | | Q1:2020-21 | 802 | 12.4 | 22.0 | 65.5 | 9.6 | 35.8 | 2.7 | 61.5 | -33.1 | | Q2:2020-21 | | | | | | 16.5 | 12.5 | 70.9 | -4.0 | | ‘Decrease’ in Salary / other remuneration is optimistic. |
| Table 20: Assessment and Expectations for Selling Price | | (Percentage responses) | | Quarter | Total response | Assessment | Expectations | | Increase | Decrease | No change | Net response | Increase | Decrease | No change | Net response | | Q1:2019-20 | 1,231 | 17.1 | 10.5 | 72.4 | 6.6 | 19.5 | 8.5 | 72.0 | 11.0 | | Q2:2019-20 | 481 | 13.8 | 21.4 | 64.8 | -7.6 | 15.5 | 8.4 | 76.1 | 7.1 | | Q3:2019-20 | 775 | 12.0 | 21.6 | 66.4 | -9.6 | 18.6 | 14.0 | 67.3 | 4.6 | | Q4:2019-20 | 860 | 16.4 | 13.9 | 69.7 | 2.5 | 15.2 | 13.0 | 71.9 | 2.2 | | Q1:2020-21 | 802 | 9.5 | 26.6 | 64.0 | -17.1 | 18.0 | 9.7 | 72.3 | 8.3 | | Q2:2020-21 | | | | | | 12.9 | 18.9 | 68.1 | -6.0 | | ‘Increase’ in selling price is optimistic. |
| Table 21: Assessment and Expectations for Profit Margin | | (Percentage responses) | | Quarter | Total response | Assessment | Expectations | | Increase | Decrease | No change | Net response | Increase | Decrease | No change | Net response | | Q1:2019-20 | 1,231 | 16.1 | 24.1 | 59.8 | -8.0 | 17.8 | 17.0 | 65.1 | 0.8 | | Q2:2019-20 | 481 | 13.5 | 36.1 | 50.4 | -22.6 | 21.9 | 14.5 | 63.6 | 7.4 | | Q3:2019-20 | 775 | 12.3 | 34.4 | 53.3 | -22.1 | 17.6 | 26.1 | 56.3 | -8.5 | | Q4:2019-20 | 860 | 15.8 | 27.4 | 56.8 | -11.6 | 16.3 | 26.4 | 57.3 | -10.2 | | Q1:2020-21 | 802 | 5.0 | 61.8 | 33.2 | -56.8 | 17.5 | 20.4 | 62.1 | -2.9 | | Q2:2020-21 | | | | | | 13.7 | 40.5 | 45.8 | -26.8 | | ‘Increase’ in profit margin is optimistic. |
| Table 22: Assessment and Expectations for Overall Business Situation | | (Percentage responses) | | Quarter | Total response | Assessment | Expectations | | Better | Worsen | No change | Net response | Better | Worsen | No change | Net response | | Q1:2019-20 | 1,231 | 35.1 | 10.5 | 54.4 | 24.6 | 42.5 | 5.6 | 51.9 | 36.9 | | Q2:2019-20 | 481 | 24.5 | 25.4 | 50.1 | -0.8 | 41.1 | 6.0 | 52.9 | 35.2 | | Q3:2019-20 | 775 | 26.4 | 22.9 | 50.8 | 3.5 | 37.3 | 15.6 | 47.1 | 21.7 | | Q4:2019-20 | 860 | 31.6 | 15.8 | 52.6 | 15.7 | 35.8 | 13.2 | 50.9 | 22.6 | | Q1:2020-21 | 802 | 8.3 | 68.5 | 23.2 | -60.2 | 38.6 | 10.4 | 50.9 | 28.2 | | Q2:2020-21 | | | | | | 41.0 | 25.3 | 33.6 | 15.7 | | ‘Better’ Overall Business Situation is optimistic. |
| Table 23: Business Sentiments | | Quarter | Business Assessment Index (BAI) | Business Expectations Index (BEI) | | Q1:2019-20 | 108.4 | 113.5 | | Q2:2019-20 | 92.5 | 112.8 | | Q3:2019-20 | 93.0 | 102.2 | | Q4:2019-20 | 102.2 | 105.0 | | Q1:2020-21 | 55.3 | 108.8 | | Q2:2020-21 | | 99.5 |
|