Press Release RBI Working Paper Series No. 02 Construction of Bivariate Fan Chart from Joint Distribution Purnima Shaw@ Abstract 1A fan chart, which depicts uncertainties in projections of macroeconomic variables, is presently limited to univariate framework. However, to illustrate the uncertainties in forecasts of two mutually dependent variables, a bivariate framework is required. Using a joint distribution of two related variables, this paper proposes a theory for constructing bivariate fan chart and conditional fan chart for one variable given known information on the other. Bivariate fan charts for inflation and growth projections presented in the numerical section, show the uncertainties of both the variables in one framework. As compared to the univariate fan chart, the conditional fan chart for growth given prior information on inflation, displays noticeably narrowed confidence bands and reduced error for the revised growth projections. JEL Classification: C10, C13, C46, D81, E17 Keywords : Bivariate normal, forecasting, fan chart, skewness Introduction Essential inputs to a forward-looking monetary policy formulation include the plausible future trajectory or the short and long-run forecasts of various macroeconomic variables (Smaghi, 2006; McDermot, 2013). As forecasts are inevitably associated with risks2 due to interaction of the target variable with other economic variables, the plausible risks to forecasts are required to be minimized to the extent possible. Confidence interval around a forecast value quantifies the plausible risk to the forecast. The Bank of England was the first central bank to publish uncertainty around the inflation forecasts in the form of fan chart in February 1996. Thereafter, fan chart is being used globally by most of the central banks. The Reserve Bank of India (RBI) adopted the fan chart in its Monetary Policy Statements in 2009. Fan chart is a distribution of the upside and downside risks surrounding the forecast at each horizon, constructed using a baseline forecast, the balance of risk to the forecast and the uncertainty value. The upside and downside risks to forecast may not be symmetric. In other words, the target variable realising a value higher than its forecast may have a larger probability than realising a value lower than the forecast or vice versa. The theory on incorporating the asymmetric risks to forecasts were contributed by Blix and Sellin (1998) using a two-piece normal distribution. Its application in the Indian context was discussed explicitly by Banerjee and Das (2011). They discussed the use of fan chart in other countries not only in the context of forecasting inflation and growth but also in the study of survival rates. A methodology for constructing fan chart for government deficit and debt ratios over medium-term was discussed by Cronin and Dowd (2011). On the other hand, Cogley et al. (2005), Österholm (2008) and Franta et al. (2011) researched on Bayesian fan charts. Other contributions in the area of fan charts include those of Österholm (2006), Kannan and Elekdag (2009), Pońsko and Rybaczyk (2016), Razi and Loke (2017) and Turner (2017) among others. Recently, Turner et al. (2018) proved that quantification of skewness in fan charts towards downside or upside risks to forecasts by assessing the probability of a future dip using a probit model is useful. Although, among the macroeconomic variables of interest in the policy formulation, there are variables which are inter-dependent, the literature contains limited work on dimensional extension of fan charts. A derivation of the bivariate fan chart of inflation and output forecasts was attempted by Blix and Sellin (2000). The paper opines that a bivariate framework allows for forecast of one variable conditional on information on the other. The paper clarifies the reasons behind not using an econometric model for deriving confidence bands. Firstly, multiple models are used for deriving inflation and growth forecasts. Secondly, specific information concerning a particular forecast period cannot be incorporated into the model. Lastly, important subjective judgments need to be taken into account as rigorously as possible for obtaining good short-term forecasts. The paper assumes that error distribution of inflation and output forecasts are separately two-piece normal and links the standardised form of these variables into a standard Bivariate normal (BN) distribution through an estimated correlation coefficient. The paper derives conditional distribution of one variable given the other. However, as the two variables of interest are mutually related, an initial assumption of joint distribution of the two variables would give more insights on their trajectory. The author assumes a bivariate relationship at the first stage using a joint distribution and then deriving the conditional fan chart. The dimensional extension of fan charts is important because there exists mutually related variables in the economy, the forecasts of which form important inputs to the monetary policy formation. The relationship between two variables can be incorporated in the forecasting model itself. However, the relationship should also be visible in the error distribution surrounding their forecasts. The information on risk to forecast of one variable affecting the risk to forecast of the other is important from the policy perspective. As fan charts are error distribution around the forecast, a bivariate fan chart would basically mean the joint error distribution around the two-dimensional forecast coordinates. Thus, the bivariate fan chart is not a model; rather an error visualisation around the forecast coordinates which helps in constructing a conditional fan chart of one variable given information on error committed in forecasting one variable and then reducing the error which will be committed in forecasting the other. This information will particularly be helpful when the information on the variables is available with different lags. Section II discusses about the theoretical background of the existing univariate fan chart. A theory of bivariate fan chart construction involving two related variables and a conditional fan chart for one variable given known information on the other is discussed in the Section III. Numerical demonstration of the performance of bivariate and conditional fan charts, based on two economic variables of interest, is presented in Section IV followed by the concluding remarks. II. Univariate Fan Chart The univariate fan chart methodology discussed in the Indian context in this section largely draws upon Banerjee and Das (2011). The basic idea is to incorporate asymmetry in the upside and downside risks to the forecast of a variable, say X. To accommodate this, a two-piece normal distribution is used as given in Johnson et al. (1994), in which half pieces of two different normal distributions with the same mode μ but with different standard deviations σ1 and σ2 are joined together. The mode μ is the forecast of X and an output of some forecasting model(s) using various macroeconomic indicators. III. Bivariate and Conditional Fan Charts III.a. Bivariate Fan Chart from Joint Distribution IV. Numerical Illustration This section attempts to check the performance of the bivariate and conditional fan charts using inflation and real Gross Domestic Product (GDP) growth. The relation between inflation and real GDP growth is positive and linear up to a threshold and then the relationship changes to negative yet remaining linear (Mohanty et.al., 2011). For this exercise, quarterly Consumer Price Index (CPI) and real Gross Domestic Product (GDP) in India were considered for the period from Q1:2004-05 to Q2:2019-20. The CPI index series prior to 2013 was obtained by back-casting the CPI-IW. One-quarter ahead to four-quarters ahead quarter-on-quarter inflation and quarter-on-quarter real GDP growth forecasts for each of the quarters from Q1:2016-17 to Q1:2018-19 were derived using a cointegration5 framework (equation 27 and Table 1). 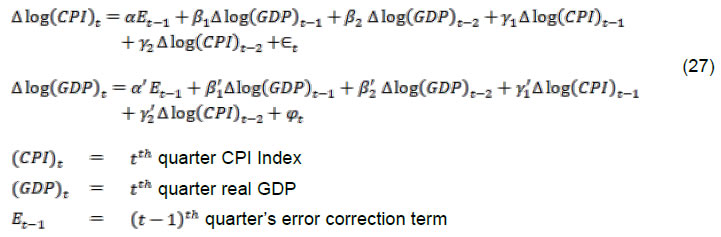 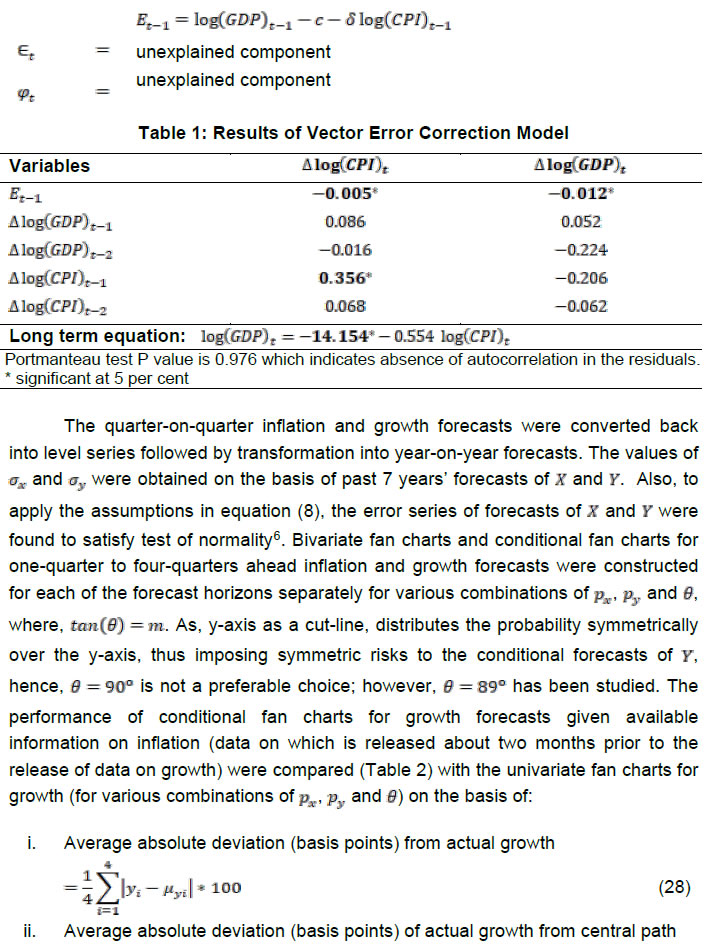 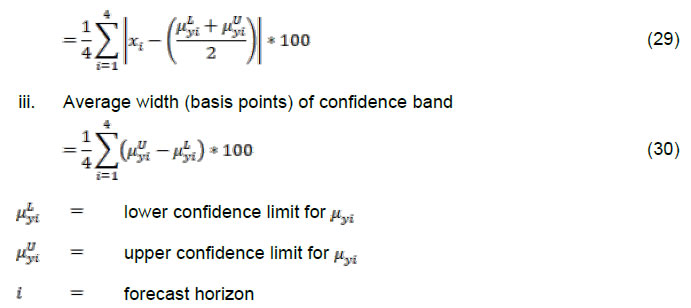 The combinations of px,py and θ for which the confidence intervals were the narrowest for the conditional fan charts were chosen as the pre-specifications for the bivariate fan charts shown in Annexure 2 and also the conditional fan charts displayed in Annexure 3. It is observed from the bivariate fan charts in Annexure 2 that the spread of the fans increases with the increase in the forecast horizon. From one-quarter ahead to four-quarters ahead fans, movement of the centre of the fan towards right indicates that inflation is expected to rise, while movement towards left indicates the opposite. Similarly, centre of the fan moving upside indicates that growth is expected to increase and downward movement points to a possibility of slowdown in growth. While for few bivariate fans, the actual inflation and growth (x, y) coordinate lies at the centre of the fan, for others the performance of the fan chart is not so good, as it entirely depends on the forecasting model and past forecasts’ performances. V. Conclusion The paper proposes the construction of bivariate fan chart using joint distribution of two related variables with their forecasts as the modal coordinate of the distribution and also incorporating asymmetrical risks to the forecasts. Further, the conditional fan chart of one variable given the known information on the other is also derived and the conditional mean is proposed as the revised forecast for the variable. Given suitable values of the balance of risks of the two variables, the conditional fan chart performs better than the univariate fan charts in terms of absolute deviation of the realised values from the forecasts, absolute deviation of the realised values from the central path of the confidence band and width of the confidence band. The proposed bivariate and conditional fan charts are appropriate in a scenario in which information on the two target variables are released at different lags because additional information on one variable refines the forecast of the other for which information will be released later. Although, the relationship between two related variables can be taken care of in the forecasting model itself, such relationship should also be visible in the error distribution surrounding their forecasts, thus proving the utility of the bivariate fan chart. The information on effects of risk to forecast of one variable on the risk to forecast of the other is important from the policy perspective.
References Balakrishnan, N., Lai, C-D. (2009). Continuous Bivariate Distributions. Springer. Banerjee, N., Das, A. (2011). Fan Chart: Methodology and its Application to Inflation Forecasting in India. RBI Working Paper Series, WPS (DEPR): 5/2011. Blix, M., Sellin, P. (1998). Uncertainty Bands for Inflation Forecasts. Sveriges Riksbank Working Paper Series, No. 65. Blix, M., Sellin, P. (2000). A Bivariate Distribution for Inflation and Output Forecasts. Sveriges Riksbank Working Paper Series No. 102. Cogley, T., Morozov, S., Sargent, T. (2005). Bayesian Fan Charts for U.K. Inflation: Forecasting and Sources of Uncertainty in an Evolving Monetary System. Journal of Economic Dynamics and Control, 29(11): 1893-1925. Cronin, D., Dowd, K. (2011). Fiscal fan charts - A tool for assessing member states’ (likely?) compliance with EU fiscal rules. Research Technical Papers 15/RT/11, Central Bank of Ireland. Franta, M., Barunik, J., Horvath, R., Smidkova, K. (2011). Are Bayesian Fan Charts useful for Central Banks? Uncertainty, Forecasting, and Financial Stability Stress Tests. Czech National Bank, Working Papers 2011/10. Johnson, N. L., Kotz, S. and Balakrishnan, N. (1994). Continuous Univariate Distributions, Vol. 1, 2nd ed. Wiley, New York. Kannan, P., Elekdag, S. (2009). Incorporating Market Information into the Construction of the Fan Chart. IMF Working Paper No. 09/178. Kotz, S., Balakrishnan, N., Johnson, N.L. (2000). Continuous Multivariate Distributions. John Wiley & Sons, INC. McDermot, J. (2013). The Role of Forecasting in Monetary Policy. A speech delivered to FINSIA in Wellington. Mohanty, D., Chakraborty, A.B., Das, A., John, J. (2011). Inflation Threshold in India: An Empirical Investigation. RBI Working Paper Series, WPS (DEPR): 18/2011. Österholm, P. (2006). Incorporating Judgement in Fan Charts. Finance and Economics, Discussion Series 39, Divisions of Research and Statistics and Monetary Affairs, Federal Reserve Board, Washington, D.C. Österholm, P. (2008). A Structural Bayesian VAR for Model-Based Fan Charts. Applied Economics, 40(12):1557-1569. Pońsko, P., Rybaczyk, B. (2016). Fan chart – a tool for NBP’s Monetary Policy making. NBP Working Papers 241, Narodowy Bank Polski, Economic Research Department. Razi, A., Loke, P.L. (2017). Fan Chart: The Art and Science of Communicating Uncertainty. IFC Bulletins chapters, in: Bank for International Settlements (ed.), Statistical implications of the new financial landscape, volume 43, Bank for International Settlements. Smaghi, L.B. (2006). Economic Forecasting and Monetary Policy. Vierteljahrshefte zur Wirtschaftsforschung. Quarterly Journal of Economic Research, 75(2): 54-64. Turner, D. (2017). Designing Fan Charts for GDP Growth Forecasts to Better Reflect Downturn Risks. OECD Economics Department Working Papers No. 1428. Turner, D., Chalaux, T., Morgavi, H. (2018). Fan Charts around GDP Projections Based on Probit Models of Downturn Risk. OECD Economics Department Working Papers No. 1521.
Annexure 1 Marginal distribution of X
Annexure 2 - Bivariate Fan Charts for Inflation and Growth
Annexure 3 - Conditional Fan Charts for Growth |