Today, the Reserve Bank released the results of the 87th round of the Industrial Outlook Survey (IOS) conducted during July-September, 2019. The survey encapsulates qualitative assessments of the business climate by companies in India’s manufacturing sector for Q2:2019-20 and their expectations for Q3:2019-201. Responses were received from 481 companies in this round of the survey. Highlights: -
Respondents assessed that there was a slump in order inflows, output and employment conditions in Q2:2019-20. -
On exports and imports, there was waning optimism in Q2:2019-20. -
Sentiments on the overall financial situation reflected lower optimism on availability of finance from internal accruals, bank finance and overseas sources in Q2:2019-20. -
Cost pressures emanating from interest payments on borrowings, purchase of raw materials and salary expenses were assessed to have softened in Q2:2019-20, but manufacturers were pessimistic about profit margins in view of slack demand and negative sentiments on selling prices. -
The Business Assessment Index (BAI)2 fell sharply to 92.5 in Q2:2019-20 from 108.4 in Q1:2019-20. 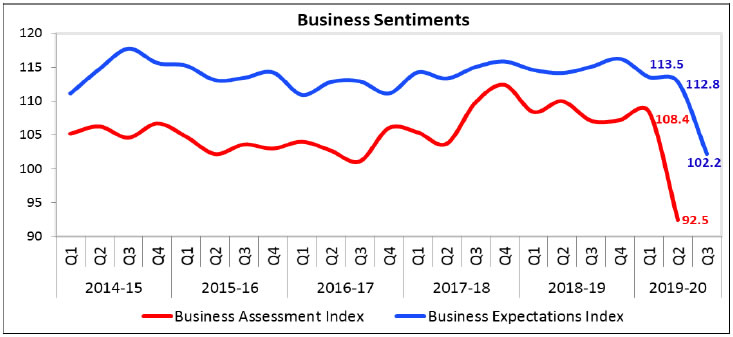 -
Respondents expressed subdued optimism in Q3:2019-20 on demand parameters such as production, order books, employment and exports. -
Optimism on the overall financial situation moderated on account of muted sentiments on availability of finance. -
With moderation of optimism on selling prices and marginal edging up of cost of raw materials, manufacturers expect a downturn in profit margins in Q3:2019-20. -
The Business Expectations Index (BEI) edged down from 112.8 in Q2:2019-20 to 102.2 in Q3:2019-20. Summary Table
Net responses3 | | (per cent) | | Parameters | Assessment period | Expectations period | | Q1:2019-20 | Q2:2019-20 | Q2:2019-20 | Q3:2019-20 | | Production | 23.0 | -1.9 | 29.1 | 13.9 | | Order Books | 18.8 | -2.8 | 20.5 | 13.9 | | Pending Orders | 9.6 | 21.0 | -6.7 | 14.4 | | Capacity Utilisation | 9.4 | -9.0 | 13.9 | 4.4 | | Exports | 13.1 | 0.0 | 15.8 | 7.3 | | Imports | 9.9 | 1.5 | 11.1 | 6.4 | | Employment | 8.6 | -0.9 | 10.9 | 0.7 | | Financial Situation (Overall) | 21.1 | -1.1 | 28.3 | 15.8 | | Availability of Finance (from internal accruals) | 16.0 | 6.9 | 17.3 | 13.2 | | Availability of Finance (from banks and other sources) | 11.9 | 4.3 | 13.0 | 12.7 | | Availability of Finance (from overseas, if applicable) | 4.3 | 2.8 | 9.6 | 5.1 | | Cost of Finance | -17.6 | -13.1 | -15.4 | -10.0 | | Cost of Raw Materials | -43.3 | -35.3 | -27.6 | -30.8 | | Salary/ Other Remuneration | -37.2 | -36.0 | -33.7 | -23.2 | | Selling Price | 6.6 | -7.6 | 7.1 | 4.6 | | Profit Margin | -8.0 | -22.6 | 7.4 | -8.5 | | Overall Business Situation | 24.6 | -0.8 | 35.2 | 21.7 | | Note: Please see the excel file for time series data |
| Table 1: Assessment and Expectations for Production | | (Percentage responses)@ | | Quarter | Total response | Assessment | Expectations | | Increase | Decrease | No change | Net response | Increase | Decrease | No change | Net response | | Q2:2018-19 | 1,095 | 39.2 | 13.1 | 47.7 | 26.0 | 43.0 | 9.8 | 47.2 | 33.2 | | Q3:2018-19 | 1,267 | 38.2 | 13.3 | 48.5 | 24.9 | 41.6 | 9.0 | 49.4 | 32.5 | | Q4:2018-19 | 1,258 | 40.2 | 14.9 | 44.9 | 25.3 | 43.5 | 7.2 | 49.3 | 36.3 | | Q1:2019-20 | 1,231 | 38.6 | 15.6 | 45.8 | 23.0 | 42.1 | 9.3 | 48.5 | 32.8 | | Q2:2019-20 | 481 | 26.5 | 28.4 | 45.2 | -1.9 | 40.1 | 11.0 | 48.9 | 29.1 | | Q3:2019-20 | | | | | | 34.8 | 21.0 | 44.2 | 13.9 | ‘Increase’ in production is optimistic.
@:Due to rounding off percentage may not add up to 100. |
| Table 2: Assessment and Expectations for Order Books | | (Percentage responses) | | Quarter | Total response | Assessment | Expectations | | Increase | Decrease | No change | Net response | Increase | Decrease | No change | Net response | | Q2:2018-19 | 1,095 | 37.3 | 12.8 | 49.9 | 24.5 | 38.4 | 10.8 | 50.8 | 27.7 | | Q3:2018-19 | 1,267 | 35.3 | 15.8 | 48.9 | 19.5 | 38.6 | 9.6 | 51.8 | 28.9 | | Q4:2018-19 | 1,258 | 35.3 | 15.9 | 48.8 | 19.5 | 41.0 | 8.5 | 50.5 | 32.5 | | Q1:2019-20 | 1,231 | 34.1 | 15.4 | 50.5 | 18.8 | 38.5 | 8.6 | 52.8 | 29.9 | | Q2:2019-20 | 481 | 27.4 | 30.2 | 42.5 | -2.8 | 31.6 | 11.1 | 57.3 | 20.5 | | Q3:2019-20 | | | | | | 34.3 | 20.4 | 45.3 | 13.9 | | ‘Increase’ in order books is optimistic. Footnote ‘@’ given in Table 1 is applicable here. |
| Table 3: Assessment and Expectations for Pending Orders | | (Percentage responses) | | Quarter | Total response | Assessment | Expectations | | Above Normal | Below Normal | Normal | Net response | Above Normal | Below Normal | Normal | Net response | | Q2:2018-19 | 1,095 | 7.2 | 13.2 | 79.7 | 6.0 | 6.3 | 10.7 | 83.0 | 4.4 | | Q3:2018-19 | 1,267 | 4.7 | 13.2 | 82.1 | 8.6 | 7.4 | 11.0 | 81.6 | 3.6 | | Q4:2018-19 | 1,258 | 5.1 | 14.3 | 80.6 | 9.2 | 6.3 | 9.9 | 83.8 | 3.6 | | Q1:2019-20 | 1,231 | 6.0 | 15.7 | 78.3 | 9.6 | 6.1 | 10.4 | 83.5 | 4.3 | | Q2:2019-20 | 481 | 4.5 | 25.5 | 70.0 | 21.0 | 16.1 | 9.4 | 74.5 | -6.7 | | Q3:2019-20 | | | | | | 3.9 | 18.3 | 77.8 | 14.4 | | Pending orders ‘Below Normal’ is optimistic. Footnote ‘@’ given in Table 1 is applicable here. |
| Table 4: Assessment and Expectations for Capacity Utilisation (Main Product) | | (Percentage responses) | | Quarter | Total response | Assessment | Expectations | | Increase | Decrease | No change | Net response | Increase | Decrease | No change | Net response | | Q2:2018-19 | 1,095 | 24.4 | 11.9 | 63.6 | 12.5 | 29.3 | 7.7 | 63.0 | 21.6 | | Q3:2018-19 | 1,267 | 24.9 | 12.3 | 62.8 | 12.6 | 28.3 | 7.3 | 64.4 | 21.0 | | Q4:2018-19 | 1,258 | 26.2 | 13.3 | 60.5 | 12.8 | 30.3 | 6.5 | 63.1 | 23.8 | | Q1:2019-20 | 1,231 | 22.8 | 13.4 | 63.8 | 9.4 | 27.2 | 7.7 | 65.1 | 19.6 | | Q2:2019-20 | 481 | 15.9 | 24.9 | 59.2 | -9.0 | 23.1 | 9.2 | 67.7 | 13.9 | | Q3:2019-20 | | | | | | 24.4 | 20.0 | 55.6 | 4.4 | | ‘Increase’ in capacity utilisation is optimistic. Footnote ‘@’ given in Table 1 is applicable here. |
| Table 5: Assessment and Expectations for Level of CU (compared to the average in last 4 quarters) | | (Percentage responses) | | Quarter | Total response | Assessment | Expectations | | Above Normal | Below Normal | Normal | Net response | Above Normal | Below Normal | Normal | Net response | | Q2:2018-19 | 1,095 | 11.7 | 12.3 | 76.0 | -0.6 | 11.8 | 9.3 | 78.9 | 2.5 | | Q3:2018-19 | 1,267 | 10.1 | 12.9 | 76.9 | -2.8 | 12.5 | 9.1 | 78.4 | 3.4 | | Q4:2018-19 | 1,258 | 11.6 | 13.0 | 75.3 | -1.4 | 12.7 | 8.6 | 78.7 | 4.1 | | Q1:2019-20 | 1,231 | 9.6 | 14.8 | 75.7 | -5.2 | 12.2 | 8.2 | 79.6 | 4.0 | | Q2:2019-20 | 481 | 8.1 | 26.6 | 65.3 | -18.6 | 9.2 | 8.8 | 82.0 | 0.3 | | Q3:2019-20 | | | | | | 9.3 | 21.7 | 69.0 | -12.4 | | ‘Above Normal’ in Level of capacity utilisation is optimistic. Footnote ‘@’ given in Table 1 is applicable here. |
| Table 6: Assessment and Expectations for Assessment of Production Capacity (with regard to expected demand in next 6 months) | | (Percentage responses) | | Quarter | Total response | Assessment | Expectations | | More than adequate | Less than adequate | Adequate | Net response | More than adequate | Less than adequate | Adequate | Net response | | Q2:2018-19 | 1,095 | 11.2 | 7.2 | 81.6 | 4.0 | 11.3 | 6.0 | 82.7 | 5.2 | | Q3:2018-19 | 1,267 | 10.3 | 7.2 | 82.5 | 3.0 | 11.9 | 6.3 | 81.8 | 5.6 | | Q4:2018-19 | 1,258 | 11.2 | 7.4 | 81.4 | 3.8 | 10.6 | 6.1 | 83.3 | 4.5 | | Q1:2019-20 | 1,231 | 11.0 | 6.7 | 82.2 | 4.3 | 12.2 | 6.2 | 81.6 | 6.0 | | Q2:2019-20 | 481 | 15.1 | 14.2 | 70.7 | 0.9 | 13.5 | 6.9 | 79.6 | 6.6 | | Q3:2019-20 | | | | | | 15.3 | 12.4 | 72.2 | 2.9 | | ‘More than adequate’ in Assessment of Production Capacity is optimistic. Footnote ‘@’ given in Table 1 is applicable here. |
| Table 7: Assessment and Expectations for Exports | | (Percentage responses) | | Quarter | Total response | Assessment | Expectations | | Increase | Decrease | No change | Net response | Increase | Decrease | No change | Net response | | Q2:2018-19 | 1,095 | 23.7 | 13.1 | 63.2 | 10.7 | 27.8 | 9.2 | 63.0 | 18.5 | | Q3:2018-19 | 1,267 | 25.1 | 13.0 | 61.9 | 12.1 | 26.1 | 10.2 | 63.7 | 15.9 | | Q4:2018-19 | 1,258 | 25.0 | 12.0 | 63.0 | 13.0 | 27.8 | 8.0 | 64.2 | 19.8 | | Q1:2019-20 | 1,231 | 24.6 | 11.5 | 64.0 | 13.1 | 25.7 | 8.0 | 66.2 | 17.7 | | Q2:2019-20 | 481 | 21.3 | 21.3 | 57.5 | 0.0 | 24.0 | 8.2 | 67.8 | 15.8 | | Q3:2019-20 | | | | | | 24.3 | 17.0 | 58.7 | 7.3 | | ‘Increase’ in exports is optimistic. Footnote ‘@’ given in Table 1 is applicable here. |
| Table 8: Assessment and Expectations for Imports | | (Percentage responses) | | Quarter | Total response | Assessment | Expectations | | Increase | Decrease | No change | Net response | Increase | Decrease | No change | Net response | | Q2:2018-19 | 1,095 | 18.3 | 8.6 | 73.1 | 9.8 | 19.1 | 5.8 | 75.1 | 13.3 | | Q3:2018-19 | 1,267 | 20.1 | 8.5 | 71.4 | 11.6 | 19.3 | 7.1 | 73.6 | 12.2 | | Q4:2018-19 | 1,258 | 19.7 | 8.7 | 71.6 | 10.9 | 21.0 | 5.3 | 73.7 | 15.7 | | Q1:2019-20 | 1,231 | 18.2 | 8.3 | 73.4 | 9.9 | 19.2 | 6.2 | 74.6 | 13.0 | | Q2:2019-20 | 481 | 16.0 | 14.5 | 69.6 | 1.5 | 18.4 | 7.4 | 74.2 | 11.1 | | Q3:2019-20 | | | | | | 18.1 | 11.7 | 70.2 | 6.4 | | ‘Increase’ in imports is optimistic. Footnote ‘@’ given in Table 1 is applicable here. |
| Table 9: Assessment and Expectations for level of Raw Materials Inventory | | (Percentage responses) | | Quarter | Total response | Assessment | Expectations | | Above average | Below average | Average | Net response | Above average | Below average | Average | Net response | | Q2:2018-19 | 1,095 | 14.3 | 6.1 | 79.6 | -8.2 | 11.0 | 5.2 | 83.7 | -5.8 | | Q3:2018-19 | 1,267 | 14.3 | 4.6 | 81.0 | -9.7 | 11.3 | 4.6 | 84.1 | -6.7 | | Q4:2018-19 | 1,258 | 14.9 | 5.5 | 79.6 | -9.5 | 12.1 | 4.2 | 83.8 | -7.9 | | Q1:2019-20 | 1,231 | 13.9 | 5.7 | 80.4 | -8.3 | 12.0 | 3.7 | 84.3 | -8.3 | | Q2:2019-20 | 481 | 17.1 | 8.4 | 74.5 | -8.6 | 11.8 | 4.2 | 84.0 | -7.7 | | Q3:2019-20 | | | | | | 13.2 | 6.6 | 80.3 | -6.6 | | ‘Below average’ Inventory of raw materials is optimistic. Footnote ‘@’ given in Table 1 is applicable here. |
| Table 10: Assessment and Expectations for level of Finished Goods Inventory | | (Percentage responses) | | Quarter | Total response | Assessment | Expectations | | Above average | Below average | Average | Net response | Above average | Below average | Average | Net response | | Q2:2018-19 | 1,095 | 13.3 | 6.5 | 80.2 | -6.9 | 9.9 | 5.0 | 85.1 | -4.8 | | Q3:2018-19 | 1,267 | 15.0 | 4.9 | 80.1 | -10.0 | 10.8 | 5.2 | 83.9 | -5.6 | | Q4:2018-19 | 1,258 | 14.4 | 6.5 | 79.1 | -7.9 | 11.1 | 4.6 | 84.3 | -6.5 | | Q1:2019-20 | 1,231 | 13.5 | 6.7 | 79.8 | -6.8 | 10.5 | 4.9 | 84.6 | -5.6 | | Q2:2019-20 | 481 | 22.5 | 8.0 | 69.5 | -14.5 | 13.0 | 6.0 | 81.0 | -7.0 | | Q3:2019-20 | | | | | | 15.7 | 5.0 | 79.3 | -10.7 | | ‘Below average’ Inventory of finished goods is optimistic. Footnote ‘@’ given in Table 1 is applicable here. |
| Table 11: Assessment and Expectations for Employment Outlook | | (Percentage responses) | | Quarter | Total response | Assessment | Expectations | | Increase | Decrease | No change | Net response | Increase | Decrease | No change | Net response | | Q2:2018-19 | 1,095 | 16.2 | 7.8 | 76.1 | 8.4 | 17.6 | 4.7 | 77.7 | 12.9 | | Q3:2018-19 | 1,267 | 16.1 | 6.7 | 77.1 | 9.4 | 17.1 | 4.2 | 78.7 | 12.9 | | Q4:2018-19 | 1,258 | 16.7 | 6.9 | 76.5 | 9.8 | 17.0 | 4.8 | 78.2 | 12.2 | | Q1:2019-20 | 1,231 | 15.9 | 7.3 | 76.8 | 8.6 | 17.1 | 4.8 | 78.1 | 12.3 | | Q2:2019-20 | 481 | 13.4 | 14.2 | 72.4 | -0.9 | 16.6 | 5.7 | 77.7 | 10.9 | | Q3:2019-20 | | | | | | 12.1 | 11.4 | 76.5 | 0.7 | | ‘Increase’ in employment is optimistic. Footnote ‘@’ given in Table 1 is applicable here. |
| Table 12: Assessment and Expectations for Overall Financial Situation | | (Percentage responses) | | Quarter | Total response | Assessment | Expectations | | Better | Worsen | No change | Net response | Better | Worsen | No change | Net response | | Q2:2018-19 | 1,095 | 30.0 | 11.3 | 58.7 | 18.6 | 35.1 | 7.2 | 57.6 | 27.9 | | Q3:2018-19 | 1,267 | 28.5 | 11.9 | 59.6 | 16.5 | 34.4 | 7.5 | 58.0 | 26.9 | | Q4:2018-19 | 1,258 | 29.3 | 11.4 | 59.3 | 17.8 | 35.2 | 6.5 | 58.3 | 28.7 | | Q1:2019-20 | 1,231 | 29.7 | 8.6 | 61.7 | 21.1 | 35.0 | 5.7 | 59.3 | 29.3 | | Q2:2019-20 | 481 | 21.2 | 22.2 | 56.6 | -1.1 | 34.3 | 6.1 | 59.6 | 28.3 | | Q3:2019-20 | | | | | | 30.6 | 14.8 | 54.7 | 15.8 | | ‘Better’ overall financial situation is optimistic. Footnote ‘@’ given in Table 1 is applicable here. |
| Table 13: Assessment and Expectations for Working Capital Finance Requirement | | (Percentage responses) | | Quarter | Total response | Assessment | Expectations | | Increase | Decrease | No change | Net response | Increase | Decrease | No change | Net response | | Q2:2018-19 | 1,095 | 30.4 | 5.5 | 64.2 | 24.9 | 30.8 | 4.5 | 64.7 | 26.3 | | Q3:2018-19 | 1,267 | 30.5 | 5.6 | 63.9 | 24.9 | 30.6 | 4.0 | 65.4 | 26.6 | | Q4:2018-19 | 1,258 | 30.8 | 4.6 | 64.6 | 26.2 | 29.9 | 4.4 | 65.7 | 25.6 | | Q1:2019-20 | 1,231 | 28.5 | 5.4 | 66.1 | 23.2 | 29.6 | 4.1 | 66.3 | 25.6 | | Q2:2019-20 | 481 | 28.4 | 10.7 | 60.9 | 17.7 | 27.7 | 5.5 | 66.8 | 22.1 | | Q3:2019-20 | | | | | | 29.3 | 5.5 | 65.3 | 23.8 | | ‘Increase’ in working capital finance is optimistic. Footnote ‘@’ given in Table 1 is applicable here. |
| Table 14: Assessment and Expectations for Availability of Finance (from Internal Accruals) | | (Percentage responses) | | Quarter | Total response | Assessment | Expectations | | Improve | Worsen | No change | Net response | Improve | Worsen | No change | Net response | | Q2:2018-19 | 1,095 | 24.3 | 10.2 | 65.5 | 14.1 | 25.1 | 6.5 | 68.3 | 18.6 | | Q3:2018-19 | 1,267 | 21.2 | 10.4 | 68.4 | 10.8 | 24.9 | 6.7 | 68.3 | 18.2 | | Q4:2018-19 | 1,258 | 22.8 | 7.5 | 69.6 | 15.3 | 25.4 | 6.2 | 68.4 | 19.2 | | Q1:2019-20 | 1,231 | 23.2 | 7.2 | 69.6 | 16.0 | 25.5 | 5.0 | 69.5 | 20.5 | | Q2:2019-20 | 481 | 19.6 | 12.7 | 67.7 | 6.9 | 23.0 | 5.7 | 71.3 | 17.3 | | Q3:2019-20 | | | | | | 21.4 | 8.1 | 70.5 | 13.2 | | ‘Improvement’ in availability of finance is optimistic. Footnote ‘@’ given in Table 1 is applicable here. |
| Table 15: Assessment and Expectations for Availability of Finance (from banks and other sources) | | (Percentage responses) | | Quarter | Total response | Assessment | Expectations | | Improve | Worsen | No change | Net response | Improve | Worsen | No change | Net response | | Q2:2018-19 | 1,095 | 18.7 | 6.4 | 74.9 | 12.2 | 19.9 | 5.6 | 74.4 | 14.3 | | Q3:2018-19 | 1,267 | 17.2 | 6.0 | 76.8 | 11.2 | 19.0 | 5.9 | 75.1 | 13.1 | | Q4:2018-19 | 1,258 | 17.8 | 7.0 | 75.2 | 10.8 | 20.1 | 4.1 | 75.8 | 16.0 | | Q1:2019-20 | 1,231 | 17.9 | 6.0 | 76.1 | 11.9 | 19.3 | 5.0 | 75.7 | 14.2 | | Q2:2019-20 | 481 | 14.3 | 10.0 | 75.8 | 4.3 | 17.4 | 4.4 | 78.2 | 13.0 | | Q3:2019-20 | | | | | | 18.7 | 6.0 | 75.3 | 12.7 | | ‘Improvement’ in availability of finance is optimistic. Footnote ‘@’ given in Table 1 is applicable here. |
| Table 16: Assessment and Expectations for Availability of Finance (from overseas, if applicable) | | (Percentage responses) | | Quarter | Total response | Assessment | Expectations | | Improve | Worsen | No change | Net response | Improve | Worsen | No change | Net response | | Q2:2018-19 | 1,095 | 9.0 | 4.0 | 87.0 | 4.9 | 9.0 | 4.6 | 86.4 | 4.4 | | Q3:2018-19 | 1,267 | 6.9 | 4.0 | 89.1 | 2.9 | 9.5 | 4.3 | 86.2 | 5.2 | | Q4:2018-19 | 1,258 | 8.6 | 3.9 | 87.6 | 4.7 | 9.0 | 3.0 | 88.0 | 6.0 | | Q1:2019-20 | 1,231 | 8.2 | 4.0 | 87.8 | 4.3 | 9.5 | 3.5 | 87.0 | 6.0 | | Q2:2019-20 | 481 | 6.9 | 4.1 | 89.1 | 2.8 | 13.1 | 3.5 | 83.5 | 9.6 | | Q3:2019-20 | | | | | | 9.2 | 4.1 | 86.7 | 5.1 | | ‘Improvement’ in availability of finance is optimistic. Footnote ‘@’ given in Table 1 is applicable here. |
| Table 17: Assessment and Expectations for Cost of Finance | | (Percentage responses) | | Quarter | Total response | Assessment | Expectations | | Increase | Decrease | No change | Net response | Increase | Decrease | No change | Net response | | Q2:2018-19 | 1,095 | 25.7 | 6.4 | 67.9 | -19.3 | 24.1 | 4.8 | 71.1 | -19.3 | | Q3:2018-19 | 1,267 | 24.9 | 5.4 | 69.7 | -19.5 | 24.7 | 4.9 | 70.4 | -19.8 | | Q4:2018-19 | 1,258 | 21.3 | 5.6 | 73.1 | -15.7 | 22.3 | 4.8 | 73.0 | -17.5 | | Q1:2019-20 | 1,231 | 22.4 | 4.9 | 72.7 | -17.6 | 20.2 | 5.8 | 74.0 | -14.4 | | Q2:2019-20 | 481 | 21.3 | 8.1 | 70.6 | -13.1 | 22.5 | 7.1 | 70.4 | -15.4 | | Q3:2019-20 | | | | | | 18.5 | 8.4 | 73.1 | -10.0 | | ‘Decrease’ in cost of finance is optimistic. Footnote ‘@’ given in Table 1 is applicable here. |
| Table 18: Assessment and Expectations for Cost of Raw Materials | | (Percentage responses) | | Quarter | Total response | Assessment | Expectations | | Increase | Decrease | No change | Net response | Increase | Decrease | No change | Net response | | Q2:2018-19 | 1,095 | 55.5 | 2.6 | 41.8 | -52.9 | 46.2 | 2.8 | 50.9 | -43.4 | | Q3:2018-19 | 1,267 | 53.1 | 3.9 | 43.1 | -49.2 | 46.5 | 1.9 | 51.6 | -44.5 | | Q4:2018-19 | 1,258 | 46.8 | 4.8 | 48.4 | -41.9 | 42.1 | 3.5 | 54.3 | -38.6 | | Q1:2019-20 | 1,231 | 46.4 | 3.1 | 50.5 | -43.3 | 37.2 | 3.5 | 59.2 | -33.7 | | Q2:2019-20 | 481 | 42.4 | 7.1 | 50.5 | -35.3 | 31.4 | 3.8 | 64.8 | -27.6 | | Q3:2019-20 | | | | | | 37.0 | 6.2 | 56.8 | -30.8 | | ‘Decrease’ in cost of raw materials is optimistic. Footnote ‘@’ given in Table 1 is applicable here. |
| Table 19: Assessment and Expectations for Salary/Other Remuneration | | (Percentage responses) | | Quarter | Total response | Assessment | Expectations | | Increase | Decrease | No change | Net response | Increase | Decrease | No change | Net response | | Q2:2018-19 | 1,095 | 35.5 | 2.0 | 62.5 | -33.5 | 32.8 | 1.2 | 65.9 | -31.6 | | Q3:2018-19 | 1,267 | 29.8 | 1.6 | 68.6 | -28.2 | 25.6 | 1.2 | 73.2 | -24.4 | | Q4:2018-19 | 1,258 | 28.5 | 1.8 | 69.7 | -26.7 | 22.8 | 1.4 | 75.8 | -21.4 | | Q1:2019-20 | 1,231 | 38.8 | 1.6 | 59.6 | -37.2 | 34.0 | 1.1 | 64.9 | -32.9 | | Q2:2019-20 | 481 | 38.6 | 2.6 | 58.8 | -36.0 | 34.5 | 0.9 | 64.6 | -33.7 | | Q3:2019-20 | | | | | | 25.0 | 1.8 | 73.2 | -23.2 | | ‘Decrease’ in Salary / other remuneration is optimistic. Footnote ‘@’ given in Table 1 is applicable here. |
| Table 20: Assessment and Expectations for Selling Price | | (Percentage responses) | | Quarter | Total response | Assessment | Expectations | | Increase | Decrease | No change | Net response | Increase | Decrease | No change | Net response | | Q2:2018-19 | 1,095 | 22.1 | 10.7 | 67.2 | 11.3 | 18.5 | 9.6 | 71.9 | 8.8 | | Q3:2018-19 | 1,267 | 19.9 | 13.7 | 66.4 | 6.2 | 21.0 | 6.7 | 72.3 | 14.3 | | Q4:2018-19 | 1,258 | 17.5 | 13.1 | 69.3 | 4.4 | 19.4 | 7.1 | 73.5 | 12.3 | | Q1:2019-20 | 1,231 | 17.1 | 10.5 | 72.4 | 6.6 | 19.5 | 8.5 | 72.0 | 11.0 | | Q2:2019-20 | 481 | 13.8 | 21.4 | 64.8 | -7.6 | 15.5 | 8.4 | 76.1 | 7.1 | | Q3:2019-20 | | | | | | 18.6 | 14.0 | 67.3 | 4.6 | | ‘Increase’ in selling price is optimistic. Footnote ‘@’ given in Table 1 is applicable here. |
| Table 21: Assessment and Expectations for Profit Margin | | (Percentage responses) | | Quarter | Total response | Assessment | Expectations | | Increase | Decrease | No change | Net response | Increase | Decrease | No change | Net response | | Q2:2018-19 | 1,095 | 14.3 | 26.5 | 59.2 | -12.2 | 18.0 | 18.0 | 64.0 | 0.0 | | Q3:2018-19 | 1,267 | 16.1 | 27.8 | 56.1 | -11.7 | 17.1 | 17.0 | 65.9 | 0.1 | | Q4:2018-19 | 1,258 | 16.2 | 25.5 | 58.3 | -9.3 | 18.7 | 16.7 | 64.5 | 2.0 | | Q1:2019-20 | 1,231 | 16.1 | 24.1 | 59.8 | -8.0 | 17.8 | 17.0 | 65.1 | 0.8 | | Q2:2019-20 | 481 | 13.5 | 36.1 | 50.4 | -22.6 | 21.9 | 14.5 | 63.6 | 7.4 | | Q3:2019-20 | | | | | | 17.6 | 26.1 | 56.3 | -8.5 | | ‘Increase’ in profit margin is optimistic. Footnote ‘@’ given in Table 1 is applicable here. |
| Table 22: Assessment and Expectations for Overall Business Situation | | (Percentage responses) | | Quarter | Total response | Assessment | Expectations | | Better | Worsen | No change | Net response | Better | Worsen | No change | Net response | | Q2:2018-19 | 1,095 | 38.1 | 10.3 | 51.6 | 27.9 | 40.5 | 5.9 | 53.6 | 34.6 | | Q3:2018-19 | 1,267 | 34.9 | 10.3 | 54.8 | 24.6 | 43.3 | 7.0 | 49.8 | 36.3 | | Q4:2018-19 | 1,258 | 33.9 | 11.5 | 54.7 | 22.4 | 43.2 | 6.5 | 50.3 | 36.7 | | Q1:2019-20 | 1,231 | 35.1 | 10.5 | 54.4 | 24.6 | 42.5 | 5.6 | 51.9 | 36.9 | | Q2:2019-20 | 481 | 24.5 | 25.4 | 50.1 | -0.8 | 41.1 | 6.0 | 52.9 | 35.2 | | Q3:2019-20 | | | | | | 37.3 | 15.6 | 47.1 | 21.7 | | ‘Better’ Overall Business Situation is optimistic. Footnote ‘@’ given in Table 1 is applicable here. |
| Table 23: Business Sentiments | | Quarter | Business Assessment
Index (BAI) | Business Expectations
Index (BEI) | | Q2:2018-19 | 110.0 | 114.1 | | Q3:2018-19 | 107.1 | 115.0 | | Q4:2018-19 | 107.2 | 116.2 | | Q1:2019-20 | 108.4 | 113.5 | | Q2:2019-20 | 92.5 | 112.8 | | Q3:2019-20 | | 102.2 |
|