Today, the Reserve Bank released the results of the 85th round of the Industrial Outlook Survey (IOS) conducted during January-March, 2019. The survey captures qualitative assessments of the business environment by companies in India’s manufacturing sector for Q4:2018-19 and their expectations for Q1:2019-201. Responses were received from 1,258 companies in this round of the survey. Highlights: -
Respondents assessed demand conditions in Q4:2018-19 to be broadly similar to those in the previous quarter, with a modest improvement in sentiments on production, employment and exports offset by deterioration in optimism on imports, while the assessment of order books remained unchanged. -
Sentiments regarding the overall financial situation turned around, with improved availability of finance from internal accruals; however, respondents were less hopeful of easier availability of finance from banks. -
Moderation in cost pressures, including cost of finance, cost of raw materials and salary expenses brought some respite to manufacturers reeling under stressed profit margins. -
Overall business sentiment in the Indian manufacturing sector, as reflected by the Business Assessment Index (BAI)2 remained optimistic at 107.2 in Q4:2018-19. 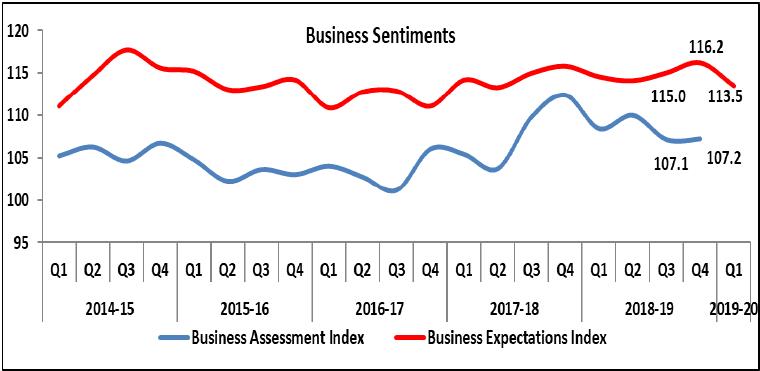 As regards expectations for Q1:2019-20, respondents anticipated softer expansion in demand, with prospect of employment holding up. Sentiment on the overall financial situation remained optimistic on expectations of easier availability of finance from internal accruals. Anticipating large increases in staff costs, manufacturers expressed muted optimism on profit margins in Q1:2019-20. The Business Expectations Index (BEI) moderated from 116.2 in Q4:2018-19 to 113.5 in Q1:2019-20. Summary Table
Net responses3 | | (per cent) | | Parameters | Assessment period | Expectations period | | Q3:2018-19 | Q4:2018-19 | Q4:2018-19 | Q1:2019-20 | | Production | 24.9 | 25.3 | 36.3 | 32.8 | | Order Books | 19.5 | 19.5 | 32.5 | 29.9 | | Pending Orders | 8.6 | 9.2 | 3.6 | 4.3 | | Capacity Utilisation | 12.6 | 12.8 | 23.8 | 19.6 | | Exports | 12.1 | 13.0 | 19.8 | 17.7 | | Imports | 11.6 | 10.9 | 15.7 | 13.0 | | Employment | 9.4 | 9.8 | 12.2 | 12.3 | | Financial Situation (Overall) | 16.5 | 17.8 | 28.7 | 29.3 | | Availability of Finance (from internal accruals) | 10.8 | 15.3 | 19.2 | 20.5 | | Availability of Finance (from banks and other sources) | 11.2 | 10.8 | 16.0 | 14.2 | | Availability of Finance (from overseas, if applicable) | 2.9 | 4.7 | 6.0 | 6.0 | | Cost of Finance | -19.5 | -15.7 | -17.5 | -14.4 | | Cost of Raw Materials | -49.2 | -41.9 | -38.6 | -33.7 | | Salary/ Other Remuneration | -28.2 | -26.7 | -21.4 | -32.9 | | Selling Price | 6.2 | 4.4 | 12.3 | 11.0 | | Profit Margin | -11.7 | -9.3 | 2.0 | 0.8 | | Overall Business Situation | 24.6 | 22.4 | 36.7 | 36.9 | | Note: Please see the excel file for time series data |
| Table 1: Assessment and Expectations for Production | | (Percentage responses)@ | | Quarter | Total response | Assessment | Expectations | | Increase | Decrease | No change | Net response# | Increase | Decrease | No change | Net response | | Q4:2017-18 | 1,250 | 40.7 | 13.4 | 45.9 | 27.3 | 42.5 | 8.4 | 49.7 | 34.1 | | Q1:2018-19 | 1,207 | 39.4 | 14.0 | 46.6 | 25.4 | 40.4 | 11.0 | 48.6 | 29.5 | | Q2:2018-19 | 1,095 | 39.2 | 13.1 | 47.7 | 26.0 | 43.0 | 9.8 | 47.2 | 33.2 | | Q3:2018-19 | 1,267 | 38.2 | 13.3 | 48.5 | 24.9 | 41.6 | 9.0 | 49.4 | 32.5 | | Q4:2018-19 | 1,258 | 40.2 | 14.9 | 44.9 | 25.3 | 43.5 | 7.2 | 49.3 | 36.3 | | Q1:2019-20 | | | | | | 42.1 | 9.3 | 48.5 | 32.8 | ‘Increase’ in production is optimistic.
@:Due to rounding off percentage may not add up to 100. |
| Table 2: Assessment and Expectations for Order Books | | (Percentage responses) | | Quarter | Total response | Assessment | Expectations | | Increase | Decrease | No change | Net response | Increase | Decrease | No change | Net response | | Q4:2017-18 | 1,250 | 38.9 | 14.4 | 46.7 | 24.5 | 40.5 | 10.2 | 49.3 | 30.3 | | Q1:2018-19 | 1,207 | 36.2 | 13.5 | 50.3 | 22.7 | 38.8 | 10.4 | 50.8 | 28.4 | | Q2:2018-19 | 1,095 | 37.3 | 12.8 | 49.9 | 24.5 | 38.4 | 10.8 | 50.8 | 27.7 | | Q3:2018-19 | 1,267 | 35.3 | 15.8 | 48.9 | 19.5 | 38.6 | 9.6 | 51.8 | 28.9 | | Q4:2018-19 | 1,258 | 35.3 | 15.9 | 48.8 | 19.5 | 41.0 | 8.5 | 50.5 | 32.5 | | Q1:2019-20 | | | | | | 38.5 | 8.6 | 52.8 | 29.9 | | ‘Increase’ in order books is optimistic. Footnote ‘@’ given in Table 1 is applicable here. |
| Table 3: Assessment and Expectations for Pending Orders | | (Percentage responses) | | Quarter | Total response | Assessment | Expectations | | Above Normal | Below Normal | Normal | Net response | Above Normal | Below Normal | Normal | Net response | | Q4:2017-18 | 1,250 | 4.5 | 14.8 | 80.7 | 10.3 | 6.8 | 12.5 | 80.7 | 5.7 | | Q1:2018-19 | 1,207 | 5.1 | 12.4 | 82.4 | 7.3 | 4.9 | 12.6 | 82.5 | 7.6 | | Q2:2018-19 | 1,095 | 7.2 | 13.2 | 79.7 | 6.0 | 6.3 | 10.7 | 83.0 | 4.4 | | Q3:2018-19 | 1,267 | 4.7 | 13.2 | 82.1 | 8.6 | 7.4 | 11.0 | 81.6 | 3.6 | | Q4:2018-19 | 1,258 | 5.1 | 14.3 | 80.6 | 9.2 | 6.3 | 9.9 | 83.8 | 3.6 | | Q1:2019-20 | | | | | | 6.1 | 10.4 | 83.5 | 4.3 | | Pending orders ‘Below Normal’ is optimistic. Footnote ‘@’ given in Table 1 is applicable here. |
| Table 4: Assessment and Expectations for Capacity Utilisation (Main Product) | | (Percentage responses) | | Quarter | Total response | Assessment | Expectations | | Increase | Decrease | No change | Net response | Increase | Decrease | No change | Net response | | Q4:2017-18 | 1,250 | 27.4 | 12.6 | 60.0 | 14.8 | 28.4 | 8.9 | 62.7 | 19.5 | | Q1:2018-19 | 1,207 | 24.5 | 12.5 | 63.0 | 12.0 | 27.8 | 9.8 | 62.4 | 17.9 | | Q2:2018-19 | 1,095 | 24.4 | 11.9 | 63.6 | 12.5 | 29.3 | 7.7 | 63.0 | 21.6 | | Q3:2018-19 | 1,267 | 24.9 | 12.3 | 62.8 | 12.6 | 28.3 | 7.3 | 64.4 | 21.0 | | Q4:2018-19 | 1,258 | 26.2 | 13.3 | 60.5 | 12.8 | 30.3 | 6.5 | 63.1 | 23.8 | | Q1:2019-20 | | | | | | 27.2 | 7.7 | 65.1 | 19.6 | | ‘Increase’ in capacity utilisation is optimistic. Footnote ‘@’ given in Table 1 is applicable here. |
| Table 5: Assessment and Expectations for Level of CU (compared to the average in last 4 quarters) | | (Percentage responses) | | Quarter | Total response | Assessment | Expectations | | Above Normal | Below Normal | Normal | Net response | Above Normal | Below Normal | Normal | Net response | | Q4:2017-18 | 1,250 | 12.6 | 13.5 | 73.9 | -0.9 | 13.0 | 10.7 | 76.3 | 2.3 | | Q1:2018-19 | 1,207 | 11.0 | 12.9 | 76.1 | -2.0 | 13.0 | 10.6 | 76.5 | 2.4 | | Q2:2018-19 | 1,095 | 11.7 | 12.3 | 76.0 | -0.6 | 11.8 | 9.3 | 78.9 | 2.5 | | Q3:2018-19 | 1,267 | 10.1 | 12.9 | 76.9 | -2.8 | 12.5 | 9.1 | 78.4 | 3.4 | | Q4:2018-19 | 1,258 | 11.6 | 13.0 | 75.3 | -1.4 | 12.7 | 8.6 | 78.7 | 4.1 | | Q1:2019-20 | | | | | | 12.2 | 8.2 | 79.6 | 4.0 | | ‘Above Normal’ in Level of capacity utilisation is optimistic. Footnote ‘@’ given in Table 1 is applicable here. |
| Table 6: Assessment and Expectations for Assessment of Production Capacity (with regard to expected demand in next 6 months) | | (Percentage responses) | | Quarter | Total response | Assessment | Expectations | | More than adequate | Less than adequate | Adequate | Net response | More than adequate | Less than adequate | Adequate | Net response | | Q4:2017-18 | 1,250 | 12.2 | 6.3 | 81.5 | 5.9 | 12.9 | 6.9 | 80.2 | 6.0 | | Q1:2018-19 | 1,207 | 10.5 | 6.6 | 82.9 | 3.9 | 13.0 | 6.0 | 81.0 | 7.0 | | Q2:2018-19 | 1,095 | 11.2 | 7.2 | 81.6 | 4.0 | 11.3 | 6.0 | 82.7 | 5.2 | | Q3:2018-19 | 1,267 | 10.3 | 7.2 | 82.5 | 3.0 | 11.9 | 6.3 | 81.8 | 5.6 | | Q4:2018-19 | 1,258 | 11.2 | 7.4 | 81.4 | 3.8 | 10.6 | 6.1 | 83.3 | 4.5 | | Q1:2019-20 | | | | | | 12.2 | 6.2 | 81.6 | 6.0 | | ‘More than adequate’ in Assessment of Production Capacity is optimistic. Footnote ‘@’ given in Table 1 is applicable here. |
| Table 7: Assessment and Expectations for Exports | | (Percentage responses) | | Quarter | Total response | Assessment | Expectations | | Increase | Decrease | No change | Net response | Increase | Decrease | No change | Net response | | Q4:2017-18 | 1,250 | 26.3 | 13.8 | 59.9 | 12.5 | 25.4 | 8.8 | 65.8 | 16.6 | | Q1:2018-19 | 1,207 | 23.6 | 14.5 | 61.8 | 9.1 | 28.4 | 9.8 | 61.8 | 18.6 | | Q2:2018-19 | 1,095 | 23.7 | 13.1 | 63.2 | 10.7 | 27.8 | 9.2 | 63.0 | 18.5 | | Q3:2018-19 | 1,267 | 25.1 | 13.0 | 61.9 | 12.1 | 26.1 | 10.2 | 63.7 | 15.9 | | Q4:2018-19 | 1,258 | 25.0 | 12.0 | 63.0 | 13.0 | 27.8 | 8.0 | 64.2 | 19.8 | | Q1:2019-20 | | | | | | 25.7 | 8.0 | 66.2 | 17.7 | | ‘Increase’ in exports is optimistic. Footnote ‘@’ given in Table 1 is applicable here. |
| Table 8: Assessment and Expectations for Imports | | (Percentage responses) | | Quarter | Total response | Assessment | Expectations | | Increase | Decrease | No change | Net response | Increase | Decrease | No change | Net response | | Q4:2017-18 | 1,250 | 19.8 | 8.7 | 71.5 | 11.0 | 19.7 | 6.2 | 74.1 | 13.5 | | Q1:2018-19 | 1,207 | 19.6 | 8.4 | 72.0 | 11.2 | 19.6 | 5.8 | 74.7 | 13.8 | | Q2:2018-19 | 1,095 | 18.3 | 8.6 | 73.1 | 9.8 | 19.1 | 5.8 | 75.1 | 13.3 | | Q3:2018-19 | 1,267 | 20.1 | 8.5 | 71.4 | 11.6 | 19.3 | 7.1 | 73.6 | 12.2 | | Q4:2018-19 | 1,258 | 19.7 | 8.7 | 71.6 | 10.9 | 21.0 | 5.3 | 73.7 | 15.7 | | Q1:2019-20 | | | | | | 19.2 | 6.2 | 74.6 | 13.0 | | ‘Increase’ in imports is optimistic. Footnote ‘@’ given in Table 1 is applicable here. |
| Table 9: Assessment and Expectations for level of Raw Materials Inventory | | (Percentage responses) | | Quarter | Total response | Assessment | Expectations | | Above average | Below average | Average | Net response | Above average | Below average | Average | Net response | | Q4:2017-18 | 1,250 | 14.0 | 5.9 | 80.2 | -8.1 | 11.5 | 6.0 | 82.5 | -5.5 | | Q1:2018-19 | 1,207 | 14.6 | 4.9 | 80.5 | -9.6 | 10.8 | 5.7 | 83.5 | -5.2 | | Q2:2018-19 | 1,095 | 14.3 | 6.1 | 79.6 | -8.2 | 11.0 | 5.2 | 83.7 | -5.8 | | Q3:2018-19 | 1,267 | 14.3 | 4.6 | 81.0 | -9.7 | 11.3 | 4.6 | 84.1 | -6.7 | | Q4:2018-19 | 1,258 | 14.9 | 5.5 | 79.6 | -9.5 | 12.1 | 4.2 | 83.8 | -7.9 | | Q1:2019-20 | | | | | | 12.0 | 3.7 | 84.3 | -8.3 | | ‘Below average’ Inventory of raw materials is optimistic. Footnote ‘@’ given in Table 1 is applicable here. |
| Table 10: Assessment and Expectations for level of Finished Goods Inventory | | (Percentage responses) | | Quarter | Total response | Assessment | Expectations | | Above average | Below average | Average | Net response | Above average | Below average | Average | Net response | | Q4:2017-18 | 1,250 | 13.3 | 6.5 | 80.2 | -6.8 | 10.9 | 6.5 | 82.6 | -4.4 | | Q1:2018-19 | 1,207 | 12.0 | 6.3 | 81.7 | -5.7 | 10.4 | 5.8 | 83.9 | -4.6 | | Q2:2018-19 | 1,095 | 13.3 | 6.5 | 80.2 | -6.9 | 9.9 | 5.0 | 85.1 | -4.8 | | Q3:2018-19 | 1,267 | 15.0 | 4.9 | 80.1 | -10.0 | 10.8 | 5.2 | 83.9 | -5.6 | | Q4:2018-19 | 1,258 | 14.4 | 6.5 | 79.1 | -7.9 | 11.1 | 4.6 | 84.3 | -6.5 | | Q1:2019-20 | | | | | | 10.5 | 4.9 | 84.6 | -5.6 | | ‘Below average’ Inventory of finished goods is optimistic. Footnote ‘@’ given in Table 1 is applicable here. |
| Table 11: Assessment and Expectations for Employment Outlook | | (Percentage responses) | | Quarter | Total response | Assessment | Expectations | | Increase | Decrease | No change | Net response | Increase | Decrease | No change | Net response | | Q4:2017-18 | 1,250 | 17.5 | 8.1 | 74.4 | 9.4 | 17.0 | 5.3 | 77.7 | 11.7 | | Q1:2018-19 | 1,207 | 18.1 | 7.2 | 74.6 | 10.9 | 17.7 | 6.6 | 75.7 | 11.1 | | Q2:2018-19 | 1,095 | 16.2 | 7.8 | 76.1 | 8.4 | 17.6 | 4.7 | 77.7 | 12.9 | | Q3:2018-19 | 1,267 | 16.1 | 6.7 | 77.1 | 9.4 | 17.1 | 4.2 | 78.7 | 12.9 | | Q4:2018-19 | 1,258 | 16.7 | 6.9 | 76.5 | 9.8 | 17.0 | 4.8 | 78.2 | 12.2 | | Q1:2019-20 | | | | | | 17.1 | 4.8 | 78.1 | 12.3 | | ‘Increase’ in employment is optimistic. Footnote ‘@’ given in Table 1 is applicable here. |
| Table 12: Assessment and Expectations for Overall Financial Situation | | (Percentage responses) | | Quarter | Total response | Assessment | Expectations | | Better | Worsen | No change | Net response | Better | Worsen | No change | Net response | | Q4:2017-18 | 1,250 | 31.9 | 9.5 | 58.6 | 22.4 | 35.2 | 6.6 | 58.2 | 28.6 | | Q1:2018-19 | 1,207 | 31.0 | 10.3 | 58.7 | 20.7 | 34.5 | 6.5 | 59.0 | 28.0 | | Q2:2018-19 | 1,095 | 30.0 | 11.3 | 58.7 | 18.6 | 35.1 | 7.2 | 57.6 | 27.9 | | Q3:2018-19 | 1,267 | 28.5 | 11.9 | 59.6 | 16.5 | 34.4 | 7.5 | 58.0 | 26.9 | | Q4:2018-19 | 1,258 | 29.3 | 11.4 | 59.3 | 17.8 | 35.2 | 6.5 | 58.3 | 28.7 | | Q1:2019-20 | | | | | | 35.0 | 5.7 | 59.3 | 29.3 | | ‘Better’ overall financial situation is optimistic. Footnote ‘@’ given in Table 1 is applicable here. |
| Table 13: Assessment and Expectations for Working Capital Finance Requirement | | (Percentage responses) | | Quarter | Total response | Assessment | Expectations | | Increase | Decrease | No change | Net response | Increase | Decrease | No change | Net response | | Q4:2017-18 | 1,250 | 35.5 | 5.3 | 59.2 | 30.1 | 32.4 | 3.6 | 64.0 | 28.8 | | Q1:2018-19 | 1,207 | 32.4 | 4.8 | 62.8 | 27.7 | 30.8 | 5.3 | 63.9 | 25.4 | | Q2:2018-19 | 1,095 | 30.4 | 5.5 | 64.2 | 24.9 | 30.8 | 4.5 | 64.7 | 26.3 | | Q3:2018-19 | 1,267 | 30.5 | 5.6 | 63.9 | 24.9 | 30.6 | 4.0 | 65.4 | 26.6 | | Q4:2018-19 | 1,258 | 30.8 | 4.6 | 64.6 | 26.2 | 29.9 | 4.4 | 65.7 | 25.6 | | Q1:2019-20 | | | | | | 29.6 | 4.1 | 66.3 | 25.6 | | ‘Increase’ in working capital finance is optimistic. Footnote ‘@’ given in Table 1 is applicable here. |
| Table 14: Assessment and Expectations for Availability of Finance (from Internal Accruals) | | (Percentage responses) | | Quarter | Total response | Assessment | Expectations | | Improve | Worsen | No change | Net response | Improve | Worsen | No change | Net response | | Q4:2017-18 | 1,250 | 23.7 | 8.9 | 67.4 | 14.7 | 26.6 | 5.2 | 68.2 | 21.4 | | Q1:2018-19 | 1,207 | 24.2 | 8.2 | 67.5 | 16.0 | 25.1 | 6.9 | 67.9 | 18.2 | | Q2:2018-19 | 1,095 | 24.3 | 10.2 | 65.5 | 14.1 | 25.1 | 6.5 | 68.3 | 18.6 | | Q3:2018-19 | 1,267 | 21.2 | 10.4 | 68.4 | 10.8 | 24.9 | 6.7 | 68.3 | 18.2 | | Q4:2018-19 | 1,258 | 22.8 | 7.5 | 69.6 | 15.3 | 25.4 | 6.2 | 68.4 | 19.2 | | Q1:2019-20 | | | | | | 25.5 | 5.0 | 69.5 | 20.5 | | ‘Improvement’ in availability of finance is optimistic. Footnote ‘@’ given in Table 1 is applicable here. |
| Table 15: Assessment and Expectations for Availability of Finance (from banks and other sources) | | (Percentage responses) | | Quarter | Total response | Assessment | Expectations | | Improve | Worsen | No change | Net response | Improve | Worsen | No change | Net response | | Q4:2017-18 | 1,250 | 18.8 | 7.0 | 74.2 | 11.9 | 20.9 | 4.4 | 74.7 | 16.5 | | Q1:2018-19 | 1,207 | 19.0 | 7.3 | 73.7 | 11.7 | 20.9 | 6.4 | 72.7 | 14.6 | | Q2:2018-19 | 1,095 | 18.7 | 6.4 | 74.9 | 12.2 | 19.9 | 5.6 | 74.4 | 14.3 | | Q3:2018-19 | 1,267 | 17.2 | 6.0 | 76.8 | 11.2 | 19.0 | 5.9 | 75.1 | 13.1 | | Q4:2018-19 | 1,258 | 17.8 | 7.0 | 75.2 | 10.8 | 20.1 | 4.1 | 75.8 | 16.0 | | Q1:2019-20 | | | | | | 19.3 | 5.0 | 75.7 | 14.2 | | ‘Improvement’ in availability of finance is optimistic. Footnote ‘@’ given in Table 1 is applicable here. |
| Table 16: Assessment and Expectations for Availability of Finance (from overseas, if applicable) | | (Percentage responses) | | Quarter | Total response | Assessment | Expectations | | Improve | Worsen | No change | Net response | Improve | Worsen | No change | Net response | | Q4:2017-18 | 1,250 | 8.0 | 4.6 | 87.4 | 3.4 | 9.2 | 2.6 | 88.2 | 6.6 | | Q1:2018-19 | 1,207 | 7.1 | 5.7 | 87.1 | 1.4 | 8.6 | 4.3 | 87.1 | 4.3 | | Q2:2018-19 | 1,095 | 9.0 | 4.0 | 87.0 | 4.9 | 9.0 | 4.6 | 86.4 | 4.4 | | Q3:2018-19 | 1,267 | 6.9 | 4.0 | 89.1 | 2.9 | 9.5 | 4.3 | 86.2 | 5.2 | | Q4:2018-19 | 1,258 | 8.6 | 3.9 | 87.6 | 4.7 | 9.0 | 3.0 | 88.0 | 6.0 | | Q1:2019-20 | | | | | | 9.5 | 3.5 | 87.0 | 6.0 | | ‘Improvement’ in availability of finance is optimistic. Footnote ‘@’ given in Table 1 is applicable here. |
| Table 17: Assessment and Expectations for Cost of Finance | | (Percentage responses) | | Quarter | Total response | Assessment | Expectations | | Increase | Decrease | No change | Net response | Increase | Decrease | No change | Net response | | Q4:2017-18 | 1,250 | 18.1 | 7.9 | 74.0 | -10.3 | 13.9 | 9.8 | 76.3 | -4.1 | | Q1:2018-19 | 1,207 | 25.3 | 5.4 | 69.2 | -19.9 | 18.7 | 6.4 | 74.9 | -12.2 | | Q2:2018-19 | 1,095 | 25.7 | 6.4 | 67.9 | -19.3 | 24.1 | 4.8 | 71.1 | -19.3 | | Q3:2018-19 | 1,267 | 24.9 | 5.4 | 69.7 | -19.5 | 24.7 | 4.9 | 70.4 | -19.8 | | Q4:2018-19 | 1,258 | 21.3 | 5.6 | 73.1 | -15.7 | 22.3 | 4.8 | 73.0 | -17.5 | | Q1:2019-20 | | | | | | 20.2 | 5.8 | 74.0 | -14.4 | | ‘Decrease’ in cost of finance is optimistic. Footnote ‘@’ given in Table 1 is applicable here. |
| Table 18: Assessment and Expectations for Cost of Raw Materials | | (Percentage responses) | | Quarter | Total response | Assessment | Expectations | | Increase | Decrease | No change | Net response | Increase | Decrease | No change | Net response | | Q4:2017-18 | 1,250 | 52.8 | 3.3 | 43.9 | -49.5 | 38.3 | 4.3 | 57.4 | -34.0 | | Q1:2018-19 | 1,207 | 55.9 | 2.8 | 41.3 | -53.0 | 42.7 | 3.7 | 53.6 | -39.0 | | Q2:2018-19 | 1,095 | 55.5 | 2.6 | 41.8 | -52.9 | 46.2 | 2.8 | 50.9 | -43.4 | | Q3:2018-19 | 1,267 | 53.1 | 3.9 | 43.1 | -49.2 | 46.5 | 1.9 | 51.6 | -44.5 | | Q4:2018-19 | 1,258 | 46.8 | 4.8 | 48.4 | -41.9 | 42.1 | 3.5 | 54.3 | -38.6 | | Q1:2019-20 | | | | | | 37.2 | 3.5 | 59.2 | -33.7 | | ‘Decrease’ in cost of raw materials is optimistic. Footnote ‘@’ given in Table 1 is applicable here. |
| Table 19: Assessment and Expectations for Salary/Other Remuneration | | (Percentage responses) | | Quarter | Total response | Assessment | Expectations | | Increase | Decrease | No change | Net response | Increase | Decrease | No change | Net response | | Q4:2017-18 | 1,250 | 28.8 | 2.2 | 69.0 | -26.6 | 25.2 | 2.3 | 72.5 | -22.9 | | Q1:2018-19 | 1,207 | 42.0 | 2.1 | 55.9 | -40.0 | 36.8 | 1.8 | 61.3 | -35.0 | | Q2:2018-19 | 1,095 | 35.5 | 2.0 | 62.5 | -33.5 | 32.8 | 1.2 | 65.9 | -31.6 | | Q3:2018-19 | 1,267 | 29.8 | 1.6 | 68.6 | -28.2 | 25.6 | 1.2 | 73.2 | -24.4 | | Q4:2018-19 | 1,258 | 28.5 | 1.8 | 69.7 | -26.7 | 22.8 | 1.4 | 75.8 | -21.4 | | Q1:2019-20 | | | | | | 34.0 | 1.1 | 64.9 | -32.9 | | ‘Decrease’ in Salary / other remuneration is optimistic. Footnote ‘@’ given in Table 1 is applicable here. |
| Table 20: Assessment and Expectations for Selling Price | | (Percentage responses) | | Quarter | Total response | Assessment | Expectations | | Increase | Decrease | No change | Net response | Increase | Decrease | No change | Net response | | Q4:2017-18 | 1,250 | 19.3 | 12.6 | 68.1 | 6.7 | 17.4 | 9.5 | 73.1 | 7.9 | | Q1:2018-19 | 1,207 | 23.0 | 11.4 | 65.6 | 11.5 | 19.2 | 8.9 | 71.9 | 10.4 | | Q2:2018-19 | 1,095 | 22.1 | 10.7 | 67.2 | 11.3 | 18.5 | 9.6 | 71.9 | 8.8 | | Q3:2018-19 | 1,267 | 19.9 | 13.7 | 66.4 | 6.2 | 21.0 | 6.7 | 72.3 | 14.3 | | Q4:2018-19 | 1,258 | 17.5 | 13.1 | 69.3 | 4.4 | 19.4 | 7.1 | 73.5 | 12.3 | | Q1:2019-20 | | | | | | 19.5 | 8.5 | 72.0 | 11.0 | | ‘Increase’ in selling price is optimistic. Footnote ‘@’ given in Table 1 is applicable here. |
| Table 21: Assessment and Expectations for Profit Margin | | (Percentage responses) | | Quarter | Total response | Assessment | Expectations | | Increase | Decrease | No change | Net response | Increase | Decrease | No change | Net response | | Q4:2017-18 | 1,250 | 16.2 | 26.1 | 57.7 | -9.9 | 18.8 | 18.7 | 62.5 | 0.1 | | Q1:2018-19 | 1,207 | 15.5 | 25.8 | 58.7 | -10.3 | 18.0 | 18.7 | 63.3 | -0.7 | | Q2:2018-19 | 1,095 | 14.3 | 26.3 | 59.2 | -12.2 | 18.0 | 18.0 | 64.0 | 0.0 | | Q3:2018-19 | 1,267 | 16.1 | 27.8 | 56.1 | -11.7 | 17.1 | 17.0 | 65.9 | 0.1 | | Q4:2018-19 | 1,258 | 16.2 | 25.5 | 58.3 | -9.3 | 18.7 | 16.7 | 64.5 | 2.0 | | Q1:2019-20 | | | | | | 17.8 | 17.0 | 65.1 | 0.8 | | ‘Increase’ in profit margin is optimistic. Footnote ‘@’ given in Table 1 is applicable here. |
| Table 22: Assessment and Expectations for Overall Business Situation | | (Percentage responses) | | Quarter | Total response | Assessment | Expectations | | Better | Worsen | No change | Net response | Better | Worsen | No change | Net response | | Q4:2017-18 | 1,250 | 39.2 | 9.0 | 51.8 | 30.2 | 42.5 | 6.4 | 51.2 | 36.1 | | Q1:2018-19 | 1,207 | 38.7 | 9.0 | 52.3 | 29.6 | 42.7 | 5.8 | 51.5 | 36.9 | | Q2:2018-19 | 1,095 | 38.1 | 10.3 | 51.6 | 27.9 | 40.5 | 5.9 | 53.6 | 34.6 | | Q3:2018-19 | 1,267 | 34.9 | 10.3 | 54.8 | 24.6 | 43.3 | 7.0 | 49.8 | 36.3 | | Q4:2018-19 | 1,258 | 33.9 | 11.5 | 54.7 | 22.4 | 43.2 | 6.5 | 50.3 | 36.7 | | Q1:2019-20 | | | | | | 42.5 | 5.6 | 51.9 | 36.9 | | ‘Better’ Overall Business Situation is optimistic. Footnote ‘@’ given in Table 1 is applicable here. |
| Table 23: Business Sentiments | | Quarter | Business Assessment Index (BAI) | Business Expectations Index (BEI) | | Q4:2017-18 | 112.4 | 115.8 | | Q1:2018-19 | 108.4 | 114.6 | | Q2:2018-19 | 110.0 | 114.1 | | Q3:2018-19 | 107.1 | 115.0 | | Q4:2018-19 | 107.2 | 116.2 | | Q1:2019-20 | | 113.5 |
|