The overhang of stress weighed down the consolidated balance sheet of the banking sector during 2017-18 necessitating large provisions. Despite these adversities, banks managed to improve their capital positions. Bank credit growth recovered, improving the share of bank finance in the total flow of resources to the commercial sector. The IBC framework is gaining traction and in conjunction with the revised framework for resolution of stressed assets, it should enable banks to shed the drag from asset impairments to a stronger and more resilient trajectory of balance sheet expansion consistent with the financial intermediation needs of the country going forward. 1. Introduction IV.1 India’s banking sector has been facing a large overhang of balance sheet stress. During 2017-18, the persisting deterioration in asset quality necessitated sharp increases in provisions and for the first time since 1993-94, the banking system as a whole, particularly driven by public sector banks (PSBs), registered losses. As regulator and supervisor, the Reserve Bank’s approach to the revival of the banking system has been three-pronged: with the asset quality reviews (AQRs) a fuller recognition of stressed assets is nearing completion and provisioning is being policy-driven; in consonance, the implementation of a new framework for resolution of stressed assets under the overarching mandate of the Insolvency and Bankruptcy Code (IBC) is speeding up the de-stressing of balance sheets; and the government has undertaken steps for recapitalisation of the PSBs in order to bolster their financials. Reflecting these resolute efforts, asset quality of the banking sector has improved marginally in H1:2018-191. IV.2 Against this background, this chapter discusses the performance of the Indian banking sector during 2017-18 and H1:2018-19, based on audited balance sheets and off-site supervisory returns in Section 2, followed by an evaluation of the financial performance of 93 scheduled commercial banks (SCBs)2 and their financial soundness in Section 3 and 4. Other themes addressed in the chapter in Sections 5 to 11 include sectoral deployment of credit, SCBs in the capital market, ownership pattern in SCBs, foreign banks’ operations in India and overseas operations of Indian banks, payment system developments, consumer protection and financial inclusion. Developments related to regional rural banks (RRBs), local area banks (LABs), small finance banks (SFBs) and payments banks (PBs) have also been analysed in Sections 12 to 15 separately. The chapter concludes by bringing together the major issues that emerge from the analysis. 2. Balance Sheet Analysis IV.3 The size of the consolidated balance sheet of SCBs in India has been growing at a slowing pace since 2012-13 and into 2017-18 as banks grappled with fuller recognition of stressed assets (Chart IV.1). During H1:2018-19, however, growth returned to the balance sheet of SCBs, bolstered by recovery in loan books. 2.1 Deposits IV.4 During 2017-18, SCBs’ deposit growth slackened from the high base of the preceding year when it had expanded by 10.1 per cent— highest in three years—after the demonetisation of specified bank notes (SBNs) in November 2016 (Table IV.1). During H1:2018-19, growth in deposits of SCBs experienced an uptick on a y-o-y basis, reflecting the adjustment to demonetisation getting to completion. 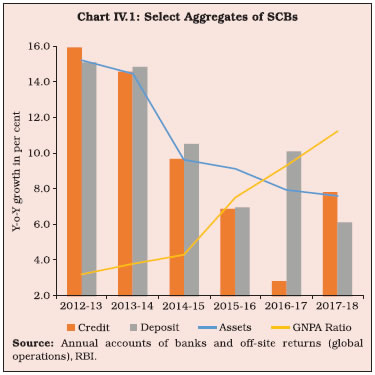
| Table IV.1: Consolidated Balance Sheet of Scheduled Commercial Banks | | (At end-March) | | (Amount in ₹ billion) | | Item | Public Sector Banks | Private Sector Banks | Foreign Banks | Small Finance Banks# | All SCBs | | 2017* | 2018** | 2017 | 2018 | 2017 | 2018 | 2017 | 2018 | 2017 | 2018 | | 1. Capital | 243 | 332 | 110 | 116 | 629 | 679 | 10 | 35 | 993 | 1,161 | | 2. Reserves and Surplus | 5,546 | 5,558 | 3,709 | 4,320 | 840 | 883 | 12 | 37 | 10,108 | 10,798 | | 3. Deposits | 80,768 | 82,623 | 25,648 | 30,137 | 4,655 | 4,949 | 43 | 231 | 111,114 | 117,940 | | 3.1. Demand Deposits | 5,439 | 5,436 | 3,871 | 4,374 | 1,223 | 1,435 | 1 | 10 | 10,534 | 11,255 | | 3.2. Savings Bank Deposits | 24,738 | 26,565 | 7,173 | 8,737 | 529 | 573 | 11 | 43 | 32,451 | 35,917 | | 3.3. Term Deposits | 50,591 | 50,622 | 14,605 | 17,026 | 2,904 | 2,941 | 30 | 178 | 68,130 | 70,767 | | 4. Borrowings | 7,219 | 8,470 | 4,835 | 6,882 | 705 | 1,277 | 49 | 194 | 12,807 | 16,823 | | 5. Other Liabilities and Provisions | 3,590 | 3,368 | 1,711 | 1,535 | 1,417 | 888 | 6 | 20 | 6,724 | 5,811 | | Total Liabilities/Assets | 97,366 | 100,352 | 36,014 | 42,989 | 8,246 | 8,676 | 120 | 517 | 141,746 | 152,533 | | 1. Cash and Balances with RBI | 4,842 | 4,485 | 1,585 | 2,403 | 374 | 400 | 4 | 15 | 6,805 | 7,303 | | 2. Balances with Banks and Money at Call and Short Notice | 5,303 | 3,922 | 1,300 | 1,260 | 760 | 733 | 12 | 33 | 7,374 | 5,948 | | 3. Investments | 25,548 | 27,919 | 8,551 | 10,118 | 2,397 | 3,126 | 27 | 100 | 36,523 | 41,263 | | 3.1 Government Securities (a+b) | 21,183 | 23,113 | 6,317 | 7,574 | 2,068 | 2,598 | 26 | 80 | 29,593 | 33,365 | | a) In India | 20,946 | 22,819 | 6,271 | 7,514 | 2,003 | 2,520 | 26 | 80 | 29,246 | 32,934 | | b) Outside India | 237 | 294 | 46 | 59 | 65 | 78 | - | - | 347 | 432 | | 3.2 Other Approved Securities | 3 | 2 | - | - | - | - | - | - | 3 | 2 | | 3.3 Non-approved Securities | 4,362 | 4,803 | 2,234 | 2,545 | 330 | 528 | 1 | 20 | 6,926 | 7,895 | | 4. Loans and Advances | 55,572 | 56,973 | 22,195 | 26,628 | 3,323 | 3,510 | 71 | 349 | 81,161 | 87,460 | | 4.1 Bills Purchased and Discounted | 2,806 | 2,342 | 804 | 936 | 706 | 741 | - | - | 4,317 | 4,019 | | 4.2 Cash Credits, Overdrafts, etc. | 23,516 | 24,148 | 6,307 | 7,900 | 1,389 | 1,445 | 10 | 29 | 31,222 | 33,521 | | 4.3 Term Loans | 29,251 | 30,484 | 15,083 | 17,792 | 1,228 | 1,324 | 61 | 320 | 45,623 | 49,919 | | 5. Fixed Assets | 1,200 | 1,100 | 255 | 263 | 48 | 45 | 3 | 10 | 1,507 | 1,419 | | 6. Other Assets | 4,901 | 5,952 | 2,128 | 2,317 | 1,344 | 862 | 3 | 10 | 8,376 | 9,141 | Notes: 1. -: Nil/negligible.
2. *: Includes IDBI Bank and Bhartiya Mahila Bank.
3. **: Includes IDBI Bank.
4. #: Data pertains only to those SFBs which were included in the Second Schedule to the Reserve Bank of India Act,1934. As at end-March 2017 and end-March 2018, two and six scheduled SFBs, respectively, were operating.
5. Components may not add up to their respective totals due to rounding-off numbers to ₹ billion.
Source: Annual accounts of banks. | IV.5 An overwhelming share3 of deposits with SCBs has always comprised term deposits — especially in the one-to-two year maturity bucket — due to higher returns across comparable financial assets. The year 2016-17 was, however, an outlier with the share of current account and saving account (CASA) deposits surging five percentage points above the five-year average on account of the return flow of SBNs into bank deposits especially to PSBs (Chart IV.2). With the rapid pace of remonetisation, growth in CASA deposits moderated in both PSBs and private sector banks (PVBs) while it increased in foreign banks (FBs) during 2017-18. Term deposits grew concomitantly, although returns on term deposits turned unattractive relative to other competing asset classes such as mutual funds and pension funds. 2.2 Borrowings IV.6 Remonetisation resulted in a deceleration in deposits and consequently, borrowings by banks shot up by 31.4 per cent during 2017- 18 from a significant decline (11.6 per cent) in the previous year. For PVBs and FBs, which rely heavily on borrowings relative to PSBs, the bounce back was sharp (Chart IV.3). In H1:2018-19 as well, banks stepped up borrowings by 26 per cent y-o-y. 2.3 Credit IV.7 During 2017-18, credit growth revived from anaemic conditions prevailing in the recent years (Chart IV.4)4. Recent data based on supervisory returns suggest that the recovery in credit growth was sustained during H1:2018-19.
IV.8 All categories—PSBs, PVBs and FBs— partook in this credit recovery (Chart IV.4). During H1:2018-19, FBs recorded the sharpest upturn in credit growth; by contrast, PSBs’ loan books expanded in a more subdued manner, weighed down by impaired assets and stepped-up provisioning. IV.9 In consonance, the incremental credit to GDP ratio, which has been consistently declining in recent years, revived in 2017-18 (Chart IV.5). IV.10 The share of PVBs in total outstanding bank credit has consistently increased in the recent years, although they are yet to surpass PSBs (Charts IV.6a). In terms of share in incremental credit flows, however, the PVBs have overtaken PSBs, as the credit flows by the latter has remained low (Chart IV.6b). 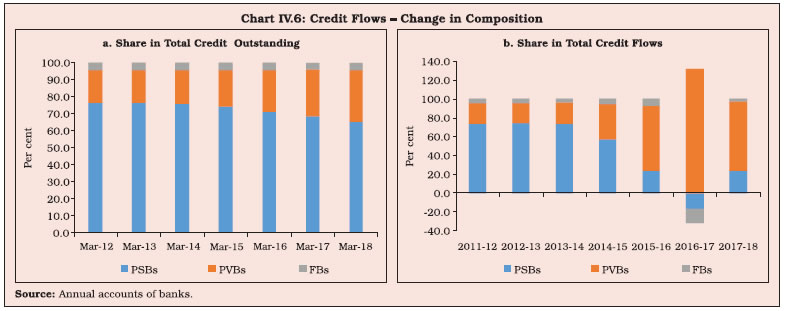 IV. 11 The lending space vacated by banks, particularly PSBs, was taken up by non-banks in 2016-17 although some rebalancing was evident in 2017-18. A dip in the issuances of corporate bonds and a sharp fall in issuances of commercial papers (CPs) was reflected in a decline in the share of non-bank sources. Credit disbursements by non-deposit taking systemically important NBFCs and housing finance companies (HFCs), larger accommodation by four RBI-regulated All India Financial Institutions (AIFIs), a significant increase in short-term credit from abroad and public issuances of equity by non-financial companies more than compensated, and expanded the flow of resources from non-banks. This trend continued in H1:2018-19 on sustained bank credit growth (Table IV.2). IV.12 These developments were reflected in movements in the credit-deposit (C-D) ratio. | Table IV.2: Trends in Flow of Financial Resources to Commercial Sector from Banks and Non-banks | | (₹ billion) | | Source | April-March | April 1 to September 28 | | 2014-15 | 2015-16 | 2016-17 | 2017-18 | 2017-18 | 2018-19 | | A. Adjusted Non-food Bank Credit | 5,850 | 7,754 | 4,952 | 9,161 | 1,467 | 3,662 | | | (43.5) | (55.4) | (34.1) | (44.9) | (22.6) | (39.2) | | 1. Non-food Credit | 5,464 | 7,024 | 3,882 | 7,959 | 1,495 | 3,513 | | 2. Non-SLR Investment by SCBs | 386 | 731 | 1070 | 1202 | -29 | 149 | | B. Flow from Non-banks (B1+B2) | 7,588 | 6,241 | 9,578 | 11,220 | 5,018 | 5,677 | | | (56.5) | (44.6) | (65.9) | (55.1) | (77.4) | (60.8) | | B1. Domestic Sources | 5,323 | 3,782 | 6,820 | 7,836 | 3,644 | 4,699 | | | (39.6) | (27.0) | (46.9) | (38.4) | (56.2) | (50.3) | | 1. Public Issues by Non-financial Entities | 87 | 378 | 155 | 438 | 111 | 70 | | 2. Gross Private Placements by Non-financial Entities | 1,277 | 1,135 | 2,004 | 1,462 | 675 | 712 | | 3. Net Issuance of CPs Subscribed to by Non-banks | 558 | 517 | 1,002 | -254 | 17 | 1,872 | | 4. Net Credit by Housing Finance Companies | 954 | 1,188 | 1,374 | 1,986 | 739 | 998 | | 5. Total Accommodation by Four RBI Regulated AIFIs - NABARD, NHB, SIDBI and EXIM Bank | 417 | 472 | 469 | 951 | 147 | 619 | | 6. Systemically Important Non-deposit taking NBFCs (Net of Bank Credit) | 1,629 | -277 | 1,539 | 2,875 | 1,785 | 326 | | 7. LIC’s Net Investment in Corporate Debt, Infrastructure and Social Sector | 401 | 369 | 277 | 378 | 169 | 102 | | B2. Foreign Sources | 2,265 | 2,459 | 2,758 | 3,385 | 1,374 | 977 | | | (16.9) | (17.6) | (19.0) | (16.6) | (21.2) | (10.5) | | 1. External Commercial Borrowings / FCCB | 14 | -388 | -509 | -51 | -129 | -35 | | 2. ADR/GDR Issues excluding Banks and Financial Institutions | 96 | - | - | - | - | - | | 3. Short-term Credit from Abroad | -4 | -96 | 435 | 896 | 37 | -234* | | 4. Foreign Direct Investment to India | 2,159 | 2,943 | 2,833 | 2,540 | 1,466 | 1,246@ | | C. Total Flow of Resources (A+B) | 13,438 | 13,995 | 14,530 | 20,381 | 6,485 | 9,339 | | | (100.0) | (100.0) | (100.0) | (100.0) | (100.0) | (100.0) | Notes: 1. Higher net credit flows from NBFCs-ND-SI in 2017-18 was mainly due to higher number of government companies reporting in 2017-18 as compared to 2016-17. Negative net credit flows from NBFCs-ND-SI in 2015-16 was mainly due to change in classification norm for NBFCs-ND-SI, according to which asset size for being classified as NBFC-ND-SI was increased from ₹ one billion to ₹ five billion and more. Additionally, conversion of two large NBFCs into banks viz., Bandhan Bank and IDFC Bank also contributed to the decline in credit flow from NBFCs to the commercial sector in 2015-16.
2. *: Up to June 2018; @: Up to August 2018.
3. Figures in parentheses are percentages to total.
4. -: Nil/negligible.
Source: RBI, SEBI, BSE, NSE, Merchant Banks, LIC and NHB. | Notably, the C-D ratio of PVBs remained higher than that of other bank groups, indicative of their smaller depositor base and the marked expansion in credit that is underway (Chart IV.7). At end-September 2018, the C-D ratio of SCBs taken together increased marginally from its level a year ago. 2.4 Investments IV.13 Investments – the second largest component in the assets side of banks’ balance sheets after loans and advances – picked up, mostly driven by government securities. During H1:2018-19, however, investments slackened largely due to deceleration in investments of PSBs in SLR/other approved securities. 2.5 Maturity Profile of Assets and Liabilities IV.14 Maturity mismatches are inherent to banking activity as short-term deposits are leveraged for extending medium to long term loans, resulting in exposure to liquidity and interest rate risk. A negative gap (liabilities > assets) was observed in the shortest maturity bucket of up to one year in 2017-18, and correspondingly, longer maturity buckets exhibited positive gaps as asset creation outpaced liabilities (Chart IV.8). IV.15 The accentuation of maturity mismatches was largely due to PSBs (Table IV.3). 2.6 International Liabilities and Assets IV.16 During 2017-18, total international liabilities and assets of banks located in India rebounded from a decline in the previous year albeit marked by lower growth in claims relative to liabilities. The ratio of international liabilities of banks to India’s total external debt (original maturity) remained stable around 37 per cent (Chart IV.9). IV.17 Liabilities due to accretions to nonresident external rupee (NRE) accounts and foreign currency borrowings rose substantially in 2017-18, spurred by interest rates differentials favouring India. With banks bolstering their Tier I capital, equity holdings of non-residents drove up international liabilities during the year (Table IV.4). | Table IV.3: Bank Group-wise Maturity Profile of Select Liabilities/Assets | | (At end-March) | | (Per cent to total under each item) | | Liabilities/Assets | PSBs | PVBs | FBs | All SCBs# | | 2017 | 2018 | 2017 | 2018 | 2017 | 2018 | 2017 | 2018 | | 1 | 2 | 3 | 4 | 5 | 6 | 7 | 8 | 9 | | I. Deposits | | | | | | | | | | a) Up to 1 year | 41.6 | 44.8 | 41.5 | 42.4 | 63.0 | 63.0 | 42.5 | 45.0 | | b) Over 1 year and up to 3 years | 27.9 | 23.2 | 26.0 | 25.3 | 28.9 | 28.9 | 27.5 | 24.0 | | c) Over 3 years and up to 5 years | 8.6 | 10.0 | 10.5 | 10.7 | 8.0 | 8.0 | 9.0 | 10.0 | | d) Over 5 years | 21.9 | 22.0 | 21.9 | 21.6 | 0.1 | 0.1 | 21.0 | 20.9 | | II. Borrowings | | | | | | | | | | a) Up to 1 year | 49.9 | 60.2 | 43.9 | 45.7 | 84.7 | 89.1 | 49.5 | 56.3 | | b) Over 1 year and up to 3 years | 12.9 | 13.4 | 19.3 | 22.2 | 11.8 | 7.2 | 15.4 | 16.9 | | c) Over 3 years and up to 5 years | 10.4 | 8.4 | 13.1 | 12.9 | 1.2 | 2.2 | 10.9 | 9.8 | | d) Over 5 years | 26.8 | 18.0 | 23.7 | 19.2 | 2.3 | 1.5 | 24.2 | 17.0 | | III. Loans and Advances | | | | | | | | | | a) Up to 1 year | 28.3 | 32.8 | 32.5 | 31.9 | 62.5 | 59.1 | 30.9 | 33.6 | | b) Over 1 year and up to 3 years | 34.3 | 26.3 | 33.8 | 33.8 | 18.4 | 20.9 | 33.5 | 28.4 | | c) Over 3 years and up to 5 years | 10.6 | 12.7 | 12.8 | 12.8 | 8.0 | 8.0 | 11.1 | 12.5 | | d) Over 5 years | 26.9 | 28.2 | 20.8 | 21.4 | 11.2 | 12.0 | 24.6 | 25.5 | | IV. Investments | | | | | | | | | | a) Up to 1 year | 19.8 | 17.6 | 46.9 | 50.7 | 78.2 | 81.2 | 30.0 | 30.6 | | b) Over 1 year and up to 3 years | 14.1 | 13.0 | 16.8 | 16.9 | 13.1 | 12.1 | 14.7 | 13.9 | | c) Over 3 years and up to 5 years | 11.8 | 13.3 | 8.5 | 8.6 | 3.3 | 2.3 | 10.5 | 11.3 | | d) Over 5 years | 54.3 | 56.2 | 27.8 | 23.7 | 5.4 | 4.4 | 44.9 | 44.2 | Notes: 1. The sum of components may not add up to 100 due to rounding-off.
2. #: Data includes SFBs.
Source: Annual accounts of banks. |
 IV.18 Loans to non-residents decelerated relative to a year ago, but the share of these loans in total international assets of Indian banks increased, indicating that they continued to be a major determinant of asset growth (Table IV.5). IV.19 The consolidated international claims of banks declined across maturities and shifted away from non-financial private and official sectors in favour of banks (Table IV.6). | Table IV.4: International Liabilities of Banks in India – By Type of Instruments | | (Amount in ₹ billion) | | Liability Type | Amount Outstanding (At end-March) P | Percentage Variation | | 2017 | 2018 | 2016-17 | 2017-18 | | 1. Loans and Deposits | 9,027 | 10,020 | -8.5 | 11.0 | | | (78.4) | (77.8) | | | | a) Foreign Currency Non-resident (Bank) [FCNR (B)] Scheme | 1,343 | 1,436 | -49.8 | 6.9 | | | (11.7) | (11.2) | | | | b) Foreign Currency Borrowings* | 1,229 | 1,504 | -23.6 | 22.3 | | | (10.7) | (11.7) | | | | c) Non-resident External Rupee (NRE) Accounts | 5,100 | 5,517 | 26.1 | 8.2 | | | (44.3) | (42.9) | | | | d) Non-resident Ordinary (NRO) Rupee Accounts | 674 | 790 | 12.7 | 17.2 | | | (5.9) | (6.1) | | | | 2. Own Issues of Securities/ Bonds | 78 | 12 | 6.8 | -85.1 | | | (0.7) | (0.1) | | | | 3. Other Liabilities | 2,410 | 2,841 | 0.8 | 17.9 | | | (20.9) | (22.1) | | | | Of which: | | | | | | a) ADRs/GDRs | 415 | 452 | 18.9 | 9.1 | | | (3.6) | (3.5) | | | | b) Equities of Banks Held by Non-residents | 974 | 1396 | 7.8 | 43.3 | | | (8.5) | (10.6) | | | | c) Capital / Remittable Profits of Foreign Banks in India and Other Unclassified International Liabilities | 1,021 | 993 | -10.4 | -2.8 | | | (8.9) | (7.7) | | | | Total International Liabilities | 11,515 | 12,873 | -6.6 | 11.8 | | | (100) | (100) | | | Notes: 1. P: Provisional.
2. *: Inter-bank borrowings in India and from abroad and external commercial borrowings of banks.
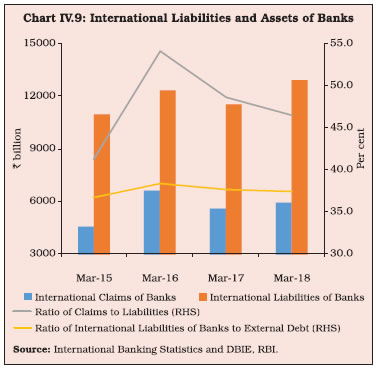
3. Figures in parentheses are percentages to total.
4. Percentage variation could be slightly different as absolute numbers have been rounded off to ₹ billion.
Source: International Banking Statistics, RBI. | IV.20 Banks’ consolidated international claims also underwent geographical changes favouring the United States (U.S.) and Singapore at the cost of countries such as Germany, the United Arab Emirates (U.A.E.), Hong Kong and the United Kingdom (U.K.) as U.S. dollar interest rates firmed up (Table IV.7). 2.7 Off-balance Sheet Operations IV.21 PVBs and FBs generally run up higher exposures to contingent liabilities than PSBs which focus more on fund-based banking. Moreover, as exposure to these instruments have different counter-party risk profiles, PSBs have been exercising prudence in view of the already elevated credit risk crystallising in their balance sheets (Chart IV.10a). At end-March 2018, on-balance sheet liabilities of FBs accounted for only 5.7 per cent of the total balance sheet size of all SCBs, but their contingent liabilities were 50.2 per cent of the total off-balance sheet exposure of the banking system. During 2017- 18, off-balance sheet liabilities of PVBs and FBs witnessed significant expansion, driven by exposure to derivative products (Chart IV.10b; Appendix Table IV.2). In H1:2018-19, off-balance sheet exposures of PVBs and FBs accelerated further while those of PSBs decelerated on a y-o-y basis. | Table IV.5: International Assets of Banks in India - By Type of Instruments* | | (Amount in ₹ billion) | | Asset Type | Amount Outstanding (At end-March) P | Percentage Variation | | 2017 | 2018 | 2016-17 | 2017-18 | | 1. Loans and Deposits | 5,472 | 5,838 | -16.7 | 6.7 | | | (98.0) | (97.6) | | | | Of which: | | | | | | (a) Loans to Non-residents | 1,668 | 1,965 | 54.9 | 17.8 | | | (29.9) | (32.9) | | | | (b) Foreign Currency Loan to Residents | 1,546 | 1,537 | -8.1 | -0.6 | | | (27.7) | (25.7) | | | | (c) Outstanding Export Bills | 855 | 893 | -56.8 | 4.4 | | | (15.3) | (14.9) | | | | (d) Foreign Currency in hand, Travellers Cheques, etc. | 3.5 | 9.8 | 743.3 | 180.6 | | | (0.1) | (0.2) | | | | (e) NOSTRO Balances and Placements Abroad | 1,399 | 1,433 | -23.6 | 2.4 | | | (25.1) | (24.0) | | | | 2. Holdings of Debt Securities | 66 | 92 | 8.8 | 39.6 | | | (1.2) | (1.5) | | | | 3. Other International Assets | 47 | 50 | 29.1 | 5.5 | | | (0.9) | (0.8) | | | | Total International Assets* | 5,586 | 5,980 | -16.2 | 7.1 | | | (100) | (100) | | | Notes: 1. *: In view of the incomplete data coverage from all the branches, the data reported under the locational banking statistics (LBS) are not strictly comparable with those capturing data from all the branches.
2. P: Provisional.
3. The sum of components may not add up due to rounding off.
Source: International Banking Statistics, RBI. |
| Table IV.6: Consolidated International Claims of Banks: Residual Maturity and Sector | | (Amount in ₹ billion) | | Residual Maturity/Sector | Amount Outstanding (At end-March) P | Percentage Variation | | 2017 | 2018 | 2016-17 | 2017-18 | | Total Consolidated International Claims | 7,168 | 6,371 | 24.2 | -11.1 | | | (100) | (100) | | | | a) Maturity-wise | | | | | | 1. Short-term (residual maturity of less than one year) | 4,529 | 4,474 | 2.3 | -1.2 | | | (63.2) | (70.2) | | | | 2. Long-term (residual maturity of one year and above) | 2,605 | 1,774 | 99.1 | -31.9 | | | (36.3) | (27.8) | | | | 3. Unallocated | 34 | 123 | -15.1 | 260.0 | | | (0.5) | (1.9) | | | | b) Sector-wise | | | | | | 1. Banks | 1,841 | 2,084 | 3.2 | 13.2 | | | (25.7) | (32.7) | | | | 2. Official Sector | 657 | 202 | 638.8 | -69.2 | | | (9.2) | (3.2) | | | | 3. Non-Bank Financial Institutions | 3 | 6 | -98.2 | 91.5 | | | - | (0.1) | | | | 4. Non-Financial Private | 3,880 | 3,001 | 12.7 | -22.7 | | | (54.1) | (47.1) | | | | 5. Others | 787 | 1,079 | 163.2 | 37.1 | | | (11.0) | (16.9) | | | Notes: 1. P: Provisional.
2. -: Nil/negligible.
3. Figures in parentheses are percentages to total.
4. The sum of components may not add up due to rounding off.
5. Residual Maturity ‘Unallocated’ comprises maturity not applicable (for example, for equities) and maturity information not available.
6. The official sector includes official monetary authorities, general government and multilateral agencies.
7. Non-financial private sector includes non-financial corporations and households including non-profit institutions serving households (NPISHs).
8. Others include non-financial public sector undertakings and the unallocated sector.
9. Percentage variation could be slightly different as absolute numbers have been rounded off to ₹ billion.
Source: International Banking Statistics, RBI. |
| Table IV.7: Consolidated International Claims of Banks on Countries other than India | | (Amount in ₹ billion) | | Country | Amount Outstanding P | Percentage Variation | | 2017 | 2018 | 2016-17 | 2017-18 | | 1 | 2 | 3 | 4 | 5 | | Total Consolidated International Claims | 7,168 | 6,371 | 24.2 | -11.1 | | | (100.0) | (100.0) | | | | Of which | | | | | | 1. United States of America | 1,870 | 2,628 | 95.0 | 40.5 | | | (26.1) | (41.2) | | | | 2. United Kingdom | 427 | 401 | -1.8 | -5.9 | | | (6.0) | (6.3) | | | | 3. Hong Kong | 397 | 323 | -12.5 | -18.5 | | | (5.5) | (5.1) | | | | 4. Singapore | 404 | 425 | 20.1 | 5.2 | | | (5.6) | (6.7) | | | | 5. United Arab Emirates | 889 | 639 | 6.8 | -28.2 | | | (12.4) | (10.0) | | | | 6. Germany | 121 | 77 | -44.9 | -36.3 | | | (1.7) | (1.2) | | | Notes: 1. P: Provisional.
2. Figures in parentheses are percentages to total.
3. Percentage variation could be slightly different as absolute numbers have been rounded off to ₹ billion.
Source: International Banking Statistics, RBI. | 3. Financial Performance IV.22 The financial performance of banks during 2017-18 was burdened by deteriorating asset quality and treasury losses which impacted non-interest earnings. 3.1 Income IV.23 While interest income remained subdued during 2017-18, non-interest income was pulled down by higher provisioning requirements for mark-to-market losses in G-secs portfolios due to hardening of yields on the one hand, and by a decline in income from off-balance sheet operations, on the other (Table IV.8). 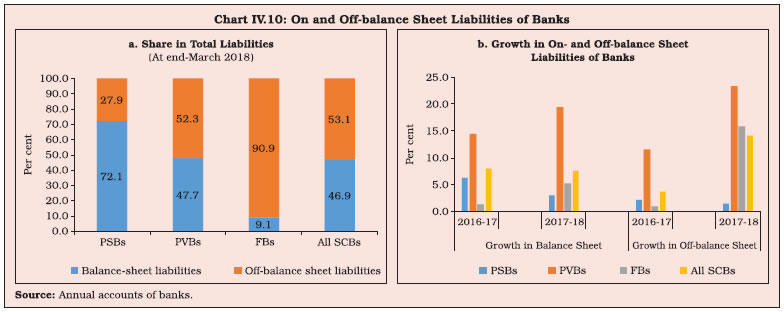
| Table IV.8: Trends in Income and Expenditure of Scheduled Commercial Banks | | (Amount in ₹ billion) | | Item | 2016-17 | 2017-18 | | Amount | Percentage Variation | Amount | Percentage Variation | | 1. Income | 12,053 | 6.2 | 12,176 | 1.0 | | a) Interest Income | 10,120 | 2.1 | 10,220 | 1.0 | | b) Other Income | 1,933 | 34.2 | 1,956 | 1.2 | | 2. Expenditure | 11,614 | 5.5 | 12,500 | 7.6 | | a) Interest Expended | 6,692 | 0.5 | 6,535 | -2.3 | | b) Operating Expenses | 2,484 | 10.2 | 2,716 | 9.3 | | of which: Wage Bill | 1,276 | 6.8 | 1,326 | 3.9 | | c) Provisions and Contingencies | 2,438 | 16.4 | 3,249 | 33.3 | | 3. Operating Profit | 2,877 | 18.1 | 2,925 | 1.7 | | 4. Net Profit | 439 | 28.6 | -324 | – | | 5. Net Interest Income (NII) (1a-2a) | 3,428 | 5.5 | 3,685 | 7.5 | | 6. Net Interest Margin (NII as Percentage of Average Assets) | 2.5 | | 2.5 | | Notes: 1. Data includes SFBs.
2. Percentage variations could be slightly different as absolute numbers have been rounded off to ₹ billion.
Source: Annual accounts of banks. | 3.2 Expenditure IV.24 On the expenditure side, interest expended by SCBs declined marginally from a year ago, due to slowdown in deposit growth and a decline in interest rates. This boosted net interest income (NII), although due to an uptick in average assets, the net interest margin (NIM) remained unaffected. IV.25 Growth in operating expenses remained broadly the same as in 2016-17, although the wage bill decelerated on account of rationalisation of bank branches. 3.3 Provisioning and Profitability IV.26 Loan loss provisioning rose sharply in 2017-18 due to elevated levels of GNPAs and time-bound referrals of large delinquent accounts to the National Company Law Tribunals (NCLTs) under the IBC. The provision coverage ratio (PCR) accordingly showed improvement across bank groups and crossed 52 per cent for all SCBs in H1:2018-19. Nonetheless, the PCRs of PSBs were the lowest among the three bank groups (Chart IV.11). IV.27 As a result of higher provisioning, PSBs incurred net losses to the tune of ₹854 billion, while PVBs and FBs continued to report net profits. Since 2015-16, provisioning by PSBs has consistently exceeded their operating profit or earnings before provisions and taxes (EBPT), resulting in net losses (Chart IV.12). IV.28 During H1:2018-19, net interest income of SCBs picked up as interest income outpaced interest expenses sizably as lending rates rose. However, non-interest income declined on a y-o-y basis due to treasury losses. Operating expenses continued to grow by around 10 per cent on average, leading to a marginal deceleration in operating profit growth. SCBs as a whole continued to incur net losses during H1:2018-19, mainly due to higher provisioning by PSBs.
IV.29 The return on assets (RoA) and the return on equity (RoE) of various bank groups declined during 2017-18. These ratios turned negative for SCBs as a whole. PSBs had to undergo significant erosion in RoE due to contraction in net profit (Table IV.9). RoA and RoE of all SCBs remained negative during H1:2018-19 as well. | Table IV.9: Return on Assets and Return on Equity of SCBs – Bank Group-wise | | (Per cent) | | Bank group | Return on Assets | Return on Equity | | 2016-17 | 2017-18 | 2016-17 | 2017-18 | | Public Sector Banks | -0.1 | -0.8 | -2.0 | -14.6 | | Private Sector Banks | 1.3 | 1.1 | 11.9 | 10.1 | | Foreign Banks | 1.6 | 1.3 | 9.1 | 7.2 | | All SCBs | 0.4 | -0.2 | 4.2 | -2.8 | Notes: 1. Return on assets = Return on assets for the bank groups are obtained as weighted average of return on assets of individual banks in the group, weights being the proportion of total assets of the bank as percentage to total assets of all banks in the corresponding bank group.
2. Return on equity = Net profit/Average total equity.
Source: Annual accounts of banks. | IV.30 The spread, defined as the difference between returns and cost of funds, remained at the same level as in the previous year, although there was an uptick in respect of PVBs (Table IV.10). | Table IV.10: Cost of Funds and Return on Funds - Bank Group-wise | | (Per cent) | | Bank Group / Year | Cost of Deposits | Cost of Borrowings | Cost of Funds | Return on Advances | Return on Investments | Return on Funds | Spread | | 1 | 2 | 3 | 4 | 5 | 6 | 7 | 8 | 9 = 8-5 | | PSBs | 2016-17 | 5.7 | 4.8 | 5.6 | 8.4 | 7.5 | 8.2 | 2.5 | | | 2017-18 | 5.1 | 4.7 | 5.1 | 7.8 | 7.1 | 7.5 | 2.5 | | PVBs | 2016-17 | 5.6 | 6.6 | 5.8 | 10.0 | 7.5 | 9.3 | 3.5 | | | 2017-18 | 4.9 | 6.2 | 5.2 | 9.5 | 6.9 | 8.8 | 3.6 | | FBs | 2016-17 | 4.2 | 4.3 | 4.2 | 8.8 | 6.8 | 7.9 | 3.7 | | | 2017-18 | 3.8 | 3.0 | 3.7 | 8.1 | 6.6 | 7.4 | 3.7 | | All SCBs | 2016-17 | 5.6 | 5.4 | 5.6 | 8.9 | 7.4 | 8.4 | 2.8 | | | 2017-18 | 5.0 | 5.3 | 5.1 | 8.3 | 7.0 | 7.9 | 2.8 | Notes: 1. Cost of deposits = Interest paid on deposits/Average of current and previous year’s deposits.
2. Cost of borrowings = (Interest expended - Interest on deposits)/Average of current and previous year’s borrowings.
3. Cost of funds = Interest expended / (Average of current and previous year’s deposits plus borrowings).
4. Return on advances = Interest earned on advances /Average of current and previous year’s advances.
5. Return on investments = Interest earned on investments /Average of current and previous year’s investments.
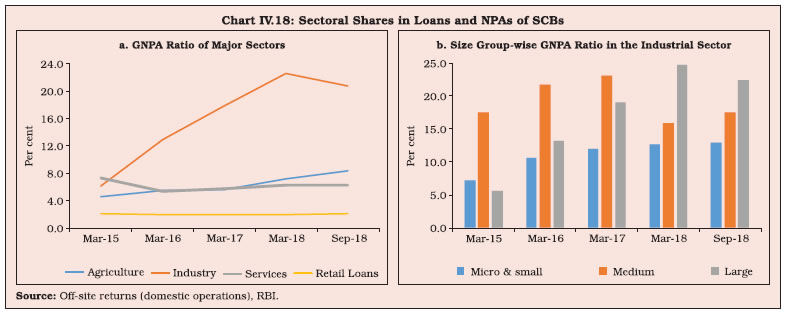
6. Return on funds = (Interest earned on advances + Interest earned on investments) / (Average of current and previous year’s advances plus investments).
7. Data for both 2016-17 and 2017-18 include SFBs.
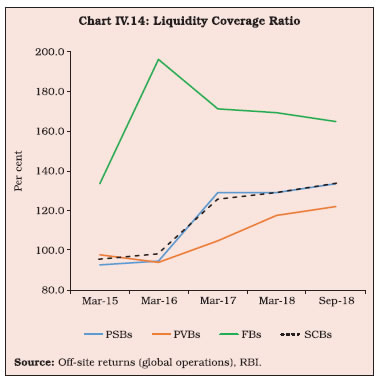
Source: Annual accounts of banks. | 4. Soundness Indicators IV.31 Soundness indicators are barometers of the financial health of the banking sector. During 2017-18 and 2018-19 (up to September 2018), capital adequacy remained above regulatory requirements in spite of the NPA ratio increasing. Leverage and liquidity coverage ratios (LCR) also witnessed improvement. 4.1 Capital Adequacy IV.32 The capital to risk-weighted assets ratio (CRAR) of SCBs edged up during 2017-18 with the phased implementation of Basel III. Besides higher provisioning requirements, banks are augmenting capital partly in anticipation of the implementation of Indian Accounting Standards (Ind-AS), which would require provisions for expected credit loss from the time a loan is originated rather than waiting for trigger events. All bank groups remained well-capitalised and above the regulatory requirement of 10.875 per cent (including the capital conservation buffer (CCB)) for March 2018. While the CRARs of PVBs and FBs continued to improve, the capital position of PSBs worsened due to the persisting deterioration in asset quality and incurring of losses (Table IV.11). During H1:2018-19, CRARs of all SCBs deteriorated marginally driven by PSBs and FBs. CRARs of PVBs remained stable. | Table IV.11: Component-wise Capital Adequacy of SCBs | | (At end-March) | | (Amount in ₹ billion) | | | PSBs | PVBs | FBs | SCBs | | 2017 | 2018 | 2017 | 2018 | 2017 | 2018 | 2017 | 2018 | | 1. Capital Funds | 7,047 | 6,578 | 4,239 | 5,157 | 1,373 | 1,487 | 12,659 | 13,221 | | i) Tier I Capital | 5,480 | 5,270 | 3,643 | 4,470 | 1,292 | 1,407 | 10,414 | 11,147 | | ii) Tier II Capital | 1,567 | 1,308 | 596 | 687 | 81 | 80 | 2,245 | 2,074 | | 2. Risk Weighted Assets | 58,053 | 56,414 | 27,289 | 31,383 | 7,335 | 7,799 | 92,677 | 95,596 | | 3. CRAR (1 as % of 2) | 12.1 | 11.7 | 15.5 | 16.4 | 18.7 | 19.1 | 13.7 | 13.8 | | Of which: Tier I | 9.4 | 9.3 | 13.3 | 14.2 | 17.6 | 18.0 | 11.2 | 11.7 | | Tier II | 2.7 | 2.3 | 2.2 | 2.2 | 1.1 | 1.0 | 2.4 | 2.2 | | Source: Off-site returns (domestic operations), RBI. | IV.33 The Tier I capital ratio of PSBs declined marginally during 2017-18 despite decline in risk weighted assets (RWAs); the ratio improved in the case of other bank groups. However, during H1:2018-19, in addition to PSBs, the Tier I capital ratio of FBs also deteriorated, while that of PVBs experienced improvement. IV.34 The government has infused capital into PSBs from time to time to enable banks to meet regulatory requirements and to support credit growth. In October 2017, a recapitalisation package for PSBs amounting to ₹2.1 trillion was announced. The government provided ₹881 billion in 2017-18, with ₹523 billion allocated to 11 PSBs which are under prompt corrective action (PCA). The remaining ₹358 billion was allocated to nine non-PCA PSBs. The government fixed the coupon rates on recapitalisation bonds in the range of 7.35 - 7.68 per cent, with maturity dates varying from 2028 to 2033. The bonds would have to be held in the held-to-maturity category of investments by PSBs without any limit. They would not qualify for being reckoned under the statutory liquidity ratio (SLR) and would not be tradable. Apart from capital infusion by the government, banks were expected to raise ₹580 billion from markets, which remains incomplete. Recapitalisation of the order of ₹650 billion was planned for 2018-19, which was for further enhanced to ₹1,060 billion on Decemeber 20, 2018. This is aimed at meeting regulatory capital norms and strengthening amalgamating banks by providing regulatory and growth capital. 4.2 Leverage Ratio IV.35 The leverage ratio, defined as the ratio of Tier I capital to total exposure (including off-balance sheet exposures), complements risk-based capital requirements as a backstop measure. It is considered significantly more counter-cyclical than the risk weighted regulatory capital ratio and is intended to contain the system-wide build-up of leverage. At end-March 2018, the leverage ratio of SCBs was 6.7 per cent. This is above the Pillar I prescription of 3 per cent by the Basel Committee on Banking Supervision (BCBS) with effect from January 1, 2018 and also above the 4.5 per cent level monitored by the Reserve Bank. For PSBs, it was lower than PVBs and FBs. During H1:2018-19, while the leverage ratio of PSBs and FBs declined, that of PVBs witnessed a marginal uptick, resulting in a decline in the leverage ratio of all SCBs (Chart IV.13). 4.3 Liquidity Coverage Ratio IV.36 The liquidity coverage ratio (LCR) is intended to promote short-term resilience of banks’ liquidity profile, i.e., they should have sufficient high-quality liquid assets (HQLAs) to withstand a 30-day stressed funding scenario. Under the Basel III process, SCBs will have to reach the minimum LCR of 100 per cent by January 1, 2019. At present, the total carve-out from the SLR that is available to banks as Level 1 HQLAs for the purpose of computing LCR is 15 per cent of their net demand and time liabilities (NDTL), in addition to, inter alia, government securities held by banks in excess of the minimum SLR requirement. Furthermore, the Reserve Bank allowed a further carve-out up to 0.5 per cent of each bank’s NDTL with a view to incentivising the banks to lend to NBFCs and HFCs with effect from October 19, 20185. During 2017-18 and H1:2018-19, SCBs improved their LCR positions further and remained much above the Basel III requirement. FBs maintained the highest LCRs, followed by PSBs and PVBs (Chart IV.14). 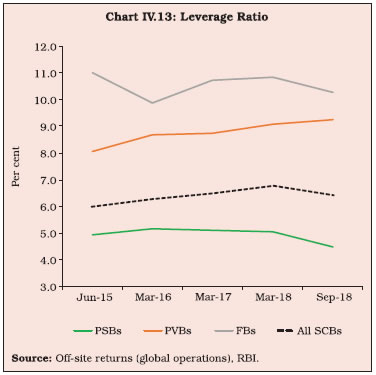
 4.4 Net Stable Funding Ratio IV.37 In contrast to the LCR, the net stable funding ratio (NSFR) is intended to ensure reduction in liquidity mismatches over a longer time horizon by requiring banks to fund their activities with sufficiently stable sources in order to mitigate the risk of future funding stress. Final guidelines on NFSR were issued by the Reserve Bank on May 17, 2018, which will be implemented from April 1, 2020. 4.5 Non-performing Assets IV.38 The deterioration in asset quality of Indian banks, especially PSBs, can be traced to the credit boom of 2006-2011 when bank lending grew at an average rate of over 20 per cent. Other factors that contributed to the deterioration in asset quality were lax credit appraisal and post-sanction monitoring standards; project delays and cost overruns; and absence of a strong bankruptcy regime until May 2016. IV.39 During 2017-18, the GNPA ratio reached 14.6 per cent for PSBs due to restructured advances slipping into NPAs and better NPA recognition. For PVBs, it remained at a much lower level but rose during the year. The asset quality of FBs improved marginally (Chart IV.15). Supervisory data suggest that during H1:2018- 19, the resolution of some large NPA accounts resulted in an improvement in asset quality of SCBs, IV.40 Resolute efforts on the part of PVBs to clean up their balance sheets through higher write-offs and better recoveries also contributed to low GNPA ratios (Chart IV.16). Data from supervisory returns suggest a decline in the ratio of write-offs to GNPAs during H1:2018- 19 across bank groups and an improvement in actual recoveries. IV.41 In terms of the net NPA ratio, PSBs experienced significant deterioration during 2017-18 (Table IV.12). IV.42 During the year, the share of doubtful advances in total GNPAs increased sizably, driven up by PSBs. The share of sub-standard and loss assets in GNPAs of PVBs declined under the impact of aggressive write-offs (Table IV.13). During H1:2018-19, the share of sub-standard and doubtful advances of SCBs declined, while that of loss assets increased marginally. 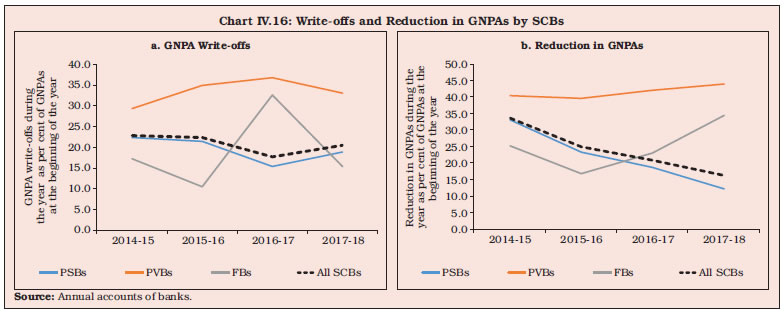
| Table IV.12: Trends in Non-performing Assets - Bank Group-wise | | (Amount in ₹ billion) | | Item | PSBs* | PVBs | FBs | All SCBs# | | Gross NPAs | | | | | | Closing Balance for 2016-17 | 6,847^ | 932 | 136 | 7,918 | | Opening Balance for 2017-18 | 6,192^ | 932 | 136 | 7,265 | | Addition during the year 2017-18 | 4,882^ | 1,077 | 70 | 6,043 | | Recovered during the year 2017-18 | 823 | 408 | 47 | 1,283 | | Written-off during the year 2017-18 | 1,295 | 308 | 21 | 1,627 | | Closing Balance for 2017-18 | 8,956 | 1,293 | 138 | 10,397 | | Gross NPAs as per cent of Gross Advances** | | | | | | 2016-17 | 11.7 | 4.1 | 4.0 | 9.3 | | 2017-18 | 14.6 | 4.7 | 3.8 | 11.2 | | Net NPAs | | | | | | Closing Balance for 2016-17 | 3,831 | 478 | 21 | 4,331 | | Closing Balance for 2017-18 | 4,545 | 642 | 15 | 5,207 | | Net NPAs as per cent of Net Advances | | | | | | 2016-17 | 6.9 | 2.2 | 0.6 | 5.3 | | 2017-18 | 8.0 | 2.4 | 0.4 | 6.0 | Notes: 1. *: Includes IDBI Bank Ltd.
2. #: Data includes scheduled SFBs. As at end-March 2017 and end-March 2018, two and six scheduled SFBs, respectively, were operating.
3. **: Calculated taking gross NPAs from annual accounts of respective banks and gross advances from off-site returns (global operations).
4. ^: The opening balance of PSBs for 2017-18 does not match with that of closing balance of 2016-17 as the acquisition of associate banks and Bharatiya Mahila Bank by the State Bank of India is reflected under the head ‘Addition during the year 2017-18’.
Source: Annual accounts of banks and off-site returns (global operations), RBI. | IV.43 Supervisory returns suggest that on top of the elevated level of stressed assets, fresh slippages rose during 2017-18 in respect of PSBs as against a decline in the previous year. This is largely attributable to restructured advances slipping into NPAs and a decline in standard advances. Slippages in respect of PVBs moderated. Quarterly data from supervisory returns suggest a significant decline in fresh slippages across bank groups during H1:2018-19. IV.44 During 2017-18, the GNPA ratio of PSBs arising from larger borrowal accounts (exposure of ₹ 50 million or more) increased to 23.1 per cent from 18.1 per cent in the previous year. Similarly, the GNPA ratio of PVBs arising from large borrowal accounts registered an uptick, especially after the implementation of the revised framework of resolution of stressed assets from February 12, 2018. However, the share of special mention accounts (SMA–2), which have a high chance of degrading into NPAs, recorded a decline in case of both bank groups. During H1:2018-19, NPAs in large borrowal accounts of PSBs and PVBs declined; however, the proportion of SMA-2 loans in total loans recorded an uptick (Chart IV.17). | Table IV.13: Classification of Loan Assets - Bank Group-wise | | (At end-March) | | (Amount in ₹ billion) | | Bank Group | Year | Standard Assets | Sub-standard Assets | Doubtful Assets | Loss Assets | | Amount | Per cent* | Amount | Per cent* | Amount | Per cent* | Amount | Per cent* | | PSBs# | 2017 | 45,012 | 87.5 | 1,641 | 3.2 | 4,603 | 9.0 | 167 | 0.3 | | | 2018 | 46,021 | 84.5 | 2,053 | 3.8 | 5,936 | 10.9 | 465 | 0.9 | | PVBs | 2017 | 20,310 | 96.5 | 244 | 1.2 | 429 | 2.0 | 65 | 0.3 | | | 2018 | 24,506 | 96.0 | 272 | 1.1 | 700 | 2.7 | 52 | 0.2 | | FBs | 2017 | 3,302 | 96.0 | 40 | 1.2 | 82 | 2.4 | 14 | 0.4 | | | 2018 | 3,495 | 96.2 | 38 | 1.1 | 84 | 2.3 | 16 | 0.4 | | All SCBs** | 2017 | 68,624 | 90.4 | 1,925 | 2.5 | 5,114 | 6.7 | 247 | 0.3 | | | 2018 | 74,022 | 88.5 | 2,364 | 2.8 | 6,720 | 8.0 | 534 | 0.6 | Notes: 1. Constituent items may not add up to the total due to rounding off.
2. *: As per cent to gross advances.
3. #: Includes IDBI Bank Ltd.
4. **: Data exclude SFBs.
Source: Off-site returns (domestic operations), RBI. | IV.45 Although the share of priority sector NPAs in total NPAs declined marginally during 2017-18, it still constituted a fifth of the total (Table IV.14). IV.46 Sector-wise, industrial sector receives 37.3 per cent of total loans and advances, but it contributes about three-fourth of total NPAs. Asset quality in the industrial sector deteriorated during 2017-18, mainly with better recognition. The agricultural sector posted an uptick in the GNPA ratio possibly reflecting debt waiver by several states. During H1:2018-19, some moderation in industrial NPAs occurred due to resolution of certain large accounts. At the same time, the asset quality of loans to the agricultural sector worsened further. Loan defaults in retail loans remained at a low level (Chart IV.18a). Size-wise, one-fourth of loans to large industries turned into NPAs by the end of March 2018. Medium sized industries underwent improvement in loan quality during 2017-18, although in H1:2018-19, these industries were faced with an uptick in the GNPA ratio (Chart IV.18b). 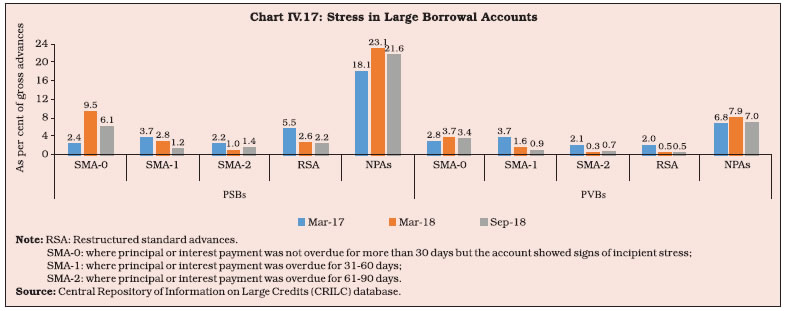
| Table IV.14: Sector-wise NPA s of Banks | | (At end-March) | | (Amount in ₹ billion) | | Bank Group | Priority Sector | Of which | Non-priority Sector | Total NPAs | | Agriculture | Micro and Small Enterprises | Others | | Amt. | Per cent# | Amt. | Per cent# | Amt. | Per cent# | Amt. | Per cent# | Amt. | Per cent# | Amt. | Per cent# | | PSBs* | | | | | | | | | | | | | | 2017 | 1,543 | 24.1 | 548 | 8.5 | 757 | 11.8 | 238 | 3.7 | 4,868 | 75.9 | 6,411 | 100 | | 2018 | 1,875 | 22.2 | 753 | 8.9 | 821 | 9.7 | 301 | 3.6 | 6,580 | 77.8 | 8,455 | 100 | | PVBs | | | | | | | | | | | | | | 2017 | 133 | 18.0 | 53 | 7.2 | 64 | 8.7 | 16 | 2.2 | 605 | 82.0 | 738 | 100 | | 2018 | 184 | 18.0 | 78 | 7.6 | 80 | 7.8 | 26 | 2.6 | 840 | 82.0 | 1,024 | 100 | | FBs | | | | | | | | | | | | | | 2017 | 24 | 17.8 | 1 | 0.5 | 4 | 3.1 | 19 | 14.3 | 112 | 82.2 | 136 | 100 | | 2018 | 12 | 8.6 | 1 | 0.6 | 6 | 4.0 | 6 | 4.0 | 126 | 91.4 | 138 | 100 | | All SCBs (including SFBs) | | | | | | | | | | | | | | 2017 | 1,703 | 23.4 | 602 | 8.3 | 828 | 11.4 | 273 | 3.7 | 5,587 | 76.6 | 7,288 | 100 | | 2018 | 2,076 | 21.6 | 832 | 8.6 | 910 | 9.5 | 334 | 3.5 | 7,555 | 78.4 | 9,626 | 100 | Notes: 1. Amt.: – Amount; Per cent: Per cent of total NPAs.
2. *: Includes IDBI Bank Ltd.
3. Constituent items may not add up to the total due to rounding off.
4. # Share in total NPAs.
Source: Off-site returns (domestic operations), RBI. |
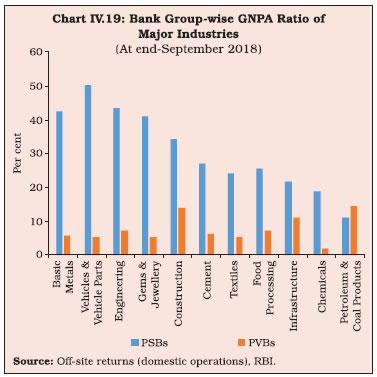
 IV.47 The gems and jewellery sector faced a significant increase in GNPAs during 2017-18 with the unearthing of frauds. In contrast, the cement sector benefitted from a significant decline in the GNPA ratio with resolution of some stressed accounts and an uptick in financial performance. The basic metals and metal products sector remained highly leveraged, although the proportion of bad loans declined in H1:2018-19 due to resolution of large NPA accounts in the steel sector. Other industries with high levels of stress were engineering, vehicles, construction and textiles. In all major industries, except for petroleum and coal products, the GNPA ratio of PSBs remained higher than that of PVBs (Chart IV.19). 4.6 Recoveries IV.48 Recovery of stressed assets improved during 2017-18 through the IBC, 2016 and Securitisation and Reconstruction of Financial Assets and Enforcement of Security Interests (SARFAESI) Act, 2002 (please see Box III.1 in Chapter III). Apart from vigorous efforts by banks for speedier recovery, amending the SARFAESI Act to bring in a provision of three months’ imprisonment in case the borrower does not provide asset details and for the lender to get possession of mortgaged property within 30 days, may have contributed to better recovery. Recovery through Lok Adalats and Debt Recovery Tribunals (DRTs) declined alongside the number of cases referred partly indicative of growing clout of the IBC mechanism for resolution of stressed assets (Table IV.15). | Table IV.15: NPAs of SCBs Recovered through Various Channels (Corrected) | | (Amount in ₹ billion) | | Recovery Channel | 2016-17 | 2017-18 (P) | | No. of Cases Referred | Amount Involved | Amount Recovered* | Col. (4) as % of Col. (3) | No. of Cases Referred | Amount Involved | Amount Recovered | Col. (8) as % of Col. (7) | | 1 | 2 | 3 | 4 | 5 | 6 | 7 | 8 | 9 | | i) Lok Adalats | 3,555,678 | 361 | 23 | 6.3 | 3,317,897 | 457 | 18* | 4.0 | | ii) DRTs | 32,418 | 1,008 | 103 | 10.2 | 29,551 | 1,333 | 72* | 5.4 | | iii) SARFAESI Act | 199,352 | 1,414 | 259 | 18.3 | 91,330 | 1,067 | 265* | 24.8 | | iv) IBC | 37@ | - | - | - | 701@ | 99# | 49^ | 49.6 | | Total | 3,787,485 | 2,783 | 385 | 13.8 | 3,439,477 | 2,956 | 404 | 13.7 | Notes: 1. P: Provisional.
2. *: Refers to amount recovered during the given year, which could be with reference to cases referred during the given year as well as during the earlier years.
3. DRTs - Debt Recovery Tribunals.
4. @: Cases admitted by National Company Law Tribunals (NCLTs).
5. #: Claims admitted of financial creditors (FCs) on 21 companies for which resolution plans were approved.
6. ^: Realisation by FCs from 21 companies for which resolution plans were approved.
Source: RBI and Insolvency and Bankruptcy Board of India. |
 IV.49 Apart from recovery through various resolution mechanisms, banks are also cleaning up balance sheets through sale of doubtful/ loss assets to assets reconstruction companies (ARCs) and other banks/NBFCs/financial institutions by taking haircuts. During 2017-18, the acquisition cost of ARCs as a proportion to the book value of assets increased, indicating better realisations by banks on sale of stressed assets. Bank group-wise, PVBs have been most aggressive on asset sales. PSBs lagged in asset sales mainly owing to large haircuts and various management issues (Chart IV.20). On the positive side, some PSBs have strengthened in-house expertise for recovery of NPAs, spurred by the need for faster resolution. Quarterly data suggests that during H1:2018-19, sales of stressed assets to ARCs by both PSBs and PVBs witnessed deceleration. 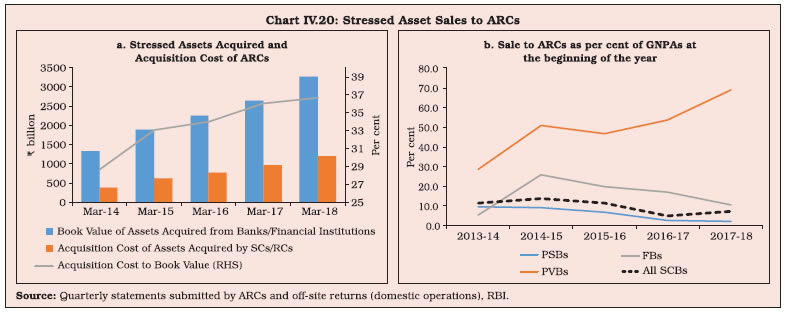 IV.50 The share of subscriptions by banks to security receipts (SRs) issued by ARCs declined to 79.7 per cent by end-June 2018 from 82.7 per cent a year ago (Table IV.16). Since April 1, 2017 the provisioning norms have been made progressively stringent in order to reduce their investments in SRs and incentivise ARCs and other financial institutions to bring in more capital. 4.7 Revised Prompt Corrective Action Framework IV.51 The Prompt Corrective Action (PCA) framework was revised by the Reserve Bank with effect from April 1, 2017. Under the framework, the Reserve Bank monitors key performance indicators of the banks as an early warning exercise and PCA is initiated once the thresholds relating to capital, asset quality and profitability are breached. These parameters are tracked through the CRAR/CET 1 ratio, the net NPA ratio and RoA. Additionally, leverage is monitored through the Tier 1 leverage ratio. The objective of the PCA framework is to incentivise banks to take corrective measures in a timely manner in order to restore their financial health. The framework also provides an opportunity to the Reserve Bank to pay focused attention on these banks by engaging with the management more closely. Under the PCA framework, banks eschew riskier activities and focus on conserving capital so that their balance sheets become stronger. The framework prescribes certain mandatory and discretionary actions such as restrictions on dividend pay-out, branch expansion, restriction on capital expenditure other than for technology upgradation, entering new lines of business, staff expansion, reduction in concentration of exposure, unrated exposure, expansion of risk-weighted assets, reduction in high-cost deposits and improving CASA deposits. | Table IV.16: Details of Financial Assets Securitised by ARCs | | (Amount in ₹ billion) | | Item | Jun-15 | Jun-16 | Jun-17 | Jun-18 | | 1. Book Value of Assets Acquired | 1,744 | 2,377 | 2,627 | 3,306 | | 2. Security Receipts issued by ARCs | 536 | 790 | 939 | 1,203 | | 3. Security Receipts Subscribed to by | | | | | | (a) Banks | 441 | 651 | 777 | 960 | | (b) ARCs | 73 | 114 | 142 | 202 | | (c) FIIs | 1 | 3 | 3 | 5 | | (d) Others (Qualified Institutional Buyers) | 21 | 22 | 18 | 37 | | 4. Amount of Security Receipts Completely Redeemed | 62 | 72 | 74 | 88 | | 5. Security Receipts Outstanding | 413 | 641 | 783 | 981 | | Source: Quarterly statement submitted by ARCs. | IV.52 Up to end-September 2018, 11 PSBs have been placed under PCA, with five PSBs in the quarter ending June 2017, another five PSBs in the quarter ending December, 2017 and one PSB in the quarter ending March, 2018. Dhanlaxmi Bank is the only PVB which remains under the old PCA framework. IV.53 PCA banks have shown improvement in the share of CASA deposits with a reduction in the share of bulk deposits working towards reduction in the cost of deposits. They have also increased recoveries from NPAs, while containing the growth in advances and deposits, reducing riskiness of assets and focusing on better rated assets as reflected in reduction in RWAs. They have also shown lower growth in GNPAs, relative to non-PCA PSBs. Various restrictions on PCA banks have resulted in reining in the growth in operating expenses. Some PCA banks have made efforts to identify and sell their non-core assets. However, asset quality and capital position have experienced deterioration. The sharper increase in NPA ratios compared to non-PCA PSBs is also because of decline in advances by the former. As a result, profitability has taken a hit as reflected in negative RoAs (Chart IV.21). 4.8 Frauds in the Banking Sector6 IV.54 Frauds have emerged as the most serious concern in the management of operational risk, with 90 per cent of them located in the credit portfolio of banks. In 2017-18, however, frauds related to off-balance sheet operations, foreign exchange transactions, deposit accounts and cyber-activity have taken the centre stage. The modus operandi of large value frauds involves opening current accounts with banks outside the lending consortium without a no-objection certificate from lenders, deficient and fraudulent services/certification by third party entities, diversion of funds by borrowers through various means, including through associated/shell companies, lapses in credit underwriting standards and failing to identify early warning signals. In terms of amount, frauds in the banking sector increased sharply in 2017- 18 mainly reflecting a large value case in the jewellery sector (Table IV.17). Incidentally, large value frauds involving ₹500 million and above constituted about 80 per cent of all the frauds during the year. 93 per cent of the frauds in terms of amount of more than ₹0.1 million occurred in PSBs while PVBs accounted for six per cent. 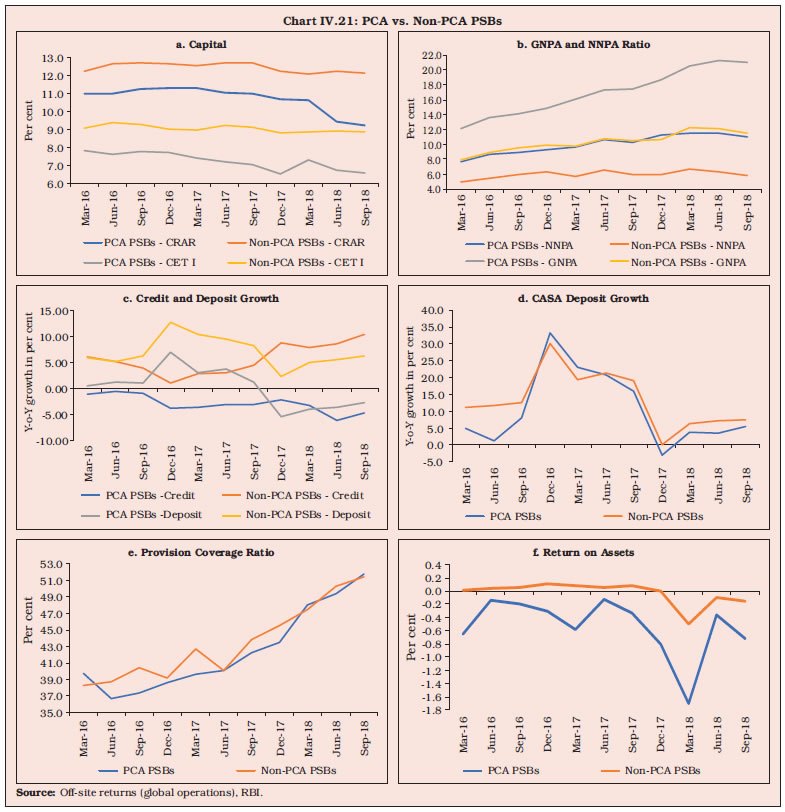
| Table IV.17: Frauds in Various Banking Operations | | (Cases in number and amount in ₹ million) | | Area of Operation | 2013-14 | 2014-15 | 2015-16 | 2016-17 | 2017-18 | | No. | Amount | No. | Amount | No. | Amount | No. | Amount | No. | Amount | | Advances | 1,990 | 84,121 | 2,251 | 171,222 | 2,125 | 173,681 | 2,322 | 205,614 | 2,526 | 225,590 | | Deposits | 773 | 3,315 | 876 | 4,369 | 757 | 8,087 | 695 | 9,027 | 691 | 4,567 | | Cyber | 978 | 545 | 845 | 517 | 1,191 | 402 | 1,372 | 423 | 2,059 | 1,096 | | Off-balance sheet | 15 | 10,885 | 10 | 6,994 | 4 | 1,324 | 5 | 633 | 20 | 162,877 | | Foreign exchange transactions | 9 | 1,439 | 16 | 8,987 | 17 | 508 | 16 | 22,010 | 9 | 14,258 | | Cash | 145 | 237 | 153 | 431 | 160 | 220 | 239 | 365 | 218 | 403 | | Cheques/demand drafts | 180 | 188 | 254 | 261 | 234 | 250 | 235 | 404 | 207 | 341 | | Clearing, etc accounts | 36 | 237 | 29 | 68 | 17 | 866 | 27 | 57 | 37 | 56 | | Inter-branch accounts | 7 | 5 | 4 | 3 | 4 | 101 | 1 | 4 | 6 | 12 | | Non-resident accounts | 38 | 96 | 22 | 76 | 8 | 88 | 11 | 34 | 6 | 55 | | Others | 135 | 641 | 179 | 1,623 | 176 | 1,460 | 153 | 768 | 138 | 2,421 | | Total | 4,306 | 101,708 | 4,639 | 194,551 | 4,693 | 186,988 | 5,076 | 239,339 | 5,917 | 411,677 | Notes: 1 Refers to frauds of ₹0.1 million and above
2. The figures reported by banks and FIs are subject to change based on revisions filed by them.
Source: RBI. | 5. Sectoral Distribution of Bank Credit IV.55 During 2017-18, bank credit to agriculture decelerated, partly reflecting pervasive risk aversion and debt waivers by various state governments, which may have disincentivised lending to the sector. Credit growth to industries turned positive in November 2017 after a hiatus of 13 months, but it remained anaemic. Credit to NBFCs picked up, especially to those with high credit ratings. Personal loans continued to register robust growth in 2017-18. During 2018-19 (up to September) credit growth reached double digits, largely driven by services sector lending and personal loans (Table IV.18). | Table IV.18: Sectoral Deployment of Gross Bank Credit | | (Amount in ₹ billion) | | Sr. No | Item | Outstanding as on | Per cent variation (y-o-y) | | Mar-17 | Mar-18 | Sep-18 | 2016-17 | 2017-18 | 2018-19 (up to Sep) | | 1 | Agriculture & Allied Activities | 9,924 | 10,302 | 10,544 | 12.4 | 3.8 | 5.8 | | 2 | Industry, of which | 26,798 | 26,993 | 27,016 | -1.9 | 0.7 | 2.3 | | | 2.1 Micro and Small Industries | 3,697 | 3,730 | 3,638 | -0.5 | 0.9 | -1.4 | | | 2.2 Medium | 1,048 | 1,037 | 1,053 | -8.7 | -1.1 | 3.3 | | | 2.3 Large | 22,053 | 22,226 | 22,326 | -1.7 | 0.8 | 2.9 | | 3 | Services, of which | 18,022 | 20,505 | 22,014 | 16.9 | 13.8 | 24.0 | | | 3.1 Trade | 4,279 | 4,669 | 4,815 | 12.3 | 9.1 | 10.8 | | | 3.2 Commercial Real Estate | 1,856 | 1,858 | 1,847 | 4.5 | 0.1 | -0.8 | | | 3.3 Tourism, Hotels & Restaurants | 375 | 365 | 374 | 1.2 | -2.7 | 1.0 | | | 3.4 Computer Software | 179 | 186 | 192 | -6.3 | 4.1 | 6.0 | | | 3.5 Non-banking Financial Companies | 3,910 | 4,964 | 5,467 | 10.9 | 26.9 | 41.5 | | 4 | Personal Loans | 16,200 | 19,085 | 20,200 | 16.4 | 17.8 | 15.1 | | 5 | Non-food Credit (1-4) | 70,945 | 76,884 | 79,774 | 8.4 | 8.4 | 11.3 | | 6 | Gross Bank credit | 71,455 | 77,303 | 80,250 | 7.5 | 8.2 | 11.3 | Notes: 1. Percentage variations could be slightly different as absolute numbers have been rounded off to ₹ billion.
2. Data are provisional and relate to select banks which cover about 90 per cent of total non-food credit extended by all SCBs.
Source: RBI. | 5.1 Retail Loans IV.56 Banks continued to post robust growth in retail loans in 2017-18. Housing loans were supported by incentives for affordable housing such as the Pradhan Mantri Awas Yojana (PMAY) and the implementation of the Real Estate (Regulation and Development) Act (RERA). Furthermore, rationalisation of risk weights and provisioning on standard assets in certain categories of individual housing loans in June 2017 gave a fillip to the segment. Auto loans growth also edged up (Table IV.19). During H1:2018-19, retail loans continued to record robust growth driven by housing and auto loans and credit card receivables. IV.57 PSB loan growth was comparable to PVBs in the retail loans segment, which is relatively stress-free (Chart IV.22). 5.2 Priority Sector Credit IV.58 Priority sector credit growth recovered in 2017-18, largely driven by a recovery in credit to micro, small and medium enterprises (MSME) (Chart IV.23). In contrast to total agricultural credit, kisan credit card (KCC) loans recorded muted growth during the year (Appenidix Table IV.3). 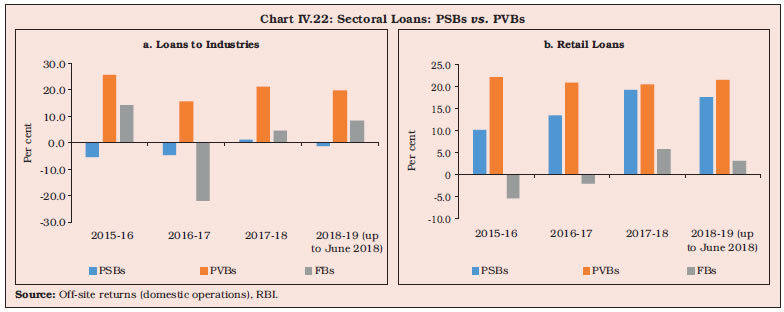
| Table IV.19: Retail Loan Portfolio of Banks | | (At end-March) | | (Amount in ₹ billion) | | Sr. No. | Item | Amount Outstanding | Percentage Variation | | 2017 | 2018 | 2017 | 2018 | | 1 | Housing Loans | 8,539 | 10,230 | 12.0 | 19.8 | | 2 | Consumer Durables | 215 | 190 | 18.4 | -11.6 | | 3 | Credit Card Receivables | 649 | 828 | 38.3 | 27.7 | | 4 | Auto Loans | 1,867 | 2,388 | 21.0 | 27.9 | | 5 | Education Loans | 729 | 728 | 7.0 | -0.1 | | 6 | Advances against Fixed Deposits (incl. FCNR (B), etc.) | 680 | 635 | -6.0 | -6.6 | | 7 | Advances to Individuals against Shares, Bonds, etc. | 51 | 64 | -2.8 | 26.1 | | 8 | Other Retail Loans | 3,396 | 4,192 | 26.3 | 23.4 | | | Total Retail Loans | 16,126 | 19,255 | 15.5 | 19.4 | Note: Percentage variations could be slightly different as absolute numbers have been rounded off to ₹ billion.
Source: Off-site returns (domestic operations), RBI. | IV.59 Since 2015-16, SCBs have been directed to ensure that the overall lending to non-corporate farmers does not fall below the system-wide average of the last three years. SCBs were also directed to reach the level of 13.5 per cent direct lending to beneficiaries that constituted the erstwhile direct lending to agriculture. For 2017-18, the applicable system-wide average target was 11.8 per cent. IV.60 Foreign banks with more than 20 branches were put on a five-year roadmap (2013-18) and by March 31, 2018 they were brought on par with domestic banks with regard to achievement of the overall priority sector target and various sectoral sub-targets. Foreign banks with less than 20 branches are required to achieve the priority sector target in a phased manner by March 2020. IV.61 PVBs managed to achieve the overall priority sector lending (PSL) target7. However, shortfalls were found in certain sub-targets such as agriculture and its various segments, and weaker sections. Like in the previous year, PSBs missed the overall PSL target in 2017-18 but they were able to achieve various sub-targets except in respect of micro-enterprises (Table IV.20). During Q1:2018-19, both PSBs and PVBs managed to achieve the overall priority sector lending target. However, shortfalls were observed in certain sectors and sub-sectors in the case of both PSBs (micro-enterprises) and PVBs (total agriculture, small and marginal farmers; non-corporate individual farmers; and weaker sections). | Table IV.20: Priority Sector Lending by Banks | | (Average of quarterly figures for 2017-18) | | (Amount in ₹ billion) | | Item | Target/ sub-target (per cent of ANBC/ OBE) | Public Sector Banks | Private Sector Banks | Foreign Banks | | Amount outstanding | Per cent of ANBC/OBE | Amount outstanding | Per cent of ANBC/OBE | Amount outstanding | Per cent of ANBC/OBE | | 1 | 2 | 3 | 4 | 5 | 6 | 7 | 8 | | Total Priority Sector Advances | 40 | 20,723 | 39.9 | 8,046 | 40.8 | 1,402 | 38.3 | | of which | | | | | | | | | Total Agriculture | 18 | 9,321 | 18.0 | 3,183 | 16.2 | 330 | 16.7 | | Small and Marginal Farmers | 8 | 4,633 | 8.9 | 1,205 | 6.1 | 103 | 5.2 | | Non-corporate Individual Farmers | 11.7 | 6,647 | 12.8 | 2,125 | 10.8 | 131 | 6.6 | | Micro Enterprises | 7.5 | 3,317 | 6.4 | 1,548 | 7.9 | 83 | 4.2 | | Weaker Sections | 10 | 5,946 | 11.5 | 1,874 | 9.5 | 140 | 7.1 | Note: Data are provisional.
Source: RBI. | IV.62 For banks that could not achieve the PSL targets and sub-targets through direct lending, Priority Sector Lending Certificates (PSLCs) were introduced as an alternative to Rural Infrastructure Development Fund (RIDF) contributions (Box IV.1). Although the RIDF scheme continues, the contributions of banks to it have slowed down and have been instead channelised to PSLCs. Box IV.1: Two Years of PSLCs: Rewarding the ‘Over-achievers’? PSLCs trading were introduced in April 2016 on the lines of carbon credits to drive priority sector lending by leveraging the comparative strength of different banks. Under this arrangement, the overachievers sell excess priority sector obligations, while underachievers buy the same with no transfer of risks or loan assets. Trading in PSLCs takes place through the Reserve Bank’s e-Kuber portal. Four kinds of PSLCs, viz., PSLC – Agriculture (PSLC-A); PSLC – Small and Marginal Farmers (PSLC-SM); PSLC – Micro Enterprises (PSLC-ME); and PSLC – General (PSLC-G), can be bought and sold via the platform in order to meet the applicable priority sector targets and sub-targets. Trading volumes: During 2017-18, the PSLCs trading volume increased by 270 per cent to ₹1,842 billion from ₹498 billion in the previous year. In H1:2018-19, trading volume more than doubled from the level a year ago. Trading volumes tend to spike at the end of each quarter as buyers vie with each other to meet quarterly priority sector targets (Chart 1). The e-Kuber portal has participation from all eligible bank categories – SCBs (including RRBs); urban co-operative banks (UCBs) and the recently operational small finance banks (SFBs). PSBs and PVBs are major buyers and sellers of PSLCs; however, if buying and selling is netted, PVBs and FBs emerge as major buyers and PSBs, RRBs and SFBs as major sellers (Chart 2). Movement in premiums: PSLCs bought during the first quarter and held till March 31st of the same financial year can be used to fulfil the priority sector norms throughout the year, while a PSLC bought during the last quarter of the year can fulfil the criterion only for a single quarter. Therefore, PSLCs commanded the highest premium during the first quarter, which declined in every subsequent quarter by approximately 0.25 percentage points. PSLC-SM commanded the highest premium among the four categories during 2017- 18 as it counts for all priority sector targets and sub-targets, excluding for micro enterprises. As compared to the previous year, premiums declined by 10 to 50 percentage points across categories during 2017-18. During H1:2018-19, premiums have declined further, indicating that trades are ultimately getting settled closer to the average buy offers than average sell offers (Table 1). 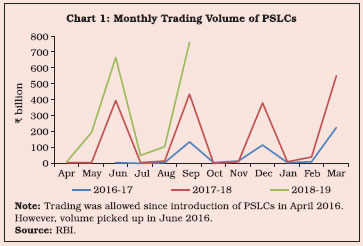
| Table 1: Weighted Average Premium on Various Categories of PSLCs | | (Per cent) | | | 2016-17 | 2017-18 | 2018-19 (Apr-Sep) | | PSLC-A | 1.87 | 1.29 | 1.18 | | PSLC-ME | 0.75 | 0.61 | 0.57 | | PSLC-SM | 1.72 | 1.54 | 1.39 | | PSLC-G | 0.7 | 0.59 | 0.43 | | Source: RBI. | The total premium realised by banks increased to ₹18.6 billion during 2017-18 against ₹6.3 billion in the previous year. Only half of the PSLCs on offer for sale ultimately got settled during the year, reflecting the size of the unmet potential of the PSLC market. | 5.3 Trade Receivables Discounting System IV.63 The trade receivables discounting system (TReDS) – an institutional mechanism to facilitate financing of trade receivables of MSMEs from corporates and other buyers including government departments and public sector undertakings (PSUs) - has been gaining traction. The three entities which were granted authorisation to set up and operate TReDS collectively registered 1,878 MSMEs, 235 corporates and 57 banks. MSME receivables worth ₹24 billion have been financed through TReDS as on October 31, 2018. 5.4 Credit to Sensitive Sectors IV.64 Credit to sensitive sectors—real estate and the capital market—increased in 2017-18 after a mild deceleration in the previous year, attributable to some revival in housing sector activity and financing of IPOs, respectively (Chart IV.24 and Appendix Table IV.4). 6. Operations of SCBs in the Capital Market IV.65 Capital markets enable raising of resources to strengthen banks’ capital base, but while doing so, they are also expected to impose discipline and invoke the market’s evaluation of their performance. 6.1 Public Issues and Private Placement IV.66 Resource mobilisation through public issues by PVBs increased during 2017-18, mainly on account of Bandhan Bank’s initial public offering (IPO) of ₹44.7 billion. There were no public issues by PSBs during the year. During 2018-19 so far (up to end-September 2018), there were no public issues either by PSBs or by PVBs (Table IV.21). IV.67 Private placements of bonds remained the major long-term source of funding for banks. During 2017-18, the amount raised by PVBs through private placements was higher than those of PSBs though the number of issues were lower. During 2018-19 so far (up to end- September 2018), private placements by banks were limited (Chart IV.25). 6.2 Performance of Banking Stocks IV.68 During 2017-18 and during 2018-19 so far (up to end-November 2018), the Nifty Bank Index generally outperformed the Nifty 50 on the strength of measures taken to tackle bad loans, recapitalisation of PSBs, rising referrals to NCLTs, resolution of some large NPA accounts under the IBC and the announcement of merger of weak PSBs with stronger ones. The Nifty Private Bank Index generally yielded better returns than the Nifty PSU Bank Index during the entire period (Chart IV.26). | Table IV.21: Public Issues by the Banking Sector | | (Amount in ₹ billion) | | Year | Public Sector Banks | Private Sector Banks | Total | Grand Total | | Equity | Debt | Equity | Debt | Equity | Debt | | 1 | 2 | 3 | 4 | 5 | 6 | 7 | 8=(6+7) | | 2016-17 | 11 | - | 25 | - | 36 | - | 36 | | 2017-18 | - | - | 62 | - | 62 | - | 62 | | 2018-19 (up to Sep 2018) | - | - | - | - | - | - | - | Note: -: Nil/Negligible.
Source: SEBI. |
7. Ownership Pattern in Scheduled Commercial Banks IV.69 During 2017-18, government ownership in 16 out of 21 PSBs increased due to capital infusion (Chart IV.27). At the same time, however, the government’s shareholding declined in five PSBs as they raised resources through issuances of qualified institutional placements (QIPs) and other capital market instruments (Appendix Table IV.5). 8. Foreign Banks’ Operations in India and Overseas Operations of Indian Banks IV.70 In recent years, even as the number of foreign banks operating in the country remained stable, the number of their branches declined due to rationalisation (Table IV.22). The Reserve Bank encourages foreign banks to set up wholly owned subsidiaries (WOSs) of their parent banks by giving them near national treatment8. Subsidiaries of SBM Group and DBS Bank Ltd. have been issued licences on December 6, 2017 and October 4, 2018 respectively, for carrying on banking business in India through the WOS mode.
| Table IV.22: Operations of Foreign Banks in India | | Period | Foreign Banks Operating through Branches | Foreign Banks having Representative Offices | | No. of Banks | Branches | | Mar-2014 | 43 | 314 | 45 | | Mar-2015 | 45 | 321 | 40 | | Mar-2016 | 46 | 325 | 39 | | Mar-2017 | 44 | 295 | 39 | | Mar-2018 | 45 | 286 | 40 | | Source: RBI. | IV.71 Indian banks, particularly PSBs, marginally reduced their overseas presence in terms of branches, representative offices and other offices (Appendix Table IV.6). Rationalisation of overseas offices was directed towards conservation/freeing up of capital as also cut in operating expenditure. Accordingly, banks closed unviable branches, converted some of their branches into smaller representative offices and merged smaller branches with bigger ones. 9. Payment System and Scheduled Commercial Banks IV.72 The Reserve Bank is committed to building a world class payment and settlement system for a ‘less-cash’ India through responsive regulation, robust infrastructure, effective supervision while focusing on customer centricity as envisaged in the Payment and Settlement Systems in India: Vision-2018 document. IV.73 During H1:2018-19, real time gross settlement (RTGS) system remained the most dominant medium, with a share of 82.7 per cent in terms of value in total payment system transactions9. In terms of volume, however, the share of RTGS transactions was less than one per cent. During 2017-18 and 2018-19 (up to September), the share of retail electronic clearing and card payments rose in terms of volume and value. More than half of the transactions were carried out through card payments during 2017-18 and H1:2018-19. In terms of value too, card payments recorded a sharp rise after November 2016. In 2017-18, however, the growth in volume of card payments decelerated sharply which can be attributed to the high base in the previous year (Chart IV.28). IV.74 Within retail payments which are characterised by large volumes, electronic fund transfers accounted for 90 per cent in terms of value with National Electronic Funds Transfer (NEFT) accounting for majority share (Chart IV.29a). In terms of volume, some relatively new mediums such as immediate payment service (IMPS) and unified payments interface (UPI) have grown in importance in the recent years (Chart IV.29b). They have emerged as multi-channel systems providing various options to customers to originate transactions. 9.1 ATMs and PoS IV.75 The number of ATMs and in particular, on-site ATMs, declined during the year on account of rationalisation of the number of branches by a few PSBs. PVBs recorded an increase in the number of their ATMs (Table IV.23; Appendix Table IV.7). During 2018-19 (up to August), the number of ATMs (excluding SFBs and PBs) declined further to 204,285, attributable to the increasing use of electronic means of payments. During the same period, robust growth was observed in the deployment of PoS terminals across the country (Chart IV.30). 9.2 White-label ATMs IV.76 The growth of White-label ATMs (WLAs) has tapered off in recent years, although the number of WLAs crossed 15,000 during 2017-18 (Chart IV.31). In order to facilitate cash availability for WLA operators, sourcing of cash from retail outlets in addition to banks was allowed from December 2016. As WLAs were conceived to allow non-banking entities to deploy ATMs in relatively underbanked Tier III to VI centers to help achieve financial inclusion, around three-fourth of the WLAs were deployed in rural and semi-urban centers. 9.3 Debit and Credit Cards IV.77 The growth of credit cards continued to accelerate in 2017-18, while the rate of growth of debit cards slackened. Availability of easy equated monthly instalment (EMI) facilities, cash-backs, rewards and discounts offered on various e-commerce platforms were the major drivers of credit card growth. The average amount per transaction for credit cards remained much higher than that for debit cards, attributable to the preference for credit cards for undertaking high value transactions (Chart IV.32). | Table IV.23: ATMs of Scheduled Commercial Banks | | (At end-March) | | Sr. No. | Bank Group | On-site ATMs | Off-site ATMs | Total Number of ATMs | | 2017 | 2018 | 2017 | 2018 | 2017 | 2018 | | 1 | 2 | 3 | 4 | 5 | 6 | 7 | 8 | | I | PSBs | 86,545 | 82,733 | 62,010 | 63,235 | 148,555 | 145,968 | | II | PVBs | 23,045 | 23,829 | 35,788 | 36,316 | 58,833 | 60,145 | | III | FBs | 219 | 214 | 747 | 725 | 966 | 939 | | IV | All scBs | 109,809 | 106,776 | 98,545 | 100,276 | 208,354 | 207,052 | Note: Data excludes WLAs.
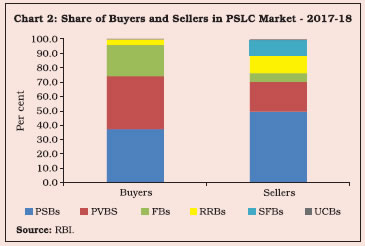
Source: RBI. | 9.4 Pre-paid Payment Instruments IV.78 Pre-paid payment instruments (PPIs) maintained robust growth in terms of volume and value during 2017-18, despite deceleration from the demonetisation-induced spurt (Chart IV.33). In order to curb frauds and money laundering through PPIs, know your customer (KYC) norms were made stringent, limits were placed on fund transfers and caps were put on the amount held in wallets. Transactions through PPIs, which aggregated to as low as ₹81 billion in 2013-14, increased manifold in subsequent years to reach ₹1,416 billion in 2017-18. 9.5 Unified Payments Interface IV.79 Introduced in 2016-17, UPI powers multiple bank accounts into a single mobile application (of any participating bank) for immediate funds transfer and a variety of payments without parting with sensitive information. During 2017-18, 915 million transactions worth ₹1,098 billion occurred through UPI (including BHIM10 and USSD 2.011), rising to 1,579 million transactions worth ₹2,670 billion in H1:2018-19.
10. Consumer Protection IV.80 Fair treatment of customers, transparency, product suitability, privacy and grievance redressal are the overarching principles guiding the Reserve Bank in its approach to protection of bank customers. In an environment in which technology-leveraged banking has rapidly reached out to many first-time customers in rural and semi-urban areas, financial literacy, consumer protection and awareness assume critical importance. In order to enable resolution of complaints of customers relating to various services rendered by banks, Banking Ombudsman (BO) offices have been established under the Banking Ombudsman Scheme, 2006.  IV.81 During 2017-18, the number of complaints received by the BO offices increased by 25 per cent against 27 per cent in the previous year. 97 per cent of these complaints were disposed off in the current year as compared to 92 per cent in the previous year, reflecting improved efficiency of these offices. In response to the rising number of consumer complaints, a second office of the BO was opened in Mumbai by the Reserve Bank in 2017-18, taking the total number of BO offices in the country to 21. The BO offices in Tier I cities (New Delhi, Mumbai, Chennai, Kolkata, Bengaluru and Hyderabad) accounted for more than 57 per cent of the total complaints received by all BO offices. IV.82 The higher proportion of complaints from urban areas in recent years is largely due to increasing awareness about grievance redressal mechanism among bank customers and also the efficacy of internal grievance redressal mechanism in banks, not being up to the desired level (Chart IV.34). IV.83 During the year, non-observance of the fair practices code remained the major complaint against banks, followed by those related to ATM/credit/debit cards, failure to meet commitments and mobile banking (Table IV.24). IV.84 Bank group-wise, most pension-related complaints and a majority of the ATM/debit card-related complaints were against PSBs. On the other hand, more than 50 per cent of the complaints relating to non-adherence to instructions on direct selling agents (DSAs) and recovery agents, and credit cards were filed against PVBs (Chart IV.35 and Appendix Table IV.8). 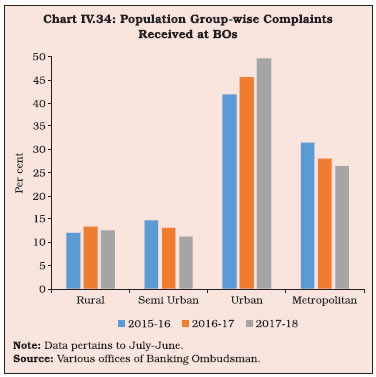
| Table IV.24: Nature of Complaints at BOs | | (Number of complaints) | | | 2016-17@ | 2017-18@ | | Deposit Account | 7,190 | 6,719 | | Remittance | 3,287 | 3,330 | | Credit Card | 8,297 | 12,647 | | Loans and Advances | 5,559 | 6,226 | | Charges without Prior Notice | 7,273 | 8,209 | | Pension | 8,506 | 7,833 | | Failure of Commitments | 8,911 | 11,044 | | Recovery Agent | 330 | 554 | | Notes and Coins | 333 | 1,282 | | Fair Practices | 31,769 | 36,146 | | BCSBI | 3,699 | 3,962 | | Out of Subject | 6,230 | 5,681 | | ATM/Debit Card | 16,434 | 24,672 | | Mobile Banking/Electronic Banking* | - | 8,487 | | Para-Banking* | - | 579 | | Others | 23,169 | 26,219 | | Total | 130,987 | 163,590 | Notes: 1. *: Fresh grounds included from July 1, 2017.
2. @: Data pertains to July-June.
Source: Various offices of Banking Ombudsman. |
11. Financial Inclusion IV.85 Powered by the drive to mobilise account ownership among unbanked adults through the Pradhan Mantri Jan Dhan Yojana (PMJDY), the proportion of persons joining the formal financial system in terms of an account at financial institutions has more than doubled since 2011 and by 2017, it had reached 80 per cent of the Indian population - comparable with China and better than other BRICS peers (Chart IV.36). IV.86 In its pursuit of the goal of financial inclusion for sustainable and inclusive growth, the Reserve Bank since 2010 has encouraged banks to adopt a structured and planned approach, with commitment at the highest levels through Board-approved Financial Inclusion Plans (FIPs). Currently, the third phase of FIP (2016-19) is being implemented, where banks are advised to submit data on the progress made under the FIP on various parameters. IV.87 During 2017-18, proximate indicators of financial inclusion presented a mixed picture. The number of brick-and-mortar branches and branches in business correspondent (BC) mode declined in rural areas partly due to rationalisation of branches by banks through closing down of branches which were either unviable or located in close proximity to each other. Furthermore, some banks disengaged with corporate BCs due to non-performance. At the same time, the number of BCs in urban areas increased partly attributable to abosorption of erstwhile pre-paid payment instruments (PPIs) providers into the BC fold.  IV.88 The decline in the number of Basic Savings Bank Deposit Accounts (BSBDAs) opened through branches is partly reflective of the consolidation on account of the merger of the State Bank of India (SBI) and its associate banks. Furthermore, the branch authorisation policy recognises BCs which provide banking services for a minimum of four hours per day and for at least five days a week as banking outlets. This propelled a sizable increase in the number of accounts opened through BCs who are also generating robust growth in ICT-based banking services (Table IV.25). 11.1 Pradhan Mantri Jan Dhan Yojana IV.89 The Pradhan Mantri Jan Dhan Yojana (PMJDY) launched in August 2014, has been implemented in two phases - Phase I (August 15, 2014 - August 14, 2015) and Phase II (August 15, 2015 - August 14, 2018). Phase I aimed at providing universal access to banking facilities, basic banking accounts for saving and remittance, and RuPay Debit card with an in-built accident insurance cover of ₹100,000. Phase II incorporated inter alia overdraft facilities of up to ₹5000, creation of a Credit Guarantee Fund for coverage of defaults in overdraft accounts, and micro-insurance and unorganised sector pension schemes like Swavalamban. In September 2018, the PMJDY was extended beyond August 14, 2018 with new features viz., opening accounts from “every household to every adult”; raising the overdraft limit to ₹10,000 from ₹5,000; overdraft facility up to ₹2,000 without any conditions; and raising accidental insurance cover for new RuPay cardholders from ₹100,000 to ₹200,000, for PMJDY accounts opened after August 28, 2018. | Table IV.25: Progress under Financial Inclusion Plans, All SCBs (including RRBs) | | Sr. No. | Particulars | Mar-10 | Mar-17 | Mar-18 | Y-o-Y growth in per cent (2016-17) | Y-o-Y growth in per cent (2017-18) | | 1 | Banking Outlets in Rural location - Branches | 33,378 | 50,860 | 50,805 | -1.9 | -0.1 | | 2 | Banking Outlets in Rural location - Branchless mode | 34,316 | 547,233 | 518,742 | 2.4 | -5.2 | | 3 | Banking outlets in Rural locations - Total | 67,694 | 598,093 | 569,547 | 2.0 | -4.8 | | 4 | Urban locations covered through BCs | 447 | 102,865 | 142,959 | 0.3 | 39.0 | | 5 | BSBDA - Through branches (No. in Million) | 60 | 254 | 247 | 6.7 | -2.8 | | 6 | BSBDA - Through branches (Amt. in Billion) | 44 | 691 | 731 | 45.8 | 5.8 | | 7 | BSBDA - Through BCs (No. in Million) | 13 | 280 | 289 | 21.2 | 3.2 | | 8 | BSBDA - Through BCs (Amt. in Billion) | 11 | 285 | 391 | 73.8 | 37.2 | | 9 | BSBDA - Total (No. in Million) | 74 | 533 | 536 | 13.6 | 0.6 | | 10 | BSBDA - Total (Amt. in Billion) | 55 | 977 | 1,121 | 53.1 | 14.7 | | 11 | OD facility availed in BSBDAs (No. in million) | 0 | 9 | 6 | 0.0 | -33.3 | | 12 | OD facility availed in BSBDAs (Amt. in Billion) | 0 | 17 | 4 | -41.4 | -76.5 | | 13 | KCC - Total (No. in Million) | 24 | 46 | 46 | -2.1 | 0.0 | | 14 | KCC - Total (Amt. in Billion) | 1,240 | 5,805 | 6,096 | 13.1 | 5.0 | | 15 | GCC - Total (No. in Million) | 1 | 13 | 12 | 18.2 | -7.7 | | 16 | GCC - Total (Amt. in Billion) | 35 | 2,117 | 1,498 | 41.8 | -29.2 | | 17 | ICT-A/Cs-BC-Total number of transactions (in million) | 27 | 1,159 | 1,489 | 40.1 | 28.5 | | 18 | ICT-A/Cs-BC-Total number of transactions (in billion) | 7 | 2,652 | 4,292 | 57.2 | 61.8 | Note: Sr. No. 1-16 consist of cumulative data from the inception. Sr. No. 17-18 consist of data from the start of corresponding financial year.
Source: FIP returns submitted by banks. | IV.90 Within a span of four years, the total number of accounts opened under the PMJDY expanded to 328 million, with ₹851 billion deposits as on September 28, 2018. Of these accounts, 59.1 per cent were opened at branches located in rural and semi-urban centres (Chart IV.37a). In terms of usage of these accounts, however, the initial spurt in average balances slowed down during 2017-18. The average balance in Jan Dhan accounts in PVBs contracted. However, recovery in usage of these accounts has been setting in during 2018-19 (up to September 28) (Chart IV.37b). Only 23 per cent (upto August 2018) of these accounts (all SCBs taken together) receive direct benefit transfers (DBTs). 11.2 New Bank Branches IV.91 Opening new bank branches helps in furthering the financial inclusion agenda by attracting new customers to their fold. During 2017-18, opening of new bank branches declined by more than 25 per cent as banks with high stress on their balance sheets undertook branch rationalisation, including turning to BCs in order to contain expenditure. During the year, Tier-2, Tier-3 and Tier-4 centres increased their share of brick-and-mortar branches, reflective of high growth potential of these centres (Table IV.26). | Table IV.26: Tier-wise Break-up of Newly Opened Bank Branches of SCBs | | Tier | 2014-15 | 2015-16 | 2016-17 | 2017-18 | | Tier 1 | 3,092 | 3,216 | 2,302 | 1,594 | | | (35.3) | (35.5) | (43.3) | (40.3) | | Tier 2 | 605 | 701 | 364 | 342 | | | (6.9) | (7.7) | (6.8) | (8.6) | | Tier 3 | 1,041 | 1,202 | 643 | 595 | | | (11.8) | (13.2) | (12.1) | (15.1) | | Tier 4 | 747 | 792 | 427 | 350 | | | (8.5) | (8.7) | (8.0) | (8.8) | | Tier 5 | 835 | 920 | 655 | 441 | | | (9.5) | (10.1) | (12.3) | (11.1) | | Tier 6 | 2,429 | 2,207 | 915 | 626 | | | (27.7) | (24.4) | (17.2) | (15.8) | | Total | 8,749 | 9,038 | 5,306 | 3,948 | | | (100.0) | (100.0) | (100.0) | (100.0) | Notes: 1. Tier-wise classification of centres are as follows: ‘Tier 1’ includes centres with population of 100,000 and above, ‘Tier 2’ includes centres with population of 50,000 to 99,999, ‘Tier 3’ includes centres with population of 20,000 to 49,999, ‘Tier 4’ includes centres with population of 10,000 to 19,999, ‘Tier 5’ includes centres with population of 5,000 to 9,999, and ‘Tier 6’ includes centres with population of Less than 5000.
2. All population figures are as per Census 2011.
3. Data exclude ‘Administrative Offices’.
Source: Master Office File, RBI. | 11.3 Distribution of ATMs IV.92 While the spread of ATMs has been augmenting the access to banking services and thus fostering financial inclusion, it has been biased towards urban and metropolitan centres which account for 56 per cent of the total number of ATMs. During 2017-18, these numbers declined in both urban and metropolitan centres while their penetration increased modestly in rural and semi-urban centres. While ATMs of PSBs are evenly distributed across various population centres, those of PVBs and FBs are skewed towards urban and metropolitan centres, and these patterns have persisted during Q1:2018-19 (Table IV.27). 11.4 Microfinance Programme IV.93 Launched in 1992 by the National Bank for Agriculture and Rural Development (NABARD), the self-help group (SHG)-Bank linkage programme involves micro-credit extended collectively to small groups to undertake productive activities with a view to integrating them into the formal financial system. It has emerged as a key intervention for poverty alleviation through financial inclusion. During 2017-18, 2.3 million new SHGs were credit-linked with banks, and loans of ₹472 billion (including repeat loans) were disbursed to these SHGs. On an average, the amount of savings per SHG and the amount of credit per SHG were ₹22,405 and ₹208,683, respectively. | Table IV.27: Number of ATMs of SCBs at Various Centres | | (At end-March 2018) | | Bank Group | Rural | Semi-urban | Urban | Metropolitan | Total | | 1 | 2 | 3 | 4 | 5 | 6 | | Public Sector Banks | 29,628 | 42,374 | 41,254 | 32,531 | 145,787 | | | (20.3) | (29.1) | (28.3) | (22.3) | (100.0) | | Private Sector Banks | 4,845 | 14,464 | 15,747 | 25,089 | 60,145 | | | (8.1) | (24.0) | (26.2) | (41.7) | (100.0) | | Foreign Banks | 17 | 17 | 172 | 733 | 939 | | | (1.8) | (1.8) | (18.3) | (78.1) | (100.0) | | Total | 34,490 | 56,855 | 57,173 | 58,353 | 206,871 | | | (16.7) | (27.5) | (27.6) | (28.2) | (100.0) | | Growth over Previous Year | 0.9 | 1.7 | -2.2 | -2.2 | -0.6 | Notes: 1. Figures in parentheses indicate percentage share of total ATMs under each bank group.
2. Total number of ATMs differs from as given in Table IV.23 as the latter table also includes the 181 ATMs of SBI abroad, which are not included in this table.
Source: RBI. | IV.94 The NPA ratio in these loans was 6.1 per cent, which is higher than loan delinquencies in personal loans of SCBs. During the year, the amount disbursed through micro finance institutions (MFIs) rose faster than under the SHG-Bank linkage programme though the number of MFI loans declined (Table IV.28). 11.5 Borrowing Behaviour IV.95 The NABARD’s All India Rural Financial Inclusion Survey (NAFIS), 2016-17 indicates that the highest proportion of rural households that took any loan during July 1, 2015 to June 30, 2016 was in the southern region covering Andhra Pradesh (76 per cent), Telangana (74 per cent) and Karnataka (70 per cent). This was due to higher penetration of banking, especially through the SHG and the MFI route, in these states. Rural households in states from the north-eastern region like Arunachal Pradesh (62 per cent) and Manipur (60 per cent) also reported a larger proportion of loans taken than the all-India average. | Table IV.28: Progress of Microfinance Programmes | | (At end-March) | | Item | Self-Help Groups | | Number (in million) | Amount (₹ billion) | | 2014-15 | 2015-16 | 2016-17 | 2017-18 | 2014-15 | 2015-16 | 2016-17 | 2017-18 | | Loans Disbursed by Banks | 1.6 | 1.8 | 1.9 | 2.3 | 276 | 373 | 388 | 472 | | | (0.7) | (0.9) | (1.0) | (1.4) | (114) | (194) | (200) | (275) | | Loans Outstanding with Banks | 4.5 | 4.7 | 4.8 | 5.0 | 515 | 572 | 616 | 756 | | | (2.2) | (2.5) | (2.8) | (3.1) | (232) | (306) | (341) | (436) | | Savings with Banks | 7.7 | 7.9 | 8.6 | 8.7 | 111 | 137 | 161 | 196 | | | (3.4) | (3.9) | (4.3) | (4.6) | (55) | (73) | (87) | (118) | | | Microfinance Institutions | | Number (in million) | Amount (₹ billion) | | Loans Disbursed by Banks | 597 | 647 | 2,314 | 1,922 | 147 | 208 | 193 | 255 | | Loans Outstanding with Banks | 4,660 | 2,020 | 5,357 | 5,073 | 219 | 256 | 256 | 323 | | | Joint Liability Groups | | | Number (in million) | Amount (₹ billion) | | Loans Disbursed by Banks | 0.5 | 0.6 | 0.7 | 1.0 | 44 | 62 | 95 | 140 | Notes: 1. Figures in brackets give the details of SHGs covered under the National Rural Livelihoods Mission (NRLM) and the National Urban Livelihoods Mission (NULM) for 2014-15, 2015-16, 2016-17 and 2017-18 respectively.
2. Actual number of MFIs availing loans from banks would be less than the number of accounts, as most of MFIs avail loans several times from the same bank and also from more than one bank.
Source: NABARD. | IV.96 The policy thrust on financial inclusion expanded access to credit from institutional sources in rural areas to 69.1 per cent during 2015-1612 (NAFIS 2016-17) as against 56 per cent in 2013 (All India Debt and Investment Survey). Within non-institutional sources, a significant decline in the dominance of moneylenders is evident. According to NAFIS 2016-17, agricultural households (74.5 per cent) relied much more than non-agricultural households (63.8 per cent) on institutional sources for their credit needs. 12. Regional Rural Banks IV.97 Regional Rural Banks (RRBs) were established in 1975 with the mandate to bring together the positive features of credit co-operatives and commercial banks in order to address the credit needs of backward sections in rural areas. They are regulated by the Reserve Bank and supervised by the NABARD. Leveraging on a network of 21,747 branches with 56 banks at end-March 2018, and to play a greater role in financial inclusion, the government approved a scheme of recapitalisation of RRBs in 2010- 11, which was extended twice in 2012-13 and 2015-16. During 2017-18, the recapitalisation scheme received further extension till 2019-20, with ₹11 billion provided for RRBs. | Table IV.29: Consolidated Balance Sheet of Regional Rural Banks | | (Amount in ₹ billion) | | Sr. No. | Item | At end-March | Y-o-Y growth in per cent | | 2017 | 2018P | 2016-17 | 2017-18P | | 1 | Share Capital | 64 | 64 | - | - | | 2 | Reserves | 231 | 253 | 11.6 | 9.5 | | 3 | Tier II Bonds | 2 | 0 | 100.0 | - | | 4 | Deposits | 3,719 | 4,005 | 18.6 | 7.7 | | | 4.1 Current | 107 | 103 | 20.2 | -3.7 | | | 4.2 Savings | 1,881 | 2,010 | 27.1 | 6.9 | | | 4.3 Term | 1,731 | 1,892 | 10.5 | 9.3 | | 5 | Borrowings | 516 | 626 | 7.7 | 21.3 | | | 5.1 from NABARD | 405 | 456 | 1.5 | 12.6 | | | 5.2 Sponsor Bank | 94 | 103 | 64.9 | 9.6 | | | 5.3 Others | 17 | 67 | -22.7 | 294.1 | | 6 | Other Liabilities | 128 | 248 | 4.1 | 93.8 | | | Total Liabilities/Assets | 4,660 | 5,196 | 16.2 | 11.5 | | 7 | Cash in Hand | 28 | 28 | 3.7 | 0.0 | | 8 | Balances with RBI | 150 | 158 | 21.0 | 5.3 | | 9 | Other Bank Balances | 65 | 54 | 41.3 | -16.9 | | 10 | Investments | 2,110 | 2,210 | 24.4 | 4.7 | | 11 | Loans and Advances (net) | 2,115 | 2,518 | 8.4 | 19.1 | | 12 | Fixed Assets | 11 | 12 | 0.0 | 9.1 | | 13 | Other Assets # | 181 | 216 | 19.1 | 19.3 | Notes: 1. P: Provisional.
2. #: Includes accumulated losses.
3. -: Nil / neglible
Source: NABARD. | 12.1 Balance Sheet Analysis of RRBs IV.98 The consolidated balance sheet of RRBs showed an expansion during the year. On the liabilities side, deposit growth decelerated as the impact of demonetisation waned and consequently, RRBs turned to borrowings to raise funds. On the assets side, loans and advances rebounded, while investments were subdued (Table IV.29). IV.99 By end-March 2018, 90 per cent of the loan portfolio of RRBs comprised priority sector loans, with agriculture accounting for 76.1 per cent, followed by micro, small and medium enterprises (14.0 per cent). Non-priority sector loans rebounded from a low base (Table IV.30). 12.2 Financial Performance of RRBs IV.100 The asset quality of RRBs deteriorated, resulting in decline in CRARs. Net profit fell in 2017-18, largely attributed to a significant increase in operating expenses and elevated provisioning on account of deteriorating asset quality (Table IV.31). | Table IV.30: Purpose-wise Outstanding Advances by RRBs | | (At end-March) | | (Amount in ₹ billion) | | Sr. No. | Purpose | Amount | Y-o-Y growth in per cent | | 2017 | 2018P | 2016-17 | 2017-18P | | 1 | 2 | 3 | 4 | 5 | 6 | | I | Priority (i to v) | 2,033 | 2,285 | 14.3 | 12.4 | | | Per cent of total loans outstanding | 89.9 | 90.0 | 4.4 | 0.1 | | | i. Agriculture | 1,526 | 1,739 | 15.9 | 14.0 | | | ii. Micro small and medium enterprises | 292 | 319 | 15.9 | 9.2 | | | iii. Education | 27 | 28 | 3.8 | 3.7 | | | vi. Housing | 145 | 155 | 9.8 | 6.9 | | | v. Others | 43 | 43 | -17.3 | 0.0 | | II | Non-priority (i to vi) | 229 | 242 | -19.9 | 5.7 | | | Per cent of total loans outstanding | 10.1 | 10.0 | -27.3 | -1.0 | | | i. Agriculture | 0.1 | 0.2 | -90.0 | 100.0 | | | ii. Micro, small and medium enterprises | 14 | 2.6 | 16.7 | -81.4 | | | iii. Education | 0.4 | 0.4 | - | - | | | iv. Housing | 15 | 23 | 36.4 | 53.3 | | | v. Personal Loans | 89 | 63 | 20.3 | -29.2 | | | vi. Others | 111 | 153 | -41.3 | 37.8 | | Total (I+II) | 2,262 | 2,527 | 9.5 | 11.7 | Note: P: Provisional.
Source: NABARD | 13. Local Area Banks IV.101 After conversion of Capital Local Area Bank into a SFB since April 2016, only three local area banks (LABs) operate, with a total asset size of ₹8.2 billion at end-March 2018. The credit-deposit ratio of LABs at 78.5 per cent was higher than that of RRBs (62.9 per cent). This suggests that their emphasis is on acting as financial conduits rather than being only saving avenues (Table IV.32). | Table IV.31: Financial Performance of Regional Rural Banks | | (Amount in ₹ billion) | | Sr. No. | Item | Amount | Y-o-Y growth in per cent | | 2016-17 | 2017-18P | 2016-17 | 2017-18P | | 1 | 2 | 3 | 4 | 5 | 6 | | A. | Income (i + ii) | 392 | 421 | 10.7 | 7.4 | | | i. Interest income | 359 | 385 | 7.8 | 7.2 | | | ii. Other income | 33 | 36 | 57.1 | 9.1 | | B. | Expenditure (i+ii+iii) | 370 | 401 | 10.8 | 8.4 | | | i. Interest expended | 234 | 238 | 7.8 | 1.7 | | | ii. Operating expenses | 104 | 116 | 7.2 | 11.5 | | | of which, Wage bill | 68 | 69 | -1.5 | 1.5 | | | iii. Provisions and contingencies | 32 | 47 | 52.4 | 46.9 | | C. | Profit | | | | | | | i. Operating profit | 60 | 79 | 172.7 | 31.7 | | | ii. Net profit | 22 | 20 | 10 | -9.1 | | D. | Total Average Assets | 4,341 | 4,577 | 14 | 5.4 | | E. | Financial Ratios # | | | | | | | i. Operating profit | 1.4 | 1.7 | | | | | ii. Net profit | 0.5 | 0.4 | | | | | iii. Income (a + b) | 9.0 | 9.2 | | | | | (a) Interest income | 8.3 | 8.4 | | | | | (b) Other income | 0.8 | 0.8 | | | | | iv Expenditure (a+b+c) | 8.5 | 8.8 | | | | | (a) Interest expended | 5.4 | 5.2 | | | | | (b) Operating expenses | 2.4 | 2.5 | | | | | of which, Wage bill | 1.6 | 1.5 | | | | | (c) Provisions and contingencies | 0.7 | 1.0 | | | | F | Analytical Ratios (%) | | | | | | | Gross NPA Ratio | 8.1 | 9.1 | | | | | CRAR | 13.0 | 12.4 | | | Notes: 1. P - Provisional.
2. # - Financial ratios are percentages with respect to average total assets.
3. Percentage variation could be slightly different as absolute numbers have been rounded off to ₹ billion.
Source: NABARD. |
| Table IV.32: Profile of Local Area Banks | | (At end-March) | | (Amount in ₹ million) | | | 2016-17 | 2017-18 | | Assets | 7,862 | 8,173 | | Deposits | 6,420 | 6,511 | | Gross Advances | 4,750 | 5,140 | | Source: Off-site returns (global operations), RBI. | 13.1 Financial Performance of LABs IV.102 During 2017-18, the growth of interest income of LABs was meagre while interest expenses declined. With growth in other income remaining robust, LABs recorded significant improvement in profitability (Table IV.33). | Table IV.33: Financial Performance of Local Area Banks | | (Amount in ₹ million) | | Item | Amount | Y-o-Y growth in per cent | | 2016-17 | 2017-18 | 2016-17 | 2017-18 | | 1 | 2 | 3 | 4 | 5 | | 1. Income (i+ii) | 1,060 | 1,158 | 10.7 | 9.2 | | i) Interest income | 873 | 898 | 6.7 | 3.2 | | ii) Other income | 187 | 260 | 33.9 | 36.7 | | 2. Expenditure(i+ii+iii) | 937 | 981 | 12.0 | 4.4 | | i) Interest expended | 457 | 420 | 12.3 | -8.8 | | ii) Provisions and contingencies | 82 | 92 | -3.1 | 15.4 | | iii) Operating expenses | 397 | 469 | 15.3 | 17.3 | | of which, wage bill | 179 | 200 | 7.4 | 10.9 | | 3. Profit | | | | | | i) Operating profit/loss | 206 | 269 | 5.0 | 28.1 | | ii) Net profit/loss | 123 | 177 | 1.2 | 47.2 | | 4. Net Interest Income | 415 | 478 | 1.7 | 16.6 | | 5. Total Assets | 7,862 | 8,173 | 11.6 | 4.3 | | 6. Financial Ratios @ | | | | | | i) Operating profit | 2.7 | 3.3 | | | | ii) Net profit | 1.5 | 2.2 | | | | iii) Income | 13.5 | 14.1 | | | | iv) Interest income | 11.1 | 11.0 | | | | v) Other income | 2.4 | 3.2 | | | | vi) Expenditure | 12.0 | 12.0 | | | | vii) Interest expended | 5.9 | 5.1 | | | | viii) Operating expenses | 5.1 | 5.7 | | | | ix) Wage bill | 2.3 | 2.4 | | | | x) Provisions and contingencies | 1.0 | 1.1 | | | | xi) Net interest income | 5.2 | 5.8 | | | Note: @ - Financial ratios for 2016-17 and 2017-18 are calculated based on assets in respective years.
Source: Off-site returns (global operations), RBI. | 14. Small Finance Banks IV.103 Small Finance Banks (SFBs) have been set up to deepen financial inclusion by catering to clientele such as migrant labourers, low income households, small businesses and other unorganised sector entities. By end-March 2018, all the ten SFBs had commenced operations. 14.1 Balance Sheet of SFBs IV.104 Since nine out of ten SFBs were earlier operating as NBFCs, their legacy reliance on borrowings continued. SFBs are, however, subject to a regulatory ceiling on inter-bank borrowings. Given their MFI background, loans and advances constituted 67 per cent of total assets, which was much higher than that of other SCBs, and the share of investments in total assets was correspondingly lower (Table IV.34). | Table IV.34: Consolidated Balance Sheet of Small Finance Banks | | (Amount in ₹ billion) | | Sr. No. | Item | End-March 2017* | End-March 2018** | | 1 | 2 | 3 | 4 | | 1. | Share Capital | 33.4 | 41.8 | | 2. | Reserves | 16.1 | 55.0 | | 3. | Tier II Bonds | 6.8 | 16.0 | | 4. | Deposits | 49.6 | 264.7 | | | 4.1 Current | 1.4 | 10.1 | | | 4.2 Savings | 12.1 | 45.3 | | | 4.3 Term | 36.0 | 209.3 | | 5. | Borrowings (Including Tier II Bonds) | 165.5 | 308.9 | | | 5.1 Bank | 68.7 | 77.2 | | | 5.2 Others | 96.8 | 231.6 | | 6. | Other Liabilities | 11.7 | 29.2 | | | Total Liabilities/Assets | 276.3 | 699.5 | | 7. | Cash in Hand | 1.6 | 3.2 | | 8. | Balances with RBI | 6.8 | 18.6 | | 9. | Balances with Banks and other Financial Institutions | 24.1 | 49.1 | | 10 | Investments | 60.3 | 131.5 | | 11 | Loans and Advances | 168.2 | 467.6 | | 12 | Fixed Assets | 5.5 | 15.2 | | 13 | Other Assets | 9.8 | 14.3 | Notes: * Based on balance sheet of six SFBs which had commenced their operations before March 31, 2017.
** Based on balance sheet of ten SFBs which had commenced their operations before March 31, 2018.
Source: Off-site returns (domestic operations), RBI. | 14.2 Priority Sector Lending of SFBs IV.105 At end-March 2018, priority sector lending of SFBs was 76.7 per cent of their total loans, which was lower than in the previous year. Consistent with their mandate, SFBs’ focus remained on micro, small and medium enterprises, followed by agriculture. During 2017-18, however, these banks increased their exposure to the non-priority sector (Table IV.35). 14.3 Financial Performance of SFBs IV.106 During 2017-18, SFBs reported positive earnings before provisions and taxes (EBPT) but high provisioning on account of elevated NPAs caused net losses. This may be attributable to exceptionally high net losses reported by one SFB which wiped out the combined net profit of other SFBs taken together (Table IV.36). In H1:2018-19, SFBs continued to report net losses. | Table IV.35: Purpose-wise Outstanding Advances by Small Finance Banks | | (Share in percentage) | | Sr. No. | Purpose | End-March 2017* | End-March 2018** | | I | Priority (i to v) | 93.4 | 76.7*** | | | Per cent to total loans outstanding | | | | | i. Agriculture | 25.7 | 20.1 | | | ii. Micro, small and medium enterprises | 34.2 | 31.0 | | | iii. Education | 0.8 | 0.0 | | | iv. Housing | 2.6 | 2.1 | | | v. Others | 30.2 | 23.4 | | II | Non-priority | 6.6 | 23.3 | | Total (I+II) | 100 | 100 | Notes: * Based on balance sheet of six SFBs which had commenced their operations before March 31, 2017.
** Based on balance sheet of ten SFBs which had commenced their operations before March 31, 2018.
*** Calculated by dividing priority sector advances by gross advances for the respective years.
Source: Off-site returns (domestic operations), RBI. |
| Table IV.36: Financial Performance of Small Finance Banks | | (Amount in ₹ billion) | | Sr. No. | Item | 2016-17* | 2017-18** | | A | Income (i + ii) | 20.8 | 94.5 | | | i. Interest Income | 17.9 | 84.2 | | | ii. Other Income | 2.9 | 10.4 | | B | Expenditure (i+ii+iii) | 19.4 | 115.7 | | | i. Interest Expended | 8.8 | 43.1 | | | ii. Operating Expenses | 8.9 | 47.1 | | | of which Staff Expenses | 4.9 | 24.1 | | | iii. Provisions and Contingencies | 1.7 | 25.5 | | C | Profit | 2.2 | -20.2 | | | i. Operating Profit (EBPT) | 3.1 | 3.9 | | | ii. Net Profit (PAT) | 1.4 | -22.5 | | D | Total Assets | 276.3 | 699.5 | | E | Financial Ratios # | | | | | i. Operating Profit | 1.1 | 0.6 | | | ii. Net Profit | 0.5 | -3.2 | | | iii. Income (a + b) | 7.5 | 13.5 | | | (a) Interest Income | 6.5 | 12.0 | | | (b) Other Income | 1 | 1.5 | | | iv. Expenditure (a+b+c) | 6.7 | 16.5 | | | (a) Interest Expended | 3.2 | 6.2 | | | (b) Operating Expenses | 3.2 | 6.7 | | | of which Staff Expenses | 1.8 | 3.4 | | | (c) Provisions and Contingencies | 0.3 | 3.6 | | F | Analytical Ratios (%) | | | | | Gross NPA Ratio | 1.8 | 8.7 | | | CRAR | 26.3 | 22.9 | Notes: # As per cent to total assets.
* Based on balance sheet of six SFBs which had commenced their operations before March 31, 2017.
** Based on balance sheet of ten SFBs which had commenced their operations before March 31, 2018.
Source: Off-site returns (domestic operations), RBI. | IV.107 The NIM of SFBs remained higher than that of other bank groups, except for LABs (Chart IV.38). During H1:2018-19, their GNPA ratio (6.1 per cent) recorded improvement while CRAR (22.1 per cent) remained stable. The growth of SFBs so far (up to end-June 2018) has been largely driven by their strategy of offering higher deposit rates to attract customers. Providing better service delivery and garnering trust while shoring up asset quality will be a challenge as well as a key to their future success. 15. Payments Banks IV.108 The Reserve Bank has issued payments bank (PBs) licences to seven entities, out of which five PBs were operational by end-March 2018 and the remaining two were also operational at end-November 2018. The primary objective of establishing PBs is to harness technology so as to increase financial inclusion by opening small savings accounts and providing payments/ remittance services to migrant labourers, small businesses, low income households and other entities in the unorganised sector, by using the digital medium. 15.1 Balance Sheet of PBs IV.109 At end-March 2018, other liabilities (such as unspent balances in PPIs) and provisions of the five PBs in operation accounted for more than half of their balance sheets as compared to the previous year when for two operational PBs, total capital and reserves formed the major share of liabilities. The share of deposits, though still low, increased from 5.7 per cent to 9.0 per cent during the same period. IV.110 The asset composition of PBs reflects the nature of their operations as they are not permitted to undertake lending activities and have to maintain a minimum investment to the extent of not less than 75 per cent of demand deposit balances (DDBs) in Government securities for maintenance of the SLR. Furthermore, they are required to maintain not more than 25 per cent of their DDBs in demand and time deposits with other SCBs. During 2017-18, the share of investments in assets increased from 29.2 per cent to 50.1 per cent (Table IV.37). 15.2 Financial Performance of PBs IV.111 The consolidated balance sheet of PBs showed net losses during 2016-17 and 2017-18. Even operating profit of PBs remained negative, although net interest income improved. The losses of PBs are attributed to high operating expenses as large capital expenditures had to be incurred in setting up initial infrastructure (Table IV.38). It may take some time for PBs to break even as they expand their customer base by offering their unique banking products. During H1:2018-19, PBs13 continued to incur negative operating profit/net profit. | Table IV.37: Consolidated Balance Sheet of Payments Banks | | (Amount in ₹ million) | | Item | End-March 2017 | End-March 2018 | | Total Capital and Reserves | 7,936 | 18,479 | | Deposits | 685 | 4,382 | | Other Liabilities and Provisions | 3,318 | 26,055 | | Total Liabilities/Assets | 11,939 | 48,916 | | Cash and Balances with RBI | 191 | 3,583 | | Balances with Banks and Money Market | 7,629 | 12,426 | | Investments | 3,481 | 24,487 | | Fixed Assets | 102 | 2,357 | | Other Assets | 535 | 6,063 | Note: Data for end-March 2017 and end-March 2018 pertain to two and five PBs, respectively. Hence, the data for these two years are not comparable.
Source: Off-site returns (domestic operations), RBI. |
| Table IV.38: Financial Performance of Payments Banks | | (Amount in ₹ million) | | Sr. No. | Item | 2016-17 | 2017-18 | | A | Income (i + ii) | | | | | i. Interest Income | 314 | 1,756 | | | ii. Other Income | 1,086 | 10,036 | | B | Expenditure | | | | | i. Interest Expended | 7 | 245 | | | ii. Operating Expenses | 3,800 | 16,768 | | | iii. Provisions and Contingencies | 15 | -56 | | | of which, Risk Provisions | 4 | -66 | | | Tax Provisions | 11 | 10 | | C | Net interest income (Ai-Bi) | 307 | 1,511 | | D | Profit | | | | | i. Operating Profit (EBPT) | -2,407 | -5,221 | | | ii. Net Profit/Loss | -2,422 | -5,165 | Note: Data for 2016-17 and 2017-18 pertain to two and five PBs, respectively. Hence, the data for these two years are not comparable.
Source: Off-site returns (domestic operations), RBI. | IV.112 At the same time, the performance of PBs has improved in terms of various performance metrics such as NIM and the cost to income ratio. However, their losses as reflected in RoA, RoE and profit margins continued (Table IV.39). 15.3 Inward and Outward Remittances IV.113 In terms of both value and volume, inward and outward remittances through e-wallets occupied the largest share in the total remittance business of payments banks during 2017-18. In fact, more than 81 per cent of inward remittances in terms of value were made through e-wallets (Table IV.40). | Table IV.39: Select Financial Ratios of Payments Banks | | (At end-March) | | Item | 2017 | 2018 | | Return on Assets | -25.2 | -10.6 | | Return on Equity | -36.4 | -22.4 | | Investments to Total Assets | 29.2 | 50.1 | | Net Interest Margin | 2.8 | 4.5 | | Efficiency (Cost-Income ratio) | 272.7 | 142.2 | | Operating Profit to Working Funds | -25.1 | -10.7 | | Profit Margin | -172.9 | -43.8 | Note: Data for end-March 2017 and end-March 2018 pertain to two and five PBs, respectively. Hence, the data for these two years are not comparable.
Source: Off-site returns (domestic operations), RBI. |
| Table IV.40: Remittances through Payments Banks during 2017-18 | | (Numbers in million and amount in ₹ million) | | Sr. No. | | Inward Remittances | Outward Remittances | | Number | Amount | Number | Amount | | 1. | NEFT | 1 | 9,645 | 2 | 90,613 | | | | (0.1) | (3.2) | (0.2) | (18.2) | | 2. | RTGS | - | 20,098 | - | 31,737 | | | | | (6.7) | | (6.4) | | 3. | IMPS | 6 | 9,622 | 29 | 77,032 | | | | (0.4) | (3.2) | (3.6) | (15.5) | | 4. | UPI | 200 | 16,484 | 213 | 23,432 | | | | (13.9) | (5.5) | (26.4) | (4.7) | | 5. | E - Wallets | 1,232 | 243,368 | 559 | 2,65,479 | | | | (85.6) | (81.0) | (69.3) | (53.4) | | 6. | Others | 0.4 | 1,134 | 4 | 9,223 | | | | | (0.4) | (0.5) | (1.9) | | Total | 1,439 | 300,352 | 807 | 497,516 | | | (100.0) | (100.0) | (100.0) | (100.0) | Notes: 1. -: Nil / negligible.
2. Figures in parentheses are percentages to total.
Source: Off-site returns (domestic operations), RBI. | 16. Overall Assessment IV.114 In an environment of worsening asset quality of banks, resolution of stressed assets and ensuring adequate provisions as well as capital ascended the hierarchy of priorities for the Reserve Bank in 2017-18 and these concerns persisted in H1:2018-19, although some improvement was visible. Provisions for mark-to-market losses on account of hardening of yields on government securities added to these pressures, and in this context, the Reserve Bank allowed banks to spread the losses across four quarters, providing some relief. That banks managed to improve their capital positions and maintained other soundness indicators such as the leverage ratio and the LCR well above the minimum regulatory requirements testifies to the gradually building resilience of the banking sector. IV.115 Bank credit is recovering from the risk aversion of recent years and bank intermediation in the flow of resources to the commercial sector is regaining lost ground. There are shifts underway, though, with a renewed focus on lending to less stressed sectors such as retail loans. Lending to the agricultural sector is getting adversely impacted possibly reflecting deteriorating asset quality in the sector. Policy initiatives such as expanding the ambit of PMJDY—from every household to every adult— and the ongoing third phase of the financial inclusion plan is expected to deepen formal financialisaton of disadvantaged sections of society. Furthermore, capital infusion in weak RRBs and operationalisation of an increased number of SFBs and PBs is expected to enable the expansion of the geographical penetration of banking services. On the consumer protection front, improvements in grievance redressal, introduction of innovative products for digital payments, and measures to improve cyber security in banking are all expected to leverage on the progress made so far to expand financial inclusion to encompass all Indians and to provide financial services efficiently and costeffectively. IV.116 Going forward, the IBC and the evolving framework for resolution of stressed assets is expected to address the bad loan problem and improve debtor-creditor relationships even as competition from NBFCs, bond market and fintech companies intensifies. In this environment, banks need to augment their capital base to guard against future balance sheet stress, and improve their credit monitoring and risk management strategies in order to support inclusive growth in the evolving financial landscape.
|