Today, the Reserve Bank released the results of the December 2017 round of the Inflation Expectations Survey of Households (IESH)1. The survey was conducted in 18 cities and the results are based on responses from 5,321 urban households covering various occupational categories (Table 1). Highlights: -
The proportion of respondents expecting prices to increase in the next three months at more than the current rate declined in the December 2017 round across all product groups. (Table 2) -
Expectations of the rate of price rise over the next one year period also moderated in a broad-based manner as compared with the preceding (November 2017) round of the survey. -
Households’ responses on general price movements were closely associated with those on food and non-food prices, as well as the cost of services. (Table 3) -
Three months ahead median inflation expectations remained unchanged while for one year ahead, they declined by 10 basis points (bps) from the last survey round. -
From a year ago, i.e. vis-à-vis the December 2016 round of the survey, both three months ahead and one year ahead inflation expectations rose by 20 bps. (Table 4) 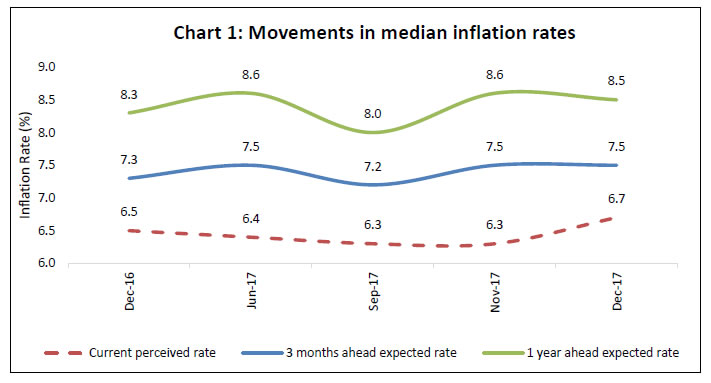 | Table 1: Respondents’ Profile (Category): Share in Total Sample - December 2017 | | Category of Respondents | Share in Total (%) | Target Share (%) | | Financial Sector Employees | 9.9 | 10.0 | | Other Employees | 15.2 | 15.0 | | Self-employed | 19.7 | 20.0 | | Homemakers | 30.3 | 30.0 | | Retired Persons | 9.5 | 10.0 | | Daily Workers | 9.5 | 10.0 | | Others | 5.8 | 5.0 |
| Table 2: Product-wise Expectations of Prices for Three Months ahead and One Year ahead | | (Percentage of Respondents) | | Round | Dec-16 | Jun-17 | Sep-17 | Nov-17 | Dec-17 | Dec-16 | Jun-17 | Sep-17 | Nov-17 | Dec-17 | | Options: General | Three Months Ahead | One Year Ahead | | Prices will increase | 59.9 | 77.2 | 81.3 | 81.4 | 80.6 | 68.1 | 82.4 | 93.5 | 92.8 | 92.7 | | Price increase more than current rate | 28.9 | 39.9 | 50.5 | 53.2 | 49.8 | 35.2 | 44.1 | 61.2 | 64.1 | 63.0 | | Price increase similar to current rate | 23.0 | 26.6 | 25.4 | 23.1 | 24.6 | 24.9 | 28.3 | 27.3 | 23.8 | 23.9 | | Price increase less than current rate | 8.0 | 10.7 | 5.4 | 5.1 | 6.2 | 8.0 | 10.1 | 5.0 | 4.8 | 5.8 | | No change in prices | 26.9 | 16.8 | 15.8 | 16.3 | 17.4 | 19.8 | 11.2 | 4.1 | 5.5 | 5.3 | | Decline in prices | 13.3 | 6.0 | 2.9 | 2.3 | 2.0 | 12.2 | 6.4 | 2.5 | 1.8 | 2.0 | | Options: Food Product | Three Months Ahead | One Year Ahead | | Prices will increase | 61.2 | 71.6 | 79.5 | 80.3 | 78.1 | 66.4 | 75.8 | 84.8 | 85.7 | 85.0 | | Price increase more than current rate | 30.3 | 39.1 | 47.5 | 50.4 | 45.8 | 32.2 | 38.0 | 51.4 | 54 | 52.1 | | Price increase similar to current rate | 19.6 | 21.8 | 24.8 | 23.2 | 23.4 | 24.1 | 26.8 | 27.5 | 25.2 | 24.9 | | Price increase less than current rate | 11.3 | 10.7 | 7.3 | 6.7 | 8.9 | 10.1 | 11.0 | 6.0 | 6.5 | 8.1 | | No change in prices | 17.1 | 14.2 | 13.3 | 12.9 | 15.5 | 16.6 | 12.4 | 9.3 | 9.0 | 10.4 | | Decline in prices | 21.7 | 14.3 | 7.1 | 6.8 | 6.4 | 17.1 | 11.8 | 5.9 | 5.3 | 4.6 | | Options: Non-Food Product | Three Months Ahead | One Year Ahead | | Prices will increase | 57.8 | 72.1 | 74.7 | 75.7 | 73.3 | 62.2 | 74.8 | 81.4 | 81.4 | 80.5 | | Price increase more than current rate | 27.4 | 36.9 | 43.4 | 47.1 | 41.2 | 29.2 | 36.3 | 48.2 | 51.2 | 48.8 | | Price increase similar to current rate | 20.6 | 23.6 | 24.8 | 21.9 | 23.3 | 23.3 | 27.3 | 26.7 | 23.5 | 23.7 | | Price increase less than current rate | 9.7 | 11.6 | 6.6 | 6.7 | 8.8 | 9.7 | 11.2 | 6.5 | 6.8 | 7.9 | | No change in prices | 26.2 | 18.1 | 19.3 | 19.5 | 21.9 | 23.5 | 16.3 | 13.8 | 14.4 | 15.4 | | Decline in prices | 16.0 | 9.8 | 5.9 | 4.8 | 4.8 | 14.4 | 9.0 | 4.8 | 4.2 | 4.2 | | Options: Household Durables | Three Months Ahead | One Year Ahead | | Prices will increase | 44.6 | 65.4 | 61.5 | 61.9 | 60.0 | 52.7 | 70.3 | 70.7 | 71 | 68.8 | | Price increase more than current rate | 20.9 | 34.7 | 37.3 | 38.6 | 35.0 | 24.8 | 35.7 | 42.7 | 44.5 | 42.3 | | Price increase similar to current rate | 16.4 | 20.6 | 19.1 | 17.4 | 18.6 | 18.9 | 24.3 | 22.6 | 20.7 | 19.8 | | Price increase less than current rate | 7.3 | 10.1 | 5.1 | 5.8 | 6.4 | 9.0 | 10.3 | 5.4 | 5.8 | 6.7 | | No change in prices | 32.5 | 20.6 | 25.3 | 26.8 | 28.8 | 27.0 | 17.5 | 19.1 | 20.3 | 21.7 | | Decline in prices | 22.9 | 14.0 | 13.2 | 11.3 | 11.3 | 20.3 | 12.2 | 10.2 | 8.7 | 9.5 | | Options: Housing Prices | Three Months Ahead | One Year Ahead | | Prices will increase | 44.6 | 64.3 | 68.9 | 70.5 | 69.5 | 54.0 | 73.4 | 78.9 | 78.8 | 78.4 | | Price increase more than current rate | 24.8 | 37.1 | 44.9 | 48.4 | 45.9 | 29.6 | 42.2 | 53.0 | 54.5 | 53.3 | | Price increase similar to current rate | 13.1 | 18.6 | 19.2 | 17 | 18.0 | 16.7 | 22.4 | 20.8 | 19.4 | 19.2 | | Price increase less than current rate | 6.6 | 8.7 | 4.9 | 5.0 | 5.6 | 7.7 | 8.8 | 5.1 | 4.9 | 5.9 | | No change in prices | 21.5 | 22.0 | 20.0 | 20.1 | 21.0 | 18.0 | 15.1 | 12.4 | 13.6 | 14.0 | | Decline in prices | 33.9 | 13.6 | 11.1 | 9.5 | 9.5 | 28.0 | 11.5 | 8.8 | 7.7 | 7.7 | | Options: Cost of Services | Three Months Ahead | One Year Ahead | | Prices will increase | 57.6 | 68.9 | 68.7 | 71.1 | 71.5 | 66.8 | 78.6 | 82.9 | 83.4 | 82.8 | | Price increase more than current rate | 27.1 | 35.1 | 40.7 | 44.3 | 41.4 | 32.6 | 38.8 | 48.6 | 51.5 | 50.5 | | Price increase similar to current rate | 21.0 | 23.7 | 22.5 | 20.7 | 23.2 | 23.7 | 27.8 | 27.9 | 25.2 | 24.3 | | Price increase less than current rate | 9.5 | 10.2 | 5.5 | 6.2 | 6.8 | 10.5 | 12.0 | 6.4 | 6.7 | 8.0 | | No change in prices | 29.8 | 25.3 | 27.3 | 25.8 | 25.6 | 22.3 | 15.6 | 13.5 | 14 | 14.2 | | Decline in prices | 12.6 | 5.8 | 4.0 | 3.1 | 3.0 | 10.9 | 5.9 | 3.7 | 2.6 | 3.0 | | Note: Constituent items may not add up to totals, due to rounding off. |
| Table 3: Households Expecting General Price Movements in Coherence with Movements in Price Expectations of Various Product Groups: Three Months Ahead and One Year Ahead | | (Percentage of Respondents) | | Round No. | Survey period ended | Food | Non-Food | Households durables | Housing | Cost of services | | Three Months Ahead | | 46 | Dec-16 | 55.4 | 55.8 | 48.5 | 47.0 | 57.7 | | 48 | Jun-17 | 62.0 | 64.3 | 57.2 | 57.6 | 63.4 | | 49 | Sep-17 | 66.8 | 65.8 | 56.8 | 60.1 | 64.9 | | 49B | Nov-17 | 66.6 | 67.4 | 57.1 | 60.3 | 65.7 | | 50 | Dec-17 | 64.9 | 64.1 | 55.5 | 58.4 | 63.8 | | One Year Ahead | | 46 | Dec-16 | 62.2 | 59.7 | 52.8 | 51.7 | 62.3 | | 48 | Jun-17 | 68.2 | 67.7 | 62.0 | 63.2 | 70.0 | | 49 | Sep-17 | 72.7 | 69.9 | 60.5 | 67.4 | 69.8 | | 49B | Nov-17 | 72.7 | 70.5 | 60.9 | 66.2 | 71.3 | | 50 | Dec-17 | 70.1 | 69.0 | 58.8 | 65.1 | 70.5 |
| Table 4: Household Inflation Expectations – Current, Three Months and One Year Ahead | | Survey Round | Survey Period Ended | Inflation rate in Per cent | | Current | Three Months Ahead | One Year Ahead | | Mean | Median | Std. Dev. | Mean | Median | Std. Dev. | Mean | Median | Std. Dev. | | 46 | Dec-16 | 7.4 | 6.5 | 3.9 | 7.9 | 7.3 | 4.1 | 8.7 | 8.3 | 4.3 | | 48 | Jun-17 | 7.3 | 6.4 | 3.8 | 8.1 | 7.5 | 3.9 | 9.1 | 8.6 | 4.1 | | 49 | Sep-17 | 7.6 | 6.3 | 3.9 | 8.2 | 7.2 | 4.0 | 8.7 | 8.0 | 4.5 | | 49B | Nov-17 | 7.7 | 6.3 | 4.1 | 8.4 | 7.5 | 4.2 | 8.9 | 8.6 | 4.6 | | 50 | Dec-17 | 7.9 | 6.7 | 4.2 | 8.4 | 7.5 | 4.3 | 8.9 | 8.5 | 4.8 |
| Table 5: Factors that Explain the Total Variability | | Round No. | Survey Period Ended | Current | Three Months Ahead | One Year Ahead | | 46 | Dec-16 | City, Gender, Age-Group | City, Category, Age-Group | City, Category | | 48 | Jun-17 | City, Age-Group, Category | City, Age-Group, Category | City, Age-Group, Category | | 49 | Sep-17 | City, Gender, Category | City, Age-Group, Category | City, Gender, Category | | 49B | Nov-17 | City, Category, Age-Group | City, Category | City, Category | | 50 | Dec-17 | City, Category, Age-Group, Gender | City, Category, Age-Group | City, Category |
| Table 6 : Various Group-wise Inflation Expectations: December 2017 | | | Current | Three Months Ahead | One Year Ahead | | Mean | Median | Std. Dev. | Mean | Median | Std. Dev. | Mean | Median | Std. Dev. | | Overall | 7.9 | 6.7 | 4.2 | 8.4 | 7.5 | 4.3 | 8.9 | 8.5 | 4.8 | | Gender-wise | | Male | 8.0 | 6.9 | 4.3 | 8.4 | 7.4 | 4.4 | 8.8 | 8.3 | 4.8 | | Female | 7.7 | 6.6 | 4.1 | 8.4 | 7.5 | 4.2 | 9.1 | 8.7 | 4.7 | | Category-wise | | Financial Sector Employees | 7.4 | 6.6 | 3.7 | 7.8 | 7.3 | 4.0 | 8.4 | 8.0 | 4.4 | | Other Employees | 7.9 | 6.6 | 4.4 | 8.3 | 7.4 | 4.5 | 8.7 | 8.3 | 4.9 | | Self Employed | 7.9 | 6.9 | 4.2 | 8.3 | 7.4 | 4.3 | 8.6 | 8.3 | 4.9 | | Homemakers | 7.9 | 6.8 | 4.2 | 8.5 | 7.6 | 4.2 | 9.3 | 8.9 | 4.7 | | Retired Persons | 8.2 | 6.7 | 4.6 | 8.5 | 7.3 | 4.7 | 8.9 | 8.1 | 5.1 | | Daily Workers | 8.3 | 7.0 | 4.3 | 8.8 | 7.9 | 4.3 | 9.6 | 9.4 | 4.9 | | Other category | 7.5 | 6.5 | 3.8 | 8.0 | 7.3 | 3.9 | 8.5 | 8.1 | 4.3 | | Age Group-wise | | Up to 25 years | 7.1 | 6.3 | 3.7 | 7.7 | 7.1 | 3.8 | 8.4 | 8.0 | 4.1 | | 25 to 30 years | 7.7 | 6.7 | 4.0 | 8.2 | 7.4 | 4.2 | 8.7 | 8.1 | 4.5 | | 30 to 35 years | 7.8 | 6.7 | 4.0 | 8.3 | 7.4 | 4.1 | 9.0 | 8.6 | 4.7 | | 35 to 40 years | 7.9 | 6.3 | 4.3 | 8.5 | 7.4 | 4.3 | 9.0 | 8.4 | 4.9 | | 40 to 45 years | 8.1 | 7.3 | 4.1 | 8.8 | 8.0 | 4.3 | 9.3 | 9.3 | 4.9 | | 45 to 50 years | 8.2 | 7.3 | 4.4 | 8.5 | 7.5 | 4.6 | 9.0 | 9.1 | 5.1 | | 50 to 55 years | 8.2 | 7.4 | 4.4 | 8.7 | 7.8 | 4.6 | 9.3 | 9.1 | 5.1 | | 55 to 60 years | 8.7 | 7.5 | 4.8 | 8.8 | 7.9 | 4.8 | 9.2 | 8.8 | 5.3 | | 60 years and above | 8.6 | 7.2 | 4.7 | 8.8 | 7.7 | 4.7 | 9.2 | 8.6 | 5.2 | | City-wise | | Ahmedabad | 10.4 | 10.1 | 4.1 | 11.0 | 10.4 | 4.1 | 11.6 | 10.8 | 4.2 | | Bengaluru | 3.1 | 3.0 | 1.0 | 3.9 | 3.8 | 1.3 | 4.5 | 4.5 | 1.5 | | Bhopal | 8.1 | 6.9 | 4.2 | 8.0 | 7.4 | 4.8 | 8.1 | 7.8 | 4.9 | | Bhubaneswar | 7.5 | 6.3 | 3.1 | 9.4 | 8.6 | 3.4 | 11.5 | 10.9 | 3.5 | | Chennai | 10.1 | 10.3 | 4.2 | 11.2 | 10.9 | 4.5 | 12.4 | 15.0 | 4.6 | | Delhi | 7.7 | 6.3 | 4.1 | 7.7 | 6.6 | 4.2 | 7.6 | 6.6 | 4.5 | | Guwahati | 12.1 | 14.1 | 5.0 | 8.1 | 7.1 | 5.7 | 8.8 | 8.1 | 6.0 | | Hyderabad | 9.1 | 7.8 | 3.9 | 9.8 | 8.5 | 3.9 | 10.7 | 9.7 | 3.7 | | Jaipur | 8.0 | 7.4 | 3.2 | 8.1 | 7.6 | 3.4 | 8.7 | 8.4 | 4.1 | | Kolkata | 10.3 | 10.2 | 4.8 | 11.1 | 10.6 | 4.6 | 11.8 | 11.3 | 4.5 | | Lucknow | 6.7 | 6.2 | 2.7 | 7.1 | 6.8 | 2.8 | 6.9 | 7.2 | 3.7 | | Mumbai | 8.1 | 7.6 | 3.1 | 8.6 | 8.3 | 3.3 | 8.8 | 9.0 | 4.1 | | Nagpur | 6.7 | 5.9 | 3.6 | 7.6 | 7.2 | 3.8 | 8.0 | 8.0 | 4.0 | | Patna | 6.0 | 5.7 | 2.3 | 6.3 | 5.9 | 2.5 | 6.9 | 6.3 | 3.2 | | Thiruvananthapuram | 7.8 | 6.7 | 4.0 | 8.7 | 7.9 | 4.2 | 8.8 | 9.1 | 5.4 | | Chandigarh | 5.4 | 4.7 | 3.4 | 6.6 | 5.9 | 3.5 | 7.9 | 7.6 | 4.0 | | Ranchi | 5.9 | 5.3 | 2.5 | 6.6 | 6.3 | 3.0 | 6.5 | 6.3 | 3.7 | | Raipur | 5.5 | 5.2 | 3.0 | 6.1 | 5.5 | 3.3 | 6.6 | 6.3 | 4.6 |
| Table 7: Cross-tabulation of Current and Three Months Ahead Inflation Expectations: December 2017 | | (Number of Respondents) | | Three Months Ahead Inflation Rate (per cent) | Current Inflation Rate
(per cent) | | <1 | 1-<2 | 2-<3 | 3-<4 | 4-<5 | 5-<6 | 6-<7 | 7-<8 | 8-<9 | 9-<10 | 10-<11 | 11-<12 | 12-<13 | 13-<14 | 14-<15 | 15-<16 | >=16 | No idea | Total | | <1 | 28 | 7 | 4 | 1 | 2 | 2 | 1 | 1 | 0 | 0 | 0 | 0 | 1 | 0 | 0 | 0 | 0 | 0 | 47 | | 1-<2 | 7 | 31 | 27 | 7 | 1 | 0 | 0 | 0 | 0 | 0 | 1 | 0 | 0 | 0 | 0 | 0 | 0 | 0 | 74 | | 2-<3 | 3 | 16 | 113 | 93 | 36 | 17 | 3 | 1 | 0 | 0 | 1 | 0 | 0 | 0 | 0 | 0 | 0 | 0 | 283 | | 3-<4 | 6 | 2 | 20 | 179 | 121 | 56 | 12 | 3 | 0 | 0 | 1 | 0 | 0 | 0 | 0 | 0 | 0 | 1 | 401 | | 4-<5 | 7 | 1 | 11 | 8 | 250 | 122 | 61 | 15 | 5 | 1 | 2 | 0 | 0 | 0 | 0 | 1 | 0 | 0 | 484 | | 5-<6 | 13 | 3 | 7 | 18 | 21 | 465 | 188 | 185 | 69 | 10 | 45 | 2 | 3 | 0 | 0 | 8 | 0 | 1 | 1038 | | 6-<7 | 0 | 2 | 0 | 4 | 0 | 14 | 222 | 128 | 58 | 12 | 9 | 0 | 1 | 0 | 0 | 0 | 0 | 2 | 452 | | 7-<8 | 6 | 1 | 4 | 4 | 1 | 7 | 6 | 231 | 118 | 45 | 36 | 2 | 4 | 1 | 0 | 0 | 0 | 0 | 466 | | 8-<9 | 6 | 1 | 3 | 0 | 0 | 5 | 4 | 3 | 139 | 88 | 59 | 8 | 16 | 2 | 0 | 0 | 3 | 1 | 338 | | 9-<10 | 2 | 0 | 1 | 1 | 1 | 1 | 0 | 2 | 5 | 82 | 55 | 24 | 18 | 2 | 3 | 2 | 0 | 0 | 199 | | 10-<11 | 9 | 1 | 2 | 7 | 0 | 26 | 2 | 7 | 17 | 5 | 270 | 57 | 98 | 35 | 9 | 102 | 21 | 4 | 672 | | 11-<12 | 2 | 2 | 2 | 0 | 0 | 0 | 0 | 1 | 0 | 1 | 0 | 20 | 10 | 4 | 1 | 3 | 2 | 3 | 51 | | 12-<13 | 1 | 0 | 0 | 0 | 1 | 0 | 0 | 0 | 1 | 1 | 2 | 1 | 20 | 9 | 6 | 4 | 3 | 0 | 49 | | 13-<14 | 1 | 0 | 0 | 0 | 0 | 0 | 0 | 0 | 1 | 0 | 0 | 1 | 1 | 6 | 0 | 3 | 5 | 0 | 18 | | 14-<15 | 0 | 1 | 0 | 2 | 0 | 0 | 0 | 0 | 0 | 0 | 0 | 0 | 1 | 0 | 8 | 3 | 8 | 1 | 24 | | 15-<16 | 4 | 0 | 0 | 0 | 0 | 2 | 3 | 0 | 0 | 0 | 5 | 0 | 1 | 1 | 3 | 66 | 58 | 5 | 148 | | >=16 | 11 | 1 | 2 | 2 | 3 | 14 | 3 | 1 | 0 | 1 | 18 | 3 | 3 | 1 | 0 | 11 | 489 | 14 | 577 | | Total | 106 | 69 | 196 | 326 | 437 | 731 | 505 | 578 | 413 | 246 | 504 | 118 | 177 | 61 | 30 | 203 | 589 | 32 | 5321 |
| Table 8: Cross-tabulation of Current and One Year Ahead Inflation Expectations: December 2017 | | (Number of Respondents) | | One Year Ahead Inflation Rate (per cent) | Current Inflation Rate
(per cent) | | <1 | 1-<2 | 2-<3 | 3-<4 | 4-<5 | 5-<6 | 6-<7 | 7-<8 | 8-<9 | 9-<10 | 10-<11 | 11-<12 | 12-<13 | 13-<14 | 14-<15 | 15-<16 | >=16 | No idea | Total | | <1 | 24 | 4 | 6 | 1 | 3 | 3 | 1 | 2 | 0 | 0 | 2 | 0 | 0 | 0 | 0 | 0 | 1 | 0 | 47 | | 1-<2 | 15 | 12 | 20 | 17 | 5 | 4 | 0 | 1 | 0 | 0 | 0 | 0 | 0 | 0 | 0 | 0 | 0 | 0 | 74 | | 2-<3 | 31 | 2 | 55 | 56 | 73 | 29 | 14 | 10 | 7 | 0 | 4 | 0 | 0 | 0 | 1 | 0 | 0 | 1 | 283 | | 3-<4 | 24 | 3 | 7 | 94 | 83 | 105 | 35 | 18 | 13 | 6 | 8 | 2 | 1 | 0 | 0 | 0 | 0 | 2 | 401 | | 4-<5 | 40 | 2 | 4 | 3 | 164 | 71 | 99 | 37 | 30 | 16 | 9 | 2 | 3 | 1 | 0 | 1 | 1 | 1 | 484 | | 5-<6 | 84 | 0 | 6 | 8 | 5 | 286 | 95 | 171 | 101 | 69 | 130 | 10 | 15 | 4 | 3 | 30 | 17 | 4 | 1038 | | 6-<7 | 38 | 0 | 2 | 0 | 1 | 7 | 122 | 68 | 104 | 43 | 46 | 1 | 8 | 4 | 0 | 4 | 0 | 4 | 452 | | 7-<8 | 37 | 0 | 0 | 1 | 2 | 1 | 8 | 133 | 67 | 85 | 68 | 17 | 21 | 3 | 6 | 12 | 4 | 1 | 466 | | 8-<9 | 16 | 0 | 0 | 0 | 0 | 2 | 4 | 2 | 93 | 37 | 101 | 20 | 35 | 9 | 5 | 7 | 6 | 1 | 338 | | 9-<10 | 18 | 0 | 0 | 0 | 0 | 2 | 0 | 1 | 2 | 53 | 24 | 37 | 23 | 10 | 11 | 13 | 3 | 2 | 199 | | 10-<11 | 35 | 0 | 4 | 0 | 0 | 17 | 0 | 6 | 9 | 7 | 203 | 27 | 71 | 15 | 25 | 109 | 138 | 6 | 672 | | 11-<12 | 4 | 1 | 2 | 0 | 0 | 2 | 0 | 1 | 0 | 0 | 2 | 15 | 2 | 3 | 2 | 9 | 5 | 3 | 51 | | 12-<13 | 1 | 0 | 1 | 0 | 0 | 0 | 0 | 0 | 1 | 0 | 0 | 0 | 21 | 2 | 1 | 13 | 9 | 0 | 49 | | 13-<14 | 2 | 0 | 0 | 0 | 0 | 1 | 0 | 1 | 0 | 0 | 0 | 0 | 0 | 4 | 2 | 2 | 6 | 0 | 18 | | 14-<15 | 1 | 0 | 0 | 1 | 0 | 1 | 0 | 0 | 0 | 0 | 0 | 0 | 1 | 0 | 7 | 2 | 10 | 1 | 24 | | 15-<16 | 9 | 0 | 0 | 0 | 0 | 2 | 0 | 0 | 0 | 0 | 3 | 2 | 0 | 2 | 1 | 45 | 79 | 5 | 148 | | >=16 | 34 | 0 | 1 | 2 | 3 | 7 | 2 | 1 | 2 | 0 | 11 | 0 | 0 | 0 | 2 | 9 | 486 | 17 | 577 | | Total | 413 | 24 | 108 | 183 | 339 | 540 | 380 | 452 | 429 | 316 | 611 | 133 | 201 | 57 | 66 | 256 | 765 | 48 | 5321 |
|