The balance sheets of banks remained beleaguered with persistent deterioration in the asset quality. It dented banks’ profitability and constrained the financial intermediation. Consequent deleveraging resulted in historically low credit growth. Portfolio rebalancing towards less stressed sectors was also observed. Nonetheless, banks were able to strengthen their capital positions. Further progress was made towards the goal of universal financial inclusion through the ongoing financial inclusion plan and operationalisation of new differentiated banks. It is expected that through new institutional mechanisms such as Insolvency and Bankruptcy Code, the resolve on the part of the Government and the Reserve Bank to collectively address the problem of stressed assets and banks’ own efforts towards improving efficiency, credit monitoring and risk management, they will be able to overcome the strains on lending capacity and efficiently perform their role as financial intermediaries. I. Introduction V.1 The Indian financial system remains bank-dominated, even as the availability of finance from alternative sources has increased in recent years. During 2016-17, bank credit accounted for 35 per cent of the total flow of financial resources to the commercial sector. The persistent deterioration in the banks’ asset quality has dented the profitability and constrained the financial intermediation. Consequent deleveraging has resulted in historically low credit growth, although subdued demand, especially from industry, has also restrained credit off-take. Demonetisation of specified bank notes (SBNs) in November 2016 impacted the banking sector’s performance transitorily in the form of a surge of low-cost deposits and abundance of liquidity in the system, which speeded up transmission of interest rate reduction and altered banks’ balance sheet structures even as they were engaged in managing the process of currency withdrawal and replacement. V.2 The Reserve Bank’s ongoing regulatory and supervisory initiatives for a time-bound resolution of stressed assets and reviving credit flow to productive sectors, received statutory backing from the Government through various institutional reforms. At the same time, efforts were also made to augment the capital base of public sector banks (PSBs) to buffer them against balance sheet stress so that they can reinvigorate their primary role of financial intermediation and support inclusive growth. On their part, banks also mobilised capital and fine-tuned their business strategies to remain competitive in the evolving financial landscape. V.3 Against this backdrop, this chapter discusses operations and performance of the Indian banking sector during 2016-17, based on the audited balance sheets of banks and off-site supervisory returns submitted to the Reserve Bank. The chapter analyses developments in balance sheets, profitability, financial soundness and credit deployment using data for 94 scheduled commercial banks (SCBs). The chapter also highlights other key issues engaging the banking system such as financial inclusion, regional penetration, customer services, indicators of payment system and banks’ overseas operations. Developments related to regional rural banks (RRBs), local area banks (LABs) and the newly created small finance banks (SFBs) are analysed separately. The concluding section highlights the major issues that emerge from the analysis and offers suggestions on the way forward. II. Balance Sheet Operations of Scheduled Commercial Banks V.4 In an environment characterised by slowing economic activity – mainly located in industry and subdued demand, the growth in consolidated balance sheet of banks moderated further during 2016-17. Credit growth fell to a record low of 2.8 per cent1 pulled down by persistent decline in asset quality which necessitated a sharp increase in provisioning requirements (Chart V.1). As a consequence, banks’ profitability was adversely impacted and risk aversion set in. V.5 Only private sector banks (PVBs) were able to manage positive credit growth during the year (Chart V.2). 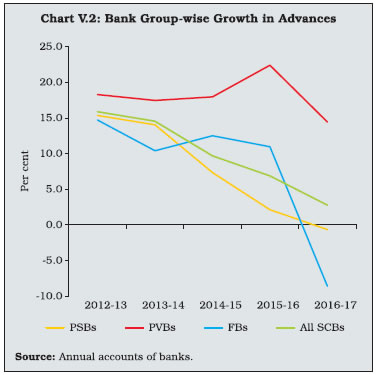 V.6 The flow of resources from non-bank sources picked up to fill the gap opened by the dwindling bank credit. In 2015-16, the banking system had met more than 50 per cent of the requirements of financing of the commercial sector; however, its share fell to 34.9 per cent during 2016-17. Within non-banks, private placements of corporate bonds and commercial papers (CPs) constituted about 21 per cent of the total funding requirements of non-financial companies. CP issuances almost doubled to ₹1,002 billion in 2016-17. The increasing recourse to the bond market by large corporates was driven by the relatively cheaper costs of funds as bond yields fully transmitted the interest rate reduction of 175 basis points during the accommodative phase of the monetary policy that began in January 2015. The enhanced flow of household savings into mutual funds, insurance firms and pension funds helped stoke domestic institutional investors’ demand for bonds. Non-banking financial companies (NBFCs) and housing finance companies (HFCs) also emerged as alternate source of funds in the non-bank segment, accounting for 18 per cent of the total financial flows. Among foreign sources, foreign direct investments were the pre-dominant source (Table V.1). | Table V.1: Trends in Flow of Financial Resources to the Commercial Sector from Banks and Non-banks | | (Amount in ₹ billion) | | Source | 2013-14 | 2014-15 | 2015-16 | 2016-17 | | A. Adjusted Non-food Bank Credit | 7,627 | 5,850 | 7,755 | 4,952 | | | (54.0) | (45.5) | (51.3) | (34.9) | | i) Non-food Credit | 7,316 | 5,464 | 7,024 | 3,882 | | ii) Non-SLR Investments by SCBs | 311 | 386 | 731 | 1,070 | | B. Flow from Non-banks (B1+B2) | 6,505 | 7,005 | 7,358 | 9,257 | | | (46.0) | (54.5) | (48.7) | (65.1) | | B1. Domestic Sources | 4,302 | 4,740 | 4,899 | 6,499 | | | (30.4) | (36.9) | (32.4) | (45.7) | | 1 Public Issues by Non-financial Entities | 199 | 87 | 378 | 155 | | 2 Gross Private Placements by Non-financial Entities | 1,314 | 1,277 | 1,135 | 2,004 | | 3 Net Issuance of CPs Subscribed to by Non-banks | 138 | 558 | 517 | 1,002 | | 4 Net Credit by Housing Finance Companies | 737 | 954 | 1,188 | 1,346 | | 5 Total Accommodation by Four RBI Regulated AIFIs – NABARD, NHB, SIDBI and EXIM Bank | 436 | 417 | 472 | 469 | | 6 Systemically Important Non-deposit Taking NBFCs (Net of Bank Credit) | 1,124 | 1,046 | 840 | 1,245 | | 7 LIC’s Net Investments in Corporate Debt, Infrastructure and Social Sector | 354 | 401 | 369 | 277 | | B2. Foreign Sources | 2,203 | 2,265 | 2,459 | 2,758 | | | (15.6) | (17.6) | (16.3) | (19.4) | | 1 External Commercial Borrowings / FCCBs | 661 | 14 | -388 | -509 | | 2 ADR/GDR Issues excluding Banks and Financial Institutions | 1 | 96 | - | - | | 3 Short-term Credit from Abroad | -327 | -4 | -96 | 435 | | 4 Foreign Direct Investments to India | 1,868 | 2,159 | 2,943 | 2,833 | | C. Total Flow of Resources (A+B) | 14,132 | 12,855 | 15,113 | 14,209 | | | (100.0) | (100.0) | (100.0) | (100.0) | Notes: 1. -: Nil / negligible.
2. Figures in parentheses are percentages to total.
3. The sum of components may not add up due to rounding-off.
Source: RBI, SEBI, BSE, NSE, Merchant Banks, LIC and NHB. | V.7 Circling back to banks’ consolidated balance sheet, investments – the other major component in the asset side – also recorded a marginal deceleration, though investment in non- SLR securities picked up. Among bank groups, PSBs recorded a faster pace of investments than PVBs. On the liabilities side, deposits increased sharply due to withdrawal of SBNs within a pre-announced time period (Table V.2). | Table V.2: Consolidated Balance Sheet of Scheduled Commercial Banks | | (Amount in ₹ billion) | | Item | As at end-March | | Public Sector Banks | Private Sector Banks | Foreign Banks | All Scheduled Commercial Banks | | 2016 | 2017 | 2016 | 2017 | 2016 | 2017 | 2016 | 2017# | | 1. Capital | 192 | 243 | 106 | 110 | 585 | 629 | 882 | 993 | | 2. Reserves and Surplus | 5,153 | 5,544 | 3,185 | 3,709 | 792 | 840 | 9131 | 10,105 | | 3. Deposits | 74,862 | 80,793 | 21,477 | 25,648 | 4,588 | 4,655 | 100,927 | 111,139 | | 3.1. Demand Deposits | 4,948 | 5,464 | 2,932 | 3,871 | 1,106 | 1,223 | 8,986 | 10,559 | | 3.2. Savings Bank Deposits | 19,513 | 24,738 | 5,511 | 7,173 | 494 | 529 | 25,518 | 32,451 | | 3.3. Term Deposits | 50,400 | 50,591 | 13,034 | 14,605 | 2,988 | 2,904 | 66,422 | 68,130 | | 4. Borrowings | 7,907 | 7,219 | 5,338 | 4,835 | 1,243 | 705 | 14,488 | 12,807 | | 5. Other Liabilities and Provisions | 3,567 | 3,558 | 1,362 | 1,712 | 937 | 1,266 | 5,866 | 6,541 | | Total Liabilities/Assets | 91,681 | 97,356 | 31,467 | 36,015 | 8,145 | 8,095 | 131,293 | 141,586 | | 1. Cash and Balances with RBI | 4,185 | 4,842 | 1,217 | 1,585 | 238 | 374 | 5,639 | 6,805 | | 2. Balances with Banks and Money at Call and Short Notice | 3,929 | 5,303 | 759 | 1,300 | 561 | 759 | 5,248 | 7,374 | | 3. Investments | 22,481 | 25,547 | 7,985 | 8,551 | 2,812 | 2,397 | 33,278 | 36,522 | | 3.1 Government Securities (a+b) | 18,868 | 21,183 | 6,124 | 6,317 | 2,461 | 2,068 | 27,454 | 29,593 | | a) In India | 18,605 | 20,946 | 6,083 | 6,271 | 2,402 | 2,003 | 27,089 | 29,246 | | b) Outside India | 263 | 237 | 41 | 46 | 60 | 65 | 364 | 347 | | 3.2 Other Approved Securities | 3 | 3 | - | - | - | - | 3 | 3 | | 3.3 Non-approved Securities | 3,609 | 4,361 | 1,861 | 2,234 | 351 | 330 | 5,822 | 6,925 | | 4. Loans and Advances | 55,936 | 55,572 | 19,393 | 22,196 | 3,636 | 3,323 | 78,965 | 81,162 | | 4.1 Bills Purchased and Discounted | 2,996 | 2,806 | 520 | 804 | 685 | 707 | 4,202 | 4,317 | | 4.2 Cash Credits, Overdrafts, etc. | 23,530 | 23,516 | 5,573 | 6,285 | 1,562 | 1,370 | 30,665 | 31,180 | | 4.3 Term Loans | 29,409 | 29,251 | 13,300 | 15,107 | 1,388 | 1,247 | 44,098 | 45,665 | | 5. Fixed Assets | 841 | 1,200 | 227 | 255 | 52 | 48 | 1,121 | 1,507 | | 6. Other Assets | 4,310 | 4,892 | 1,886 | 2,128 | 846 | 1,193 | 7,042 | 8,216 | Notes: 1. -: Nil / negligible.
2. #: Includes data relating to Capital Small Finance Bank Ltd. and Equitas Small Finance Bank Ltd. which were included in the Second Schedule to the Reserve Bank of India Act, 1934 with effect from November 8, 2016 and December 23, 2016, respectively.
3. Components may not add up to their respective totals due to rounding off numbers to ₹ billion.
Source: Annual accounts of respective banks. | V.8 Growth in deposits was largely led by current and saving accounts (CASA) deposits, while growth in term-deposits was muted. The lacklustre growth in term-deposits is attributed to sluggish credit growth and comparatively low returns on these deposits as compared to small savings schemes and other market-based instruments. PVBs were more successful in raising deposits across all categories of deposits as compared to PSBs and foreign banks (FBs) (Chart V.3). Apart from investments and loans and advances, banks deployed deposits in the form of cash and balances with the Reserve Bank and various money market instruments. V.9 With the persisting deceleration in credit and the sizeable influx of deposits post-demonetisation, the credit-deposit (C-D) ratio of banks, on an outstanding basis, sharply declined to 73.0 per cent as at end-March 2017 from 78.2 per cent in the previous year (Chart V.4). The decline in credit turned PSBs and FBs’ incremental C-D ratios negative.
| Table V.3: Public Issues by the Banking Sector | | (Amount in ₹ billion) | | Year | Public Sector Banks | Private Sector Banks | Total | Grand Total | | Equity | Debt | Equity | Debt | Equity | Debt | | 1 | 2 | 3 | 4 | 5 | 6 | 7 | 8=(6+7) | | 2015-16 | - | - | - | - | - | - | - | | 2016-17 | 11 | - | 25 | - | 36 | - | 36 | Note: -: Nil / negligible.
Source: SEBI. | Resources Raised by Banks through Public Issues and Private Placement V.10 Banks raised resources mostly through private placements to augment their resources required for provisioning, while public issues were negligible. The higher number of private placements during 2016-17 also reflected banks’ capital planning efforts to meet the gradual implementation of Basel III capital requirements and to mitigate any concerns about potential stress on their asset quality (Table V.3 and V.4). SCBs’ International Liabilities and Assets in 2016-17 V.11 During 2016-17, international liabilities and assets of banks located in India underwent contraction with the ratio of international claims to liabilities declining to 48.5 per cent from 54.1 per cent a year ago. The decline in banks’ international claims in the form of outstanding export bills, nostro balances and foreign currency loans to residents exceeded the fall in banks’ international liabilities on account of redemptions of Foreign Currency Non-resident (Bank) [FCNR (B)] deposits and decline in foreign currency borrowings (Table V.5 and V.6). | Table V.4: Resources Raised by Banks through Private Placements | | (Amount in ₹ billion) | | Year | 2015-16 | 2016-17 P | | Category | No. of Issues | Amount Raised | No. of Issues | Amount Raised | | 1 | 2 | 3 | 4 | 5 | | Public Sector Banks | 22 | 252 | 48 | 466 | | Private Sector Banks | 13 | 165 | 18 | 430 | | Total | 35 | 417 | 66 | 896 | Note: P: Provisional.
Source: BSE, NSE and Merchant Bankers. |
| Table V.5: International Assets of Banks in India – By Type of Instruments | | (Based on LBS Statements) | | (Amount in ₹ billion) | | Asset Type | Amount Outstanding
(as at end-March) P | Percentage Variation | | 2016 | 2017 | 2015-16 | 2016-17 | | 1. Loans and Deposits | 6570 | 5472 | 51.9 | -16.7 | | | (98.5) | (98.0) | | | | of which: | | | | | | a) Loans to Non-Residents* | 1077 | 1668 | 318.0 | 54.9 | | | (16.2) | (29.9) | | | | b) Foreign Currency Loans to Residents** | 1683 | 1546 | -15.7 | -8.1 | | | (25.2) | (27.7) | | | | c) Outstanding Export Bills | 1977 | 855 | 123.3 | -56.8 | | | (29.7) | (15.3) | | | | d) Foreign Currency in Hand, Travellers Cheques, etc. | 0.4 | 3.5 | -96.1 | 743.3 | | | (0.0) | (0.1) | | | | e) Nostro Balances @ | 1832 | 1399 | 55.8 | -23.6 | | | (27.5) | (25.1) | | | | 2. Holdings of Debt Securities | 61 | 66 | 157.8 | 8.8 | | | (0.9) | (1.2) | | | | 3. Other Assets @@ | 37 | 47 | -76.3 | 29.1 | | | (0.6) | (0.9) | | | | Total International Assets | 6667 | 5586 | 48.0 | -16.2 | | | (100) | (100) | | | Notes: 1. P: Provisional.
2. *: Includes Rupee loans and foreign currency (FC) loans out of non-resident deposits.
3. **: Includes loans out of FCNR (B) deposits, pre-shipment credit in foreign currency (PCFC), FC lending to and FC deposits with banks in India, etc.
4. @: Includes placements made abroad and balances in termdeposits with non-resident banks.
5. @@: Capital supplied to and receivable profits from foreign branches/ subsidiaries of Indian banks and other unclassified international assets.
6. Figures in parentheses are percentages to total.
7. Percentage variation could be slightly different as absolute numbers have been rounded off to ₹ billion.
Source: International Banking Statistics, RBI. | V.12 Liabilities due to accretions of non-resident external (NRE) rupee accounts increased further due to attractive interest rate differentials vis-a-vis source countries (Table V.6). | Table V.6: International Liabilities of Banks in India – By Type of Instruments | | (Based on LBS Statements) | | (Amount in ₹ billion) | | Liability Type | Amount Outstanding
(as at end-March P) | Percentage Variation | | 2016 | 2017 | 2015- 16 | 2016-17 | | 1. Deposits and Loans | 9860 | 9027 | 17.1 | -8.5 | | (80.0) | (78.4) | | | | a) Foreign Currency Non- resident (Bank) [FCNR (B)] Scheme | 2674 | 1343 | 8.5 | -49.8 | | (21.7) | (11.7) | | | | b) Foreign Currency Borrowings* | 1610 | 1229.5 | 14.0 | -23.6 | | (13.1) | (10.7) | | | | c) Non-resident External Rupee (NRE) Accounts | 4045 | 5100 | 15.0 | 26.1 | | (32.8) | (44.3) | | | | d) Non-resident Ordinary (NRO) Rupee Accounts | 598 | 674 | 19.8 | 12.7 | | (4.9) | (5.9) | | | | 2. Own Issues of Securities / Bonds | 73 | 78 | 6.1 | 6.8 | | (0.6) | (0.7) | | | | 3. Other Liabilities | 2392 | 2410 | -1.7 | 0.8 | | | (19.4) | (20.9) | | | | of which: | | | | | | a) ADRs / GDRs | 349 | 415 | -36.3 | 18.9 | | | (2.8) | (3.6) | | | | b) Equities of Banks Held by Non-residents | 904 | 974 | -33.7 | 7.8 | | (7.3) | (8.5) | | | | c) Capital / Remittable Profits of Foreign Banks in India and Other Unclassified International Liabilities | 1140 | 1021 | 118.0 | -10.4 | | (9.2) | (8.9) | | | | Total International Liabilities | 12325 | 11515 | 12.8 | -6.6 | | | (100.0) | (100.0) | | | Notes: 1. P: Provisional.
2. *: Inter-bank borrowings in India and from abroad and external commercial borrowings of banks.
3. Figures in parentheses are percentages to total.
4. Percentage variation could be slightly different as absolute numbers have been rounded off to ₹ billion.
Source: International Banking Statistics, RBI. | V.13 As regards the maturity pattern of total consolidated international claims of Indian banks, there was a significant increase in claims of longer-term maturities. Sectoral shifts towards the official sector and away from banks and non-financial private sector entities reflected low absorptive capacity in the corporate sector in the face of subdued demand conditions in the economy (Table V.7). | Table V.7: Maturity (Residual) and Sectoral Classification of Consolidated International Claims of Banks | | (Amount in ₹ billion) | | Residual Maturity / Sector | Amount Outstanding
(as at end-March) P | Percentage Variation | | 2016 | 2017 | 2015-16 | 2016-17 | | Total Consolidated International Claims | 5774 | 7168 | 42.5 | 24.2 | | | (100.0) | (100.0) | | | | a) Maturity-wise | | | | | | 1. Short-term (residual maturity of less than one year) | 4425 | 4529 | 71.9 | 2.3 | | | (76.6) | (63.2) | | | | 2. Long-term (residual maturity of one year and above) | 1308 | 2605 | -9.0 | 99.1 | | | (22.7) | (36.3) | | | | 3. Unallocated | 40 | 34 | -2.5 | -15.1 | | | (0.7) | (0.5) | | | | b) Sector-wise | | | | | | 1. Banks | 1784 | 1841 | 5.6 | 3.2 | | | (30.9) | (25.7) | | | | 2. Official Sector | 89 | 657 | 198.4 | 638.8 | | | (1.5) | (9.2) | | | | 3. Non-Bank Financial Institutions | 160 | 3 | | | | | (2.8) | - | | | | 4. Non-Financial Private | 3442 | 3880 | 60.0 | 12.7 | | | (59.6) | (54.1) | | | | 5. Others | 299 | 787 | 64.3 | 163.2 | | | (5.2) | (11.0) | | | Notes : 1. P: Provisional.
2. - : Nil/negligible.
3. Figures in parentheses are percentages to total.
4. The sum of components may not add up due to rounding-off.
5. Residual Maturity Unallocated comprises maturity not applicable (for example, for equities) and maturity information not available.
6. The official sector includes official monetary authorities, general government and multilateral agencies.
7. Non-financial private sector includes non-financial corporations and households including non-profit institutions serving households (NPISHs).
8. Others include non-financial public sector undertakings and the unallocated sector.
9. Percentage variation could be slightly different as absolute numbers have been rounded off to ₹ billion.
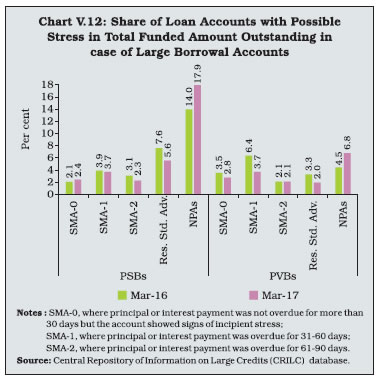
Source : Based on BIS’ consolidated banking statistics (CBS) statements – immediate country risk basis. | V.14 There was also a shift towards the US fromcountries such as Germany, Hong Kong and the UK in the consolidated international claims ofbanks on countries other than India (Table V.8). | Table V.8: Consolidated International Claims of Banks on Countries other than India | | (Amount in ₹ billion) | | Country | Amount Outstanding P | Percentage Variation | | 2016 | 2017 | 2015-16 | 2016-17 | | 1 | 2 | 3 | 4 | 5 | | Total Consolidated International Claims | 5,774 | 7,168 | 42.5 | 24.2 | | | (100.0) | (100.0) | | | | Of which | | | | | | 1. United States of America | 959 | 1,870 | 5.7 | 95.0 | | | (16.6) | (26.1) | | | | 2. United Kingdom | 434 | 427 | 8.8 | -1.8 | | | (7.5) | (6.0) | | | | 3. Hong Kong | 454 | 397 | 44.8 | -12.5 | | | (7.9) | (5.5) | | | | 4. Singapore | 336 | 404 | -12.2 | 20.1 | | | (5.8) | (5.6) | | | | 5. United Arab Emirates | 833 | 889 | 98.8 | 6.8 | | | (14.4) | (12.4) | | | | 6. Germany | 220 | 121 | 112.0 | -44.9 | | | (3.8) | (1.7) | | | Notes : 1. P: Provisional.
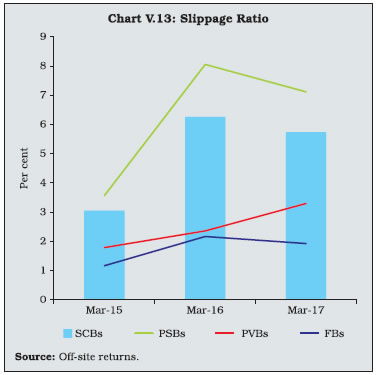
2. Figures in parentheses are percentages to total.
3. Percentage variation could be slightly different as absolute numbers have been rounded off to ₹ billion.
Source : Based on BIS’ consolidated banking statistics (CBS) statements – immediate country risk basis. | Maturity Profile of Assets and Liabilities V.15 Banks face rollover risks with respect to their short-term liabilities and consequent liquidity stress. However, during 2016-17, the share of short-term liabilities came down driven by a sharp decline in short-term borrowings attributed to withdrawal of SBNs resulting in larger cash reserves with banks. There was an increase in loans and advances of more than five years which pulled up the share of long-term assets and accordingly, the proportion of long-term assets financed by short-term liabilities increased over the previous year (Chart V.5; Table V.9). 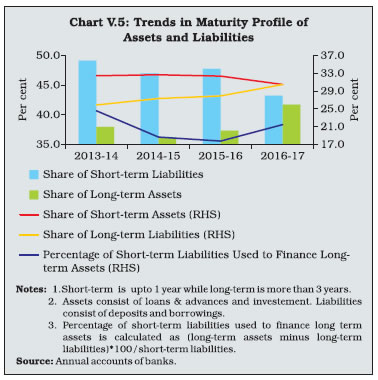
| Table V.9: Bank Group-wise Maturity Profile of Select Liabilities / Assets | | (As at end-March) | | (Per cent to total under each item) | | Liabilities/Assets | PSBs | PVBs | FBs | All SCBs | | 2016 | 2017 | 2016 | 2017 | 2016 | 2017 | 2016 | 2017 | | 1 | 2 | 3 | 4 | 5 | 6 | 7 | 8 | 9 | | I. Deposits | | | | | | | | | | a) Up to 1 year | 46.5 | 41.6 | 42.6 | 41.5 | 66.3 | 63.0 | 46.5 | 42.5 | | b) Over 1 year and up to 3 years | 25.6 | 27.9 | 25.0 | 26.0 | 26.2 | 28.9 | 25.5 | 27.5 | | c) Over 3 years and up to 5 years | 7.7 | 8.6 | 10.9 | 10.5 | 7.3 | 8.0 | 8.3 | 9.0 | | d) Over 5 years | 20.3 | 21.9 | 21.6 | 21.9 | 0.1 | 0.1 | 19.6 | 21.0 | | II. Borrowings | | | | | | | | | | a) Up to 1 year | 56.6 | 49.9 | 50.4 | 43.9 | 89.7 | 84.7 | 57.2 | 49.5 | | b) Over 1 year and up to 3 years | 12.4 | 12.9 | 20.1 | 19.3 | 7.4 | 11.8 | 14.8 | 15.4 | | c) Over 3 years and up to 5 years | 9.7 | 10.4 | 12.3 | 13.1 | 1.8 | 1.2 | 10.0 | 10.9 | | d) Over 5 years | 21.3 | 26.8 | 17.2 | 23.7 | 1.1 | 2.3 | 18.0 | 24.2 | | III. Loans and Advances | | | | | | | | | | a) Up to 1 year | 30.7 | 28.3 | 32.8 | 32.5 | 67.0 | 62.5 | 32.9 | 30.9 | | b) Over 1 year and up to 3 years | 38.2 | 34.3 | 35.3 | 33.8 | 18.8 | 18.4 | 36.6 | 33.5 | | c) Over 3 years and up to 5 years | 11.8 | 10.6 | 12.0 | 12.8 | 4.3 | 8.0 | 11.5 | 11.1 | | d) Over 5 years | 19.3 | 26.9 | 19.9 | 20.8 | 9.9 | 11.2 | 19.0 | 24.6 | | IV. Investment | | | | | | | | | | a) Up to 1 year | 17.3 | 19.8 | 53.3 | 46.9 | 83.8 | 73.9 | 31.2 | 29.7 | | b) Over 1 year and up to 3 years | 17.3 | 14.1 | 14.5 | 16.8 | 8.7 | 17.4 | 15.9 | 15.0 | | c) Over 3 years and up to 5 years | 12.1 | 11.8 | 8.3 | 8.5 | 1.4 | 5.7 | 10.3 | 10.6 | | d) Over 5 years | 53.3 | 54.3 | 23.9 | 27.8 | 6.2 | 3.0 | 42.5 | 44.7 | Notes: 1. The sum of components may not add upto 100 due to rounding-off.
2. #: Includes data relating to Capital Small Finance Bank Ltd. and Equitas Small Finance Bank Ltd. which were included in the Second Schedule to the Reserve Bank of India Act, 1934 with effect from November 8, 2016 and December 23, 2016, respectively.
Source: Balance sheets of respective banks. |
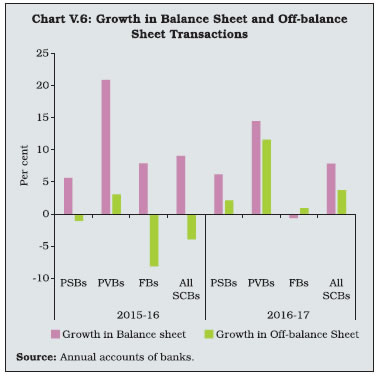 V.16 A similar pattern was observed across bank groups as well. SCBs’ Off-balance Sheet Operations V.17 Off-balance sheet transactions play a significant role in hedging the risks associated with long-term financial assets on banks’ balance sheets and in improving profitability, especially in the context of tepid credit growth. During 2016-17, off-balance sheet activities expanded across all bank groups. Forward exchange contracts (including interest rate swaps) occupied more than 85 per cent share in banks’ total off-balance sheet operations (Chart V.6 & V.7; Appendix Table V.2). V.18 FBs recorded the lowest growth, although they constituted almost half of the total off-balance sheet operations of banks. III. Financial Performance of Scheduled Commercial Banks V.19 SCBs’ total income increased marginally in 2016-17 mainly driven by non-interest income. Interest income growth was restrained by subdued credit growth and increase in NPAs. On the expenditure side, the interest expended also experienced negligible growth due to the surge in low cost funding from CASA deposits on account of demonetisation and the slower pace of transmission of policy rate cuts to lending rates vis-a-vis deposit rates. The lower increase in net interest income vis-à-vis a year ago resulted in a marginal decline in banks’ net interest margin (NIM), although with the introduction of the Marginal Cost of Funds based Lending Rate (MCLR) since April 2016 banks appear to have tweaked their spreads over the MCLR in order to maintain their NIM (Table V.10). | Table V.10 : Trends in Income and Expenditure of Scheduled Commercial Banks | | (Amount in ₹ billion) | | Item | 2015-16 | 2016-17# | | Amount | Percentage Variation | Amount | Percentage Variation | | 1. Income | 11,350 | 5.8 | 12,053 | 6.2 | | a) Interest Income | 9,909 | 5.3 | 10,120 | 2.1 | | b) Other Income | 1,441 | 8.8 | 1,933 | 34.1 | | 2. Expenditure | 11,009 | 11.9 | 11,614 | 5.5 | | a) Interest Expended | 6,661 | 4.6 | 6,692 | 0.5 | | b) Operating Expenses | 2,254 | 11.2 | 2,485 | 10.2 | | Of which : Wage Bill | 1,195 | 8.3 | 1,275 | 6.7 | | c) Provisions and Contingencies | 2,094 | 45.2 | 2,437 | 16.4 | | 3. Operating Profit | 2,436 | 4.4 | 2,876 | 18.1 | | 4. Net Profit | 341 | -61.7 | 439 | 28.6 | | 5. Net Interest Income (NII) (1a-2a) | 3,249 | 7.0 | 3,428 | 5.5 | | Net Interest Margin (NII as percentage of average assets) | 2.6 | | 2.5 | | Notes: 1. #: Includes data relating to Capital Small Finance Bank Ltd. and Equitas Small Finance Bank Ltd. which were included in the Second Schedule to the Reserve Bank of India Act, 1934 with effect from November 8, 2016 and December 23, 2016, respectively.
2. Percentage variations could be slightly different as absolute numbers have been rounded off to ₹ billion.
Source: Annual accounts of respective banks. | V.20 Operating expenses slowed down on account of rationalisation of branches and manpower which, in turn, resulted in an improvement in banks’ operating profits. Provisions and contingencies eased in relation to the high base of the previous year although they remained elevated in view of the sustained stress on the asset quality and the implementation of Asset Quality Review (AQR) by the Reserve Bank, which resulted in improved recognition of NPAs. The sharp increase in banks’ net profits in 2016- 17 needs to be viewed in the context of a low base in 2015-16 when the net profits had declined precipitously owing to sizeable provisioning requirement (Table V.10). V.21 Bank group-wise, PSBs continued to record net losses during 2016-17 although they moderated in relation to a year ago. The State Bank Group incurred losses in contrast to net profits a year ago whereas nationalised banks reduced their losses year-on-year. PVBs posted a muted increase in profits, resulting in a decline in return on assets (RoA). Concurrently, their return on equity (RoE), which reflects a bank’s efficiency in churning profits from every unit of equity, also declined. In contrast, FBs improved their RoA and RoE over the previous year (Table V.11). | Table V.11: Return on Assets and Return on Equity of SCBs – Bank Group-wise | | (Per cent) | | Bank group | Return on Assets | Return on Equity | | 2015-16 | 2016-17 | 2015-16 | 2016-17 | | Public Sector Banks | -0.07 | -0.10 | -3.47 | -2.05 | | Private Sector Banks | 1.50 | 1.30 | 13.81 | 11.87 | | Foreign Banks | 1.45 | 1.62 | 8.0 | 9.11 | | All SCBs | 0.40 | 0.35 | 3.58 | 4.16 | Notes: Return on assets = Return on assets for the bank groups are obtained as weighted average of return on assets of individual banks in the group, weights being the proportion of total assets of the bank as percentage to total assets of all banks in the corresponding bank group.
Return on equity = Net profit / Average total equity.
Source: Annual accounts of banks. | V.22 The spread – the difference between returns and cost of funds – which is a measure of banks’ operational efficiency remained around the same level as the previous year. PVBs posted an improvement in spread as against PSBs and FBs, which reported lower spreads in relation to the previous year (Table V.12). IV. Soundness Indicators Capital Adequacy V.23 The progressive implementation of Basel III capital requirements has provided an impetus for the banking system as a whole to scale up capital to risk-weighted assets ratio (CRAR). Consequently, all categories of banks in India remained well above the requirement of 10.25 per cent (including the capital conservation buffer (CCB) for March 2017 and 11.5 per cent for end- March 2019 when Basel III will be fully operational (Chart V.8). | Table V.12: Cost of Funds and Return on Funds – Bank Group-wise | | (Per cent) | | Bank Group/ Year | Cost of Deposits | Cost of Borrowings | Cost of Funds | Return on Advances | Return on Investments | Return on Funds | Spread | | 1 | 2 | 3 | 4 | 5 | 6 | 7 | 8 | 9 = 8-5 | | PSBs | 2015-16 | 6.19 | 5.27 | 6.11 | 9.02 | 7.80 | 8.68 | 2.57 | | | 2016-17 | 5.70 | 4.80 | 5.62 | 8.44 | 7.49 | 8.15 | 2.53 | | PVBs | 2015-16 | 6.08 | 6.27 | 6.11 | 10.46 | 7.49 | 9.59 | 3.48 | | | 2016-17 | 5.59 | 6.56 | 5.76 | 9.99 | 7.49 | 9.28 | 3.52 | | FBs | 2015-16 | 4.46 | 4.00 | 4.36 | 8.95 | 7.28 | 8.22 | 3.86 | | | 2016-17 | 4.24 | 4.25 | 4.24 | 8.77 | 6.89 | 7.97 | 3.73 | | All SCBs | 2015-16 | 6.09 | 5.50 | 6.02 | 9.35 | 7.68 | 8.87 | 2.85 | | | 2016-17 | 5.61 | 5.44 | 5.59 | 8.86 | 7.45 | 8.43 | 2.84 | Notes: 1. Cost of deposits = Interest paid on deposits/Average of current and previous year’s deposits.
2. Cost of borrowings = (Interest expended – Interest on deposits)/Average of current and previous year’s borrowings.
3. Cost of funds = Interest expended /(Average of current and previous year’s deposits plus borrowings)
4. Return on advances = Interest earned on advances /Average of current and previous year’s advances.
5. Return on investments = Interest earned on investments /Average of current and previous year’s investments.
6. Return on funds = (Interest earned on advances + Interest earned on investments) / (Average of current and previous year’s advances plus investments).
7. Data for 2017 include small finance banks.
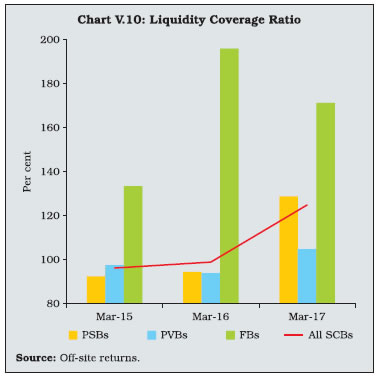
Source: Calculated from balance sheets of respective banks. | V.24 Even Tier I ratios were well above the minimum requirement of 7 per cent (Table V.13). Among the bank groups, PSBs had the lowest CRAR although improvement is becoming evident in recent years. PVBs have consistently maintained higher CRAR. Overall, the banks have intensified efforts to strengthen their capital positions by raising capital through various instruments from the market, intermittent capital infusion by the Government and modification in treatment of certain balance sheet items in order to align with Basel Committee on Banking Supervision (BCBS) guidelines. In this direction, Government’s Indradhanush plan of August 2015 and its announcement of further recapitalisation of PSBs in October 2017 is expected to significantly improve the capital position of PSBs. 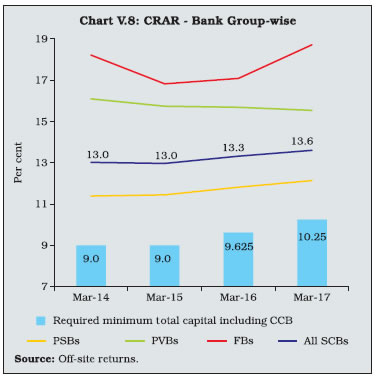 V.25 PSBs were allowed to raise capital from the markets through Follow-on Public Offers (FPOs) or Qualified Institutional Placement (QIP) in August 2016 by diluting the Government’s holding up to 52 per cent in a phased manner based on capital requirements, stock performance, liquidity and market conditions. Further, in order to create strong and competitive banks, Government has given in-principle approval for PSBs to amalgamate through an Alternative Mechanism2. Any such proposal would be solely based on commercial considerations and will need to originate from the boards of respective banks. | Table V.13: Component-wise Capital Adequacy of SCBs | | (As at end-March) | | (Amount in ₹ billion) | | | PSBs | PVBs | FBs | SCBs | | 2016 | 2017 | 2016 | 2017 | 2016 | 2017 | 2016 | 2017 | | 1. Capital Funds | 6,647 | 7,047 | 3,705 | 4,239 | 1,296 | 1,184 | 11,647 | 12,470 | | i) Tier I Capital | 5,138 | 5,480 | 3,109 | 3,643 | 1,208 | 1,110 | 9,455 | 10,233 | | ii) Tier II Capital | 1,509 | 1,567 | 596 | 596 | 88 | 74 | 2,192 | 2,237 | | 2. Risk Weighted Assets | 56,260 | 58,053 | 23,622 | 27,289 | 7,584 | 6,328 | 87,466 | 91,671 | | 3. CRAR (1 as % of 2) | 11.8 | 12.1 | 15.7 | 15.5 | 17.1 | 18.7 | 13.3 | 13.6 | | Of which: Tier I | 9.1 | 9.4 | 13.2 | 13.3 | 15.9 | 17.5 | 10.8 | 11.2 | | Tier II | 2.7 | 2.7 | 2.5 | 2.2 | 1.2 | 1.2 | 2.5 | 2.4 | | Source: Off-site returns. | Leverage Ratio V.26 Leverage ratio is being maintained by Indian banks with effect from April 1, 2015 as a supplement to risk-based capital ratios to constrain the build-up of leverage and avoid destabilising deleveraging. Defined as the ratio of Tier I capital to total exposure (including on-balance sheet exposures, derivative exposures, securities financing transaction exposures and off-balance sheet items), the leverage ratio showed an improvement for the banking system as a whole in 2016-17, although PSBs were placed much below other bank-groups (Chart V.9). In view of testing of a minimum Tier I leverage ratio of 3 per cent by the BCBS till 2017, the Reserve Bank has been monitoring individual banks against an indicative leverage ratio of 4.5 per cent. Liquidity Coverage Ratio V.27 The liquidity coverage ratio (LCR) is intended to build banks’ short-term resilience to potential liquidity disruptions. LCR requires the banks to have adequate high quality liquid assets (HQLAs) to withstand a 30-day liquidity shock – net cash outflows in a severe stress scenario. Implementation of the LCR was phased in by the Reserve Bank at 60 per cent from January 1, 2015 to reach 100 per cent on January 1, 2019. The LCR is a more sophisticated tool than the statutory liquidity ratio (SLR) for liquidity risk management, since it takes into account the liquidity profile of both assets and liabilities. Furthermore, the LCR does not impound funds of banks for lending beyond what is necessary to maintain adequate liquidity on an on-going basis. Moreover, as the LCR includes securities apart from G-secs, it is expected to give a fillip to other market segments, especially the corporate bond market. Currently, banks have to comply with both SLR and LCR regulations, but the SLR is being gradually brought down to facilitate a smooth transition to LCR reaching 100 per cent by January 1, 2019. At present, a total carve-out from the SLR is 11 per cent of banks’ net demand and time liabilities (NDTL) that is available for consideration for LCR. During 2016-17, banks significantly improved their LCR position and each bank-group was able to maintain LCR above 100 per cent, with the PSBs’ LCR being much higher than that of PVBs (Chart V.10). 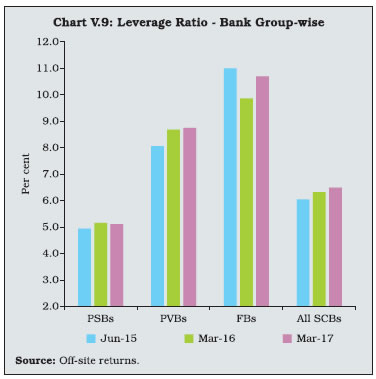
 Net Stable Funding Ratio V.28 The net stable funding ratio (NSFR) strengthens resilience over a longer-term time horizon than the LCR as it requires banks to fund their activities with stable sources of funding on an ongoing basis. The NSFR seeks to discourage banks from relying on short-term wholesale funding thereby promoting funding stability and encouraging better assessment of funding risk across all on- and off-balance sheet items. As per the Basel III requirement, NSFR is the ratio of available stable funding relative to the amount of required stable funding. Available stable funding is defined as the portion of capital and liabilities expected to be reliable over the time horizon considered by the NSFR, which extends to one year. The NSFR has not been phased in so far but banks will be required to maintain NSFR of at least 100 per cent on an ongoing basis, which is planned to be implemented in 2018. Non-performing Assets V.29 The asset quality of banks deteriorated further during the year with the gross non-performing assets (GNPA) ratio reaching 9.3 per cent of total advances. PSBs’ GNPA ratio rose to 11.7 per cent by March 2017. Although much lower for PVBs, their GNPA ratio rose sharply during the year. FBs showed marginal improvement in asset quality. The net NPA ratio, which is an indicator of the quality of the loan book as it is adjusted for provisions, rose to more than 5 per cent (Table V.14). V.30 A deterioration in the asset quality of banks adversely impacts their lending capacity with downside risks to overall macroeconomic conditions (Box V.1). | Table V.14: Trends in Non-performing Assets – Bank Group-wise | | (Amount in ₹ billion) | | Item | PSBs* | PVBs | FBs | All SCBs# | | Gross NPAs | | | | | | Closing Balance for 2015-16 | 5,400 | 562 | 158 | 6,119 | | Opening Balance for 2016-17 | 5,400 | 562 | 158 | 6,120^ | | Addition during the year 2016-17 | 3,275 | 814 | 66 | 4,157 | | Recovered during the year 2016-17 | 1,000 | 237 | 36 | 1,274 | | Written-off during the year 2016-17 | 827 | 207 | 51 | 1,085 | | Closing Balance for 2016-17 | 6,847 | 932 | 136 | 7,918 | | Gross NPAs as per cent of Gross Advances** | | 2015-16 | 9.3 | 2.8 | 4.2 | 7.5 | | 2016-17 | 11.7 | 4.1 | 4.0 | 9.3 | | Net NPAs | | | | | | Closing Balance for 2015-16 | 3,204 | 267 | 28 | 3,498 | | Closing Balance for 2016-17 | 3,831 | 478 | 21 | 4,331 | | Net NPAs as per cent of Net Advances | | | | | | 2015-16 | 5.7 | 1.4 | 0.8 | 4.4 | | 2016-17 | 6.9 | 2.2 | 0.6 | 5.3 | Notes: 1. * : Includes IDBI Bank Ltd. and Bharatiya Mahila Bank.
2. # : Includes data relating to Capital Small Finance Bank Ltd. and Equitas Small Finance Bank Ltd., which were included in the Second Schedule to the Reserve Bank of India Act, 1934 with effect from November 8, 2016 and December 23, 2016, respectively.
3. ^ : Opening balance for 2016-17 is different from closing balance for 2015-16 due to inclusion of two small finance banks in 2016-17.
4. ** : Calculated taking gross NPAs from annual accounts of respective banks and gross advances from off-site returns.
Source: Annual accounts of banks and off-site returns. |
Box V.1: NPAs and Credit Cycles in India – Priority versus Non-Priority Sectors The evolution of NPAs tends to be pro-cyclical albeit with a lag. When NPA ratios rise above a certain threshold, they have a negative impact on banks’ willingness to lend indicative of non-linearities and reverse causality also at work (Tracey, 2011; Cucinelli, 2015). It is observed in the Indian banking system that while credit growth on the aggregate positively affects the NPA ratio in the Indian economy (Chavan and Gambacorta, 2016), there are bi-directional effects as well. The NPA ratio has a negative contemporaneous effect on overall credit growth (RBI, 2017). These system-level relationships are investigated at a segment-specific level, that is, across the priority and non-priority sectors in view of observed differences in the levels of NPAs and credit growth as well as in access to alternative sources of finance in the two sectors. Quarterly data on year-on-year (y-o-y) credit and NPA growth for both priority and non-priority sectors from March 2002 to June 2017 was filtered to extract deviations from the trend in the form of growth cycles. A visual observation of the y-o-y growth in NPAs and credit in the priority sector suggests that they generally moved in opposite directions. The only exception being a close co-movement with more than characteristic volatility for an intermediate period between December 2011 and June 2014 (Chart 1A). In the non-priority sector, movement in opposite directions was generally observed (Chart 1B). For the priority sector, Granger causality at a lag length (5) optimised through the AIC, LR and HQ criteria in a VAR framework indicated bi-directional causality between these two cycles.3 NPA growth cycles affected credit growth cycles negatively and significantly with a lag of four quarters while credit growth cycles positively and significantly affected NPA growth cycles with a lag of one quarter. Agriculture forms a substantial part of priority sector lending. The bulk of agricultural credit is primarily disbursed before the four-quarter long agricultural crop year while repayment of credit is due after the harvest following each cropping season which are of a shorter term by nature. These lags then seem intuitively plausible. 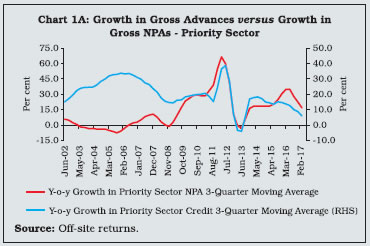
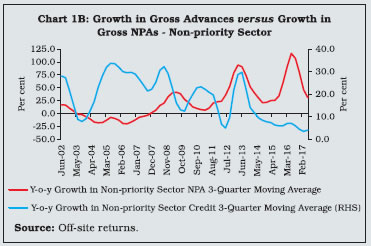 For the non-priority sector, Granger causality at an optimal lag length of 6 indicated a bi-directional causality between the credit growth cycle and the NPA growth cycle. Cross-correlation coefficients showed that the credit growth cycle and the NPA growth cycle in the non-priority sector were positively and significantly correlated with a lag of 16 quarters. The long gestation period of infrastructural and core industrial projects covered under the non-priority sector could explain the longer lag in this sector. However, the NPA growth cycle negatively affected the credit growth cycle after about just one quarter. Banks responded to the stress on their balance sheets by curtailing the supply of credit to the sector. To conclude, the effects of credit growth on NPA growth played out, as expected, in both priority and non-priority sectors in line with the sector-specific characteristics. On the other hand, growing credit risk in the non-priority sector evoked a more prompt contraction in credit growth to that sector as compared to the characteristic lag in the impact of credit risk on bank lending in the priority sector. For some time now, the non-priority sector has contributed more to the weakening quality of assets on the bank balance sheets than the priority sector. Hence, it is not surprising that a reduction in lending activities in the non-priority sector followed soon after sharp increases in the NPA growth cycle in the sector. References Chavan, P. and L. Gambacorta (2016), “Bank Lending and Loan Quality – The Case of India”, BIS Working Paper no. 595. Cucinelli, D. (2015), “The Impact of Non-performing Loans on Bank Lending Behaviour: Evidence from the Italian Banking Sector”, Eurasian Journal of Business and Economics, Vol. 8, pp. 59-71. RBI (2017), “Monetary Policy Report”, April, Mumbai. Tracey, M. (2011), “The Impact of Non-performing Loans on Loan Growth: An Econometric Case Study of Jamaica and Trinidad and Tobago”, Financial Stability Department, Bank of Jamaica. |
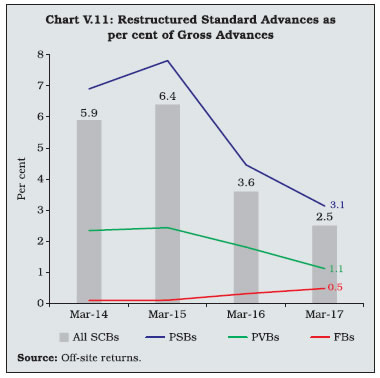 V.31 Following the AQR in July 2015, the asset quality of banks deteriorated sharply. Accounts identified as NPAs in the list of one bank led to loan facilities extended to the same borrower by other banks being identified as NPAs too. The withdrawal of regulatory forbearance on restructured advances since April 1, 2015 also contributed to a steady shift of restructured standard advances into NPAs (Chart V.11). V.32 The share of doubtful and loss assets in total loan assets of PSBs and PVBs increased during 2016-17, indicating an increase in the stickiness of NPAs. In the case of PSBs, the pace of loans slipping into the sub-standard asset category declined in the last quarter of the year (Table V.15). V.33 Large borrowers who have an exposure of ₹50 million or more accounted for about 86.5 per cent of all NPAs, while their share in total advances was 56 per cent by end-March 2017. All large borrowal loan accounts with any sign of stress (including special mention account-0 (SMA-0), SMA-1, SMA-2, NPAs and restructured loans) accounted for about 32 per cent of the total funded amount outstanding of PSBs as against 17.4 per cent in the case of PVBs. This suggests persisting stress on the asset quality of the banking system (Chart V.12). V.34 This is corroborated by the high slippage ratio – the ratio of fresh NPAs to standard advances at the beginning of the year – of the banking system albeit with some improvement over the previous year. Among bank groups, the slippage ratio of PSBs declined while that of PVBs firmed up during 2016-17 (Chart V.13). V.35 Sector-wise, more than three-fourth of the delinquent loans were concentrated in the non-priority sector with industries recording the highest level of NPAs, followed by the infrastructure sector (Table V.16). | Table V.15: Classification of Loan Assets – Bank Group-wise | | (As at end-March) | | (Amount in ₹ billion) | | Bank Group | Year | Standard Assets | Sub-Standard Assets | Doubtful Assets | Loss Assets | | Amount | Per cent* | Amount | Per cent* | Amount | Per cent* | Amount | Per cent* | | PSBs# | 2016 | 52,875 | 90.7 | 2,005 | 3.4 | 3,232 | 5.5 | 163 | 0.3 | | | 2017 | 51,816 | 88.3 | 1,731 | 3.0 | 4,904 | 8.4 | 213 | 0.4 | | PVBs | 2016 | 19,184 | 97.2 | 186 | 0.9 | 311 | 1.6 | 62 | 0.3 | | | 2017 | 21,748 | 95.9 | 310 | 1.4 | 519 | 2.3 | 90 | 0.4 | | FBs | 2016 | 3,606 | 95.8 | 62 | 1.6 | 60 | 1.6 | 36 | 0.9 | | | 2017 | 3,304 | 96.0 | 40 | 1.2 | 83 | 2.4 | 14 | 0.4 | | All SCBs | 2016 | 75,666 | 92.5 | 2,252 | 2.8 | 3,603 | 4.4 | 260 | 0.3 | | | 2017 | 76,868 | 90.7 | 2,081 | 2.5 | 5,505 | 6.5 | 316 | 0.4 | Notes: 1. Constituent items may not add up to the total due to rounding-off.
2. *: As per cent to gross advances.
3. #: Includes IDBI Bank Ltd. and Bharatiya Mahila Bank.
Source: Off-site returns. |
 V.36 Within industries, basic metals and products had the highest level of stress (GNPAs plus restructured standard advances). Other industrial sectors with elevated levels of stress were vehicle and transport equipment, cement, construction, textiles and engineering. In general, PSBs’ exposure to industries in stress was much higher as compared to that of PVBs (Chart V.14). | Table V.16: Sector-wise NPAs of Banks | | (As at end-March) | | (Amount in ₹ billion) | | Bank Group | Priority Sector | Of which | Non-priority Sector | Total NPAs | | Agriculture | Micro and Small Enterprises | Others | | Amt. | Per cent# | Amt. | Per cent# | Amt. | Per cent# | Amt. | Per cent# | Amt. | Per cent# | Amt. | Per cent# | | PSBs* | | | | | | | | | | | | | | 2016 | 1,281 | 25.5 | 448 | 8.9 | 658 | 13.1 | 175 | 3.5 | 3,740 | 74.5 | 5,021 | 100.0 | | 2017 | 1,543 | 24.1 | 548 | 8.5 | 757 | 11.8 | 238 | 3.7 | 4,868 | 75.9 | 6,411 | 100.0 | | PVBs | | | | | | | | | | | | | | 2016 | 101 | 21.0 | 40 | 8.2 | 47 | 9.6 | 15 | 3.1 | 382 | 79.0 | 484 | 100.0 | | 2017 | 133 | 18.0 | 53 | 7.2 | 64 | 8.7 | 16 | 2.2 | 605 | 82.0 | 738 | 100.0 | | FBs | | | | | | | | | | | | | | 2016 | 23 | 14.3 | 0.4 | 0.3 | 4 | 2.3 | 19 | 11.7 | 135 | 85.7 | 158 | 100.0 | | 2017 | 24 | 17.8 | 1 | 0.5 | 4 | 3.1 | 19 | 14.2 | 112 | 82.2 | 136 | 100.0 | | All SCBs | | | | | | | | | | | | | | 2016 | 1,405 | 24.8 | 488 | 8.6 | 708 | 12.5 | 208 | 3.7 | 4,257 | 75.2 | 5,662 | 100.0 | | 2017 | 1,700 | 23.3 | 602 | 8.3 | 825 | 11.3 | 273 | 3.7 | 5,585 | 76.7 | 7,285 | 100.0 | Notes: 1. Amt.: – Amount.
2. #: Share in total NPAs.
3. *: Includes IDBI Bank Ltd and Bhartiya Mahila bank.
4. Constituent items may not add up to the total due to rounding off.
Source: Off-site returns. | V.37 Micro and small enterprises (MSEs) NPAs rose to reach 8.4 per cent in March 2017 while retail loans and the real estate sectors continued to record moderate NPAs (Chart V.15). V.38 There was an improvement in the provision coverage ratio (PCR) for the banking system as a whole barring PVBs (Chart V.16).
Revised Prompt Corrective Action Framework V.39 The Reserve Bank introduced the revised prompt corrective action (PCA) framework with effect from April 1, 2017 based on the financials of the banks for the year ended March 31, 2017. Capital (CRAR/ common equity tier (CET) I ratio), asset quality (net non-performing assets (NNPA) ratio), profitability (return on assets) and leverage (Tier I leverage ratio) are the key areas for monitoring in the revised framework4. Breach of any risk threshold will result in invocation of PCA by the Reserve Bank (Table V.17). So far, seven PSBs have been put under PCA. Recovery of NPAs V.40 Recovery of banks’ NPAs remains poor, having declined to 20.8 per cent by end-March 2017 from 61.8 per cent in 2009. During 2016- 17, Debt Recovery Tribunals (DRTs) made the highest amount of recovery, followed by the Securitisation and Reconstruction of Financial Assets and Enforcement of Security Interest (SARFAESI) Act and Lok Adalats. The significant improvement in the case of DRTs was due to opening of new tribunals, strengthening existing infrastructure and computerised processing of court cases (Table V.18). | Table V.17: Revised PCA Matrix – Indicators and Risk Thresholds | | Indicator | Risk Threshold 1 | Risk Threshold 2 | Risk Threshold 3 | | CRAR + applicable CCB* | >=7.75% but <10.25% | >=6.25% but <7.75% | - | | CET I Capital Ratio + applicable CCB* | >=5.125% but <6.75% | >=3.625% but <5.125% | <3.625% | | NNPA Ratio | >=6.0% but <9.0% | >=9.0% but <12.0% | >=12.0% | | RoA | Negative RoA for two consecutive years | Negative RoA for three consecutive years | Negative RoA for four consecutive years | | Tier I Leverage Ratio | >=3.5% but <= 4.0% | <3.5% | - | Note: *: Applicable CCB is 1.25%, 1.875% and 2.5% as on March 31, 2017, March 31, 2018 and March 31, 2019, respectively.
Source: Reserve Bank of India. | V.41 An alternate option for banks for enforcement of security interest is sale of NPAs to securitisation companies/reconstruction companies (SCs/RCs) registered under the SARFAESI Act, 2002 with banks taking some haircut on every sale. An analysis of purchase of NPAs by SCs / RCs indicates that acquisition cost as a proportion of the book value of assets increased from 28.7 per cent in March 2014 to 36 per cent in March 2017, indicating that the banks had to incur lower haircuts on account of sale of NPAs. V.42 Recent years have witnessed a sharp pick-up in the sale of stressed assets to SCs/RCs by PVBs and FBs, however, sale of NPAs by PSBs remains lukewarm (Chart V.17). | Table V.18: NPAs of SCBs Recovered through Various Channels | | (Amount in ₹ billion) | | Recovery Channel | 2015-16 | 2016-17 | | No. of Cases Referred | Amount Involved | Amount Recovered* | Col. (4) as % of Col. (3) | No. of Cases Referred | Amount Involved | Amount Recovered* | Col. (8) as % of Col. (7) | | 1 | 2 | 3 | 4 | 5 | 6 | 7 | 8 | 9 | | i) Lok Adalats | 4,456,634 | 720 | 32 | 4.4 | 2,152,895 | 1,058 | 38 | 3.6 | | ii) DRTs | 24,537 | 693 | 64 | 9.2 | 28,902 | 671 | 164 | 24.4 | | iii) SARFAESI Act | 173,582 | 801 | 132 | 16.5 | 80,076 | 1,131 | 78 | 6.9 | | Total | 4,654,753 | 2,214 | 228 | 10.3 | 2,261,873 | 2,860 | 280 | 9.8 | Notes: 1. *: Refers to amount recovered during the given year, which could be with reference to cases referred during the given year as well as during the earlier years.
2. DRTs – Debt Recovery Tribunals. |
V.43 Seller banks subscribed to more than 80 per cent of the total security receipts (SRs) issued (Table V.19). | Table V.19: Details of Financial Assets Securitised by SCs / RCs | | (Amount in ₹ billion) | | Item | Jun-14 | Jun-15 | Jun-16 | Jun-17 | | 1. Book Value of Assets Acquired | 1598 | 1750 | 2377 | 2627 | | 2. Security Receipts Issued by SCs / RCs | 520 | 536 | 790 | 940 | | 3. Security Receipts Subscribed to by | | | | | | (a) Banks | 429 | 441 | 651 | 777 | | (b) SCs / RCs | 74 | 73 | 114 | 142 | | (c) FIIs | 1 | 1 | 3 | 3 | | (d) Others (Qualified Institutional Buyers) | 16 | 21 | 22 | 18 | | 4. Amount of Security Receipts Completely Redeemed | 107 | 123 | 149 | 156 | | Source: Quarterly statement submitted by SCs / RCs. | V. Sectoral Distribution of Bank Credit Sectoral Deployment V.44 At the aggregate level, growth in non-food credit decelerated during 2016-17, extending a slowdown that commenced in 2015. Credit to industries, which accounted for 38 per cent of total non-food credit went into contraction. Within this category, the decline in credit to infrastructure was stark. Credit to the services sector, especially in the trade segment, picked up. With respect to non-bank financial companies (NBFCs) which accounted for more than one-fifth of the credit to the services sector, it remained in double-digits although some moderation set in during 2016-17 (Table V.20). V.45 Credit to agriculture and allied activities and personal loans also experienced deceleration in growth (Chart V.18). | Table V.20: Sectoral Deployment of Gross Bank Credit | | (Amount in ₹ billion) | | Sr No | Item | Outstanding as on | Percentage Variation | | Mar-16 | Mar-17 | 2015-16 | 2016-17 | | 1 | Agriculture & Allied Activities | 8,829 | 9,924 | 15.3 | 12.4 | | 2 | Industry | 27,307 | 26,800 | 2.7 | -1.9 | | | of which | | | | | | | 2.1 Infrastructure | 9,648 | 9,064 | 4.4 | -6.1 | | | 2.2 Micro and Small Industries | 3,715 | 3,697 | -2.3 | -0.5 | | 3 | Services | 15,411 | 18,022 | 9.1 | 16.9 | | | of which | | | | | | | 3.1 Trade | 3,811 | 4,279 | 4.2 | 12.3 | | | 3.2 Commercial Real Estate | 1,776 | 1,856 | 6.7 | 4.5 | | | 3.3 Tourism, Hotels & Restaurants | 371 | 375 | 0.1 | 1.2 | | | 3.4 Computer Software | 191 | 179 | 10.9 | -6.3 | | | 3.5 Non-banking Financial Companies | 3,527 | 3,910 | 13.2 | 10.9 | | 4 | Personal Loans | 13,922 | 16,200 | 19.4 | 16.4 | | | of which | | | | | | | 4.1 Credit Card Outstanding | 377 | 521 | 23.7 | 38.4 | | | 4.2 Education | 682 | 701 | 7.7 | 2.7 | | | 4.3 Housing (including Priority Sector Housing) | 7,468 | 8,601 | 18.8 | 15.2 | | | 4.4 Advances against Fixed Deposits (including FCNR (B), NRNR Deposits, etc.) | 667 | 661 | 6.7 | -0.9 | | 5 | Non Food Credit (1-4) | 65,469 | 70,946 | 9.1 | 8.4 | | 6 | Gross Bank Credit | 66,500 | 71,347 | 9.0 | 7.3 | Note: Percentage variations could be slightly different as absolute numbers have been rounded off to ₹ billion.
Source: Sectoral deployment of bank credit, Reserve Bank of India. | Retail Loans V.46 Housing loans, which account for more than half of the retail loan portfolio of banks, decelerated sharply, attributable to the transitory effects of demonetisation and uncertainty regarding the implementation of the Real Estate (Regulation and Development) Act. In June 2017, risk weights and provisioning on standard assets on certain categories of individual housing loans were reduced with a view to providing a boost to the housing segment. Auto loans, another major component of retail loans, continued to record robust growth, albeit with some deceleration in 2016-17. Likewise, credit was robust in respect of consumer durables and credit card loans while education loans slowed down and advances against fixed deposits shrank (Table V.21). Priority Sector Credit V.47 Priority sector credit growth slowed sharply during the year in line with deceleration in overall credit. However, methodological changes in the reporting and monitoring of priority sector regulations by the Reserve Bank accentuated it5 (Chart V.19). V.48 PVBs exceeded the overall priority sector target of 40 per cent of Adjusted Net Bank Credit (ANBC) or credit equivalent amount of off-balance sheet exposure (OBE), whichever is higher, but shortfalls were reported in certain sub-targets in respect of total agriculture, small and marginal farmers, non-corporate individual farmers and weaker sections. PSBs marginally missed the overall priority sector target, but they could achieve various sub-targets except for micro-enterprises (Table V.22). | Table V.21 : Retail Loan Portfolio of Banks | | (Amount in ₹ billion) | | Sr. No | Item | Amount Outstanding | Percentage Variation | | 2016 | 2017 | 2016 | 2017 | | 1 | Housing Loans | 7625 | 8530 | 18.5 | 11.9 | | 2 | Consumer Durables | 182 | 215 | -0.3 | 18.4 | | 3 | Credit Card Receivables | 469 | 649 | 24.2 | 38.3 | | 4 | Auto Loans | 1543 | 1866 | 24.0 | 20.9 | | 5 | Education Loans | 681 | 728 | 9.5 | 6.9 | | 6 | Advances against Fixed Deposits (incl. FCNR (B), etc.) | 723 | 680 | 11.4 | -6.0 | | 7 | Advances to Individuals against Shares, Bonds, etc. | 52 | 51 | -10.0 | -2.8 | | 8 | Other Retail Loans | 2689 | 3355 | -4.2 | 24.8 | | | Total Retail Loans | 13965 | 16074 | 12.9 | 15.1 | | | | (19.2) | (21.2) | | | Notes: 1. Figures in parentheses represent percentage share of retail loans in total loans and advances. The amount of total loans and advances are as provided in the off-site returns of SCBs.
2. Percentage variations could be slightly different as absolute numbers have been rounded off to ₹ billion.
Source: Off-site returns. | Priority Sector Lending Certificates V.49 Introduced in April 2016, priority sector lending certificates (PSLCs) allow the market mechanism to enable the achievement of priority sector lending targets by leveraging on the comparative strengths of different banks. While PVBs and FBs are typically buyers of PSLCs; PSBs, SFBs and RRBs are sellers. The total trade value of PSLCs was ₹498 billion during 2016-17 out of which 48.3 per cent of the trades occurred during Q4:2016-17. Trading tends to be concentrated in the last month of each quarter as it makes business sense for buyer banks to part with the premium only at the end of the quarter to realise the time value of money to the maximum. The highest weighted average premiums on PSLCs across various categories were observed in the first quarter of 2016-17 since the PSLCs purchased during the first quarter can be reckoned for achievement at all the four quarterly reporting dates. | Table V.22: Priority Sector Lending by Banks | | (As at March 31, 2017) | | (Amount in ₹ billion) | | Item | Target / sub-target (per cent of ANBC/OBE) | Public Sector Banks | Private Sector Banks | Foreign Banks | | Amount Outstanding | Per cent of ANBC/OBE | Amount Outstanding | Per cent of ANBC/OBE | Amount Outstanding | Per cent of ANBC/OBE | | 1 | 2 | 3 | 4 | 5 | 6 | 7 | 8 | | Total Priority Sector Advances | 40 | 19,889 | 39.5 | 7,110 | 42.5 | 1,238 | 36.9 | | of which | | | | | | | | | Total Agriculture | 18 | 9,229 | 18.3 | 2,762 | 16.5 | 176 | - | | Small and Marginal Farmers | 8 | 4,375 | 8.7 | 920 | 5.5 | - | - | | Non-corporate Individual Farmers# | 11.7 | 6,273 | 12.5 | 1,750 | 10.5 | - | - | | Micro Enterprises | 7.5 | 3,151 | 6.3 | 1,386 | 8.3 | - | - | | Weaker Sections | 10 | 5,753 | 11.4 | 1,507 | 9.0 | 53 | - | Notes: 1. -: Nil/negligible.
2. Data are provisional.
3. #: Domestic SCBs were directed to ensure that their overall lending to non-corporate farmers does not fall below the system-wide average of the last three years’ achievement. All efforts should be made to reach the level of 13.5 per cent direct lending to the beneficiaries who earlier constituted the direct agriculture sector. The applicable system wide average figure for computing achievement under priority sector lending will be notified every year. For FY 2016-17, the applicable system wide average figure is 11.70 per cent.
4. As on March 31, 2017, the specified priority sector lending targets / sub-targets is applicable for domestic SCBs/foreign banks with 20 branches or more as per cent of ANBC or credit equivalent amount of OBE, whichever is higher as on March 31 of the preceding year. The target for the total priority sector, total agriculture and weaker sections in case of foreign banks with 20 branches and above is to be achieved by March 2018. The sub-target for small and marginal farmers and micro-enterprises for foreign banks with 20 branches and above would be made applicable post-2018 after a review in 2017.
5. For foreign banks having less than 20 branches, the target of 40 per cent of ANBC or credit equivalent amount of OBE, whichever is higher, as on March 31 of the preceding year is to be achieved in a phased manner by March 2020. | V.50 Highest PSLC premiums were observed for the PSLC – small and marginal farmers (SMF) as it is the only PSLC which can be reckoned for achievement under all of the following targets, viz., SMF, non-corporate farmers, agriculture, overall priority sector and weaker sections. The lowest premiums were observed for PSLC-General, which are counted towards the overall target only. Credit to Sensitive Sectors V.51 Credit to sensitive sectors decelerated during 2016-17. The real estate sector, which accounts for 93 per cent of total loans to sensitive sectors was adversely impacted by demonetisation, which was also reflected in credit demand. About 20 per cent of total loans and advances of SCBs goes to the real estate sector. While PSBs maintained the tempo of loans to the sector, PVBs recorded a decline (Appendix Table V.4). VI. Operations of Scheduled Commercial Banks in the Capital Market V.52 During 2016-17 and during 2017-18 so far, the Nifty Bank Index has outperformed Nifty 50 reflecting better performance of bank equities as compared to other sectors. Movement in the Nifty Bank Index was guided by a host of factors including enactment of the Insolvency and Bankruptcy Code (IBC), 2016, easing of the monetary policy rate, net purchases by domestic mutual funds following the liquidity glut due to demonetisation, net purchases by foreign institutional investors (FIIs) due to a favourable global equity market, revision of the PCA framework by the Reserve Bank, promulgation of the Banking Regulation (Amendment) Ordinance, 2017 and identification of stressed accounts by the Reserve Bank for resolution through the IBC. In Q1:2016-17, the Nifty Private Bank Index yielded better returns than the Nifty PSU Bank Index. However, later during the year the Nifty PSU Bank Index outperformed the Nifty Private Bank Index possibly due to value buying of PSB stocks by investors, proposed restructuring of PSBs, expectation of early resolution of NPA problem and deceleration in the growth of fresh NPAs. Following the promulgation of the Banking Regulation (Amendment) Ordinance, 20176 which empowers the Reserve Bank to direct banks to initiate insolvency proceedings in respect of corporate borrowers in default, under the IBC, 2016 in May 2017 and the identification of certain accounts by the Reserve Bank, the Nifty PSU Bank Index corrected. However, following the announcement by the Government to recapitalise PSBs on October 24, 2017, Nifty PSU Bank Index rallied sharply. Although, it marginally corrected, thereafter (Chart V.20). 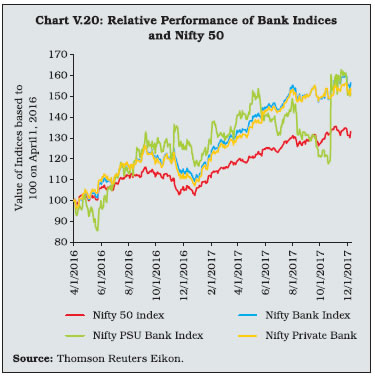 VII. Ownership Pattern in Scheduled Commercial Banks V.53 While the Indian banking system is dominated by PSBs, the share of PVBs has been rising in recent years (Chart V.21). V.54 During 2016-17, 13 out of 27 PSBs witnessed increased public shareholding due to recapitalisation (Chart V.22). V.55 At the end of March 2017, the maximum foreign shareholding in the case of PSBs was only up to 12.2 per cent. By contrast, four PVBs had foreign shareholding in excess of 50 per cent. (Appendix Table V.5). VIII. Foreign Banks’ Operations in India and Overseas Operations of Indian Banks V.56 At end-March 2017, 44 foreign banks were operating through 295 branches, down from 46 foreign banks with 325 branches in 2016. In addition, there were 39 representative offices of foreign banks. Indian banks had 186 branches abroad as well as overseas presence in the form of 26 subsidiaries, 53 representative offices and eight joint ventures. The number of branches of Indian banks declined during the year reflecting efforts towards rationalisation so as to improve efficiency and minimise costs (Table V.23). Unlike Indian banks operating abroad, no foreign bank operates as a wholly owned subsidiary in India, despite near national treatment given to them by the Reserve Bank. | Table V.23: Overseas Operations of Indian Banks | | (As at end-March) | | Name of the Bank | Branch | Subsidiary | Representative Office | Joint Venture Bank | Other Offices* | Total | | 2016 | 2017 | 2016 | 2017 | 2016 | 2017 | 2016 | 2017 | 2016 | 2017 | 2016 | 2017 | | 1 | 2 | 3 | 4 | 5 | 6 | 7 | 8 | 9 | 10 | 11 | 12 | 13 | | I. Public Sector Banks | 168 | 166 | 23 | 23 | 35 | 35 | 7 | 8 | 33 | 36 | 266 | 268 | | 1 Allahabad Bank | 1 | 1 | 0 | 0 | 0 | 0 | 0 | 0 | 0 | 0 | 1 | 1 | | 2 Andhra Bank | 0 | 0 | 0 | 0 | 2 | 2 | 0 | 0 | 0 | 0 | 2 | 2 | | 3 Bank of Baroda | 51 | 50 | 9 | 9 | 1 | 1 | 2 | 2 | 10 | 10 | 73 | 72 | | 4 Bank of India | 28 | 29 | 5 | 5 | 5 | 4 | 0 | 0 | 0 | 0 | 38 | 38 | | 5 Canara Bank | 8 | 8 | 0 | 1 | 1 | 1 | 0 | 0 | 0 | 0 | 9 | 10 | | 6 Central Bank of India | 0 | 0 | 0 | 0 | 2 | 2 | 0 | 0 | 0 | 0 | 2 | 2 | | 7 Corporation Bank | 0 | 0 | 0 | 0 | 2 | 2 | 0 | 0 | 0 | 0 | 2 | 2 | | 8 Dena Bank | 0 | 0 | 0 | 0 | 1 | 1 | 0 | 0 | 0 | 0 | 1 | 1 | | 9 Indian Bank | 4 | 4 | 0 | 0 | 0 | 0 | 0 | 0 | 0 | 0 | 4 | 4 | | 10 Indian Overseas Bank | 8 | 8 | 0 | 0 | 3 | 2 | 0 | 0 | 3 | 3 | 14 | 13 | | 11 IDBI Bank Ltd. | 1 | 1 | 0 | 0 | 0 | 0 | 0 | 0 | 0 | 0 | 1 | 1 | | 12 Punjab National Bank | 3 | 3 | 3 | 2 | 3 | 4 | 1 | 2 | 0 | 0 | 10 | 11 | | 13 State Bank of India | 55 | 53 | 5 | 5 | 7 | 7 | 4 | 4 | 20 | 23 | 91 | 92 | | 14 State Bank of Travancore | 0 | 0 | 0 | 0 | 1 | 1 | 0 | 0 | 0 | 0 | 1 | 1 | | 15 State Bank of Hyderabad | 0 | 0 | 0 | 0 | 1 | 1 | 0 | 0 | 0 | 0 | 1 | 1 | | 16 Syndicate Bank | 1 | 1 | 0 | 0 | 0 | 0 | 0 | 0 | 0 | 0 | 1 | 1 | | 17 UCO Bank | 4 | 4 | 0 | 0 | 0 | 1 | 0 | 0 | 0 | 0 | 4 | 5 | | 18 Union Bank | 4 | 4 | 1 | 1 | 3 | 3 | 0 | 0 | 0 | 0 | 8 | 8 | | 19 United Bank of India | 0 | 0 | 0 | 0 | 2 | 2 | 0 | 0 | 0 | 0 | 2 | 2 | | 20 Oriental Bank of Commerce | 0 | 0 | 0 | 0 | 1 | 1 | 0 | 0 | 0 | 0 | 1 | 1 | | II. Private Sector Bank | 20 | 20 | 3 | 3 | 18 | 18 | 0 | 0 | 0 | 0 | 41 | 41 | | 21 Axis Bank | 5 | 5 | 1 | 1 | 3 | 3 | 0 | 0 | 0 | 0 | 9 | 9 | | 22 HDFC Bank Ltd. | 3 | 3 | 0 | 0 | 3 | 3 | 0 | 0 | 0 | 0 | 6 | 6 | | 23 ICICI Bank Ltd. | 12 | 12 | 2 | 2 | 6 | 5 | 0 | 0 | 0 | 0 | 20 | 19 | | 24 IndusInd Bank Ltd. | 0 | 0 | 0 | 0 | 3 | 3 | 0 | 0 | 0 | 0 | 3 | 3 | | 25 Federal Bank Ltd. | 0 | 0 | 0 | 0 | 1 | 2 | 0 | 0 | 0 | 0 | 1 | 2 | | 26 Kotak Mahindra Bank Ltd. | 0 | 0 | 0 | 0 | 1 | 1 | 0 | 0 | 0 | 0 | 1 | 1 | | 27 Yes Bank | 0 | 0 | 0 | 0 | 1 | 1 | 0 | 0 | 0 | 0 | 1 | 1 | | All Banks | 188 | 186 | 26 | 26 | 53 | 53 | 7 | 8 | 33 | 36 | 307 | 309 | Note: *: Other Offices include marketing / sub-office, remittance centres, etc.
Source: Reserve Bank of India. | 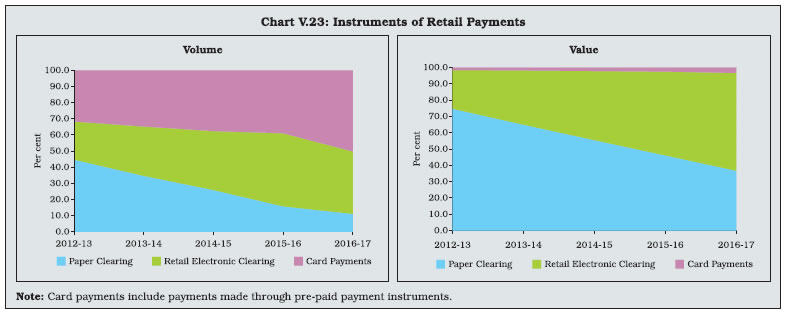 IX. Payment System Indicators of Scheduled Commercial Banks V.57 The Reserve Bank took various policy measures to expand and strengthen the payment system infrastructure and to introduce various innovative products, which are accessible, convenient, cost-effective and secure as envisaged in the Payment System Vision Document 2016-18. The withdrawal of high denomination SBNs provided a boost to the objective of a ‘less-cash society’ as people shifted to card based transactions and various modes of electronic payments (such as NACH, NEFT, UPI, PPI and IMPS). During 2016-17, 88.8 per cent of the non-cash retail payments in terms of volume and 63.3 per cent of the non-cash retail payments in terms of value were undertaken through cards and electronic modes (Chart V.23). Growth in ATMs V.58 The coverage of ATMs increased as the total number of ATMs installed crossed 0.2 million as at end March 2017 (Table V.24). V.59 However, saturation is observed in the growth of ATMs in view of steady deceleration in the number of ATMs across various bank groups in recent years, which may be attributable to electronic transactions, disincentivising the number of cash withdrawals and increasing use of credit/debit cards for retail payments. Further, the cost of transactions at ATMs is higher than interchange recovered by the acquirer. Hence, banks are reluctant to set up new ATMs (Chart V.24). Off-site ATMs V.60 The share of off-site ATMs in total ATMs for all SCBs remained less than 50 per cent. In the case of PSBs, however, which account for 71 per cent of the total ATMs, the share of off-site ATMs was merely 41.7 per cent as against 60.8 per cent and 77.3 per cent in case of PVBs and FBs, respectively (Table V.24). White-label ATMs V.61 The number of white label ATMs (WLAs), set up, owned and operated by non-bank entities, increased by 8.9 per cent to 14,121 by end-March 2017 from previous year. It needs to be noted that 88.7 per cent of the WLAs are operated by only two WLA operators. Unlike the ATMs which are concentrated in urban and metropolitan centres, around 74 per cent of the WLAs were located in rural (42.4 per cent) and semi-urban centres (31.6 per cent). | Table V.24 : ATMs of Scheduled Commercial Banks | | (As at end-March 2017) | | Sr. No. | Bank Group | On-site ATMs | Off-site ATMs | Total Number of ATMs | | 1 | 2 | 3 | 4 | 5 | | I | Public Sector Banks | 86,545 | 62,010 | 148,555 | | II | Private Sector Banks | 23,045 | 35,788 | 58,833 | | III | Foreign Banks | 219 | 747 | 966 | | IV | All SCBs | 109,809 | 98,545 | 208,354 | | Note: Data excludes White Label ATMs (WLAs). |
Debit and Credit Cards V.62 Both debit and credit cards issued by SCBs recorded growth of more than 16 per cent during 2016-17 though debit cards witnessed further deceleration in growth. Rupay cards issued under the Pradhan Mantri Jan Dhan Yojana (PMJDY) was a major driver of increase in number of debit cards. PSBs (82.9 per cent) and PVBs (62.4 per cent) continued to maintain a strong lead in debit and credit cards, respectively (Table V.25; Chart V.25). Pre-paid Payment Instruments V.63 The usage of pre-paid payment instruments (PPIs) for remittances as also for payment towards goods and services has been on an increase. The withdrawal of SBNs accelerated the usage of PPIs. | Table V.25: Credit and Debit Cards Issued by Scheduled Commercial Banks | | (As at end-March 2017) | | (in million) | | Sr No. | Bank Group | Outstanding Number of Credit Cards | Outstanding Number of Debit Cards | | 2016 | 2017 | 2016 | 2017 | | 1 | 2 | 3 | 4 | 5 | 6 | | I | Public Sector Banks | 5.0 | 6.1 | 548.5 | 639.5 | | II | Private Sector Banks | 14.7 | 18.6 | 110.3 | 128.2 | | III | Foreign Banks | 4.7 | 5.1 | 3.0 | 4.0 | | IV | All SCBs | 24.5 | 29.8 | 661.8 | 771.6 | | Note: Figures may not add up to the total due to rounding-off. | The volume of PPIs sharply rose to 1,964 million as at end-March 2017 from 748 million in the previous year. The value of PPIs also witnessed significant growth during the year (Chart V.26). According to the Reserve Bank’s guidelines, the maximum value of a pre-paid payment instrument shall not exceed ₹100,000 at any point of time. Unified Payments Interface V.64 The unified payments interface (UPI) was introduced in 2016-17 to provide an alternative and convenient means of electronic payments. In this regard, National Payments Corporation of India (NPCI) was accorded approval to introduce unstructured supplementary service data (USSD) 2.0 mobile banking facility (*99# which can be used on any handset and does not require internet connection by the customers), which is integrated with UPI. The UPI allows money transfers between any two bank accounts by using a smartphone as well as feature phone (USSD 2.0). It also allows a customer to pay directly from a bank account to different merchants, both online and offline on the basis of virtual address instead of bank account details. During the year, 17.9 million transactions worth ₹69.5 billion occurred through UPI.
X. Customer Service V.65 Consumer protection and awareness has assumed a critical role for the Reserve Bank in view of the increasing customer base of banks, predominantly from vulnerable sections of society, and the introduction of technology based banking products. In this direction, the Reserve Bank set up five more Banking Ombudsman (BO) offices in addition to the existing 15 BO offices to ensure fair treatment of customers. During 2016-17, the total number of complaints increased by 27.3 per cent, up from 20.9 per cent in the previous year. Except for a few BO offices in Tier II cities, most of the Tier I7 and Tier II cities recorded a significant increase in the number of complaints (Table V.26). V.66 BO offices in six Tier I cities received 54.7 per cent of the total complaints. Population-group wise, the largest proportion of complaints was received from urban areas followed by metropolitan, semi-urban and rural areas. During 2016-17, the share of complaints from urban and rural bank customers further increased while the share of metropolitan and semi-urban customers ebbed (Chart V.27). | Table V.26: Region-wise Complaints Received at Banking Ombudsman Offices | | BO Office | Number of Complaints | Percentage Variation | | 2015-16 | 2016-17 | 2016-17 | | Ahmedabad | 5,909 | 9,552 | 61.7 | | Bengaluru | 5,119 | 7,042 | 37.6 | | Bhubaneswar | 3,050 | 2,582 | -15.3 | | Bhopal | 5,748 | 5,671 | -1.3 | | Kolkata | 4,846 | 7,834 | 61.7 | | Chennai | 8,645 | 9,007 | 4.2 | | Chandigarh | 4,571 | 8,189 | 79.2 | | Guwahati | 1,328 | 1,569 | 18.1 | | Hyderabad | 5,910 | 6,570 | 11.2 | | Jaipur | 4,664 | 6,740 | 44.5 | | Kanpur | 9,621 | 8,150 | -15.3 | | Patna | 5,003 | 6,225 | 24.4 | | Mumbai | 12,333 | 16,299 | 32.2 | | New Delhi | 22,554 | 24,837 | 10.1 | | Thiruvananthapuram | 3,593 | 3,855 | 7.3 | | *New Delhi II | 0 | 4,935 | - | | *Dehradun | 0 | 948 | - | | *Ranchi | 0 | 715 | - | | *Raipur | 0 | 237 | - | | *Jammu | 0 | 30 | - | | Total | 102,894 | 130,987 | 27.3 | Notes: 1. -: Nil/negligible.
2. * Offices opened in 2016-17.
3. Includes SCBs, RRBs and UCBs.
Source: Various Regional Offices of Banking Ombudsman. |
 V.67 In recent years, non-observance of the fair practices code has been a major complaint against banks, followed by complaints related to ATM/ credit/debit cards, non-adherence to the code of the Banking Codes and Standards Board of India (BCSBI) and pensions (Chart V.28).
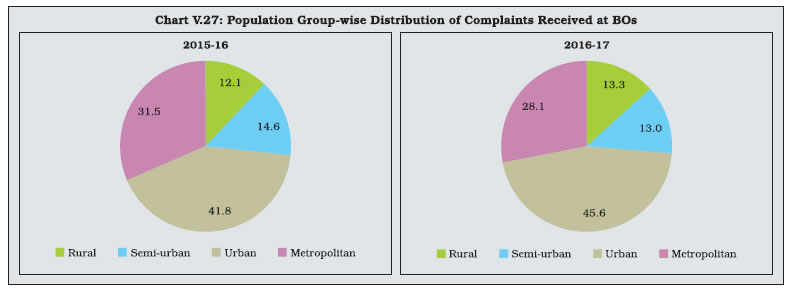
V.68 Bank group-wise, PSBs (67.9 per cent) received the largest number of complaints, followed by PVBs (29.3 per cent) and FBs (2.7 per cent), largely reflecting their shares in total loans. However, if number of complaints is normalised by the number of branches / number of accounts (deposit + loans), the highest number of complaints were against FBs, followed by PVBs and PSBs (Chart V.29). XI. Financial Inclusion V.69 Under the advice of the Reserve Bank, SCBs have been devising three-year financial inclusion plans (FIP) congruent with their business strategies and comparative advantages as an integral part of their corporate plans. FIP include self-set targets to expand their outreach in terms of outlets and customer base as well as to offer a range of products suited for the purpose. They include specific goals for coverage of unbanked villages, opening of accounts and other specific products aimed at financially excluded segments. Two phases of the financial inclusion plans, i.e., Phase-I (2010-13) and Phase-II (2013-16) have already been completed. Considerable progress was made through these financial inclusion plans towards achieving universal financial inclusion (Table V.27). Currently, the third phase of FIP (2016-19) is being implemented under which granular monitoring is done at the district level to assess the progress in financial inclusion. FIPs have also been extended to cover the small finance banks and they have been advised to report on the progress made under various financial inclusion parameters as prescribed by the Reserve Bank. V.70 During 2016-17, the number of brick and mortar branches in rural areas declined marginally. With an increasing number of villages being covered through business correspondents (BCs) and other modes, the total number of banking outlets in villages showed a marginal uptick (Table V.27). V.71 The dominance of BCs in banking services in rural areas can be gauged from the fact that in March 2017, about 91 per cent of the banking outlets in villages were BCs as against 50.5 per cent in March 2010 (Chart V.30). This underscores the increasing importance of technology in the provision of banking services. Further, given that BCs which provide banking services over a minimum of 4 hours per day and for at least 5 days a week have been recognised as banking outlets, their importance is set to increase further. Pradhan Mantri Jan Dhan Yojana V.72 The period since August 2014 is co-terminus with the implementation of the Pradhan Mantri Jan Dhan Yojana (PMJDY) of the Government of India, which has given a big push to financial inclusion from the supply side. During this period of a little more than three years, more than 300 million PMJDY accounts have been opened and about 231 million Rupay debit cards have been issued. In this drive, more than 96 per cent of these accounts were opened with PSBs and RRBs (Chart V.31). | Table V.27: Progress under Financial Inclusion Plans, All SCBs including RRBs | | Sr. No. | Particulars | Mar-10 | Mar-16 | Mar-17 | Half year ended Sep-17* | Percentage change (Mar-2016 – Mar-17) | | 1 | Banking Outlets in Villages – Branches | 33,378 | 51,830 | 50860 | 49,527 | -1.9 | | 2 | Banking Outlets in Rural Location – Branchless Mode | 34,316 | 534,477 | 547,233 | 511,383 | 2.4 | | 3 | Banking Outlets in Villages – Total | 67,694 | 586,307 | 598,093 | 560,910 | 2.0 | | 4 | Urban Locations Covered through BCs | 447 | 102,552 | 102,865 | 123,941 | 0.3 | | 5 | BSBDA – Through Branches (No. in million) | 60 | 238 | 254 | 245 | 6.7 | | 6 | BSBDA – Through Branches( Amt. in ₹ billion) | 44 | 474 | 691 | 635 | 45.8 | | 7 | BSBDA – Through BCs (No. in million) | 13 | 231 | 280 | 278 | 21.2 | | 8 | BSBDA – Through BCs (Amt. in ₹ billion) | 11 | 164 | 285 | 306 | 73.8 | | 9 | BSBDA – Total (No. in million) | 73 | 469 | 533 | 522 | 13.6 | | 10 | BSBDA – Total (Amt. in ₹ billion) | 55 | 638 | 977 | 941 | 53.1 | | 11 | OD Facility Availed in BSBDAs (No. in million) | 0.2 | 9 | 9 | 6 | 0.0 | | 12 | OD Facility Availed in BSBDAs (Amt. in ₹ billion) | 0.1 | 29 | 17 | 4 | -41.4 | | 13 | KCCs – Total (No. in million) | 24 | 47 | 46 | 46 | -2.1 | | 14 | KCCs – Total (Amt. in ₹ billion) | 1,240 | 5,131 | 5,805 | 5,896 | 13.1 | | 15 | GCC – Total (No. in million) | 1 | 11 | 13 | 12 | 18.2 | | 16 | GCC – Total (Amt. in ₹ billion) | 35 | 1,493 | 2,117 | 1,806 | 41.8 | | 17 | ICT A/Cs-BC – Total Transactions (No. in million) | 27 | 827 | 1,159 | 662 | 40.1 | | 18 | ICT A/Cs-BC – Total Transactions (Amt. in ₹ billion) | 7 | 1,687 | 2,652 | 1,831 | 57.2 | Notes: 1. Absolute and percentage variation could be slightly different as numbers have been rounded off to million / billion.
2. *: Data excludes 8 RRBs.
Source: Reserve Bank of India. |
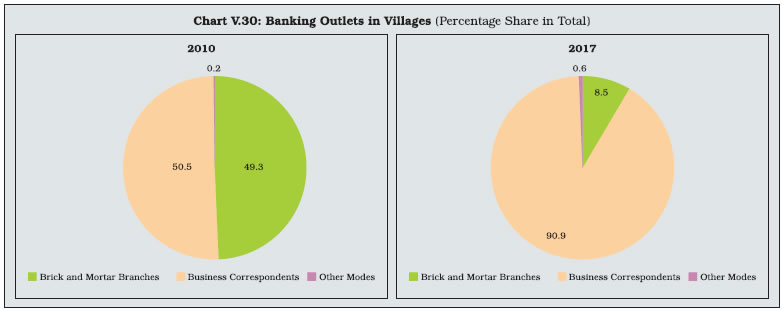
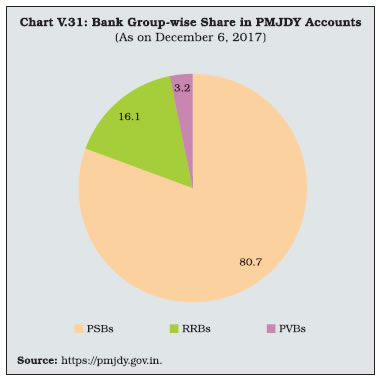 V.73 A steady increase in the usage of these accounts across bank-groups has also been observed. Following demonetisation, there was a sharp increase in the average balances in these accounts. Although the average balance per account has come down subsequently, they still remain at a level higher than in the pre-demonetisation period (Chart V.32). Given the increased focus on supply side measures so far, there is also a need to focus on enhancing capabilities so that the individual is in a position to avail the offered services and demand preferred products and services suitable to her need/choice. 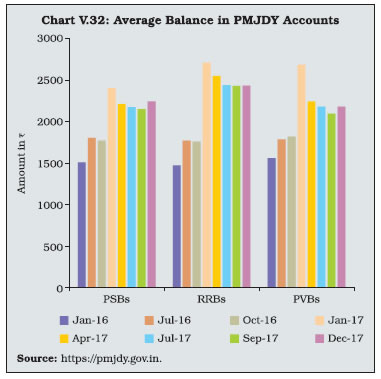 V.74 The increasing focus on the BC model has also resulted in a steady decline in new brick and mortar branches. During 2016-17, newly opened branches declined by more than 30 per cent. A disconcerting feature is that 45 per cent of the new branches were opened in Tier-I centres. A declining proportion of the branches were opened in Tier-VI centres (population less than 5,000) in recent years, which lie in rural areas (Table V.28). V.75 Nonetheless, banking penetration has improved significantly and the gap across various geographical regions has declined on account of the efforts made towards expanding access to the formal financial system. Under-banked geographical regions such as the north-east as well as the eastern and central regions recorded noteworthy improvement in population per bank branch. In the Southern region, which has the highest banking penetration, population per branch declined to 6,801 in March 2017 (Chart V.33). Distribution of ATMs V.76 Over the years, the spread of ATMs has played an important role in enhancing access to banking services. During 2016-17, the share of ATMs in metropolitan centres increased, while the share of ATMs in rural and urban centres marginally declined. In terms of geographical distribution, 32.1 per cent of the ATMs were concentrated in the southern region. The eastern and north-eastern region had the least penetration of ATMs. This largely mirrors the geographical distribution of bank branches (Chart V.34). | Table V.28: Tier-wise Break-up of Newly Opened Bank Branches | | Tier | 2013-14 | 2014-15 | 2015-16 | 2016-17 | | Tier I | 3,118 | 3,094 | 2,736 | 2,174 | | | (27.2) | (35.4) | (39.2) | (45.0) | | Tier II | 824 | 606 | 531 | 327 | | | (7.2) | (6.9) | (7.6) | (6.8) | | Tier III | 1,293 | 1,045 | 873 | 558 | | | (11.3) | (12.0) | (12.5) | (11.6) | | Tier IV | 1,025 | 745 | 559 | 365 | | | (8.9) | (8.5) | (8.0) | (7.6) | | Tier V | 1,463 | 835 | 635 | 611 | | | (12.7) | (9.6) | (9.1) | (12.7) | | Tier VI | 3,757 | 2,405 | 1,652 | 795 | | | (32.7) | (27.5) | (23.6) | (16.5) | | Total | 11,480 | 8,730 | 6,986 | 4,830 | | | (100.0) | (100.0) | (100.0) | (100.0) | Note: Figures in parentheses are percentages to total.
Source: Reserve Bank of India. |
V.77 ATMs in urban and metropolitan centres accounted for 56.8 per cent of the total. In contrast to PSBs whose ATMs were relatively well distributed across various population centres, ATMs of PVBs and FBs were concentrated in urban and metropolitan centres (Table V.29). | Table V.29: Percentage Share of ATMs of SCBs at Various Centres | | (As at end-March 2017) | | Bank group | Rural | Semi- urban | Urban | Metro- politan | | 1 | 2 | 3 | 4 | 5 | | Public Sector Banks | 19.7 | 28.3 | 28.9 | 23.1 | | Private Sector Banks | 8.4 | 23.6 | 26.2 | 41.8 | | Foreign Banks | 1.6 | 1.8 | 18.9 | 77.7 | | Total | 16.4 | 26.8 | 28.1 | 28.7 | | Source: Reserve Bank of India. |
Microfinance Programme V.78 Steady progress has been made in the delivery of microfinance through self-help groups (SHGs) and joint liability groups (JLGs). SHG-bank linkage continued to be the dominant mode of microfinance with about 1.9 million SHGs credit linked with bank financing of ₹388 billion during 2016-17. Although the number of micro finance institutions (MFIs) financed by banks increased significantly, the amount of loans disbursed declined (Table V.30). Cross-country Experience in Financial Inclusion V.79 Due to various efforts made by the Government and the Reserve Bank, the overall score for financial inclusion as brought out by The Economist Intelligence Unit’s Global Microscope improved to 78 out of 100 in 2016 from 61 in 2014. The overall score assesses the regulatory ecosystem for financial inclusion by evaluating 12 indicators across a range of emerging and developing economies covering 55 countries. India occupied the third position in terms of overall ranking, much ahead of its BRICS peers and other emerging economies. India had an impeccable score in terms of regulation of electronic payments (Table V.31). This underscores the widespread positive action taken to create a regulatory environment which is conducive to digital economic activity. A pan-India survey conducted by the Reserve Bank showed that the average score in various financial literacy indicators was below the minimum required threshold suggested by the OECD/INFE (International Network on Financial Education) Toolkit. This suggests the need to integrate financial literacy in the agenda of financial inclusion for promoting inclusive growth. | Table V.30: Progress of Microfinance Programmes | | (As at end-March) | | Item | Self-Help Groups | | Number (in Million) | Amount (₹ billion) | | 2013-14 | 2014-15 | 2015-16 | 2016-17 | 2013-14 | 2014-15 | 2015-16 | 2016-17 | | Loans Disbursed by Banks | 1.4 | 1.6 | 1.8 | 1.9 | 240 | 276 | 373 | 388 | | | (0.2) | (0.7) | (0.9) | (1.0) | (35) | (114) | (194) | (200) | | Loans Outstanding with Banks | 4.2 | 4.5 | 4.7 | 4.8 | 429 | 515 | 572 | 616 | | | (1.3) | (2.2) | (2.5) | (2.8) | (102) | (232) | (306) | (341) | | Savings with Banks | 7.4 | 7.7 | 7.9 | 8.6 | 99 | 111 | 137 | 161 | | | (2.3) | (3.4) | (3.9) | (4.3) | (25) | (55) | (73) | (87) | | | Microfinance Institutions | | Number | Amount (₹ billion) | | Loans Disbursed by Banks | 545 | 597 | 647 | 2,314 | 103 | 147 | 208 | 193 | | Loans Outstanding with Banks | 2,422 | 4,660 | 2,020 | 5,357 | 165 | 219 | 256 | 292 | | | Joint Liability Groups | | Number (in Million) | Amount (₹ billion) | | Loans Disbursed by Banks | 0.21 | 0.46 | 0.57 | 0.70 | 22 | 44 | 62 | 95 | Notes: 1. Figures in brackets give the details of SHGs covered under the National Rural Livelihoods Mission (NRLM) and the National Urban Livelihoods Mission (NULM) for 2014-15, 2015-16 and 2016-17, respectively. Earlier year data in brackets cover only NRLM / Swarnajayanti Gram Swarojgar Yojana (SGSY) groups.
2. Actual number of MFIs availing loans from banks would be less than the number of accounts, as most of MFIs avail loans several times from the same bank and also from more than one bank.
Source: NABARD. |
| Table V.31: Financial Inclusion in BRICS and Other Emerging Economies, 2016 | | | Overall Score | Government Support for Financial Inclusion | Regulatory and Supervisory Capacity for Financial Inclusion | Prudential Regulation | Regulation and Supervision of Credit Portfolios | Regulation of Electronic Payments | Grievance Redress and Dispute Resolution Mechanisms | | Colombia | 89 | 100 | 58 | 100 | 100 | 75 | 100 | | India | 78 | 83 | 58 | 75 | 89 | 100 | 83 | | Kenya | 61 | 78 | 58 | 88 | 64 | 100 | 25 | | Mexico | 60 | 78 | 58 | 92 | 50 | 50 | 50 | | Indonesia | 55 | 44 | 83 | 46 | 83 | 50 | 83 | | Brazil | 51 | 78 | 42 | 46 | 19 | 75 | 42 | | South Africa | 51 | 39 | 42 | 63 | 33 | 50 | 58 | | Russia | 49 | 61 | 58 | 21 | 69 | 50 | 17 | | Turkey | 46 | 22 | 58 | 67 | 47 | 50 | 33 | | China | 44 | 44 | 17 | 46 | 50 | 75 | 42 | Note: Normalised score 0-100 where 100 = best.
Source: Global Microscope 2016 – The Enabling Environment for Financial Inclusion, The Economist Intelligence Unit. | XII. Regional Rural Banks V.80 Regional Rural Banks (RRBs) were established to bring together the positive features of credit co-operatives and commercial banks and to address the credit needs of backward sections in rural areas. The number of RRBs operating in the country has come down to 56 as at end-March 2017 from 196 in 2005 through amalgamation and consolidation of existing RRBs to improve their financial performance and soundness. Many RRBs have been recapitalised by the Government intermittently to meet the minimum 9 per cent CRAR in a sustainable manner and also to enable them to extend more credit to the productive sectors. Given their mandate to focus on rural areas, about 90 per cent of their loan portfolios consisted of priority sector lending, with agriculture constituting 74.6 per cent of their total priority sector loans in March 2017 (Table V.32). | Table V.32: Purpose-wise Outstanding Advances by RRBs | | (As at end-March) | | (Amount in ₹ billion) | | Sr. No. | Purpose | 2016 | 2017 P | | 1 | 2 | 3 | 4 | | I | Priority (i to v) | 1779 | 1934 | | | Per cent of Total Loans Outstanding | 86.1 | 89.2 | | | i Agriculture | 1317 | 1444 | | | ii Micro, Small and Medium Enterprises | 252 | 282 | | | iii Education | 26 | 27 | | | iv Housing | 132 | 132 | | | v Others | 52 | 49 | | II | Non-priority (i to vi) | 286 | 232 | | | Per cent of Total Loans Outstanding | 13.9 | 10.7 | | | i Agriculture | 1 | - | | | ii Micro, Small and Medium Enterprises | 12 | 8 | | | iii Education | - | - | | | iv Housing | 11 | 15 | | | v Personal Loans | 74 | 60 | | | vi Others | 189 | 149 | | Total (I+II) | 2065 | 2166 | Notes: 1. -: Nil / negligible.
2. P: Provisional.
Source: NABARD. | V.81 The consolidated balance sheet of RRBs recorded a significant expansion during the year. Current and saving deposits increased by 20 per cent or more, partly reflecting the impact of demonetisation. Borrowings also increased, largely from sponsor banks and others sources. On the assets side, RRBs maintained a healthy credit growth, while investments made a turnaround (Table V.33). V.82 Despite a sharp increase in provisioning due to higher NPAs, the net profits of RRBs increased in 2016-17 largely attributed to increase in both interest and other income coupled with decline in operating expenses, in contrast to the decline in profits during the previous year. RoA remained stable, nonetheless NIM declined (Table V.34). | Table V.33: Consolidated Balance Sheet of Regional Rural Banks | | (Amount in ₹ billion) | | Sr. No. | Item | At end-March | Percentage Variation | | 2016 | 2017 P | 2015-16 | 2016-17 P | | 1 | Share Capital | 64 | 64 | 3142.1^ | 0.1 | | 2 | Reserves | 207 | 231 | 10.4 | 11.7 | | 3 | Share Capital Deposits / Tier II Bonds | 1 | - | -98.4 | - | | 4 | Deposits | 3135 | 3719 | 14.8 | 18.6 | | | 4.1 Current | 89 | 107 | -21.9 | 19.9 | | | 4.2 Savings | 1480 | 1881 | 12.9 | 27.1 | | | 4.3 Term | 1566 | 1731 | 20.0 | 10.6 | | 5 | Borrowings | 479 | 560 | -19.4 | 16.9 | | | 5.1 NABARD | 399 | 402 | -13.9 | 0.7 | | | 5.2 Sponsor Bank | 57 | 96 | -48.6 | 66.7 | | | 5.3 Others | 22 | 62 | 17.4 | 179.0 | | 6 | Other Liabilities | 123 | 197 | 1.1 | 59.2 | | | Total Liabilities / Assets | 4009 | 4771 | 8.4 | 19.0 | | 7 | Cash in Hand | 27 | 28 | 10.1 | 2.2 | | 8 | Balances with RBI | 124 | 150 | 13.8 | 20.6 | | 9 | Other Bank Balances | 46 | 65 | -43.6 | 39.2 | | 10 | Investments | 1696 | 2098 | 4.2 | 23.7 | | 11 | Loans and Advances (net) | 1952 | 2239 | 14.7 | 14.3 | | 12 | Fixed Assets | 11 | 11 | 13.3 | 5.9 | | 13 | Other Assets # | 152 | 180 | 7.9 | 18.4 | Notes: 1. -: Nil / negligible.
2. P: Provisional.
3. #: Includes accumulated losses.
4. Percentage variations could be slightly different as absolute numbers have been rounded off to ₹ billion.
5. ^: Share capital deposits merged with share capital.
Source: NABARD. |
| Table V.34: Financial Performance of Regional Rural Banks | | (Amount in ₹ billion) | | Sr. No. | Item | Amount | Percentage variation | | 2015- 16 | 2016- 17 P | 2015- 16 | 2016- 17 P | | 1 | 2 | 3 | 4 | 5 | 6 | | A | Income (i + ii) | 354 | 388 | 10.9 | 9.6 | | | i Interest Income | 333 | 352 | 10.5 | 5.7 | | | ii Other Income | 21 | 36 | 18.2 | 71.4 | | B | Expenditure (i+ii+iii) | 334 | 365 | 14.5 | 9.3 | | | i Interest Expended | 217 | 228 | 14.7 | 5.1 | | | ii Operating Expenses | 97 | 95 | 7.1 | -2.1 | | | of which, Wage Bill | 69 | 67 | 23.2 | -2.9 | | | iii Provisions and Contingencies | 21 | 42 | 66.2 | 100.0 | | C | Profit | | | | | | | i Operating Profit | 22 | 60 | -24.7 | 172.0 | | | ii Net Profit | 20 | 23 | -27.1 | 15.0 | | D | Total Average Assets | 3808 | 4288 | 8.4 | 12.6 | | E | Financial ratios # | | | | | | | i Operating Profit | 0.6 | 1.3 | - | - | | | ii Net Profit | 0.5 | 0.5 | - | - | | | iii Income (a + b) | 9.3 | 9.0 | - | - | | | (a) Interest Income | 8.7 | 8.2 | - | - | | | (b) Other Income | 0.6 | 0.8 | - | - | | | iv Expenditure (a+b+c) | 8.8 | 8.5 | - | - | | | (a) Interest Expended | 5.7 | 5.3 | - | - | | | (b) Operating Expenses | 2.5 | 2.2 | - | - | | | of which, Wage Bill | 1.8 | 1.6 | - | - | | | (c) Provisions and Contingencies | 0.5 | 1.0 | - | - | | F | Analytical Ratios (%) | | | - | - | | | Gross NPA Ratio | 6.8 | 8.1 | - | - | | | CRAR | 12.8 | 9.7 | - | - | Notes: 1: P: Provisional.
2: #: Financial ratios are percentages with respect to average total assets.
3. Percentage variations could be slightly different as absolute numbers have been rounded off to ₹ billion.
Source: NABARD. | XIII. Local Area Banks V.83 Since April 2016, one local area bank (LAB) which accounted for about three-fourth of the assets of all LABs, has converted into a small finance bank (SFB). This has led to significant erosion in the significance of LABs as a bank-group. At end-March 2017, the total assets of LABs were ₹7.9 billion, accounting for mere 0.01 per cent of the total assets of all SCBs (Table V.35). | Table V.35 : Profile of Local Area Banks | | (As at end-March) | | (Amount in ₹ billion) | | | 2013-14 | 2014-15 | 2015-16 | 2016-17 | | Assets | 18.8 | 23.1 | 27.6 | 7.9 | | Deposits | 16.2 | 20.1 | 23.9 | 6.4 | | Gross Advances | 10.7 | 13.2 | 15.8 | 4.7 | Note: For 2016-17, data pertain to three LABs. For earlier years, it pertains to four LABs.
Source: Off-site returns (domestic). | V.84 During 2016-17, LABs (adjusted for one LAB converting into SFB) witnessed deceleration in asset growth as compared to the previous year. At the same time, the growth in net interest income was subdued. Nonetheless, LABs managed to report positive net profits due to lower growth in operating expenses and decline in provisions and contingencies (Table V.36). V.85 LABs were established as local banks in the private sector. They were expected to bridge the gaps in credit availability and enhance and strengthen the institutional credit framework in rural and semi-urban areas. They were also expected to provide efficient and competitive financial intermediation services in their areas of operation comprising three contiguous districts. However, the LABs have inherent weaknesses owing to their small size, concentration risks, constraints in terms of uncompetitive cost structures and their inability to attract and retain professional staff due to locational disadvantages. Small finance banks were introduced as an alternative banking model to overcome some of these shortcomings and to further expand the access to institutional credit. | Table V.36: Financial Performance of Local Area Banks | | (Amount in ₹ billion) | | | Amount | Percentage Variation | | 2015-16 | 2016-17# | 2015-16 | 2016-17* | | 1. Income (i+ii) | 3.0 | 1.1 | 18.3 | 10.7 | | i) Interest Income | 2.7 | 0.9 | 17.9 | 6.7 | | ii) Other Income | 0.3 | 0.2 | 22.7 | 33.9 | | 2. Expenditure(i+ii+iii) | 2.7 | 0.9 | 20.9 | 12.0 | | i) Interest Expended | 1.7 | 0.5 | 20.7 | 12.3 | | ii) Provisions and Contingencies | 0.2 | 0.1 | 22.1 | -3.1 | | iii) Operating Expenses | 0.9 | 0.4 | 21.2 | 15.3 | | of which, Wage Bill | 0.5 | 0.2 | 20.5 | 7.4 | | Profit | | | | | | 3. Operating Profit / Loss | 0.4 | 0.2 | 4.5 | 5.0 | | ii) Net Profit / Loss | 0.3 | 0.1 | -4.0 | 1.2 | | 4. Net interest income | 1.0 | 0.4 | 13.3 | 1.7 | | 5. Total assets | 27.6 | 7.9 | 19.6 | 11.6 | | 6. Financial Ratios @ | | | | | | 7. Operating Profit | 1.6 | 2.7 | - | - | | ii) Net Profit | 1.0 | 1.5 | - | - | | iii) Income | 11.9 | 13.5 | - | - | | iv) Interest Income | 10.7 | 11.1 | - | - | | v) Other Income | 1.1 | 2.4 | - | - | | vi) Expenditure | 10.9 | 12.0 | - | - | | vii) Interest Expended | 6.6 | 5.9 | - | - | | viii) Operating Expenses | 3.6 | 5.1 | - | - | | ix) Wage Bill | 1.8 | 2.3 | - | - | | x) Provisions and Contingencies | 0.6 | 1.0 | - | - | | xi) Net Interest Income | 4.1 | 5.2 | - | - | Notes: 1. #: Data pertains to three LABs. For the previous year, it pertains to four LABs.
2. *: For 2015-16, data of three LABs were used to calculate the percentage change.
3. @: Ratios to average total assets.
4. Financial ratios for 2016-17 are calculated based on the assets of the current year only.
5. ‘Wage bill’ is taken as payments to and provisions for employees.
Source: Off-site returns. | XIV. Small Finance Banks V.86 Small finance banks (SFBs) were given licenses in 2016 with the objective of furthering financial inclusion by primarily undertaking the basic banking activities of acceptance of deposits and lending to unserved and underserved sections such as small business units; small and marginal farmers; micro and small industries; and other unorganised sector entities, through high technology-low cost operations. In this context, SFBs are required to: (i) have 25 per cent of their branches in unbanked rural centres within one year from the date of commencement of operations, (ii) have at least 50 per cent of their loan portfolios of up to ₹2.5 million, (iii) not undertake any para-banking activity, except that is allowed as per the licensing guidelines, and (iv) extend 75 per cent of their ANBC to the sectors eligible for classification as priority sector lending by the Reserve Bank. V.87 Moreover, SFBs need to comply with prudential norms and regulations of the Reserve Bank as applicable to existing commercial banks, including the requirements of maintenance of cash reserve ratio (CRR) and the SLR. No forbearance has, however, been provided for complying with the statutory provisions. The minimum capital requirement for SFBs has been set as 15 per cent of the risk weighted assets as against 10.25 per cent in case of SCBs as at end-March 2017, although CCB is not applicable to SFBs. In total, 10 SFBs have been given licenses and six SFBs have started operations by end-March 2017. It is interesting to note that eight out of the 10 licensed SFBs were operating as NBFCs in the microfinance sector. V.88 As at end-March 2017, there were 397 functioning offices of SFBs. To promote financial inclusion, SFBs have been allowed three years from the date of their commencement to align their banking networks with the new branch authorisation policy of the Reserve Bank. During this time, their existing structure as MFIs/NBFCs may continue and existing branches will be treated as banking outlets subject to the condition that at least 25 per cent of them are converted from existing MFIs must be opened in unbanked rural centres during a financial year. V.89 As regards their funding profile, borrowings constituted about 60 per cent of their liabilities, while the share of deposits was only 18 per cent. This may be because all the six SFBs were earlier operating as NBFCs, which have high reliance on borrowings from banks and other financial institutions for their operations. On the assets side, loans and advances constituted about 61 per cent of total assets (Table V.37). V.90 Of the total loans, 93.4 per cent went to the priority sector with a focus on agriculture and micro, small and medium enterprises (Table V.38). | Table V.37: Consolidated Balance Sheet of Small Finance Banks | | (Amount in ₹ billion) | | Sr. No. | Item | End-March 2017 | | 1 | Share Capital | 33 | | 2 | Reserves | 16 | | 3 | Tier II Bonds | 7 | | 4 | Deposits | 50 | | | 4.1 Current | 1 | | | 4.2 Savings | 12 | | | 4.3 Term | 36 | | 5 | Borrowings (Including Tier II Bonds) | 165 | | | 5.1 Bank | 69 | | | 5.2 Others | 97 | | 6 | Other Liabilities | 12 | | | Total Liabilities / Assets | 276 | | 7 | Cash in Hand | 2 | | 8 | Balances with RBI | 7 | | 9 | Balances with Banks and Other Financial Institutions | 24 | | 10 | Investments | 60 | | 11 | Loans and Advances (net) | 168 | | 12 | Fixed Assets | 5 | | 13 | Other Assets | 10 | Note: Based on balance sheets of six SFBs which had commenced their operations before March 31, 2017.
Source: Off-site returns. | V.91 As regards financial performance, the SFBs’ return on assets was similar to RRBs, while their asset quality was better than other bank groups (Table V.39). | Table V.38: Purpose-wise Outstanding Advances by Small Finance Banks | | (Share in percentage) | | Sr. No. | Purpose | End-March 2017 | | | Per cent to Gross Loans Outstanding | | | I | Priority | 93.4 | | | i Agriculture | 25.7 | | | ii Micro, Small and Medium Enterprises | 34.2 | | | iii Education | 0.8 | | | iv Housing | 2.6 | | | v Others | 30.2 | | II | Non-priority | 6.6 | | | Total (I+II) | 100.0 | Note: Based on balance sheets of six SFBs which had commenced their operations before March 31, 2017.
Source: Off-site returns. |
| Table V.39: Financial Performance of Small Finance Banks | | (Amount in ₹ billion) | | Sr. No. | Item | 2016-17 | | A | Income (i + ii) | 20.8 | | | i Interest Income | 17.9 | | | ii Other Income | 2.9 | | B | Expenditure (i+ii+iii) | 19.4 | | | i Interest Expended | 8.8 | | | ii Operating Expenses | 8.9 | | | of which, Wage Bill | 4.9 | | | iii Provisions and Contingencies | 1.7 | | C | Profit | | | | i Operating Profit (EBPT) | 3.1 | | | ii Net Profit (PAT) | 1.4 | | D | Total assets | 276.3 | | E | Financial ratios# | | | | i Operating Profit | 1.1 | | | ii Net Profit | 0.5 | | | iii Income (a + b) | 7.5 | | | (a) Interest Income | 6.5 | | | (b) Other Income | 1.0 | | | iv Expenditure (a+b+c) | 6.7 | | | (a) Interest Expended | 3.2 | | | (b) Operating Expenses | 3.2 | | | of which, Staff Expenses | 1.8 | | | (c) Provisions and Contingencies | 0.3 | | F | Analytical Ratios (%) | | | | Gross NPA Ratio | 1.8 | | | CRAR | 26.3 | Notes: 1. #: As per cent to total assets.
2. Percentage variations could be slightly different as absolute numbers have been rounded off to ₹ billion.
3. Based on balance sheets of six SFBs which had commenced their operations before March 31, 2017.
Source: Off-site returns. | XV. Overall Assessment V.92 During 2016-17, the banking sector remained beleaguered with worsening asset quality with implications in the form of declining profitability and lacklustre credit growth. The contribution of the banking sector to the total flow of financial resources to the commercial sector declined. Portfolio rebalancing was also observed in banks’ loan books, with a shift towards agriculture in the priority sector and services and personal loans in the non-priority sectors. Despite these impediments, banks were able to strengthen their capital positions in sync with the gradual implementation of Basel III capital requirements and remained much above the regulatory minimum. In terms of the leverage ratio, banks were in a comfortable position. V.93 Banks’ balance sheets were impacted by demonetisation, which led to a significant increase in low cost deposits and a concomitant increase in liquidity, which reduced their borrowing requirements. In the face of low credit off-take, banks deployed resources in money market instruments and non-SLR investments. Off-balance sheet exposures of banks recovered from negative growth in the previous year. Notwithstanding positive tail winds in the form of low cost funds made available post-demonetisation, the financial performance of banks, especially PSBs, was weighed down by high provisioning on account of NPAs. As a result, PSBs reported net losses for the second year in a row. V.94 With the ongoing third phase of the financial inclusion plan and the fillip provided by the PMJDY, further progress was made towards the goal of universal financial inclusion. With the latest branch authorisation policy that recognises BCs, which provide banking services for a minimum of 4 hours per day and for at least 5 days a week, as a banking outlet, the importance of technology in banking services is going to increase further. Operationalisation of SFBs and payments banks is expected to further expand the geographical penetration of banking services at low cost in an affordable manner, providing further impetus to the financial inclusion agenda. Further, the introduction of innovative products for digital payments and their facilitation through various incentives by the Government is also expected to provide a boost to the objective of a ‘less-cash’ society. At the same time, to ensure that bank customers are treated fairly, the Reserve Bank further strengthened the Banking Ombudsman Scheme. V.95 Looking ahead, it is expected that through new institutional mechanisms such as the IBC, the Government and the Reserve Bank’s resolve to collectively address the problem of stressed assets and banks’ own efforts toward improving efficiency, credit monitoring, risk management and internal accruals, they will be able to overcome the strains on lending capacity and efficiently perform their role as financial intermediaries. In this direction, the Government’s initiative in the form of an ‘Alternativ e Mechanism’ for consolidation of PSBs will help create strong and efficient banks. Nonetheless, banks will have to adapt and adjust to the rapidly evolving financial environment brought about by the entry of niche players and emerging financial technologies.
|