The March 2017 round of the Inflation Expectations Survey of Households (IESH)1 was conducted by the Reserve Bank in 18 cities. The results are based on responses received from 5,084 urban households covering various occupational categories (Table 1). Highlights: -
A higher proportion of respondents expect the general level of prices to increase in the next three months and over one year ahead as compared with the December 2016 round across all product groups (Table 2). -
Among the respondents (around 74 per cent) who expect the general level of prices to increase in the next three months, nearly half of them expect prices to rise at more than the current rate across all product groups (Table 2). -
Across occupation categories, three months ahead and one year ahead median inflation rates moved up by 20 and 50 basis points, respectively, in contrast to the sharp decline observed in the two preceding rounds (Table 4 and Chart 1). -
Inflation expectations fell sharply in Guwahati and Ranchi, whereas they rose markedly in Raipur and Thiruvananthapuram. 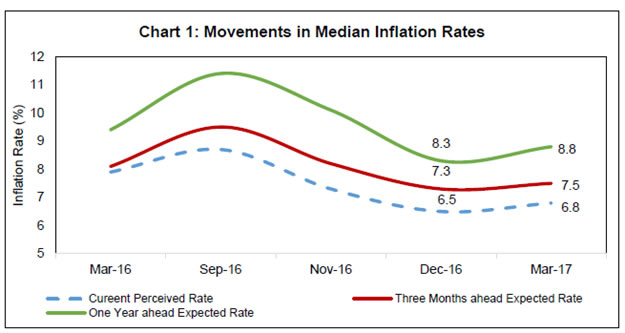
| Table 1: Respondents’ Profile (Category): Share in Total Sample - March 2017 | | Category of Respondents | Share in Total (%) | Target Share (%) | | Financial Sector Employees | 9.6 | 10.0 | | Other Employees | 15.4 | 15.0 | | Self-employed | 20.4 | 20.0 | | Housewives | 29.2 | 30.0 | | Retired Persons | 9.5 | 10.0 | | Daily Workers | 10.4 | 10.0 | | Others | 5.4 | 5.0 |
| Table 2: Product-wise Expectations of Prices for Three Months ahead and One Year ahead | | (Percentage of respondents) | | Round | Mar-16 | Sep-16 | Nov-16 | Dec-16 | Mar-17 | Mar-16 | Sep-16 | Nov-16 | Dec-16 | Mar-17 | | Options: General | Three Months Ahead | One Year Ahead | | Prices will increase | 79.7 | 78.6 | 76.0 | 59.9 | 73.8 | 89.5 | 86.2 | 86.3 | 68.1 | 81.0 | | Price increase more than current rate | 31.4 | 47.0 | 40.1 | 28.9 | 37.9 | 37.4 | 55.0 | 49.8 | 35.2 | 44.5 | | Price increase similar to current rate | 26.4 | 18.5 | 23.9 | 23.0 | 27.3 | 31.6 | 20.4 | 25.1 | 24.9 | 28.5 | | Price increase less than current rate | 21.9 | 13.0 | 12.0 | 8.0 | 8.6 | 20.6 | 10.8 | 11.4 | 8.0 | 8.0 | | No change in prices | 16.6 | 15.7 | 18.8 | 26.9 | 21.5 | 7.5 | 9.2 | 10.0 | 19.8 | 13.6 | | Decline in prices | 3.7 | 5.8 | 5.2 | 13.3 | 4.7 | 2.9 | 4.6 | 3.7 | 12.2 | 5.4 | | Options: Food Product | Three Months Ahead | One Year Ahead | | Prices will increase | 81.1 | 74.7 | 71.2 | 61.2 | 74.2 | 88.3 | 83.1 | 82.0 | 66.4 | 78.0 | | Price increase more than current rate | 30.3 | 42.8 | 35.2 | 30.3 | 39.5 | 34.7 | 51.1 | 43.0 | 32.2 | 39.7 | | Price increase similar to current rate | 29.0 | 19.3 | 23.2 | 19.6 | 24.7 | 32.8 | 20.5 | 26.5 | 24.1 | 29.0 | | Price increase less than current rate | 21.8 | 12.6 | 12.9 | 11.3 | 9.9 | 20.9 | 11.5 | 12.5 | 10.1 | 9.3 | | No change in prices | 14.3 | 16.6 | 21.2 | 17.1 | 16.5 | 8.5 | 10.8 | 13.3 | 16.6 | 12.8 | | Decline in prices | 4.6 | 8.6 | 7.6 | 21.7 | 9.3 | 3.2 | 6.1 | 4.6 | 17.1 | 9.2 | | Options: Non-Food Product | Three Months Ahead | One Year Ahead | | Prices will increase | 70.8 | 63.2 | 57.9 | 57.8 | 69.6 | 81.4 | 72.1 | 70.9 | 62.2 | 72.3 | | Price increase more than current rate | 23.4 | 35.2 | 28.4 | 27.4 | 34.1 | 26.6 | 42.8 | 34.5 | 29.2 | 35.1 | | Price increase similar to current rate | 26.6 | 16.7 | 19.2 | 20.6 | 25.1 | 32.1 | 18.3 | 24.0 | 23.3 | 27.5 | | Price increase less than current rate | 20.8 | 11.3 | 10.3 | 9.7 | 10.4 | 22.7 | 11.0 | 12.3 | 9.7 | 9.7 | | No change in prices | 24.6 | 29.3 | 36.3 | 26.2 | 23.6 | 14.9 | 20.5 | 24.0 | 23.5 | 20.3 | | Decline in prices | 4.6 | 7.6 | 5.8 | 16.0 | 6.8 | 3.7 | 7.4 | 5.2 | 14.4 | 7.4 | | Options: Household Durables | Three Months Ahead | One Year Ahead | | Prices will increase | 70.9 | 54.1 | 51.5 | 44.6 | 54.2 | 80.0 | 68.1 | 67.6 | 52.7 | 60.8 | | Price increase more than current rate | 22.5 | 30.3 | 24.9 | 20.9 | 27.2 | 28.7 | 39.6 | 33.9 | 24.8 | 29.7 | | Price increase similar to current rate | 27.0 | 13.9 | 16.8 | 16.4 | 19.3 | 30.2 | 17.8 | 22.3 | 18.9 | 22.8 | | Price increase less than current rate | 21.4 | 9.9 | 9.9 | 7.3 | 7.6 | 21.1 | 10.8 | 11.4 | 9.0 | 8.3 | | No change in prices | 20.5 | 32.3 | 36.9 | 32.5 | 30.8 | 13.7 | 21.8 | 22.9 | 27.0 | 25.3 | | Decline in prices | 8.6 | 13.6 | 11.6 | 22.9 | 15.1 | 6.3 | 10.1 | 9.4 | 20.3 | 13.9 | | Options: Housing Prices | Three Months Ahead | One Year Ahead | | Prices will increase | 78.3 | 68.7 | 65.4 | 44.6 | 56.7 | 86.0 | 79.1 | 79.6 | 54.0 | 68.7 | | Price increase more than current rate | 40.7 | 44.4 | 38.4 | 24.8 | 32.4 | 47.8 | 54.8 | 49.6 | 29.6 | 39.3 | | Price increase similar to current rate | 22.7 | 15.2 | 17.9 | 13.1 | 16.9 | 24.2 | 15.7 | 20.5 | 16.7 | 21.5 | | Price increase less than current rate | 15.0 | 9.1 | 9.0 | 6.6 | 7.4 | 14.0 | 8.5 | 9.6 | 7.7 | 8.0 | | No change in prices | 14.8 | 22.3 | 26.4 | 21.5 | 24.9 | 8.1 | 13.0 | 13.9 | 18.0 | 16.9 | | Decline in prices | 6.8 | 9.1 | 8.2 | 33.9 | 18.4 | 6.0 | 7.9 | 6.5 | 28.0 | 14.3 | | Options: Cost of Services | Three Months Ahead | One Year Ahead | | Prices will increase | 76.1 | 64.5 | 61.3 | 57.6 | 67.0 | 87.0 | 81.9 | 80.7 | 66.8 | 77.4 | | Price increase more than current rate | 29.6 | 36.9 | 30.6 | 27.1 | 33.6 | 37.4 | 49.3 | 41.5 | 32.6 | 38.5 | | Price increase similar to current rate | 26.8 | 17.6 | 19.8 | 21.0 | 23.8 | 29.5 | 21.3 | 26.9 | 23.7 | 28.5 | | Price increase less than current rate | 19.7 | 10.0 | 10.8 | 9.5 | 9.7 | 20.1 | 11.4 | 12.3 | 10.5 | 10.4 | | No change in prices | 20.2 | 30.3 | 36.0 | 29.8 | 27.5 | 10.0 | 13.6 | 16.7 | 22.3 | 17.4 | | Decline in prices | 3.7 | 5.2 | 2.8 | 12.6 | 5.6 | 3.1 | 4.5 | 2.6 | 10.9 | 5.2 |
| Table 3: Households Expecting General Price Movements in Coherence with Movements in Price Expectations of Various Product Groups: Three Months Ahead and One Year Ahead | | (Percentage of respondents) | | Round No. | Survey period ended | Food | Non-Food | Households durables | Housing | Cost of services | | Three Months Ahead | | 43 | Mar-16 | 69.6 | 63.2 | 59.1 | 58.7 | 64.6 | | 45 | Sep-16 | 62.6 | 52.2 | 46.2 | 50.1 | 49.3 | | 45B | Nov-16 | 62.1 | 50.2 | 43.2 | 45.7 | 46.8 | | 46 | Dec-16 | 55.4 | 55.8 | 48.5 | 47.0 | 57.7 | | 47 | Mar-17 | 57.1 | 56.7 | 48.1 | 48.3 | 57.7 | | One Year Ahead | | 43 | Mar-16 | 73.1 | 67.4 | 66.6 | 63.9 | 69.2 | | 45 | Sep-16 | 67.9 | 56.5 | 52.5 | 57.1 | 58.4 | | 45B | Nov-16 | 65.0 | 55.0 | 50.4 | 53.7 | 56.9 | | 46 | Dec-16 | 62.2 | 59.7 | 52.8 | 51.7 | 62.3 | | 47 | Mar-17 | 62.3 | 60.4 | 51.5 | 54.6 | 64.1 |
| Table 4: Household Inflation Expectations – Current, Three Months and One Year Ahead | | Survey Round | Survey Period Ended | Inflation rate in Per cent | | Current | Three Months Ahead | One Year Ahead | | Mean | Median | Std. Dev. | Mean | Median | Std. Dev. | Mean | Median | Std. Dev. | | 43 | Mar-16 | 8.9 | 7.9 | 4.4 | 8.8 | 8.1 | 4.6 | 9.7 | 9.4 | 4.6 | | 45 | Sep-16 | 9.2 | 8.7 | 4.0 | 9.7 | 9.5 | 4.4 | 11.6 | 11.4 | 3.9 | | 45B | Nov-16 | 8.3 | 7.3 | 4.3 | 9.1 | 8.2 | 4.5 | 10.5 | 10.1 | 4.3 | | 46 | Dec-16 | 7.4 | 6.5 | 3.9 | 7.9 | 7.3 | 4.1 | 8.7 | 8.3 | 4.3 | | 47 | Mar-17 | 7.8 | 6.8 | 4.0 | 8.2 | 7.5 | 4.1 | 9.3 | 8.8 | 4.2 |
| Table 5: Factors that Explain the Total Variability | | Round No. | Survey Period Ended | Current | Three Months Ahead | One Year Ahead | | 43 | Mar-16 | City, Age-Group | City | City, Category | | 45 | Sep-16 | City, Age-Group | City, Age-Group | City | | 45B | Nov-16 | City, Category, Age-Group | City, Category | City, Category | | 46 | Dec-16 | City, Gender, Age-Group | City, Category, Age-Group | City, Category | | 47 | Mar-17 | City, Age-Group | City, Category | City, Category |
| Table 6 : Various Group-wise Inflation Expectations: March 2017 | | | Current | Three Months Ahead | One Year Ahead | | Mean | Median | Std. Dev. | Mean | Median | Std. Dev. | Mean | Median | Std. Dev. | | Overall | 7.8 | 6.8 | 4.0 | 8.2 | 7.5 | 4.1 | 9.3 | 8.8 | 4.2 | | Gender-wise | | Male | 7.9 | 6.9 | 4.0 | 8.3 | 7.6 | 4.1 | 9.2 | 8.7 | 4.3 | | Female | 7.6 | 6.5 | 4.0 | 8.1 | 7.4 | 4.1 | 9.4 | 8.9 | 4.1 | | Category-wise | | Financial Sector Employees | 7.5 | 6.7 | 3.6 | 7.9 | 7.3 | 3.7 | 8.8 | 8.2 | 4.0 | | Other Employees | 7.8 | 6.9 | 4.0 | 8.2 | 7.5 | 4.2 | 9.3 | 8.8 | 4.3 | | Self Employed | 7.9 | 6.9 | 4.1 | 8.2 | 7.5 | 4.3 | 9.2 | 8.7 | 4.4 | | Housewives | 7.7 | 6.6 | 4.1 | 8.1 | 7.4 | 4.1 | 9.3 | 8.9 | 4.0 | | Retired Persons | 8.0 | 6.9 | 4.2 | 8.5 | 7.8 | 4.2 | 9.6 | 9.3 | 4.2 | | Daily Workers | 7.9 | 6.9 | 4.1 | 8.4 | 7.8 | 4.1 | 9.6 | 9.4 | 4.3 | | Other category | 7.4 | 6.4 | 3.9 | 7.8 | 7.2 | 4.0 | 9.1 | 8.6 | 4.3 | | Age Group-wise | | Up to 25 years | 7.2 | 6.4 | 3.6 | 7.7 | 7.3 | 3.7 | 8.9 | 8.6 | 3.9 | | 25 to 30 years | 7.7 | 6.6 | 4.0 | 8.0 | 7.4 | 4.1 | 9.1 | 8.6 | 4.1 | | 30 to 35 years | 7.8 | 6.9 | 4.0 | 8.2 | 7.5 | 4.2 | 9.3 | 8.9 | 4.3 | | 35 to 40 years | 7.7 | 6.6 | 4.0 | 8.1 | 7.4 | 4.2 | 9.3 | 8.9 | 4.2 | | 40 to 45 years | 7.8 | 6.7 | 4.2 | 8.5 | 7.7 | 4.2 | 9.5 | 8.9 | 4.4 | | 45 to 50 years | 8.0 | 6.9 | 4.0 | 8.3 | 7.5 | 4.0 | 9.5 | 8.9 | 4.0 | | 50 to 55 years | 8.6 | 7.6 | 4.3 | 8.8 | 8.0 | 4.3 | 9.7 | 9.4 | 4.4 | | 55 to 60 years | 8.2 | 7.1 | 4.3 | 8.6 | 7.9 | 4.4 | 9.4 | 9.0 | 4.5 | | 60 years and above | 8.0 | 7.0 | 4.2 | 8.5 | 7.7 | 4.4 | 9.7 | 9.2 | 4.3 | | City-wise | | Ahmedabad | 8.9 | 8.5 | 3.5 | 10.0 | 9.8 | 3.6 | 11.2 | 10.7 | 3.9 | | Bengaluru | 4.7 | 5.0 | 1.7 | 3.7 | 3.2 | 2.1 | 5.3 | 5.3 | 2.0 | | Bhopal | 6.9 | 5.7 | 3.8 | 8.6 | 7.8 | 3.7 | 10.3 | 10.4 | 3.9 | | Bhubaneswar | 6.5 | 5.6 | 3.9 | 7.3 | 6.8 | 4.5 | 8.0 | 7.4 | 4.8 | | Chennai | 8.0 | 6.7 | 4.4 | 9.5 | 8.8 | 4.1 | 11.5 | 10.9 | 3.8 | | Delhi | 6.6 | 6.2 | 2.4 | 6.9 | 6.8 | 2.4 | 7.9 | 7.7 | 2.8 | | Guwahati | 11.1 | 11.8 | 5.7 | 9.1 | 8.9 | 6.0 | 9.8 | 10.9 | 6.3 | | Hyderabad | 6.8 | 6.7 | 1.3 | 7.4 | 7.3 | 1.4 | 8.4 | 8.3 | 1.9 | | Jaipur | 8.3 | 8.0 | 3.4 | 9.1 | 8.9 | 3.7 | 10.2 | 10.2 | 3.8 | | Kolkata | 9.4 | 8.5 | 4.6 | 10.0 | 9.1 | 4.4 | 10.7 | 10.1 | 4.1 | | Lucknow | 6.5 | 6.2 | 4.2 | 7.7 | 7.4 | 4.7 | 8.5 | 8.3 | 4.6 | | Mumbai | 7.7 | 6.9 | 3.2 | 8.2 | 7.5 | 3.2 | 8.5 | 8.0 | 3.6 | | Nagpur | 7.4 | 5.9 | 3.9 | 7.8 | 7.2 | 4.1 | 9.4 | 9.0 | 4.4 | | Patna | 6.4 | 6.1 | 1.7 | 6.8 | 6.8 | 2.0 | 8.1 | 8.2 | 2.2 | | Thiruvananthapuram | 10.6 | 10.4 | 4.3 | 10.0 | 10.3 | 4.4 | 11.7 | 12.4 | 4.5 | | Chandigarh | 9.5 | 7.9 | 4.1 | 9.2 | 8.5 | 4.4 | 9.8 | 9.2 | 4.4 | | Ranchi | 4.8 | 4.6 | 1.6 | 5.0 | 5.0 | 2.2 | 6.8 | 6.6 | 2.3 | | Raipur | 9.3 | 9.3 | 4.1 | 9.6 | 9.7 | 4.5 | 10.0 | 10.1 | 4.4 |
| Table 7: Cross-tabulation of Current and Three Months Ahead Inflation Expectations: March 2017 | | (Number of respondents) | | Three Months Ahead Inflation Rate (per cent) | | Current Inflation Rate (per cent) | | <1 | 1-<2 | 2-<3 | 3-<4 | 4-<5 | 5-<6 | 6-<7 | 7-<8 | 8-<9 | 9-<10 | 10-<11 | 11-<12 | 12-<13 | 13-<14 | 14-<15 | 15-<16 | >=16 | No idea | Total | | <1 | 33 | 13 | 18 | 7 | 4 | 10 | 0 | 1 | 0 | 1 | 4 | 0 | 0 | 0 | 0 | 0 | 0 | 1 | 92 | | 1-<2 | 2 | 16 | 32 | 10 | 2 | 0 | 0 | 1 | 0 | 0 | 0 | 0 | 0 | 0 | 0 | 0 | 0 | 0 | 63 | | 2-<3 | 4 | 21 | 64 | 68 | 29 | 27 | 4 | 0 | 0 | 0 | 1 | 0 | 0 | 0 | 0 | 0 | 0 | 0 | 218 | | 3-<4 | 5 | 13 | 22 | 67 | 88 | 52 | 20 | 2 | 1 | 1 | 1 | 1 | 0 | 0 | 0 | 0 | 0 | 5 | 278 | | 4-<5 | 8 | 15 | 29 | 23 | 86 | 130 | 82 | 29 | 9 | 3 | 1 | 0 | 0 | 0 | 0 | 0 | 0 | 3 | 418 | | 5-<6 | 9 | 23 | 44 | 41 | 41 | 274 | 266 | 229 | 69 | 11 | 51 | 1 | 4 | 0 | 0 | 2 | 2 | 9 | 1076 | | 6-<7 | 2 | 8 | 17 | 6 | 7 | 29 | 170 | 184 | 71 | 14 | 9 | 2 | 3 | 0 | 0 | 0 | 0 | 1 | 523 | | 7-<8 | 8 | 5 | 8 | 5 | 3 | 7 | 19 | 194 | 203 | 73 | 47 | 5 | 3 | 3 | 2 | 0 | 0 | 6 | 591 | | 8-<9 | 1 | 3 | 1 | 1 | 1 | 6 | 3 | 9 | 99 | 109 | 68 | 14 | 5 | 3 | 1 | 2 | 1 | 5 | 332 | | 9-<10 | 3 | 3 | 0 | 1 | 3 | 5 | 3 | 6 | 11 | 50 | 57 | 23 | 18 | 1 | 3 | 2 | 2 | 9 | 200 | | 10-<11 | 4 | 7 | 6 | 3 | 2 | 23 | 2 | 9 | 8 | 4 | 123 | 60 | 103 | 29 | 4 | 89 | 17 | 2 | 495 | | 11-<12 | 3 | 1 | 2 | 1 | 1 | 0 | 0 | 1 | 0 | 0 | 1 | 22 | 27 | 10 | 6 | 5 | 4 | 5 | 89 | | 12-<13 | 2 | 0 | 0 | 0 | 1 | 0 | 0 | 0 | 0 | 1 | 1 | 0 | 8 | 8 | 10 | 6 | 3 | 0 | 40 | | 13-<14 | 0 | 0 | 2 | 1 | 0 | 0 | 0 | 0 | 1 | 0 | 0 | 0 | 1 | 9 | 7 | 8 | 3 | 1 | 33 | | 14-<15 | 1 | 1 | 2 | 0 | 0 | 0 | 0 | 0 | 0 | 0 | 0 | 0 | 0 | 0 | 17 | 12 | 5 | 3 | 41 | | 15-<16 | 2 | 1 | 1 | 3 | 1 | 4 | 1 | 0 | 0 | 0 | 9 | 1 | 1 | 2 | 0 | 44 | 37 | 14 | 121 | | >=16 | 3 | 2 | 7 | 6 | 3 | 9 | 4 | 4 | 2 | 0 | 23 | 0 | 2 | 0 | 1 | 10 | 350 | 48 | 474 | | Total | 90 | 132 | 255 | 243 | 272 | 576 | 574 | 669 | 474 | 267 | 396 | 129 | 175 | 65 | 51 | 180 | 424 | 112 | 5084 |
| Table 8: Cross-tabulation of Current and One Year Ahead Inflation Expectations: March 2017 | | (Number of respondents) | | One Year Ahead Inflation Rate (per cent) | | Current Inflation Rate (per cent) | | <1 | 1-<2 | 2-<3 | 3-<4 | 4-<5 | 5-<6 | 6-<7 | 7-<8 | 8-<9 | 9-<10 | 10-<11 | 11-<12 | 12-<13 | 13-<14 | 14-<15 | 15-<16 | >=16 | No idea | Total | | <1 | 23 | 12 | 7 | 10 | 7 | 15 | 1 | 2 | 0 | 1 | 7 | 0 | 2 | 0 | 0 | 1 | 2 | 2 | 92 | | 1-<2 | 2 | 14 | 25 | 8 | 3 | 4 | 2 | 1 | 0 | 1 | 2 | 0 | 1 | 0 | 0 | 0 | 0 | 0 | 63 | | 2-<3 | 2 | 14 | 30 | 48 | 44 | 31 | 17 | 11 | 5 | 1 | 12 | 0 | 1 | 0 | 0 | 1 | 0 | 1 | 218 | | 3-<4 | 2 | 3 | 17 | 36 | 55 | 58 | 36 | 25 | 16 | 6 | 8 | 0 | 7 | 1 | 1 | 0 | 0 | 7 | 278 | | 4-<5 | 2 | 6 | 11 | 18 | 51 | 85 | 75 | 59 | 52 | 24 | 18 | 3 | 8 | 0 | 0 | 1 | 1 | 4 | 418 | | 5-<6 | 18 | 17 | 15 | 26 | 35 | 141 | 182 | 178 | 140 | 61 | 167 | 12 | 20 | 5 | 5 | 30 | 9 | 15 | 1076 | | 6-<7 | 1 | 4 | 3 | 9 | 9 | 39 | 76 | 127 | 104 | 59 | 54 | 9 | 11 | 3 | 1 | 6 | 5 | 3 | 523 | | 7-<8 | 8 | 5 | 4 | 7 | 13 | 16 | 16 | 76 | 157 | 114 | 97 | 20 | 19 | 5 | 6 | 12 | 6 | 10 | 591 | | 8-<9 | 1 | 3 | 3 | 2 | 5 | 5 | 4 | 6 | 40 | 61 | 103 | 20 | 33 | 13 | 8 | 14 | 8 | 3 | 332 | | 9-<10 | 2 | 1 | 1 | 2 | 1 | 1 | 4 | 9 | 5 | 27 | 44 | 31 | 28 | 12 | 7 | 9 | 7 | 9 | 200 | | 10-<11 | 5 | 5 | 1 | 4 | 2 | 11 | 3 | 8 | 7 | 9 | 81 | 35 | 60 | 25 | 21 | 118 | 87 | 13 | 495 | | 11-<12 | 3 | 0 | 0 | 1 | 1 | 0 | 0 | 1 | 0 | 3 | 1 | 10 | 25 | 10 | 8 | 8 | 13 | 5 | 89 | | 12-<13 | 1 | 0 | 0 | 0 | 0 | 0 | 1 | 0 | 1 | 0 | 1 | 0 | 8 | 3 | 6 | 8 | 10 | 1 | 40 | | 13-<14 | 0 | 0 | 0 | 0 | 0 | 0 | 0 | 0 | 1 | 0 | 0 | 1 | 0 | 2 | 7 | 7 | 12 | 3 | 33 | | 14-<15 | 1 | 0 | 0 | 1 | 1 | 1 | 0 | 0 | 0 | 0 | 0 | 0 | 0 | 1 | 8 | 14 | 9 | 5 | 41 | | 15-<16 | 2 | 2 | 0 | 0 | 0 | 2 | 1 | 1 | 0 | 2 | 8 | 1 | 3 | 0 | 1 | 30 | 47 | 21 | 121 | | >=16 | 7 | 0 | 5 | 3 | 5 | 9 | 2 | 1 | 1 | 4 | 12 | 0 | 0 | 0 | 3 | 13 | 353 | 56 | 474 | | Total | 80 | 86 | 122 | 175 | 232 | 418 | 420 | 505 | 529 | 373 | 615 | 142 | 226 | 80 | 82 | 272 | 569 | 158 | 5084 |
|