Introduction 4.1 Non-banking financial institutions (NBFIs) consist of various types of financial institutions, of which Reserve Bank of India regulates and supervises three important categories – all India financial institutions (AIFIs), non-banking finance companies (NBFCs) and stand-alone primary dealers (PDs). While AIFIs largely undertake long-term financing in specific sectors, NBFCs specialise in meeting the credit needs of niche areas such as hire purchase, financing of physical assets, commercial vehicles and infrastructure loans. PDs perform an important role as market makers for government securities in both primary and secondary markets. This chapter presents an analysis of the financial performance of each of these entities of NBFIs in 2015-16. I. All India financial institutions (AIFIs) 4.2 As at end-March 2016, there were four AIFIs under the Reserve Bank’s full-fledged regulation and supervision viz. the Export Import Bank of India (EXIM Bank), National Bank for Agriculture and Rural Development (NABARD), National Housing Bank (NHB) and Small Industries Development Bank of India (SIDBI). Balance sheet 4.3 The consolidated balance sheet of AIFIs increased by 13.3 per cent during 2015-16 (Table 4.1). On the asset side, loans and advances, with a growth of 11.4 per cent during 2015-16, was the largest component. On the liability side, deposits showed only a modest growth of 3.4 per cent while resources raised through bonds and debentures expanded by 16.7 per cent during the year. | Table 4.1: Liabilities and assets of financial institutions | | (Amount in ₹ million) | | Item | 2015 | 2016 | Percentage Variation | | Liabilities | | 1. Capital | 109,594
(2.21) | 135,963
(2.42) | 24.0 | | 2. Reserves | 381,197
(7.69) | 435,017
(7.75) | 14.1 | | 3. Bonds and Debentures | 1,187,625
(23.96) | 1,385,767
(24.69) | 16.7 | | 4. Deposits | 2,309,436
(46.60) | 2,387,282
(42.53) | 3.4 | | 5. Borrowings | 469,271
(9.47) | 741,117
(13.2) | 57.9 | | 6. Other Liabilities | 499,011
(10.07) | 528,285
(9.41) | 5.9 | | Total Liabilities or Assets | 4,956,133 | 5,613,432 | 13.3 | | Assets | | 1. Cash and Bank Balances | 205,305
(4.14) | 272,872
(4.86) | 32.9 | | 2. Investments | 323,585
(6.53) | 421,663
(7.51) | 30.3 | | 3. Loans and Advances | 4,273,155
(86.22) | 4,761,769
(84.83) | 11.4 | | 4. Bills Discounted/ Rediscounted | 35,736
(0.72) | 26,383
(0.47) | -26.2 | | 5. Fixed Assets | 6,584
(0.13) | 6,922
(0.12) | 5.1 | | 6. Other Assets | 111,769
(2.26) | 123,822
(2.21) | 10.8 | Notes: i. Data pertain to four FIs viz. EXIM Bank, NABARD, NHB and SIDBI. Data for EXIM Bank, NABARD and SIDBI for end -March and end-June for NHB.
ii. Figures in parenthesis are percentages to total liabilities or assets.
Source: 1. Audited OSMOS returns of EXIM Bank, NABARD and SIDBI for end-March 2015 and 2016, respectively.
2. Audited OSMOS returns of NHB for end-June 2015 and 2016, respectively. | Financial performance 4.4 On the back of strong growth in interest income, AIFIs registered a double-digit growth in income during 2015-16 despite a significant decline in non-interest income (Table 4.2). With the growth in expenditure exceeding income, the major indicators of profitability, such as operating profits and net profits showed a decline during the year. | Table 4.2: Financial performance of AIFIs | | (Amount in ₹ million) | | | 2014-15 | 2015-16 | Variation | | Amount | Percentage | | A) Income (a+ b) | 350,113 | 395,084 | 44,971 | 12.84 | | a) Interest Income | 333,694
(95.31) | 385,641
(97.61) | 51,947 | 15.57 | | b) Non-Interest Income | 16419
(4.69) | 9443
(2.39) | -6,976 | -42.49 | | B) Expenditure (a+ b) | 262,646 | 300,667 | 38,021 | 14.48 | | a) Interest Expenditure | 243,332
(92.65) | 278,544
(92.64) | 35,212 | 14.47 | | b) Operating Expenses | 19,314
(7.35) | 22,123
(7.36) | 2,809 | 14.54 | | of which Wage Bill | 13,624 | 15,381 | 1,757 | 12.90 | | C) Profit | | | | | | Operating Profit (Profit Before Tax) | 78,339 | 69,722 | -8,617 | -11.00 | | Net Profit (Profit After Tax) | 52,930 | 48,088 | -4,842 | -9.15 | Note: Figures in parenthesis are percentages to total income/expenditure.
Source: 1. Audited OSMOS returns of EXIM Bank, NABARD and SIDBI for March 31, 2015 and 2016, respectively.
2. Audited OSMOS returns of NHB for end-June 2015 and 2016, respectively. | Return on assets (RoA) 4.5 During the year, the return on assets (RoA) of all the four AIFIs showed deterioration, partially due to increasing operating costs (Chart 4.1). RoA was the highest for SIDBI followed by NHB, NABARD and EXIM Bank. Capital adequacy 4.6 AIFIs’ capital adequacy witnessed marginal deterioration during 2015-16. The capital adequacy position of EXIM Bank and SIDBI deteriorated while that of NABARD and NHB improved (Chart 4.2). Yet, all the four AIFIs maintained CRAR higher than the minimum regulatory requirement of 9 per cent. Asset quality 4.7 The asset quality of AIFIs deteriorated marginally as net NPAs as percentage to net loans increased from 0.26 per cent in 2014-15 to 0.29 per cent in 2015-16 (Chart 4.3). NHB and SIDBI’s asset quality improved whereas that of EXIM Bank witnessed deterioration. EXIM Bank also had the largest quantum of net NPAs among the AIFIs. II. Non-banking financial companies 4.8 NBFCs are categorised into two types on the basis of their liability structure: deposit-taking NBFCs (NBFCs-D) and non-deposit taking NBFCs (NBFCs-ND). As at end-March 2016, there were 11,682 NBFCs registered with the Reserve Bank out of which 202 were NBFCs-D and 11,480 were NBFCs- ND entities. There were 209 systemically important non-deposit taking NBFCs (NBFCs-ND-SI), which are subject to more stringent prudential norms and provisioning requirements. 4.9 Amidst the consolidation process, which reduced the number of both NBFCs-D and NBFCs-NDSI registered with the Reserve Bank, the asset side of NBFCs continued to register significant growth. The ownership pattern of NBFCs-D and NBFCs-ND-SI is given in Table 4.3. | Table 4.3: Ownership pattern of NBFCs (number of companies) | | Ownership | 2015
NBFCs-D | 2016
NBFCs-D | 2015
NBFCs-ND-SI | 2016
NBFCs-ND-SI | | A. Government Companies | 7 | 5 | 10 | 16 | | | (3.2) | (2.5) | (5.0) | (7.7) | | B. Non-Government Companies | 211 | 194 | 190 | 193 | | | (95.9) | (97.5) | (95.0) | (92.3) | | 1. Public Limited Companies | 209 | 188 | 105 | 105 | | | (95.0) | (94.5) | (52.5) | (50.2) | | 2. Private Limited Companies | 2 | 6 | 85 | 88 | | | (0.9) | (3.0) | (42.5) | (42.1) | | Total No. of Companies (A)+(B) | 220 | 199 | 200 | 209 | | | (100.0) | (100) | (100.0) | (100) | Note: Figures in parenthesis represent % to total number of NBFCs. NBFCs-ND-SI means non-deposit taking NBFCs having asset size more than or equal to ₹500 crore.
Source: Department of Non-Banking Supervision, RBI. | 4.10 While banks witnessed subdued credit growth in sectors constrained by asset quality stress, NBFCs did well. The NBFC sector registered a 15.5 per cent credit growth during 2015-16 as against an increase of 9.1 per cent in non-food credit by commercial banks. The quality of assets of the NBFC sector has been deteriorating since 2012. However, the NPAs of NBFCs remained relatively lower than the NPAs of the banking sector (Chart 4.4). 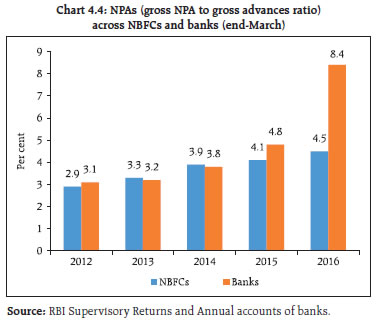 4.11 The Reserve Bank initialized a new category of NBFCs as NBFC-account aggregators (AAs) in September 2016 with a view to facilitating a consolidated view of individual investors’ financial asset holdings, especially when the entities fall under the purview of different financial sector regulators. AAs fill this gap by collecting and providing information about a customer’s financial assets in a consolidated, organised and retrievable manner to the customer or any other person as per the instructions of the customer. Further, as peer-to-peer (P2P) lending is gathering momentum globally and also taking roots in India, the Reserve Bank is in the process of bringing this under its regulatory ambit. II-A. Deposit-taking NBFCs (NBFCs-D) 4.12 As a matter of deliberate policy, the Reserve Bank has been discouraging NBFCs from engaging in public deposit mobilisation activities. This is being done with a view to protecting depositors’ interests and for fostering financial stability. Regulations for NBFCs-D have been strengthened so that only sound and well-functioning entities are able to accept deposits. Balance sheet 4.13 NBFCs-Ds’ balance sheet expanded by 29.2 per cent during 2015-16 (Table 4.4). On the asset side, loans and advances, which constituted close to 90 per cent of the assets, registered significant growth and NBFCs-Ds’ investment activities also witnessed an increase during the year. Borrowings from banks still constituted the largest source of funding for NBFCs-D. Mobilisation of funds through debentures, the second major source of funding, increased by 38.6 per cent during the year. Table 4.4: Consolidated balance sheet of NBFCs-D
(as at end-March) | | (Amount in ₹ billion) | | Items | 2015 | 2016 P | Variation
(Per cent) | | 1 | 2 | 3 | 4 | | 1. Share Capital | 31 | 34 | 9.2 | | 2. Reserves & Surplus | 258 | 337 | 30.9 | | 3. Public Deposits | 270 | 379 | 40.6 | | 4. Debentures | 389 | 539 | 38.6 | | 5. Bank Borrowings | 552 | 659 | 19.3 | | 6. Borrowings from FIs | 16 | 23 | 43.1 | | 7. Inter-Corporate Borrowings | 2 | 6 | 283.3 | | 8. Commercial Papers | 58 | 66 | 13.8 | | 9. Borrowings from the Government | 38 | 30 | -21.3 | | 10. Subordinated Debts | 76 | 88 | 15.6 | | 11. Other Borrowings | 157 | 224 | 42.2 | | Total Liabilities/Assets | 1,847 | 2,386 | 29.2 | | 1. Loans & Advances | 1,590 | 2,117 | 33.1 | | 2. Investments | 69 | 85 | 23.9 | | 3. Cash & Bank Balances | 120 | 98 | -18.7 | | 4. Other Assets | 68 | 87 | 26.7 | P: Provisional.
Note: Percentage variation in figures could be slightly different because amounts have been rounded-off to ₹ billion. The data pertain to 162 NBFCs-D companies.
Source: Quarterly returns of NBFCs-D. | Aggregate public deposits of NBFCs-D 4.14 Public deposits garnered by NBFCs-D have been showing a rising trend since 2010 (Chart 4.5). Financial performance 4.15 Income of NBFCs-D income recorded a growth of 26.8 per cent during the year, contributing to higher operating and net profits, despite higher operating and other expenses (Chart 4.6). NPA position of NBFCs-D 4.16 During 2015-16, NBFCs-Ds’ NPAs as reflected by gross NPAs, further deteriorated (4.9 per cent) (Chart 4.7). Category-wise, deterioration in asset quality was more with respect to asset finance companies (AFCs) as compared to loan companies (LCs). The NPAs were mainly concentrated in some sectors such as transport operators, agriculture and medium and large industries. II-B. Non-deposit taking systemically important NBFCs (NBFCs-ND-SI) Balance sheet 4.17 During 2015-16, NBFCs-ND-SIs’ balance sheet expanded by 10.6 per cent, a moderation from the previous year (15.9 per cent) (Table 4.5). Loans and advances extended by NBFCs-ND-SI posted a growth of 12.5 per cent during 2015-16, though this was lower than the previous year due to slow growth in credit extended by infrastructure finance companies (NBFCs-IFCs) and LCs. Table 4.5: Consolidated balance sheet of NBFCs-ND-SI
(as at end-March) | | (Amount in ₹ billion) | | Items | 2015 | 2016 P | Variation
(per cent) | | Liabilities | | | | | 1. Share Capital | 630 | 678 | 7.7 | | 2. Reserves & Surplus | 2,271 | 2,550 | 12.3 | | 3. Total Borrowings | 9,411 | 10,335 | 9.8 | | 4. Current Liabilities & Provisions | 608 | 725 | 19.3 | | Total Liabilities/ Total Assets | 12,920 | 14,288 | 10.6 | | Assets | | | | | 1. Loans & Advances | 9,516 | 10,709 | 12.5 | | 2. Investments | 2,042 | 2,052 | 0.5 | | 3. Cash & Bank Balances | 463 | 434 | -6.4 | | 4. Other Assets | 899 | 1,093 | 21.7 | P: Provisional.
Note: Data pertain to 259 entities. Percentage figures are rounded-off.
Source: Quarterly returns of NBFCs-ND-SI (₹500 crore and above). | 4.18 During the year, NBFCs-ND-SI raised funds mainly through debentures, borrowings from banks and commercial papers. Investments by NBFCs-ND-SI showed marginal growth. Asset quality 4.19 Their asset quality continued to remain stressed as their NPA ratios increased marginally vis-à-vis the previous year’s level (Chart 4.8). Among the NBFCs-ND-SI, LCs accounted for a major chunk of NPAs followed by NBFC-IFCs and AFCs. Profits of NBFCs-ND-SI witnessed a modest improvement during 2015-16 (Chart 4.9).
III. Primary dealers (PDs) 4.20 As on March 31, 2016 there were 21 PDs of which 14 were banks and the remaining seven were non-bank entities (standalone PDs) registered as NBFCs. During 2015-16, all the PDs achieved the stipulated minimum success ratio (bids accepted to the bidding commitment of 40 per cent for T-bills and cash management bills [CMBs] put together every half year) both in the first half as well as in the second half of the year. The PDs subscribed 75 per cent of the T-bills issued during 2015-16 as against 62 per cent during 2014-15. The underwriting commission paid to PDs during 2015-16 was marginally higher during the year as compared to last year. 4.21 During 2015-16, in the secondary market, all the 21 PDs had individually achieved the required minimum annual total turnover (outright and repo transactions) ratio of 5 times in G-Secs and 10 times in T-bills. Partial devolvement of the PDs took place on seven occasions for ₹109.99 billion as compared to two instances for ₹52.71 billion in 2014-15. Financial performance of standalone primary dealers 4.22 All seven standalone PDs, except Goldman Sachs (India) Capital Markets Pvt. Ltd. posted profits in 2015-16. Profit after tax (PAT) decreased on account of limited trading opportunities due to lack of fresh triggers and a relatively flat yield curve during a large part of the year (Chart 4.10). Capital adequacy position of standalone PDs 4.23 Standalone PDs held lower risk-weighted assets during the year vis-à-vis the previous year (Chart 4.11). The capital adequacy position of PDs at 41.5 per cent during the year was well above the regulatory stipulation of 15 per cent. During the year, all the PDs fulfilled all their primary and secondary market regulatory requirements. Overall assessment of the NBFC sector 4.24 The NBFC sector assumes a critical role in financial inclusion as it caters to a wide range of financial activities particularly in areas where commercial banks have limited penetration. NBFCs are expected to play a crucial role in fostering inclusive growth, especially in sectors like MSMEs. 4.25 Consolidation within the NBFC sector continued during 2015-16, resulting in a reduction in the number of both NBFCs-D and NBFCs-ND-SI. Their assets continued to register substantial growth. The accelerated growth in credit deployment by NBFCs was due to their ability to contain risks and tap demand in niche markets. The profitability of NBFCs was significantly higher as compared to commercial banks. 4.26 The NBFC sector continued to raise funds mainly through debentures, borrowings from banks and commercial papers. The Reserve Bank also eased the norms for external commercial borrowings (ECBs) for NBFCs that lend to the infrastructure sector, to raise ECBs with a minimum maturity of five years. In addition, the Reserve Bank also allowed NBFCs to raise funds through rupee denominated bonds overseas. 4.27 The quality of assets of the NBFC sector has, however, showed steady deterioration since 2012, though their NPAs have remained relatively lower than those of the banking sector. On the policy front, the revised regulatory framework for NBFCs, introduced in 2014 by the Reserve Bank of India, is beginning to be phased in to harmonise the prudential norms. |