Introduction 3.1 As at end-March 2016, India’s co-operative banking sector comprised of 1,574 urban cooperative banks (UCBs) and 93,913 rural co-operative credit institutions, including short-term and long-term credit institutions (Chart 3.1). During 2015- 16, there was a moderation in the growth of UCBs’ balance sheets. Their profitability indicators and asset quality also deteriorated. During 2014-15, the balance sheets of short term-rural co-operatives, except primary agricultural credit societies (PACS), had undergone deceleration in growth while the balance sheets of long-term rural co-operatives had exhibited accelerated growth. At the same time, there was an improvement in asset quality across all rural co-operatives even as most of them registered a decline in net profits. Urban co-operative banks 3.2 The number of UCBs came down from 1,579 in 2015 to 1,574 in 2016. While the number of scheduled multi-state UCBs increased from 29 to 31, non-scheduled single-state UCBs decreased from 1,507 to 1,502 by end-March 2016 (Chart 3.1). Balance sheet operations 3.3 Growth in assets of UCBs continued to decelerate in 2015-16 -- 9.9 per cent in 2015-16 vis-à-vis 11.2 per cent in 2014-15 (Chart 3.2). Loans and advances on the asset side grew by a lower rate of 9.2 per cent as compared to 11.9 per cent in 2014-15. On the liability side, deposits and reserves and surplus accumulated at a slower pace (10.4 per cent and 6.7 per cent respectively against 11.8 per cent and 7.4 per cent respectively in 2014-15). Profitability 3.4 UCBs witnessed a reduction in their returns on equity as well as assets in 2015-16. The net interest margin continued to narrow down (Chart 3.3). Continuing the trend of 2014-15, their total expenses grew relatively higher (8.8 per cent) than their total income (7.9 per cent). Additionally, provisions made during 2015-16 against risks/contingencies were higher by 4.6 per cent as compared to the previous year. Net profits of UCBs decelerated. Growth rate of interest income continued to shrink and was placed at 9.2 per cent in 2015-16 as against 13.2 per cent in 2014-15. Moreover, other income which rose by 7 per cent during 2014-15 recorded a decline of 8.4 per cent in 2015-16 (Chart 3.4). Asset quality 3.5 UCBs’ gross NPAs continued to increase at ahigher rate than assets. The gross NPA ratio stood at6.6 per cent at end-March 2016 as compared to 6.2per cent at end-March 2015 (Chart 3.5). While during2014-15 provisions grew at a much lower rate thanGNPAs resulting in a fall in coverage ratio to 55.8 percent from 63.9 per cent in 2013-14, commensurategrowth in provisions and GNPAs during 2015-16ensured that the coverage ratio remained stable at55.5 per cent (Chart 3.6). Developments with regard to UCBs 3.6 The number of Tier-II UCBs1 continued to increase (from 412 at end-March 2013 to 442 at end- March 2014 and further to 447 at end-March 2015). In 2015-16, in general, the number of UCBs which held larger sizes of deposits and advances continued to exhibit an increase (Chart 3.7). 3.7 The share of UCBs under the highest rated category ‘A’ under the CAMELS model, slipped from 28.4 per cent in 2014-15 to 25.8 per cent in 2015-16. The share of banking business under this category also fell sharply indicating rising risks in the larger UCBs (Chart 3.8).   3.8 In a trend comparable to scheduled commercial banks (SCBs), the credit to deposit ratio of UCBs dipped marginally from 63.2 per cent in 2014- 15 to 62.5 per cent in 2015-16 and the investment to deposit ratio decreased from 34.7 per cent in 2014- 15 to 30.8 per cent in 2015-16. In 2015-16, UCBs’ SLR investments fell by 4.8 per cent as balances with central/state co-operative banks ceased to be reckoned as SLR investments from April 01, 2015. This also resulted in an increase in the growth rate of ‘investments in approved securities’ from 7.3 per cent in 2014-15 to 13 per cent in 2015-16 (Chart 3.9). On a disaggregated level, the effect was more pronounced for non-scheduled UCBs as they held a higher share of their SLR investments as balances with central/state co-operative banks. Implementation of core banking solution (CBS) 3.9 In April 2016, a scheme was formulated by the Reserve Bank, in consultation with Institute for Development and Research in Banking Technology (IDRBT), to provide financial assistance and technology support for implementation of CBS in UCBs. The scheme is implemented through IDRBT/ Indian Financial Technology and Allied Services (IFTAS). UCBs which have not yet / partially implemented CBS are eligible for financial assistance under the scheme. The scheme has received favourable response from UCBs. Trends for scheduled UCBs 3.10 There were 52 scheduled UCBs at end-March 2016 (50 as at end-March 2015). Their share of assets in the total assets of all UCBs increased in 2015-16 (Chart 3.10). 3.11 The balance sheets of scheduled UCBs expanded by 11.5 per cent in 2015-16. This is comparable to the pace of expansion witnessed during the previous year. Growth in deposits and loans and advances continued to be the leading components contributing to the expansion of UCBs’ balance sheets during the year. 3.12 Profitability indicators of scheduled UCBs deteriorated in 2015-16. Both return on equity and return on assets fell while the net interest margin increased marginally (Chart 3.11). Expenditure growth remained higher than the growth in income and, in contrast to non-scheduled UCBs, the level of net profits of scheduled UCBs fell in 2015-16. Priority sector advances of UCBs 3.13 In 2015-16, credit to small enterprises and housing witnessed a marginal increase, while the share of advances to the agricultural sector remained almost stable (Chart 3.12). The share of priority sector advances directed towards weaker sections improved across all sectors, especially for the micro, small enterprises and housing sectors between 2014- 15 and 2015-16 (Chart 3.13). Rural co-operative banks 3.14 The number of primary rural co-operative credit institutions (both short- and long-term) decreased in 2014-15, bringing down the total number of rural co-operatives to 93,913 from 94,718 in 2013-14. The share of short-term credit co-operatives, comprising state co-operative banks (StCBs), district central co-operative banks (DCCBs) and primary agricultural credit societies (PACS), stood at about 93 per cent of the total assets of the rural co-operative credit institutions at end-March 2015 (Table 3.1). | Table 3.1: A profile of rural co-operatives (as on March 31, 2015) | | (₹ billion) | | Item | Short-term | Long-term | | StCBs | DCCBs | PACs | SCARDBs | PCARDBs | | 1 | 2 | 3 | 4 | 5 | 6 | | A. Number of Co-operatives | 32 | 370 | 92789 | 20@ | 702 | | B. Balance Sheet Indicators | | | | | | | i. Owned Funds (Capital +Reserve) | 141.8 | 293.7 | 216.8 | 74.7 | 53.5 | | ii. Deposits | 1028.1 | 2588.1 | 846.2 | 18.4 | 10.2 | | iii. Borrowings | 687.3 | 800.0 | 999.8 | 161.1 | 163.7 | | iv. Loans and Advances | 1145.5 | 2194.0 | 1472.3* | 211.9 | 148.1 | | v. Total Liabilities/Assets | 1988.6 | 4076.9 | 2237.1+ | 332.9 | 306.8 | | C. Financial Performance | | | | | | | i. Institutions in Profit # | | | | | | | a. Number | 28 | 304 | 43653 | 9 | 319 | | b. Amount of Profit | 11.1 | 18.3 | 28.3 | 1.1 | 1.8 | | ii. Institutions in Loss | | | | | | | a. Number | 4 | 58 | 37440 | 4 | 381 | | b. Amount of Loss | 0.3 | 10.5 | 43.8 | 5.0 | 5.6 | | iii. Overall Profits (+)/Loss (-) | 10.8 | 7.8 | (-)15.5 | (-) 3.9 | (-) 3.8 | | D. Non-performing Assets | | | | | | | i. Amount | 57.2 | 208 | 357.9++ | 64.4 | 53.6 | | ii. As percentage of Loans Outstanding | 5.0 | 9.5 | 24.3 | 30.3 | 36.2 | | E. Recovery of Loans to Demand Ratio (Per cent) | 94.9 | 77.3 | NA | 46.7 | 44.6 | Note: = @ Out of these, 9 have reported profits, 4 have reported losses (Haryana, Jammu and Kashmir, Puducherry and Tripura), 3 are non-functional/dormant (Assam, Bihar, Odisha), one is defunct (Manipur), two are under liquidation (Madhya Pradesh and Maharashtra) and in Chhattisgarh, the LT structure has been merged with the ST structure. # As per data submitted by 362 DCCBs. * Loans & Advances Outstanding, + Working Capital, ++ Total overdues, NA= Not Available.
Source: NABARD and NAFSCOB. | Short term rural credit institutions – StCBs and DCCBs 3.15 StCBs experienced a slowdown in balance sheet expansion from 13.1 per cent in 2013-14 to 4.4 per cent in 2014-15 (Chart 3.14). This was primarily due to negative growth in deposits, a pronounced slowdown in the growth of the ‘other liability’ component, negative growth in cash and bank balances and lower growth in loans and advances on the asset side. 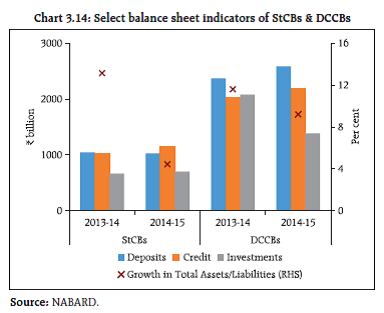 3.16 Growth in income for StCBs decelerated from 9.7 per cent in 2013-14 to 5.6 per cent in 2014-15 on account of a slowdown in the growth of interest income. Despite a sharp increase in the growth of operating expenses (9.3 per cent) in 2014- 15, expenditure growth witnessed moderation from 12.9 per cent in 2013-14 to 4.1 per cent in 2014-15. This was due to the ‘provisions and contingencies’ component of expenditure being lower by 19.9 per cent in 2014-15 (as compared to being higher by 42.6 per cent in 2013-14). The lower level of provisions and contingencies also resulted in higher growth of net profits during 2014-15 at 29.9 per cent as against a decline of 24.7 per cent in 2013-14. 3.17 The balance sheets of DCCBs expanded by 9.2 per cent in 2014-15, which was lower than that in previous years (13.3 per cent in 2012-13 and 11.6 per cent in 2013-14). A dip in the growth of other liabilities and deposits contributed to the slowdown from the liability side while lower growth in loans and advances and negative growth in investments accounted for the deceleration from the asset side. 3.18 Net profits of DCCBs recorded a negative growth of 49.9 per cent in 2014-15 vis-à-vis a negative growth of 0.7 per cent in 2013-14. Income increased by 9.3 per cent in 2014-15 as compared to 10.8 per cent in 2013-14 due to lower growth in interest income. On the other hand, the sharp increase in the ‘provisions and contingencies’ component of expenditure (26.8 per cent in 2014-15 versus (-)22.4 per cent in 2013-14) drove expenditure growth up from 11.1 per cent in 2013-14 to 12.2 per cent in 2014-15. 3.19 StCBs fared better than DCCBs in all aspects of financial performance. The NPA ratio of StCBs declined further from 5.5 per cent in 2013-14 to 5.0 per cent in 2014-15 while their recovery ratio increased from 82.5 per cent in 2013-14 to 94.9 per cent in 2014-15. There was a slight decline in DCCBs’ NPA ratio (9.5 per cent in 2014-15 as against 10.3 per cent in 2013-14); their recovery ratio fell marginally from 78.3 per cent in 2013-14 to 77.3 per cent in 2014-15 (Table 3.2). 3.20 During 2014-15, StCBs in all regions saw an increase in profits, except in the north-eastern region. The increase was the highest for the eastern region with aggregate profits in 2014-15 being about four times that in 2013-14. With the exception of the central region, the NPA ratio of StCBs fell or remained stable across all regions with the decrease being the most pronounced in the north-eastern region (2.6 percentage points). Recovery as a percentage of demand exhibited a mixed trend with a turn-around in the eastern region where the recovery to demand ratio picked up from a low of 58 per cent in 2013- 14 going up to 94.5 per cent in 2014-15 which was higher than the trend level of the region (about 90 per cent). | Table 3.2: Soundness indicators of rural co-operative banks (short-term) | | ( ₹ billion) | | Item | StCBs | DCCBs | | As at end-March | Percentage Variation | As at end-March | Percentage Variation | | 2014 | 2015P | 2013-14 | 2014-15P | 2014 | 2015P | 2013-14 | 2014-15P | | 1 | 2 | 3 | 4 | 5 | 6 | 7 | 8 | 9 | | A. Total NPAs (i+ii+iii) | 57.0 | 57.2 | 1.2 | 0.4 | 209.0 | 208.0 | 15.8 | -0.5 | | i. Sub-standard | 20.7 | 20.8 | 0.3 | 0.5 | 100.2 | 93.2 | 27.3 | -7.0 | | | (36.2) | (36.3) | | | (47.9) | (44.8) | | | | ii. Doubtful | 26.1 | 24.7 | 31.2 | -5.4 | 86.9 | 91.1 | 14.0 | 4.8 | | | (45.9) | (43.2) | | | (41.6) | (43.8) | | | | iii. Loss | 10.2 | 11.7 | -35.4 | 15.0 | 21.9 | 23.7 | -14.4 | 8.3 | | | (17.9) | (20.5) | | | (10.5) | (11.4) | | | | B. Gross NPA-to-Loans Ratio (%) | 5.5 | 5.0 | | | 10.3 | 9.5 | | | | C. Recovery-to-Demand Ratio (%) (as on 30 June of previous year) | 82.5 | 94.9 | | | 78.3 | 77.3 | | | Notes: Figures in parenthesis are percentages to total NPAs. P: Provisional.
Source: NABARD. | 3. 21 At the district level, there was an increase in NPAs of DCCBs across all regions, except western and northern regions. The increase was marginal barring the central region. The central region, along with the southern region, also saw a fall in their recovery to demand ratio in 2014-15. The declining trend of recovery in the southern region continued (90.9 per cent in 2012-13, 81.3 per cent in 2013-14 and 75.9 per cent in 2014-15). Developments with regard to DCCBs 3. 22 Significant progress has been made with respect to issuing licences to unlicensed DCCBs. With the implementation of the revival scheme announced by the central government in November 2014, the number of unlicensed DCCBs came down sharply from 23 to just 3 at the end of September 2016. Primary agricultural credit societies (PACS) 3. 23 PACS witnessed growth in credit outstanding during 2014-15 after experiencing a slowdown in 2013-14 (Chart 3.15). 3. 24 The overall borrower to member ratio, which is a useful indicator of access to credit from PACS, improved from the level witnessed during 2013-14. Farmers – small and marginal – remained majority members of PACS but the increase in access to credit by the ‘rural artisan’ group contributed substantially to the increase in the overall borrower to member ratio (Chart 3.16). 3. 25 There was no change in the percentage of PACS making both profits and losses from the 2013- 14 levels (Chart 3.17). The eastern region, followed by the north-eastern region, continued to remain the weakest performing regions with loss-making PACS outnumbering profit-making PACS (Chart 3.18). The central and northern regions emerged the strongest with the number of profit-making PACS far exceeding the number of loss-making ones. Long-term rural credit SCARDBs 3. 26 SCARDBs’ balance sheets expanded by 7.6 per cent in 2014-15 as against 0.7 per cent in 2013-14. On the liability side, major contributors were borrowings and other liabilities while on the asset side, investments, other assets and loans and advances contributed to the higher growth. There was a dip in growth of interest income and hence in the growth of total income in 2014-15. Nonetheless, there was a reduction in net losses in 2014-15 even as higher operating expenses caused the operating profits to fall. This was brought about as provisions against contingencies made during 2014-15 were lower by 28.9 per cent. PCARDBs 3. 27 PCARDBs’ balance sheets expanded by 4.7 per cent in 2014-15 which was higher than the 3.3 per cent in 2013-14. This was mainly on account of higher growth in loans and advances, other assets (-1.4 per cent in 2013-14; 2.8 per cent in 2014-15) and other liabilities (-6.7 per cent in 2013-14; 4.4 per cent in 2014-15) and steady growth in borrowings (Chart 3.19). 3. 28 PCARDBs’ losses increased during 2014-15 as expenditure growth outpaced income growth. All items of expenditure witnessed acceleration in growth while interest income recorded a low growth of 2.4 per cent in 2014-15 vis-à-vis 9.8 per cent in 2013-14. 3. 29 Asset quality and recovery performance of the long term rural credit institutions, especially SCARDBs, improved in 2014-15. Between 2013-14 and 2014-15, SCARDBs’ NPA ratio fell from 35.6 per cent to 30.3 per cent and the recovery ratio increased noticeably from 33.2 per cent to 46.7 per cent. The NPA ratio of PCARDBs fell from 37.3 per cent in 2013-14 to 36.2 per cent in 2014-15 and recovery to demand ratio continued to improve (42.7 per cent in 2012-13; 43.9 per cent in 2013-14; and 44.6 per cent in 2014-15) (Table 3.3). | Table 3.3: Soundness indicators of rural co-operative banks (long-term) | | (₹ billion) | | Item | SCARDBs | PCARDBs | | As at end-March | Percentage Variation | As at end-March | Percentage Variation | | 2014 | 2015P | 2013-14 | 2014-15P | 2014 | 2015P | 2013-14 | 2014-15P | | 1 | 2 | 3 | 4 | 5 | 6 | 7 | 8 | 9 | | A. Total NPAs (i+ii+iii) | 72.6 | 64.4 | 7.5 | -11.3 | 48.1 | 53.6 | -0.3 | 11.5 | | i. Sub-standard | 31.05 | 24.6 | 10.3 | -20.9 | 22.1 | 27.3 | -0.6 | 23.6 | | | (42.8) | (38.1) | | | (46.0) | (50.9) | | | | ii. Doubtful | 41.4 | 39.2 | 8.7 | -5.2 | 25.6 | 26.0 | -0.04 | 1.4 | | | (57.0) | (60.9) | | | (53.3) | (48.5) | | | | iii. Loss | 0.1 | 0.6 | -91.1 | 445.5 | 0.4 | 0.3 | -2.6 | -13.5 | | | (0.2) | (0.9) | | | (0.8) | (0.6) | | | | B. Gross NPA-to-Loans Ratio (%) | 35.6 | 30.3 | | | 37.3 | 36.2 | | | | C. Recovery-to-Demand Ratio (%) (as on 30 June of previous year) | 33.3 | 46.7 | | | 43.9 | 44.6 | | | | Note: Figures in parenthesis are percentages to total NPAs. P: Provisional. Source: NABARD. |
|