Press Release
S K Mohanty 1
1. Introduction
China has emerged as India’s largest trading partner after it replaced the United States in March 2008 (GoI, 2008). When India initiated its comprehensive reforms in 1991, the level of bilateral trade between the two countries was insignificant as the trade basket was restricted to a limited number of products. However within a short period, China has become India’s single most important trading partner even though India’s bilateral trade deficit with China reached an unsustainable level of US$ 39.1 billion in 2012 (IMF, 2013b). Policy makers will have to find ways to manage this huge deficit given that India can neither afford to limit its economic engagement with China nor continue with such a huge bilateral trade asymmetry for a long period of time.
China has been on a high growth trajectory for more than three decades, and even maintained a sustainable rate of growth at more than 9 per cent per annum during the period 2002-10. The rate of domestic expansion has been robust since its accession to the WTO in 2001. As is evident from statistics, the main drivers of China’s economic growth have been its export and a subsequent expansion of the domestic sector, accompanied by its import surge. During the above reference period, China’s export share in the world economy increased from 3.4 per cent to 10.4 per cent, while its imports rose from 4.4 per cent to 9.1 per cent, respectively. The global economy started recovering from recession in 2010, but with the deepening of the financial situation in Europe once again entered the danger zone and remained there until the third quarter of 2012. The global situation continued to remain fragile in 2013, and its adverse impact was felt in most of the emerging countries that included China and India. Although it suffered from global downturn, China has been strategising to take advantage from the expected recovery of the global economy.
In this context, it is significant that China’s external sector growth is mostly propelled by manufacturing exports. Technology is an important factor for both production and exports as technology-embodied FDI and the domestic innovation system have contributed to the growth of product development for exports, often with the import of related services (Fu and Balasubramayam, 2005). With the changing industrial structure of the country, a large portion of Chinese exports istending towards high-tech exports. This trend coupled with mass production will sustain its high growth momentum for long (Mohanty and Chaturvedi, 2006). Further, with the Most Favoured Nation (MFN) and ‘market economy’ status, China is likely to dominate the global market with its aggressive promotion of exports.
However, sustained economic growth over a period of time has led to a rise in labour productivity and the domestic wage rates. With qualitative improvement in the labour force, the domestic sector is gradually shifting towards more knowledge-intensive industries. In the process, China has started losing its cost advantage in several sectors that span the primary, resource-intensive as well as labour-intensive industries (WTO, 2012). There are possibilities that some of these industries are likely to be shifted out of China and re-located in other countries including India but it remains to be seen whether India is gearing up for such a role! The implications of the Chinese trade strategy needs to be examined in the context of India’s trade options.
As China emerges as the largest trading partner of India, there are many bilateral issues that require close scrutiny. India’s bilateral trade gap is increasing along with its overall trade gap with the rest of the world. It is important to examine to what extent is this bilateral trade imbalance contributing to the overall trade imbalance of India. An important challenge for policy is the need to sustain the present level of trade between the two countries while narrowing the existing bilateral trade gap.
Equally important is a comparative analysis of the tariff policies of both countries because of their increased engagement with the world economy through their participation in various Regional Trading Agreements (RTAs) in Asia and in other parts of the world. Furthermore, reform processes in tariff policies in both countries are again, linked to their external sector performances. Relative external sector performance in both countries requires further investigation in the light of ongoing trade policy reforms.
The Global Value Chain (GVC) has emerged as an important vehicle of trade in the global economy. While during the 1950s and 1960s, the usage of this trade process was mostly in the domain of developed countries, , it is an important source of trade engagement between North-South and South-South in recent years. Global value chain remains relatively an unexplored policy option with India. However, China and India are becoming important players in such activities for both developed and developing countries particularly in their engagement with the United States and the European Union. Is it possible to leverage this advantage vis-à-vis China?
There is presently global debate on the revaluation of the Chinese renminbi and the growing global imbalances. The implication of a revaluation of the renminbi on the export prospects of India is crucial for its trade with the rest of the world. Moreover, India’s trade is increasingly becoming ‘Asia Centric’, while its association with various RTAs has expanded during the last two and half decades. In this process, ties with SAARC and ASEAN have gained prominence for India in South and East Asia. Strategies by Indian policy makers can link the increasing profile of India with the countries that are part of the East Asia Summit (EAS) Process. These are pressing issues that need special consideration.
This study examines some of these issues as follows: Section 2 presents some broad macroeconomic developments both in India and China while a trade policy review of China in the context of India’s economic interest is discussed in Section 3. The bilateral trade relationship between India and China is analysed in Section 4; Section 5 examines tariff regimes in both the countries; Section 6 focuses on the trade potential existing in partner countries; Section 7 examines patterns of engagement of India and China in the Global Value Chain; Section 8 examines the implication of a revaluation of the renminbi on India’s market access in third countries; Section 9 examines the engagement of India and China in different regional trading arrangements and the implications of this for India. The conclusions and policy recommendations are presented in the last section.
2. Macro-economic Developments and the Outlook
As India and China are the two fastest growing countries of the world, the possibility of an economic rapprochement among them to seize the synergies2 of their development is an interesting issue for discussion. Both the countries have witnessed transitions in their economic policies during the last two to three decades, and the irreversible nature of economic liberalisation has enabled each nation to integrate with the world economy. While analysing the existing patterns of their trade and the sectoral complementarities for further economic engagement, the comparative macroeconomic performance of both economies may be examined in recent years. The robustness of these economies may be seen from their macroeconomic performances.
2.1 Sustaining High Growth
China has increasingly attracted the attention of the global economic community during the last three decades due to its excellent track record in maintaining a high growth rate unparallel in the annals of the world economy3. Since 1980, it has been maintaining an average GDP growth of about 9 per cent per annum and has taken major strides in elevating large sections of its population above the poverty line. During the period of global buoyancy which spanned fom2003 to 2007, its GDP growth rate accelerated to more than 11.6 per cent per year, while its highest growth rate in recent time was recorded in 20074 (see Table 2.1). The reoccurrence of the Global Financial Crisis in 2008 tapered global economic activities substantially. However, Chinese high growth profile was adversely affected with the persistence of a global economic downturn. Real GDP growth rate weakened sharply from 9.6 per cent in 2008 to 7.7 per cent in 2012, casting aspersions about the growth prospects of the country in future. In the Post-Asian Financial Crisis period, the external sector has emerged as the key source of China’s growth, and its exports and imports grew at the rate of 28.1 per cent and 25.4 per cent, respectively during 2003-08 and declined significantly during 2009-10. According to the Ministry of Commerce of China (MoCC, 2011), trade in services, which grew at a modest rate earlier, has registered a high growth in the recent years.5 Foreign direct investment added up to $378 billion cumulatively with about $108 billion in 2008. Rising current account surpluses combined with strong capital flows brought the net international reserves to about $1.55 trillion in 2007, surpassing those of Japan in the present decade. However, external sector performance was adversely affected during the period of recession.
The resilient Chinese economy dealt with intermittent occurrences of external shocks in recent years. It has effectively coped with shocks for example like the Asian Financial Crisis; the SARs epidemic; several major natural disasters including floods and earthquake, and the current episode of global recession, among others.
During the financial crisis of 1997-98 and 2008-12, the Chinese authorities evaded adjusting the exchange rate regime to reduce the pressure of crisis and instead launched a major Keynesian programme of reflation (estimated to have injected stimulus packages of about $1 trillion during ‘Asian Crisis’ and $0.6 billion6 during the present crisis to boost domestic demand) to keep up the growth momentum of the economy. Succumbing to international pressure, China has agreed to make appropriate corrections in the exchange rate.7 The prudent management of Chinese economic policies and other factors has led to a resurgence of the growth rate in 2010 butthe growth momentum was subdued until 2012. The IMF projection of Chinese growth rate has expressed pessimism in the medium term.
Among others, the demographic dividend remains one of the most important factors, determining the growth prospects of China in the next two decades. Growth prospects areaffected by the population structure because the dependency ratio, which is represented by relative size of the labour force to the total population, is the major yardstick of level of output. A rising share of workers in the population in China indicates that participation rate is properly accounted for in the production process. With declining fertility rate, there will be reduction in both population growth and dependency rate, leading to rise in the working age ratio. In case of India and China, increasing working age ratio would contribute to higher per capita income growth, or demographic dividend.
Various studies have indicated that China has passed through a phase of demographic restructuring, and demographic dividend has a major contribution to the recent growth profile of the country. The demographic dividend will continue for some time before it turns out to be adverse in the form of ‘demographic tax’. Chinese peak population will be 1.5 billion in 2032 before declining (Wolf, et al, 2011). The empirical analysis of Cai and Wang (2005) concluded that demographic dividend of China would cease to exist by 2015. ADB (2011) projected that China is expected to receive benefit of demographic dividend until 2020, and will incur ‘demographic tax’ in the 2020s. The prediction about erosion of Chinese demographic dividend in the next decade, particularly before reaching the status of a developed country, could be due to several reasons including rapidly aging population, rising dependency ratios, rising health costs for the elderly, sharp gender imbalances, etc (Wolf, et al, 2011). On the contrary, India is likely to gain from the demographic dividend. According to Aiyar and Mody (2011), India started receiving demographic dividend since 1980s, and it would contribute at about 2 percentage points per annum to India’s per capita GDP growth over the next two decades. It would not only address the issue of income convergence among Indian states but also focus on balanced growth of the regions. The working age population in China is expected to decline in the next decade where it is likely to rise in India. With the existing demographic character, India’s growth profile could outpace China’s for a considerable time (Economist, 2010). The level of demographic dividends in India and China are dependent upon the successful implementation of a range of policy choices during the period of transformation (Golley and Tyers, 2012).
Growth momentum of the Indian economy8 has been susceptive to the global business cycles (see Table 2.1). During the periods 2001-02 and 2008-12, India’s growth performance was limping as compared to the years of buoyancy in the global economy. Average GDP growth declined to 6.5 per cent during 2008-12from 9.5 per cent during 2005-07. The speed of recovery in India was slow in comparison to China, though both countries revived from the global recession in 2010. With a rebounding of the economy, India could post a robust GDP growth of 10.1 per cent in 2010, allowing per capita income to rise from $1159 in 2009 to $1432 in 2010. The per capita income, however, has stagnated at $ 1501 in 2012. During the last decade, India’s share in World Gross Product has increased from 4.0 per cent in 2003 to 5.7 per cent in 2011, but remained stagnant in 2012. Simultaneously, performances of exports and imports are yet to pick up in recent years.
However, the surge in the external sector performance of India is considerable below its potential. Strong inflationary pressure grappled the Indian economy during 2008-12, leading to a surfacing of numerous macro-economic imbalances in the domestic economy. Until 2005, India’s rate of inflation was under the permissible macro-economic ceiling of 5 per cent. With the onslaught of recession in 2008,the current account imbalance as a percentage of GDP went up to -4.8 per cent in 2012 from -1.0 per cent in 2006. In value terms, current imbalance grew from $15.7 billion in 2007 to $88.2 billion 2012, registering an unsustainable rise of CAD during the period 2007-12. Therefore, India’s recovery in 2010 was transitory in nature and the economy was not resilient enough to withstand the second episode of the global ‘double-dip’ recession.
Table 2.1: Selected Economic and Social Indicators |
Macroeconomic Indicators |
2003 |
2004 |
2005 |
2006 |
2007 |
2008 |
2009 |
2010 |
2011 |
2012 |
2013 |
2014 |
China |
Growth Rate, GDP (%) |
10.0 |
10.1 |
11.3 |
12.7 |
14.2 |
9.6 |
9.2 |
10.4 |
9.3 |
7.7 |
7.6 |
7.3 |
GDP per capita PPP, (International $) |
3217 |
3614 |
4102 |
4740 |
5526 |
6145 |
6730 |
7487 |
8305 |
9055 |
9828 |
10661 |
GDP, current prices (US$ Billion) |
1641 |
1932 |
2257 |
2713 |
3494 |
4520 |
4991 |
5930 |
7322 |
8221 |
8939 |
9761 |
GDP per capita, current prices (US$) |
1270 |
1486 |
1726 |
2064 |
2645 |
3404 |
3740 |
4423 |
5434 |
6071 |
6569 |
7138 |
Population (Mill) |
1292 |
1300 |
1308 |
1314 |
1321 |
1328 |
1335 |
1341 |
1347 |
1354 |
1361 |
1368 |
GDP, World share, PPP (%) |
8.4 |
8.8 |
9.3 |
10.0 |
10.8 |
11.6 |
12.7 |
13.4 |
14.1 |
14.7 |
15.4 |
16.0 |
Inflation |
1.2 |
3.9 |
1.8 |
1.5 |
4.8 |
5.9 |
-0.7 |
3.3 |
5.4 |
2.7 |
2.7 |
3.0 |
Volume, Export of goods (% Change) |
20.0 |
18.5 |
24.5 |
24.2 |
19.3 |
8.2 |
-10.7 |
28.4 |
9.4 |
5.7 |
6.5 |
6.8 |
Volume, Import of goods (% Change) |
24.4 |
20.0 |
13.6 |
16.0 |
12.9 |
3.4 |
2.5 |
22.3 |
9.8 |
5.1 |
7.6 |
6.8 |
Current account balance (% GDP) |
2.6 |
3.6 |
5.9 |
8.5 |
10.1 |
9.3 |
4.9 |
4.0 |
1.9 |
2.3 |
2.5 |
2.7 |
Current account balance (US$ Billion) |
43.1 |
68.9 |
132.4 |
231.8 |
353.2 |
420.6 |
243.3 |
237.8 |
136.1 |
193.1 |
223.7 |
258.9 |
GDP based on PPP (Bill International $) |
4158 |
4698 |
5364 |
6230 |
7301 |
8161 |
8982 |
10040 |
11189 |
12261 |
13374 |
14579 |
GDP, Constant Prices (LC Billion) |
6784 |
7468 |
8313 |
9367 |
10693 |
11723 |
12804 |
14141 |
15456 |
16647 |
17912 |
19211 |
India |
Growth Rate, GDP (%) |
8.4 |
7.9 |
9.3 |
9.3 |
9.8 |
3.9 |
8.5 |
10.5 |
6.3 |
3.2 |
3.8 |
5.1 |
GDP per capita PPP, (International $) |
1848 |
2042 |
2260 |
2509 |
2789 |
2914 |
3141 |
3466 |
3707 |
3843 |
3991 |
4209 |
GDP, current prices (US$ Billion) |
618 |
722 |
834 |
949 |
1238 |
1223 |
1365 |
1711 |
1873 |
1842 |
1758 |
1750 |
GDP per capita, current prices (US$) |
572 |
658 |
749 |
840 |
1081 |
1053 |
1159 |
1432 |
1547 |
1501 |
1414 |
1389 |
Population (Mill) |
1081 |
1097 |
1114 |
1130 |
1146 |
1162 |
1178 |
1195 |
1211 |
1227 |
1243 |
1260 |
GDP, World share, PPP (%) |
4.0 |
4.2 |
4.4 |
4.5 |
4.7 |
4.8 |
5.2 |
5.5 |
5.7 |
5.7 |
5.7 |
5.8 |
Inflation |
3.9 |
3.8 |
4.4 |
6.7 |
6.2 |
9.1 |
12.4 |
10.4 |
8.4 |
10.4 |
10.9 |
8.9 |
Volume, Export of goods (% Change) |
12.9 |
15.5 |
11.5 |
10.6 |
18.3 |
1.2 |
3.9 |
19.5 |
12.3 |
2.1 |
3.4 |
8.4 |
Volume, Import of goods (% Change) |
11.4 |
29.1 |
14.2 |
6.5 |
21.7 |
10.4 |
4.5 |
7.3 |
15.1 |
1.9 |
3.8 |
5.0 |
Current account balance (% GDP) |
2.3 |
-0.3 |
-1.2 |
-1.0 |
-1.3 |
-2.3 |
-2.8 |
-2.7 |
-4.2 |
-4.8 |
-4.4 |
-3.8 |
Current account balance (US$ Billion) |
14.1 |
-2.5 |
-9.9 |
-9.6 |
-15.7 |
-27.9 |
-38.2 |
-45.9 |
-78.2 |
-88.2 |
-77.6 |
-66.1 |
GDP based on PPP (Bill International $) |
1997 |
2241 |
2518 |
2836 |
3196 |
3385 |
3701 |
4141 |
4489 |
4716 |
4962 |
5302 |
GDP, Constant Prices (LC Billion) |
30058 |
32422 |
35432 |
38715 |
42509 |
44164 |
47908 |
52961 |
56314 |
58137 |
60343 |
63449 |
Source: RIS based on World Economic Outlook, October 2013, World Bank.
Note : IMF Projected figures in dark shaded columns. |
2.2 Sources of Domestic Growth
The global debate on the choice of an appropriate development strategy has been changing radically during the last few decades. In the mid-seventies, there was a policy switch towards an export-led growth (ELG) strategy in several countries including in Asia. Constraints relating to the ELG strategy surfaced predominantly during the Asian crisis, and there was strong motivation to move to a Domestic Demand-Led Growth (DDLG) strategy in order to maintain high growth while keeping the economy resilient to the intermittent occurrences of external shocks9. Considering the advantages and disadvantages of both the approaches, India and China have been pursuing these strategies simultaneously to optimise their growth potentials from the constantly changing global and domestic situations. With global buoyancy, the ELG strategy receives priority, while the DDLG strategy dominates in the domestic policy during global recession.
The ELG strategy is focused on re-orienting the structure of domestic production to promote exports. Based on the neoclassical principles of ‘efficient allocation of resources’ between sectors, it is envisaged that exports would act as the engine of growth. In the changed policy environment, with exports firmly in the saddle, domestic demand was stimulated, and this process, in turn, encouraged savings and capital formation to expand with exports and economic growth. In the framework of the ELG strategy which is consistent with the principles of the ‘Washington Consensus’, exports gradually emerged as the growth simulator for the economy. The growing demand from the export sector, paved the way for introducing new and efficient technologies in exporting firms to meet the required quality and standards of various products. The spill over effects of technological up-gradation in select export sectors were felt in the rest of the economy. With a strong undercurrent of exports in the domestic economy and continuous investment in the exporting sectors, the supply potential of the economy in the tradable sectors increased over time. This, in turn, strengthened the import capabilities of the countries to support their increased need of the export sector.
During the post-war period, within the developing world some of the currently more advanced countries known as the ‘Asian Tiger’ were almost at a similar level of development as that of India. The rapid growth of these economies over a period of more than two decades brought another dimension to the ELG strategy as a development paradigm. Asia witnessed a ‘growth miracle’ in these countries during the period from 1970 to mid-1990s. However, the development gap between these and the rest of the developing countries widened. A key factor for the phenomenal growth of these fast growing economies has been the ‘export boom’ following adoption of the Export Led Growth strategy, which has effectively integrated these economies into the global economy. This strategy allowed development to transmit through the external sector channel, and export took the lead in shaping the growth process through a restructuring of the domestic production structure. Experiencing the positive effects of the ELG, many countries from Latin America have also adopted a similar strategy (Herzer, 2006).
However, as an aftermath of the ‘Asian Financial Crisis’, the ‘High Growth Profile’ of the ELG regime as a credible strategy for enhancing growth and economic welfare was called into question, and its efficacy came under the scanner. Inconsistent performances of some of the sectors during the period of crisis raised doubts about the relevance of export-led growth as a growth stimulating strategy for the developing countries (Felipe, 2003). This called for a new development paradigm, which would insulate developing countries from the possibility of economic crises because of external shocks. In the post-crisis period, a gradual switching of policies towards Domestic Demand-Led Growth strategy yielded positive results and placed the developing economy back on the path of sustained high growth10.
Under the Domestic Demand-Driven Growth hypothesis, expansion in the components of domestic demand would lead to an increase in economic growth. Some of the factors contributing to domestic demand are private investment, government expenditure, consumption, etc. This hypothesis emphasises that GDP growth can be made sustainable with deep internal market demand. Therefore, growth in output can be triggered by growth of aggregate demand. The central focus of the approach would be to enhance the production capacity to comply with effective demand.
There are merits in both approaches to steering an economy to maintain steady growth over a long period. It is often discussed in the literature that these approaches are not either/or and competitive in nature. In many cases, they are rather complementary, even though they appear to be competitive. It is frequently seen in the literature that empirical evidences do not support the dominance of any of these approaches in a country/region because they contribute differently in diverse situations. It is the prerogative of a country to choose its future development paradigm to guide its growth process, particularly, one that will take it to a high growth trajectory.
The current literature provides sufficient evidence to show that the export-led growth strategy is not likely to sustain growth (Palley, 2011) because of the changing global situation. Now protectionism in the global trading arena has returned with a vengeance and the space of export activities has somewhat narrowed. The situation will be more complex for those countries, which are middle-income countries, aspiring to a high-income country level status. For accommodating the national priority of sustained growth within the framework of global norms (i.e., commitments to climate change, global standards, global governance, etc.), the new development paradigm suggests maximising domestic effective demand with Domestic Demand-Led Growth.
A critical examination of the development strategies of India and China indicates that these consist of a combination of both ELG and DDLG in recent years, particularly after the ‘Asian Financial Crisis’ (Mohanty and Chaturvedi, 2006; Li and Zhang, 2008; Mohanty and Arockiasamy, 2010). During the period of global recession, development policies are more inclined towards DDLG to maintain high GDP growth rate. During the phase of global recovery, export is pushed as a major driver of growth with an emphasis on Globally Dynamic Products (Mohanty, 2009).
Review of Literature
The Export-Led growth hypothesis has been dominating the development literature for the last four decades. Several studies examined the relationship between exports and growth in the 1970s and 1980s. Many of these studies (see for example, Michaely, 1977; Heller & Porter, 1978; Tyler, 1981; Feder, 1983; Kavoussi, 1984; Ram, 1987, Mohanty and Chaturvedi, 2006; Wah, 2004; Wong, 2007 and 2008) have supported the assertion that export growth has a strong association with growth of real output. Moreover, causation between the two variables is not established with certainty among different cross-section of countries and at different points of time. During the last several decades, such relationships were examined in the framework of time-series and in a cross-section of countries.
Several studies have (see for example, Jung and Marshall, 1985; Hsiao, 1987; Bahmani-Oskooee, et al., 1991; Dodaro, 1993 and Love, 1994; Love and Chandra 2005) used different time-series approaches to lend support to the export-led hypothesis. Their results are not conclusive in supporting the hypothesis, but rather mixed in nature. Taking a large set of 87 countries, Dodaro (1993) examined the causality between export growth and causality. Results of the study found weak support for the hypothesis that export growth promotes GDP growth. Using the Granger causality, Jung and Marshall (1985) found that the export-led growth hypothesis is supported by 10 percent of the sample in the cross-country analysis. The results of the study by Bahmani-Oskooee et al. (1991), combining Granger causality with Akaike’s Final Prediction Error (FPE) were to some agreement with the export-led-growth hypothesis, although the evidence is inconclusive. Using a similar methodology, with Johansen’s multivariate approach to cointegration, Love and Chandra (2005) examined the hypothesis of an export-led growth hypothesis for Bangladesh. The findings suggest that the direction of both long- and short-term causality is from income to export and therefore country inward trade strategy of development discriminated against export.
In several countries, both ELG and DDLG are pursued simultaneously in order to insulate the domestic economy from the adverse impacts of global business cycles. Several studies have observed that empirical findings do not strongly support the export-led growth stance and this is because of the missing impact of DDLG misspecification in the model. In many other cases, both development paradigms are empirically found to be important in contributing to growth, meaning thereby a simultaneous pursuit of these two strategies to optimise national welfare. Lin and Li (2002) examined contribution of the external sector to GDP growth to examine efficacy of export-led growth in China. They proposed a new methodology to estimate the direct and indirect contribution of exports to GDP growth. Their results indicate that a 10 percent increase in export growth would lead to 1 percent growth in GDP in the 1990s.
In a recent paper, Mohanty (2012a) examined the possibility of maintaining a sustained high growth performance in India while simultaneously pursuing both ELG and DDLG strategies. Since India falls in the Low Middle Income Country Group, it has a large number of products with export competitiveness globally. Time Series analysis with the VECM model reveals that both strategies have a significant long-term relationship with income. If India’s medium-term growth performance were sustainable, India’s trade integration with ASEAN would be strengthened with either ELG or by a combination of both strategies. India’s interest could be to pursue both strategies alternatively to maintain sustained high growth until its export competitiveness is fully realised.
In the case of China, a study by Tang and Selvanathan (2008) suggested that FDI had not only compensated a shortage of capital but also induced high economic growth through domestic investment. Therefore, FDI encouraged the relevance of the DDLG strategy in China.
Wah (2004) tried to examine the specific paradigm of development that contributed to the high growth phase of the Malaysian economy during the period 1961-2000. During the high growth period, export remained an important factor in the economic transformation of the economy. However, various studies examining the export-led hypothesis in Malaysia found weak support for this hypothesis in the long run, and this could be because of exclusion of various factors relating to domestic demand in the models. Results support the domestic demand hypothesis in the long run, but the export-led hypothesis was not supported by the empirical findings. In another study, Wong (2008) examined the relevance of development stance of some of the South East Asian countries, particularly ASEAN-5, during and after the ‘Asian Economic Crisis’. The regional overview indicated that there was bilateral Granger causality between exports and economic growth, and private consumption and economic growth. The empirical findings could not suggest that the crisis in the region was due to export-led growth. The broad conclusion of the study is that sustained economic growth requires steady growth in the exports and domestic demand. A similar hypothesis was examined by Wong (2007) for some Middle East countries including Bahrain, Iran, Oman, Qatar, Saudi Arabia, Syria and Jordan, and found that sustainability of economic growth went hand in hand with growth of both exports and domestic demand. However, the results were less conclusive to support any development strategy responsible for sustained economic growth in the Middle East region.
An overview of the current literature highlights the role of both exports and domestic demand to put economic growth on a high growth trajectory in a sustainable manner. The exact sequencing of policies and their impact on the growth prospects of a country are empirical issues, which can be examined in case of India and China.
Growth Accounting Approach
From the above discussion it is relevant that both India and China are maintaining high growth over a long period despite turbulences at the level of both the domestic and global economy. The resilience of these economies has been the outcome of the policy priorities associated with alternative development strategies, which vary from time to time in order to catch up with different economic situations. An exercise is to examine the contribution of domestic demand and the external sector to aggregate growth in both countries follows. It may be interesting to note that the relative contribution of both the components (i.e., domestic demand and external sector) vary with the changing global situations. The computations of growth decomposition are based on the procedures developed by Felipe and Lim (2005).
GDP growth in the year t is explained by the following macroeconomic identity:
The same formula applies to other components of demand.
It is hypothesised that contribution of domestic demand, such as consumption, investment and government expenditure is expected to be significant during global recession whereas the external sector contribution should be robust during the period of global buoyancy. As the global economy passed through different phases of the business cycle, both countries continued to maintain high growth performances during the last two decades due to a suitable interplay of both ELG and DDLG strategies.
Analysis for Growth Decomposition: China and India
China has simultaneously pursued export-led and domestic demand-led growth policies to place the economy on a high growth trajectory in a sustainable manner. The investment-led domestic demand and the export sector have been the drivers of growth for the Chinese economy. The experiences of developing countries suggest that both export-led growth and domestic demand-driven growth have positive as well as negative effects on economic growth; and neither of these appears to be appropriate to be pursued in isolation. In recent years, the contributions of both the strategies to overall GDP growth in China follow the behaviour pattern of the global business cycle, thus, it insulated the high growth momentum in these countries from the adverse effects of exogenous shocks. Simultaneous pursuance of both these strategies of domestic demand and export-led growth can ensure consistently high growth irrespective of the nature of the global business cycle.
During the last few years, exports have been expanding rapidly in real terms and the impact of exports on employment has been profound (Mohanty and Chaturvedi, 2006), thus contributing towards the alleviation of poverty. Exports have generated substantial employment opportunities due to sustained demand for industrial products in the global market.
The impact of the global business cycle on domestic economic growth has been different for various elements in the income identity during different phases of the cycle. A growth decomposition analysis for the Chinese economy indicates that contributions of domestic demand and exports to overall growth have been different across various phases of the global business cycle, but their combined contribution to growth has been significant and consistent during the last decade. During the period 2001-03, the global economy grew at an average rate of 2.9 per cent during the economic downturn and increased to 4.9 per cent on an average annually during the global buoyancy of 2004-07. The world economy was struck by recession in a major way twice recently in the form of ‘Asian Economic Crisis’ during 1997-98 and then since 2008, with a marginal improvement in 2010 before relapsing into crisis.
The growth performance of the Chinese economy was adversely affected during these two phases of the global business cycle, and the contribution of domestic demand and the export sector to GDP growth followed a definite pattern during these two phases. The contribution of domestic demand to growth was significantly high during recession and declined considerably during the period of economic boom. A reversed trend is apparent for the export sector in its contribution to growth. Decline in the contribution of a growth factor is compensated by another growth-inducing factor in one episode of the business cycle, leading to restoration of the overall growth rate of Chinese economy maintained at a high level.
Growth decomposition for China is estimated for the period 1991-2011 using equation (1) and (2). For examining the contribution of different sectors to growth in different phases of the global business cycle, we have referred to fdifferent time periods in the analysis as presented in Table 2.2. The empirical results indicate that during the phase of recession (i.e., 1996-99), the contribution of the external sector to overall GDP growth was 3.7 per cent per annum on an average and went up to 21.9 per cent per annum to the GDP growth during buoyancy (i.e., 2004-07). It is observed that the contribution of exports to GDP growth during recession declined from 24.6 per cent in 2007 to -82.0 per cent in 2009, and the loss of external demand was adequately compensated by domestic demand, mostly by consumption and investment.
Table 2.2: Contribution of Demand Components to GDP in China (in %) |
Year |
Domestic Demand |
External Demand |
Total |
C |
I |
G |
Total |
X |
M |
Total |
1991 |
54.5 |
20.0 |
26.2 |
100.8 |
13.9 |
14.6 |
-0.8 |
100 |
1992 |
64.1 |
30.5 |
18.2 |
112.9 |
11.2 |
24.1 |
-12.9 |
100 |
1993 |
43.3 |
57.4 |
13.2 |
114.0 |
9.6 |
23.6 |
-14.0 |
100 |
1994 |
29.9 |
42.7 |
8.8 |
81.4 |
30.4 |
11.9 |
18.6 |
100 |
1995 |
49.9 |
61.2 |
-5.3 |
105.8 |
14.6 |
20.4 |
-5.8 |
100 |
1996 |
57.5 |
32.6 |
12.4 |
102.4 |
19.2 |
21.6 |
-2.4 |
100 |
1997 |
41.5 |
20.8 |
14.5 |
76.8 |
45.3 |
22.1 |
23.2 |
100 |
1998 |
57.4 |
27.4 |
18.9 |
103.7 |
17.0 |
20.7 |
-3.7 |
100 |
1999 |
62.0 |
20.3 |
19.8 |
102.2 |
26.9 |
29.1 |
-2.2 |
100 |
2000 |
50.4 |
17.4 |
17.4 |
85.1 |
56.2 |
41.3 |
14.9 |
100 |
2001 |
44.2 |
43.1 |
16.0 |
103.3 |
24.7 |
28.0 |
-3.3 |
100 |
2002 |
31.5 |
34.7 |
8.1 |
74.3 |
52.4 |
26.7 |
25.7 |
100 |
2003 |
32.4 |
56.7 |
6.6 |
95.6 |
69.2 |
64.8 |
4.4 |
100 |
2004 |
36.5 |
50.2 |
7.8 |
94.6 |
80.6 |
75.2 |
5.4 |
100 |
2005 |
29.0 |
29.0 |
11.7 |
69.8 |
59.6 |
29.5 |
30.2 |
100 |
2006 |
30.4 |
32.7 |
9.6 |
72.6 |
59.0 |
31.6 |
27.4 |
100 |
2007 |
32.0 |
34.2 |
9.2 |
75.4 |
51.8 |
27.2 |
24.6 |
100 |
2008 |
33.2 |
35.6 |
9.4 |
78.2 |
32.0 |
10.2 |
21.8 |
100 |
2009 |
60.2 |
106.8 |
15.0 |
182.0 |
-64.4 |
17.6 |
-82.0 |
100 |
2010 |
28.1 |
34.2 |
9.3 |
71.5 |
66.9 |
38.4 |
28.5 |
100 |
2011 |
35.5 |
36.9 |
10.0 |
82.3 |
29.7 |
12.1 |
17.7 |
100 |
Period Average |
1992-95 |
46.8 |
47.9 |
8.7 |
103.5 |
16.5 |
20.0 |
-3.5 |
100 |
1996-99 |
54.6 |
25.3 |
16.4 |
96.3 |
27.1 |
23.4 |
3.7 |
100 |
2000-03 |
39.6 |
38.0 |
12.0 |
89.6 |
50.6 |
40.2 |
10.4 |
100 |
2004-07 |
32.0 |
36.5 |
9.6 |
78.1 |
62.7 |
40.8 |
21.9 |
100 |
2008-11 |
39.2 |
53.4 |
10.9 |
103.5 |
16.1 |
19.6 |
-3.5 |
100 |
Source: Computation based on data from World Development Indicators Online [Accessed on October 25, 2013) |
Among the drivers of domestic demand, the most important source of growth was investment which grew at a double digit rate during the present decade. The decomposition results show that 36.5 per cent of GDP growth came from investment as against 21.9 per cent from net exports during 2004-07. Buoyancy returned to the world economy during 2004-07, and global demand picked up. With the changing phase of the global business cycle, exports of China surged and so also its contribution to growth. The share of exports to GDP growth jumped to nearly 62.7 per cent per annum and contribution of investment reduced to 36.5 per cent on an average during 2004-07. On account of strong complementarities between the export-led growth and domestic demand-led growth, mostly led by the investment factor, Chinese overall growth performance was unhindered substantially during the decade. The Chinese economy grew at an average rate of 9.4 per cent during the global downturn and maintained an average growth rate of 12.1 per cent during the global boom (2004-07).
The high investment rate in the country was more than fully supported by an increase in domestic savings, which increased from 35.5 per cent of GDP in 2001 to 53 per cent in 2007 and led to a substantial current account surplus. Such high rates of domestic savings obtain from a number of peculiar characteristics of the Chinese economy and also from the high savings of state-owned enterprises which are not required to pay dividends to the government. While foreign direct investment has assisted growth, more than 50 per cent of investment consisted of self-financing by enterprises including that made by state-owned enterprises. Foreign direct investment was none the less substantial and the bulk of it was directed to manufacturing as a platform for export: foreign invested enterprises (FIEs) based in China conducted a substantial part of China’s foreign trade, undertaking more than half of manufactured exports. FDI served as a platform, enabling China to manufacture products that met world-market specifications with regards to quality, design, and technological content.
It is important to note that the growth prospects of the Chinese economy is likely to remain robust in the medium term due to a simultaneous pursuance of export-led growth and demand-led growth by the Chinese government. As domestic growth is likely to remain strong irrespective of the global business cycle, the domestic demand for imports will be strong, taking into account the import profile of the economy in the present decade. The predictability of the Chinese import behaviour in the medium term is an opportunity for India to develop a strategy to access the Chinese market. While opening up of the economy to trade and FDI have resulted in the emergence of a significant private sector, public ownership remains a key feature of the economy, especially for services. The major enterprises, for example the banking sector, are mostly in the public sector and government continues to exert a strong influence on trade and investment (Girardin, 1997). Government-to-government relations thus remain crucial for China’s trading partners including India.
China is dependent on the external sector, but the contribution of this to GDP has started declining. This is evident from the falling share of domestic demand in GDP. Although the contribution of net exports to GDP has gone up substantially during 2002-04, the Chinese economy is largely characterised by the dominance of domestic economic activities. Similar trends exist for India.
The external sector in China constituted more than 20 per cent of its GDP growth during global buoyancy (2004-07). During 2002-08, export contribution remained significantly higher than imports and other components of demand. However, contribution of exports remained negative (-64.4 per cent in 2009), leading to net negative contribution to growth during global crisis (2008-09). This shows a declining relevance of ELG in case of China.
China is passing through a phase of rapid structural change, leading to growing imbalances in its current account position. As reported by the IMF (2012c), country’s international reserves increased from $615 billion in 2004 to $3.2 trillion at the end of 2012. Surging of Chinese international reserves over a period has been construed as the key reason for the continuation of the recent episode of global imbalance. China has been experiencing current account surplus (CAS) since the early 1990s, even during the period of ‘Asian financial crisis in the mid-1990s. The nature of current account surplus has undergone radical change over the years. As a percentage of GDP, CAS reached its peak of 10% in 2007, and started declining (Cline, 2012) in the following years. Various reasons are provided in the literature to explain secular failing of Chinese CAS ratio including robust import demand against declining terms of trade (IMF, 2012c), widening resource gap (EAF, 2012), and real appreciation of exchange rate (Cline, 2012; Cline and William, 2011), etc among others.
While Chinese consumption as a share of GDP has been growing steadily, savings ratio graph is moving towards a phase of plateau and then falling off significantly from its present level of 50 per cent of GDP. There are some tendencies towards surge in the consumption behaviour in the country. China’s private consumption has been growing within the range of 8-9 per cent per annum during the last two decades, and this has been fuelled by growing demand for consumer durables. Falling savings ratio, rising consumption and pressure on investment have a combine effect on widening of domestic resource gap, which will put pressure on China’s current account balance (EAF, 2012). China is likely to witness robust import growth because of surging private consumption and investment demand in the medium term. Indications of secular worsening of the country’s terms of trade would have a lasting impact on its adverse export performance. Divergence between imports and exports may have long-term implications for its current account balance (IMF, 2012c). Recent empirical studies11 (Cline, 2012; Cline and William, 2011) suggest that a key reason for decline in the share of CAS in GDP is substantial real appreciation of the exchange rate. Other factors contributing to this process include world oil prices, slower world growth and an erosion in the capital services accounts but these are secondary factors as compared to appreciation of Yuan.
The present trend indicates that there will be a lasting decline in the Chinese current account surplus in the medium term. IMF (2012a) projects that CAS as a share of GDP will be 2.3 percent in 2012 and 2.5 per cent in 2013. Cline (2012) observes that CAS ratio would be in the range of 2-4 per cent of GDP over next six years. There are several counterfactual results showing expected CAS ratio in 2017. Results of Cline and William (2011) suggest that it would be 5.4 percent whereas IMF (2012a) predicted at 4.3% in 2017. Cline (2012) has predicted CAS ratio in a range of ±2 per cent of GDP in 2007, depending upon exchange rate policy of the government. However, through various channels, the current account surplus is going to dip in the medium term.
Both India and China have shown divergent growth paths though there are many commonalities between them. During global buoyancy or recession, priorities in development strategies (i.e., ELG and DDLG) have been similar, but the countries differ in terms of their drivers of growth. It is interesting to note that while in China the ELG strategy is facing increasing challenges, in India it is still being considered as relevant as a credible development strategy. During the global boom, growth performances were significant in both the countries. While India was growing at a rate of 9.0 per cent in average during 2004-07, China posted an average growth rate of 12.1 per cent per annum. During the recent episode of global recession, India’s average growth performance slowed down to 6.5 per cent whereas it declined to 9.4 per cent in average for China during 2008-09. It is important to examine the growth drivers in both countries during different phases of the global business cycle.
Table 2.3: Contribution of Demand Components to GDP in India (%) |
Year |
Domestic Demand |
External Demand |
Total |
C |
I |
G |
Total |
X |
M |
Total |
1992 |
46.8 |
71.2 |
9.1 |
127.1 |
7.8 |
34.8 |
-27.1 |
100 |
1993 |
179.0 |
-80.2 |
35.4 |
134.2 |
50.4 |
84.6 |
-34.2 |
100 |
1994 |
57.5 |
60.5 |
2.9 |
120.9 |
17.7 |
38.6 |
-20.9 |
100 |
1995 |
51.3 |
45.4 |
9.5 |
106.3 |
28.0 |
34.3 |
-6.3 |
100 |
1996 |
115.6 |
-47.5 |
11.2 |
79.4 |
13.6 |
-7.0 |
20.6 |
100 |
1997 |
48.8 |
60.7 |
19.4 |
128.9 |
-3.6 |
25.3 |
-28.9 |
100 |
1998 |
81.9 |
18.6 |
21.4 |
121.9 |
19.5 |
41.4 |
-21.9 |
100 |
1999 |
41.3 |
41.2 |
11.5 |
94.1 |
14.2 |
8.3 |
5.9 |
100 |
2000 |
117.6 |
-93.9 |
9.1 |
32.8 |
102.6 |
35.4 |
67.2 |
100 |
2001 |
56.3 |
38.1 |
4.2 |
98.6 |
7.7 |
6.4 |
1.4 |
100 |
2002 |
52.9 |
22.2 |
-0.7 |
74.4 |
79.4 |
53.8 |
25.6 |
100 |
2003 |
61.5 |
46.3 |
5.1 |
112.9 |
21.6 |
34.5 |
-12.9 |
100 |
2004 |
28.2 |
66.2 |
3.5 |
97.9 |
31.8 |
29.7 |
2.1 |
100 |
2005 |
57.2 |
49.8 |
9.1 |
116.1 |
43.0 |
59.2 |
-16.1 |
100 |
2006 |
53.0 |
51.9 |
4.0 |
108.9 |
40.5 |
49.4 |
-8.9 |
100 |
2007 |
52.1 |
50.6 |
8.0 |
110.8 |
10.7 |
21.4 |
-10.8 |
100 |
2008 |
181.5 |
-22.1 |
36.9 |
196.4 |
108.3 |
204.7 |
-96.4 |
100 |
2009 |
51.0 |
39.9 |
13.0 |
103.9 |
-9.5 |
-5.6 |
-3.9 |
100 |
2010 |
46.7 |
50.1 |
5.5 |
102.4 |
33.3 |
35.7 |
-2.4 |
100 |
2011 |
129.4 |
13.6 |
21.9 |
164.9 |
80.1 |
145.0 |
-64.9 |
100 |
2012 |
75.9 |
53.9 |
12.0 |
141.7 |
19.8 |
61.5 |
-41.7 |
100 |
Period Average |
1992-95 |
83.7 |
24.3 |
14.2 |
122.1 |
26.0 |
48.1 |
-22.1 |
100 |
1996-99 |
71.9 |
18.3 |
15.9 |
106.1 |
10.9 |
17.0 |
-6.1 |
100 |
2000-03 |
72.1 |
3.2 |
4.4 |
79.7 |
52.8 |
32.5 |
20.3 |
100 |
2004-07 |
47.6 |
54.6 |
6.2 |
108.4 |
31.5 |
39.9 |
-8.4 |
100 |
2008-12 |
96.9 |
27.1 |
17.9 |
141.9 |
46.4 |
88.3 |
-41.9 |
100 |
Source : Computation based on data from World Development Indicators Online accessed on October 25, 2013.
Note : We dropped 1991, because it happened to be an abnormal year for India |
India’s growth records during its two decades of reforms are presented in Table 2.3. Domestic demand during the ‘Asian Financial Crisis’ was significant. In comparison with China, consumption and government expenditure remained major driver of domestic demand during the global recession (1996-99). During global buoyancy (2004-07), GDP growth in India was fuelled equally by consumption and investment. The contribution of consumption to overall growth in India was much stronger than it was for China during the same period. Investment as an instrument to support the growth momentum in India has been fragile during the period of global boom. Over the years, in India, export sector contribution to growth has been improving starting with the ‘Asian Economic Crisis’. During the recent episode of global recession, domestic demand-led growth had been the major policy to maintain high growth, and consumption was the single largest contributor to growth during 2008-09 (181.5 per cent). Government expenditure also played an important role during recession to maintain an overall growth performance. However, the export sector has been consolidating its contribution to growth despite enlargement of the current account deficit in recent years.
Despite broad similarities in the overall economic structure, there exist stark differences in the composition of domestic demand in the two economies. While GDP growth in both economies remained consumption-led in the 1990s, the role of investment in domestic demand improved for China in 2000-09. On the other hand, India continued to maintain a high level of dependence on private consumption marking a 7.4 per cent rise from 54.8 per cent in 1991-2000 to 62.2 per cent in 2000-09.
Compared to China, the share of investment in GDP was lower for India during the period 2000-03. In subsequent years, the share of investment of both the countries was more or less comparable varying around 35 per cent. For instance, the average contribution of investment to GDP was found to be 48 per cent during 2002-07 whereas it hovered around 40 per cent in China.
The relative share of government consumption declined in both the countries during the last decade. It dropped from 13 per cent to 12 per cent in China and from 11 per cent to 10 per cent in India over the period of two decades between 1991-2000 and 2000-12.
To sum up, it can be concluded that the present level of external exposure for India and China is quite consistent with the medium-term growth potential of the two economies. Alternatively, it suggests that the downside risk of double-dip recession was strong for India whereas it could be lesser for China due to strong economic fundamentals. In view of weak external demand, both the countries have some leeway in pursuing domestic demand-based economic policies during the crisis period.
2.3 Outlook for Macroeconomic Situation
According to the IMF (2012a), recovery in China has been stronger than it was predicted earlier on account of the picking up of business activities and financial market in 2010. Resumption of the economy with a high growth rate was expected as an outcome of the macro-economic policies along with high capital inflows. GDP growth rate increased to a double digit figure in 2010 and declined significantly to 7.7 per cent in 2012. It is projected to decline further to 7.3 in 2014. Other reports including the ADB (2012) and ESCAP (2012) have predicted similar trends in real GDP growth rate12 in the medium term. The Chinese Ministry of Commerce (2011) has reported robust domestic growth in 2010 on account of the cascading effects of policy stimulus made earlier. However the recent forecasts indicate about marginal weakening in the growth prospects of China between 2013 and 2017 (IMF, 2013a).
As expected, the Chinese external sector picked up fast in 2010 and 2011 according to the ADB (2012). With the modest recovery of the world economy, Chinese exports grew at a rate of 13 per cent and imports by 13.5 per cent in 2010 due to a robust domestic demand, higher global prices for oil and rising prices of primary commodities. Though world output growth declined from 5.1 per cent in 2010 to 3.8 per cent in 2011 (IMF, 2012b). Chinese exports and imports growth rates were robust during the corresponding period. The Chinese Ministry of Commerce (2011) forecasted a robust growth of the Chinese external sector on account of an expected boom in the domestic economy as well as due to recovery of the developing countries. In 2010, exports grew at the rate of 31.4 per cent and imports by 39.1 per cent amidst persistence of multiple international problems including continuation of the global financial crisis; increasing sovereign debt risks in some countries; persistence of protectionist measures; and domestic concerns like rising inflationary pressure, occurrences of intermittent natural disasters, fast rising of housing prices in urban cities, latent risks in fiscal and financial sectors, etc. Although the pace of Chinese overall exports and imports growth rates slowed down in 2012 in comparison with the previous year, the levels of growth rates were robust. The Chinese government took a strong commitment that the macro policies were effectively managed to ‘enhance quality and efficiency of economic growth, strengthening and targeting flexibility of macroeconomic policies and strive for a steady and faster economic development.’ There is now a growing consensus that China may become the largest economy in the world, pushing the US economy to the second position by 202013.
2.4 Some Areas of Concern
While the performance of China has been exceptional, for bilateral trade there are, of course, many areas of concern, some of which have special significance for India. First, China is experiencing large and increasing inequalities within the economy. Several regions close to India (especially in South West China) are among the laggards in development. There are several government initiated special programmes to help the under-developed regions, which include public investment as well as preferential treatment for FDI in these areas14. These regions border on India, so they may be of special interest to India in terms of trade as well as investment policy.
Second, as noted above, growth in investment has been very high, perhaps excessive from a prudential point of view. There are major risks pertaining to the poor quality and viability of investments. There are various government efforts to rein in investment and to stimulate consumption. So far success in these efforts has been modest. In case investment slows down, it may have implications for India’s exports of iron ore and other raw materials.
The third issue is that raised by the exchange rate policy of China. The country has followed a policy of pegging the renminbi or yuan to the US dollar for more than a decade. Between 2000 and 2005, the renminbi was allowed to trade against the dollar within a narrow range of 8.276-8.280 and has not been allowed to appreciate in synchronisation with the gradual accumulation of foreign exchange reserves and a growing trade surplus. The Chinese trade surplus to the world increased significantly. The trade surplus with the US has been even larger. As the US dollar has tended to depreciate in the recent years with respect to the world’s major currencies, a pegged exchange rate has led to depreciation of the Chinese currency. An artificially depreciated exchange rate can provide broad-based protection from imports and can be of special help to exports. With the large and continuing trade surplus of China with the US, there are pressures from the latter on China to appreciate its exchange rate to actual level. China accordingly, relaxed the exchange rate regime in August 2005 when government suspended the policy of gradual appreciation in late 2008 through early 2009, the renewed tie of the renminbi to the dollar resulted in appreciation of real effective exchange rate. However, Chinese authorities removed fixed tie to dollar in mid 2010 and allowed to appreciate gradually.15
During the last few years, India’s competitiveness has suffered from a sharp appreciation of Indian rupee vis-à-vis the dollar. So far China has been resisting a major appreciation of the renminbi or the floating of the currency. However, if China does revalue the renminbi in relation to the US$ in a major way or agrees to float the currency leading to significant appreciation of the same, it should result in a relative strengthening of competitiveness of India’s goods vis-à-vis China. The expectation is that China will allow the renminbi to appreciate in a very gradual manner rather than revaluing it suddenly.
Fourth, there are concerns relating to a weak financial sector in China which is reeling under the heavy burden of non-performing assets (NPA) estimated to be upto 50 per cent. The government keeps bailing out the banks and financial sector (Wang, 2007; Lu, Feng and Yao, 2009). NPAs have accumulated over the years in the form of subsidised credits extended generously to the state-owned enterprises (SOEs) that form the backbone of the economy. The SOEs are also not required to pay dividend to the government. It is because of such policies and due to other forms of subsidisation of labour costs of enterprises by local governments and municipalities that many countries are not willing to offer a market economy status to China. China, as the target of the largest number of anti-dumping cases, seeks market economy status in bilateral negotiations with different countries and is slowly moving towards financial sector reforms and prudential regulation of capital markets due to growing international pressure. The grant of market economy status to China by India could be considered once the transparent and prudential norms for capital markets have been established and financial sector reforms have been completed.
Finally, an interesting development is the increasing outward orientation of Chinese investment especially in resource-rich areas like Africa. The increasing outward orientation is the result of huge reserves accumulated over the years from its trade surpluses since the mid-1990s. This trend is set to rise further in the coming years as China’s mega investment plans in Africa materialise. Further, China is pursuing its ‘going global’ strategy effectively as can be seen from the formalising of regulations to help investors to invest abroad. In 2006, the State Administration of Foreign Exchange abolished quotas on the purchase of foreign exchange for overseas investment. However, most of these investments abroad are ‘resource-seeking’ in orientation. Some Chinese companies are now actively considering plans to set up an integrated steel plant in India. In 2007, China decided to set up an agency to manage more aggressively a considerable portion of its foreign exchange reserves for offshore investments following the Singapore model.
There are many other challenges in China’s growth story, for example - the massive and growing demand for energy, minerals and other natural resources and their increasing prices, environmental degradation and climate change resulting from rapid growth, widening inequalities between regions and emerging social tensions, governance and democracy, etc. which may have some implications for India’s development but are beyond the scope of the present study.
3. Developments in Chinese Trade Policy: Its relevance for India
3.1 Economic Environment
The macro-economic reforms undertaken by China, including its trade reforms, industrial policy changes, investment liberalisation, and other macroeconomic restructuring have contributed to a positive overall performance of its economy. Some of these initiatives are discussed in this section.
3.1.1 WTO Accession and Trade Policy Changes
After 15 years of negotiations for entry into the WTO, China’s accession to the same in 2001 was a major development in its trade policy16. Many analysts in China and abroad believe that the terms of agreement were quite tough on China in many areas17, such as the financial sector where China agreed to liberalise more than what it obtained from some developed countries. China’s post-WTO accession tariff rates are ‘bound’, meaning that China cannot raise them above the bound rates without ‘compensating’ WTO trading partners. All these reduced drastically China’s ‘policy space’ for active development policy. Despite these concessions, China was not given the status of a market economy until 2016, which means that until that date importing countries would bring in anti-dumping actions without having to prove that the export prices were lower than the domestic market prices in exporting countries. Instead costs in a third country can be used to measure the so-called ‘normal value’ for anti-dumping action. The process is thus open to somewhat arbitrary action and it is no wonder that China has become the target of the largest number of anti-dumping cases for several years in a row. Obtaining market economy status features prominently in China’s bilateral trade agreements. A perception of an unfair agreement under WTO accession prevails in many trade policy quarters in China.
China has also reluctantly accepted some discriminatory provisions in its accession protocol which can be used to limit access of its exports to overseas markets. The first is the transitional product-specific safeguard mechanism which targets Chinese products. It can be invoked if there is market disruption or the threat of market disruption caused by Chinese imports, instead of a more stringent injury test under the WTO Agreement on Safeguards. This safeguard mechanism will last for 12 years after China’s accession to the WTO. The second is the special safeguard mechanism that was applicable to China’s textile and clothing exports until the end of 2008. It provides for a 6.0-7.5 per cent annual increase in the growth of Chinese exports and it can be invoked immediately upon request by the importing country for consultation with China. An implication of the latter is that China has been restrained from taking full advantage of the MFA phase-out under the Agreement on Textiles and Clothing until the end of 2008.
It is also worth noting that trade liberalisation came after nearly two decades of rapid growth and productivity increase in the manufacturing sector. According to studies conducted by the World Bank and others by the mid-1990s, there was a lot of ‘water’ in the tariffs in China: for many of the products, the domestic price was lower than the international price. The principle of ‘infant industry’ protection was fully used by China and serious liberalisation started only after most of the protected industries had healthy growth. The Chinese policies on trade and investment remain in practice mindful of the needs of industrial capacity development in key sectors.
There are several WTO panels investigating China’s violations of WTO agreements. From 1 January 1995 to 31 December 2008, 677 anti-dumping cases have been initiated against China and in 479 cases, measures were taken against. In the year 2008 alone, 73 anti-dumping cases were initiated against China but measures were taken in 52 of these cases. India18 has initiated 120 anti-dumping against China and taken measures in 90 of these cases during the period 1995-2008. More than 23 per cent of the total cases in which India has taken anti-dumping measures are against China. It may be noted that India has so far taken up the maximum number of anti-dumping measures and anti-dumping initiatives against China as compared to other WTO members.
The tariff liberalisation initiated in China during the last few years is summarised in Table 3.1. The average bound rate was unchanged during 2007-11. In 2011, the average bound rate was 9.9 per cent, 14.6 per cent for agriculture and 9.1 per cent for industrial products. China has made significant reductions in tariffs on a range of sectors including motor vehicles and motor vehicle parts, office machinery, large appliances, furniture and chemicals. In one of its more significant tariff initiatives, in 1 January 2005, tariffs on Information Technology Agreement (ITA) products dropped to zero from a pre-WTO accession average of 13.3 per cent. However, China still maintains high duties on some products that compete with sensitive domestic industries.
As a part of its WTO accession commitments, China was to establish large and increasing Tariff Rate Quotas (TRQs) for imports of wheat, corn, rice, cotton, wool, sugar, vegetable oils, and fertiliser with most in-quota duties ranging from 1 to 9 per cent. By 2004, TRQ commitment was largely implemented, although transparency continues to be problematic for some of the commodities subject to TRQs. The number of product lines under TRQs was seen to be declining during the past decade. The number of lines as a proportion of total tariff lines at 8 digit HS declined from 0.9 per cent in 2001 to 0.6 per cent in 2009.
Significant progress has been achieved in standardising the procedures but there are some tendencies to use standards and regulations as a means of protecting domestic industry as tariff rates fall. Redundant testing requirements continue to trouble exporters, particularly in cosmetics, new chemicals, pharmaceuticals19, medical equipment, cellular phones and other telecommunication products, consumer electronic products and automobiles. Exporters also cite problems caused by lack of transparency in the certification process, lack of coordination among standard setting bodies, burdensome requirements and the long processing time taken for licenses. WTO (2010) reported that quantitative restrictions were eliminated on 1 January 2005.
Table 3.1: Structure of MFN Tariff in China, 2001-11 |
(Percent) |
| |
2001 |
2002 |
2003 |
2004 |
2005 |
2007 |
2009 |
2011* |
BOUND TARIFF |
1. Bound tariff lines ( per centof all lines) |
.. |
100 |
100 |
100 |
100 |
100 |
100 |
100 |
2. Simple average bound rate |
.. |
12.4 |
11.3 |
10.4 |
10 |
9.9 |
9.9 |
9.9 |
Agricultural products (HS01-24) |
.. |
17.9 |
16.4 |
15 |
14.7 |
14.6 |
14.6 |
14.6 |
Industrial products (HS25-97) |
.. |
11.4 |
10.4 |
9.6 |
9.1 |
9.1 |
9.1 |
9.1 |
WTO agricultural products |
.. |
18.2 |
16.9 |
15.6 |
15.3 |
15.3 |
15.3 |
15.3 |
WTO non-agricultural products |
.. |
11.5 |
10.4 |
9.6 |
9.1 |
9 |
9 |
9 |
Textiles and clothing |
.. |
17.6 |
15.1 |
14.9 |
11.5 |
11.5 |
11.5 |
11.6 |
3. Tariff quotas ( per cent of lines) |
.. |
0.8 |
0.7 |
0.7 |
0.7 |
0.6 |
0.6 |
0.6 |
4. Duty-free tariff lines ( per cent of lines) |
.. |
4.3 |
5.9 |
6.4 |
7.7 |
7.7 |
7.6 |
7.5 |
5. Non-ad valorem tariffs ( per cent of lines) |
.. |
0 |
0 |
0 |
0 |
0 |
0 |
0 |
6. Non-ad valorem tariffs with no AVEs ( per cent of lines) |
.. |
0 |
0 |
0 |
0 |
0 |
.. |
.. |
7. Nuisance bound rates ( per cent of lines) |
.. |
2 |
2.3 |
2.4 |
2.6 |
2.6 |
2.6 |
2.6 |
APPLIED TARIFF |
|
8. Simple average applied rate |
15.6 |
12.2 |
11.1 |
10.2 |
9.7 |
9.7 |
9.5 |
9.5 |
Agricultural products (HS01-24) |
23.2 |
17.9 |
16.3 |
15 |
14.6 |
14.5 |
14.5 |
14.5 |
Industrial products (HS25-97) |
14.3 |
11.1 |
10.1 |
9.3 |
8.9 |
8.9 |
8.6 |
8.6 |
WTO agricultural products |
23.1 |
18.2 |
16.8 |
15.5 |
15.3 |
15.2 |
15.2 |
15.1 |
WTO non-agricultural products |
14.4 |
11.2 |
10.1 |
9.3 |
8.8 |
8.8 |
8.6 |
8.6 |
Textiles and clothing |
21.1 |
17.5 |
15.1 |
12.9 |
11.5 |
11.5 |
11.5 |
11.5 |
9. Domestic tariff ';peaks'; ( per cent of all lines) |
1.7 |
1.8 |
1.9 |
1.9 |
2.6 |
2.4 |
2.1 |
2.2 |
10. International tariff ';peaks'; ( per cent of all lines) |
40.1 |
29 |
25 |
18.2 |
15.6 |
15.6 |
14.9 |
14.8 |
11. Overall standard deviation |
12.2 |
9.1 |
8.4 |
7.8 |
7.6 |
7.5 |
7.5 |
7.5 |
12. Coefficient of variation |
0.8 |
0.8 |
0.8 |
0.8 |
0.8 |
0.8 |
0.8 |
0.8 |
13. Tariff quotas ( per cent of lines) |
0.9 |
0.8 |
0.7 |
0.7 |
0.7 |
0.6 |
0.6 |
0.6 |
14. Duty-free tariff lines ( per cent of lines) |
3 |
4.9 |
6.7 |
7.2 |
8.6 |
8.7 |
9.4 |
9.4 |
15. Non-ad valorem tariffs ( per cent of lines) |
0.7 |
0.7 |
0.7 |
0.7 |
0.7 |
0.7 |
0.7 |
0.7 |
16. Non-ad valorem tariffs with no AVEs ( per cent of lines) |
0.7 |
0.7 |
0.7 |
0.7 |
0.7 |
0.7 |
0.7 |
.. |
17. Nuisance applied rates ( per cent of lines) |
1.5 |
2 |
2.1 |
2 |
2.6 |
2.7 |
2.7 |
2.7 |
Source: Trade Policy Review, PRC 2007, 2010 and 2012, WTO, Geneva.
Note: * Figures are taken from trade policy review (WTO Secretariat) 2012, pp. 28-29. |
China agreed to eliminate all subsidies prohibited under Article 3 of WTO Agreement on Subsidies and Countervailing measures, including all forms of export subsidies on industrials and agricultural goods upon its accession to the WTO in December 2001. However, the lack of transparency makes it difficult to identify and quantify the possible export subsidies provided by the Chinese government. China’s subsidy programmes are a result of internal administrative measures and are not often publicised. Sometimes these take the form of income tax reductions, or exemptions that are de facto contingent on export performance. China’s subsidy programmes can also take a variety of other forms, including mechanisms such as credit allocations, low interest loans, debt forgiveness and reduction of freight charges. Importing countries have expressed concerns about the involvement of local governments in the use of subsidy to promote exporters.
China has made substantial efforts to overhaul the domestic legal regime to ensure the protection of intellectual property rights in accordance with its commitment to the WTO Agreement of Trade- Related Aspects of Intellectual Property Rights (TRIPS Agreement). These efforts have fallen short in some respects, particularly with regard to the criminal liability of copyright piracy and trademark counterfeiting. In other areas, China has done a relatively good job of revising legal regimes. However, China has been less successful in enforcing its laws and regulations in ensuring effective IPR enforcement. According to the United States Trade Representative (USTR), counterfeiting and piracy in China remain at epidemic levels. In 2007, the US complained to WTO about piracy and blocked access to US films, among others.
A registration system was put in place for implementing China’s WTO commitments on liberalisation of trading rights, both for Chinese enterprises and for Chinese-foreign-joint ventures, wholly foreign-owned enterprises and foreign individuals, including sole proprietorships. Consistent with the terms of China’s WTO Accession Agreement, the importation of some goods, such as petroleum and sugar, is still reserved for state trading enterprises. In addition, for goods still subject to tariff-rate quotas such as grains, cotton, vegetable oils and fertilisers, China reserves a portion of the in-quota imports for state trading enterprises, while it is committed to make the remaining portion available for importation through non-state traders. Among the areas where trading right commitments have not been implemented are importation of books, newspapers and magazines and pharmaceuticals where China still requires foreign pharmaceutical companies to hire Chinese importers to bring their finished products into the country. This has been a major Non-Tariff Barrier (NTB) for Indian pharmaceutical exports.
In accordance with the terms of its WTO accession agreement, China agreed to conduct its government procurement in a transparent manner and to provide all foreign suppliers with an equal opportunity to participate in procurement opened to foreign suppliers. The country applied for the Government Procurement Agreement (GPA) and implemented its first Government Procurement Law in 2003. Under the WTO accession agreement, the government would not influence the commercial decisions of state-owned enterprises, although in practice this has not consistently been the case. However, the law also directs central and sub-central government entities to give priority to ‘local’ goods and services with limited exceptions. One area of special concern is that of government software procurement20 where initial indications are that draft guidelines mandate central and local governments to purchase only software developed in China to the extent possible. At the intervention of the US, these draft guidelines have been suspended indefinitely.
3.1.2 Industrial Policy for Strengthening Industrial Base
Chinese industrial policy was effectively used to promote and protect certain favoured industrial sectors. China has not fully embraced the key WTO principles of market access, non-discrimination, and national treatment, nor has China fully institutionalised market mechanisms and made its trade regime predictable and transparent. Some of the industrial policies that are illustrative of this include, for example, the issuance of regulations on automotive parts tariffs that discourage the use of imported parts; the telecommunications regulator’s interference in commercial negotiations over royalty payments to intellectual property rights holders in the area of 3G standards; the pursuit of unique national standards in many areas of high technology21 that could lead to the extraction of technology or intellectual property from foreign rights holders; draft government procurement regulations mandating purchases of Chinese-produced software; a new steel industrial policy that calls for the state management of nearly every major aspect of China’s steel industry; and excessive government subsidisation benefiting a range of domestic industries in China. There is strict control over foreign ownership of steel companies implying that non- Chinese companies cannot acquire controlling stakes in the company.
China emulated Japan and South Korea in pursuing an industrial policy similar to what was earlier pursued by the two nations during 1970s and 1980s to create local multinational corporations (MNCs) or ‘national champions’ in select areas based on their core competence. Various supportive state policies were pursued including consolidation of fragmented capacities, subsidisation of financial resources22, encouragement of R&D activity and state patronage in their outward operations. The government plans to build 30-50 of its firms into local multinationals by the turn of the present decade. These companies would enjoy tax breaks, cheap land and virtually free funding via state-owned banks and government help in securing contracts or exploration rights abroad. Haier in home appliances is one such highly successful company having built up a commanding share in the domestic market of up to 70 per cent in most appliances, and now operates in over 100 countries. A few auto producers such as Geely are also quickly emerging as large exporters, especially to developing countries, of cheap cars. Some companies have acquired a global position through acquisitions such as Lenovo with a US$ 2 billion takeover of IBM’s PC division. Some of the most successful companies are engaged in the manufactures of telecommunication network equipment, for example: Huawei and ZTE. These companies have emerged as major players in their area of business, commanding nearly one fifth of global exports of telecom equipments. In this sector, India had a stronger manufacturing and R&D base in the form of public sector enterprises and R&D laboratories, namely C-Dot. However, they failed to make a transition with the mobile/cellular technology.
On the other hand, the Chinese strategy of building large manufacturing companies that can sustain large R&D budgets has enabled them to not only compete on the basis of just cheap labour or costs but also on the basis of technological innovation. These efforts enabled China to emerge as a production hub of the global economy. In the process, China has engaged in the process of mass production of manufacturing products, which has the advantage of lowering the price. Global experiences indicate that lead firms in certain countries, are engaged in various value-added services including R&D and design activities, which could bring them brand values in the global economy. Large firms in countries like Japan and Korea gained from the brand value of their products. But, similar experiences were not replicated for many including fast industrialising countries including emerging countries in recent years (Birnik, Birnik and Sheth, 2010).
Chinese companies have not developed a brand name for their products globally. Rather other countries have developed brand names using products originated from China. As such, China has a few valuable brands that are known globally. Among the top 100 brands in the Interbrand’s 2012 valuation of the world, a few Asian brands were listed from Japan and Korea but none from the Asian manufacturing giants like China and India (Interbrand, 2012).
The production base of China has not helped the country in developing its brand name. The Chinese policy of creating ‘Local Champions’ or local MNCs has not been successful in creating production giants with coveted brand names like the Japanese or Koreans. Though China followed the models of Korea and Japan in creating MNCs, the country achieved very little from this initiative as compared to Japan and Korea.
Interestingly, firms in other countries are using the production base of China for creating their own brand name in the domestic or international markets. For example, the Karbonn mobile has evolved a brand name in India in the low-end of the product, but sourcing the products from China. It is interesting to note that ‘margin of business from production’ may be high in a country having an efficient production base but the ‘margin of business from trade’ could be larger with the branding of a product. For example, a Barbie doll is sold at the price of $10 in the US market with the import price of $2. Out of which a Chinese manufacturer receives a remuneration of $0.35 and the rest ($1.65) goes to activities such as material cost, packaging, etc. (Barboza, 2006; Chen, 2005). In the US market, a Hugo Boss shirt is sold at the price of $120. While the Chinese manufacture shares 10 per cent of the cost, 60 per cent of it goes to the brand owner (Chen, 2005). For this reason, the top global manufacturers are not global top brand owners and the latter set of companies mostly outsource their manufacturing to Asia (Fan, 2006). When a country is able to combine its efficient production base with branding, it can optimise its ‘margin of business’.
However, China has doubled the R&D expenditure from 0.6 per cent of GDP in 1995 to over 1.2 per cent in 2004. It was projected to have emerged as the second largest investor in R&D after the U.S. in 2006 (OECD, 2007). Correspondingly, the number of researchers employed increased by 77 per cent between 1995 and 2004, possibly next to the US. Both state-owned23 and domestic private firms compete in terms of their expenditures in R&D activities as shown in Table 3.2. While R&D intensity is much higher in state-owned firms than in domestic private firms in pharmaceutical and medical equipments, it is more in sectors like telecommunications24 and office equipments for the domestic private enterprises. In China, R&D intensity is strong in certain sectors such as electric equipments, computer hardware and medical equipments. Interestingly, R&D intensity happens to be more strong for small firms than for others (see Box no. 3.1).
Table 3.2: R&D Intensity by ownership and size in selected sectors (per cent of sales, 2004) |
| |
State-owned |
Domestic private |
JV HTM |
JV Foreign |
Foreign |
Pharmaceuticals |
2.0 |
1.3 |
1.9 |
1.3 |
0.8 |
Electronics & Telecom |
3.2 |
3.7 |
0.6 |
1.0 |
0.4 |
Computer and Office equipment |
2.0 |
4.7 |
0.7 |
0.9 |
0.3 |
Medical equip. and instruments |
4.1 |
3.0 |
1.0 |
2.2 |
0.1 |
Small firms |
1.2 |
1.6 |
1.0 |
1.7 |
1.5 |
All firms |
1.3 |
0.9 |
0.4 |
0.6 |
0.3 |
Note: Small firms = 14 per cent of total business R&D (OECD = 17 per cent).
Source: OECD (2007). |
_______________________________________________________________________________________________________________________________________________________________
Box 3.1. R&D and Innovation in China
In the Post-Cultural Revolution period, the scale of R&D activities offered very low support to the mammoth task of production activities in the domestic economy. During this period, production activities were mostly propelled by imported technology. The need for a renewed emphasis on a domestic ‘innovation-oriented’ approach was felt during the economic upheaval of China during the last few years. The S&T Strategic Plan 2006-2020 has set out the key objectives and priorities in science and technology and envisages the need to develop capabilities for indigenous or home-grown innovation. Institutional reform of the S&T system was launched in 1985 with reform measures focused on public R&D funding, transformation of R&D institutions in applied research into business entities and/or technical service organisations, and the incorporation of large R&D institutions into large enterprises, creation of markets for technology, and reform of the human resource management in public research institutions. R&D activities were mostly located in S&T industrial parks, university science parks and technology business incubators under the Torch programme and spin-offs from public research organisations started to fill the gap. By the turn of the century, a combination of experimental national policies in special zones, bottom-up initiatives supported by regional and local authorities, and top-down systemic reforms had given birth to the National Innovation System (NIS). China now pursues a growth path that is less dependent on low-skill, resource-intensive manufacturing. Human capital formation and the encouragement of capabilities in science, technology and innovation play a key role as potential engines of future growth. In June 2007, four industry-research strategic alliances, concerning steel, coal, chemistry and agricultural equipment, were set up with government support. They aim to address long-standing problems related to the low level and dispersal of innovation capabilities, the inadequate supply of generic technologies and the lack of core technological competencies in these sectors.
China has excelled in mobilizing resources for science and technology on an unprecedented scale and emerged as a major R&D player. R&D spending has increased at an annual rate of 19 per cent since 1995 and reached US$ 30 billion in 2005. Similarly, the R&D/GDP ratio improved from 0.6 per cent in 1995 to 1.34 per cent in 2005. As far as allocation of funds is concerned, more than 70 per cent of the gross domestic expenditure has been for experimental development, leaving only 6 per cent to basic research. The business sector is the dominant R&D actor performing over two-thirds of total R&D, up from less than 40 per cent at the beginning of 1990. The number of firms in technology business incubators (TBIs) has more than quadrupled since 2000 to almost 40,000 in 2005. In addition, China has ranked second in the world after the United States and ahead of Japan in number of researchers engaged in these activities since 2000.
Despite significant progress, the current state of innovation activities is far below the global standards. China’s NIS is not fully developed and imperfectly integrated with linkages between actors and sub-systems. Technology transfer to China through operations of the foreign-invested enterprises and related spill-overs to the domestic economy have not met expectations. Lack of effective IPR protection and deficiencies in framework manifest in conditions such as a passive learning-based education system, inadequate product market competition, top-down model of corporate governance and financing difficulties affects the R&D activity in the country. Current regional patterns of R&D and innovation activities are not optimal from the perspective of efficiency by creating a physical separation between knowledge producers and potential users. The demands for scientific inputs to innovation are very limited as the vast majority of domestic firms have not put innovation at the core of their business strategy. The concept of pre-competitive research, as opposed to near-market applied research or mere technological development, as well as that of public-private partnership, are not yet well understood by many actors in the innovation system. In order to build a modern, high-performance national innovation system, China will have to maintain a high-level of investment in R&D, innovation and education to overcome the remaining institutional and structural weaknesses of its current innovation system.
Source: OECD (2007)
________________________________________________________________________________________________________________________________________________________________
In an effort to build local MNCs, the Chinese government is supporting companies by consolidating fragmented domestic industries and then expanding these internationally. Baosteel (in steel), Chalco (in aluminium) and Yanzhou (in coal) are among companies that have been created through this process. A similar strategy is now being pursued to build cement champions by the National Development and Reform Commission (NDRC).
3.1.3. Exploiting the Potential of FDI for Export-oriented Production
One of the key features of China’s Foreign Direct Investment (FDI) regime has been the better than national treatment in its taxation polices for foreign invested enterprises (FIEs). The standard enterprise income tax is 33 per cent. However, an enterprise income tax rate of 15 per cent applies to FIEs located in special economic zones (SEZs), or to FIEs involved in manufacturing in the economic and technological development zones (ETDZs); and a rate of 24 per cent applies to FIEs involved in manufacturing and located in the coastal economic open zones, or the old urban districts of cities where SEZ or ETDZs are located. Hi-tech FIEs located in hi-tech industrial zones enjoy a two-year income tax exemption; those involved in manufacturing also enjoy the 50 per cent income tax reduction in the following three years. Export-oriented FIEs enjoy the same two-year exemption and the 50 per cent reduction as long as the volume of annual exports is at more than 70 per cent of the general sales of the enterprise. In addition, FIEs operating in designated manufacturing industries in the western and central regions of China enjoy a complete tax holiday during the first two years after making profits and a 50 per cent income tax reduction during the following six years.
Such preferential treatment of FDI supported by a well developed infrastructure and a large domestic market has helped China to become the largest recipient of FDI among developing countries25. There has been a debate on the ability of China to mobilise such a massive inflow of FDI in contrast to India’s ability to attract only US$ 5-6 billion of annual inflows. However, it has been argued that more than the magnitude, the Chinese achievement has been in terms of making FDI work for its development. China has successfully leveraged access to its large market with foreign MNCs in return for building export capabilities. Foreign invested enterprises undertook 57 per cent of China’s merchandise exports and over 80 per cent of her high-technology exports in 2004 (OECD, 2007).
Having accumulated such a massive stock of FDI26, China in early 2007 moved towards scrapping the preferential tax regime for FIEs. These are no longer exempt from paying land use tax. In March 2007, it moved to unify the income tax rates paid by foreign and domestic firms at 25 per cent and unveiled a series of tax breaks to promote high-technology, environmental protection oriented and energy saving ventures. China has revised its laws and regulations for foreign-invested enterprises in an attempt to eliminate WTO-inconsistent requirements relating to export performance, local content and foreign exchange balancing as well as technology transfer. China also revised the ‘buy China’ policies that regulated procurement of raw materials and fuels, and removed its requirements of joint ventures and wholly-owned enterprises to submit production/operation plans to Chinese authorities. However, some measures continue to ‘encourage’ technology transfer, without formally requiring it. Moreover, some Chinese government officials still consider factors such as export performance and local content when deciding whether to approve of an investment or to recommend approval of a loan from a Chinese bank. The auto industry policy of May 2004 continues to include provisions that discourage imports of auto parts and has drawn criticism from foreign companies. It has also included a requirement of a sizeable minimum investment (US$ 200 million).
Investors in China continue to confront a lack of transparency, inconsistently enforced laws and regulations, weak IPR protection, corruption and an unreliable legal system incapable of protecting the sanctity of contracts. Yet, foreign and domestic companies have continued to report high profitability in 2010, indicating that the challenges to doing business in China have been largely surmountable (World Bank, 2010).
3.1.4 Approach towards WTO’s Doha Round of Negotiations
China has been an active participant in the WTO’s Doha Round negotiations and works closely with India and other developing countries. On a number of important issues, its position is close to that of India. For instance, China is a member of G-20 and G-33 on agriculture along with India and shares the perception that distortions in developed countries in agriculture need to be reduced while developing countries should retain flexibilities for food security and livelihood concerns through SP and SSM. Even though China is not a member of NAMA-11, it has supported India position and of NAMA-11 countries that tariff peaks and tariff escalation in developed countries on products of export interest to developing countries should come down. China’s position on IPRs especially on the relationship between TRIPs and the Convention on Biodiversity (CBD), in particular on the need for evolving a system of prior informed consent and access and benefit sharing for the exploitation of indigenous knowledge and biodiversity of developing countries, is similar to that of India’s. In the early years of Doha negotiations, China supported India’s position on Singapore Issues. The China-India Joint Ministerial Statement on WTO issued during the visit of India’s Commerce and Industry Minister to Beijing in 2007 was an important milestone in the direction of growing coordination between the two countries in multilateral trade negotiations.
3.2 Trade and Trade Policies in Key Sectors of Interest to India
The sectoral composition of China’s exports has some interesting characteristics. While China is usually seen as specialising in exports of labour-intensive products, its export basket is rapidly moving towards high technology products. The cutting edge of China’s exports is now provided by relatively high technology products involving machinery and transportation equipment, particularly office machines and telecommunication equipment and parts. Exports of these products have increased more than five-fold in the last 7 years and they now account for nearly half of the manufactured products. One important gap in China’s export drive is evident in the service sector. In the old socialist paradigm, services were not included in GDP in China as in other socialist economies. The national income statistics include services since the initiation of market oriented reforms, but the sector is still relatively underdeveloped. With respect to external trade too, China was lagging in exports in this sector. In 2012, China is expected to have a significant trade deficit in the service sector.27 India on the other hand has a large service sector and its exports of services are increasing rapidly. As discussed below, this may well be a niche area for India’s exports to China.
For assessing sectors in which India may have opportunities for expanding its exports to China, it is useful to review China’s trade policy in some key sectors.
3.2.1 Agriculture
The tariff liberalisation policy in agriculture has been striking in China since its accession to WTO. Applied tariffs on agricultural products declined from 23.2 per cent in 2001 to 14.5 per cent in 2011. There has been a considerable reduction in the average rate of applied tariff in sectors like dairy products, grain and oilseeds. Tariffs on sugar and tobacco remained high for some time. Lower tariffs apply to sub-sectors where China apparently has a comparative advantage such as labour intensive horticultural and animal products. The agricultural average bound tariff rate was 17.9 per cent in 2002 and declined to 14.6 per cent in 2011.28 Despite a sharp reduction in the average bound rate, the divide between agriculture and industrial sector remained significantly high during the last decade.
The proportion of product lines under tariff quota in the total number of tariff lines declined from 0.9 per cent in 2001 to 0.6 per cent in 2009. As in other countries, the system serves to restrict the quantity of imports and is necessary to avoid large quantities of imports affecting farmers’ incomes and social stability. Despite liberalisation, the government retains some influence on imports and exports through State-Trading Enterprises which include grain (including maize, rice, and wheat), vegetable oil, sugar, tobacco, and cotton as well as chemical fertilisers. Exports of agricultural products are subsidised by local and the central governments. The Trade Policy Review (TPR) of the WTO finds that concerns are mostly due to subsidy-related programmes for exports by local governments. Besides officially supported export credits are also source of concern for the WTO members. WTO (2010),29 has outlined the need for submitting fresh notifications regarding its subsidies.
Government intervention in agriculture, though declining is still significant. For achieving the broad objective of food security to promote industrialisation, along with raising rural incomes through price support, a heavy financial burden falls on the government on account of providing subsidies, managing consumer prices, and other measures. According to USTR, agricultural trade with China remains among the least transparent and predictable of the world’s major markets. Capricious practices by Chinese customs and quarantine officials can delay or halt shipments of agricultural products in China, while sanitary and phytosanitary (SPS) standards with questionable scientific bases and a generally opaque regulatory regime frequently bedevil traders in agricultural commodities. The restriction on Indian fruits and vegetable until recently is a case in point. India has been struggling to gain market access in China in number of fruit and vegetable products where it has global competitiveness for exports including in China.
3.2.2 Manufacturing
Tariff liberalisation has been very dramatic in the Chinese manufacturing sector during the past decade. Average applied tariffs on industrial goods have come down from 14.3 per cent in 2001 to 8.6 per cent in 2011. However, an array of non-tariff measures are still used in some instances to restrict imports and exports.
China is the largest textiles and clothing producer in the world. Of the sector’s total output, more than two-thirds is consumed domestically and the rest is exported. Since 1995, China has emerged as the world’s largest textiles and clothing exporter. Its trade policy regarding the textiles and clothing industry consists mainly of reducing tariffs and non-tariff restrictions on imports and relaxing controls on some exports. In addition, in agreement with certain trading partners, China imposed restrictions on some exports. China has signed an MOU with the EU, the USA and Brazil to limit the growth rates of its exports to these countries until 2008 at annual rates within the range of 10-18 per cent. China also encourages investment abroad by textiles and clothing companies, in particular in developing and least developed countries, by providing preferential loans, simplifying administrative procedures, and enhancing information support.
It is highly likely that as China moves into more advanced technology-oriented products, the production base for textiles and clothing will slowly shift to other countries. India should be ready for benefits from such a restructuring and get into partnerships with foreign firms now establishing production facilities in China as also with the Chinese firms to prepare for the phase when that shift occurs. In particular, India needs to gear itself up for mass produced garments — an activity in which China has a clear advantage with massive production bases that can handle very large orders-to be able to take advantage of the opportunities arising from the Chinese industry phasing itself out of the garment trade. However, western importers may be willing to buy more from India in preference to China, provided we can supply volumes, as a part of their strategies.
China has been the world’s fourth largest automobile manufacturer since 2003, after the United States, Japan and Germany. In 2004, China became the third largest market in the world, after the United States and Japan. According to forecast made by Goldman Sachs reported in The Economist, 16 September 2006, the car ownership in China may exceed that of the US by 2025 and may become twice as high (over 400 million vehicles) as the level of US ownership by 2040. China has become the world’s second largest car market in terms of sales as millions of Chinese are buying cars for the first time. India cannot afford to ignore this market. India should start preparing for penetrating this market. Just as Japan and Korea succeeded in competing with the giant car manufacturers of the US, India can succeed in competing with the manufacturers in China, which are generally joint ventures between state-owned enterprises and foreign car majors. A few home grown companies like Geely and Cherry have come up rapidly as producers of cheap cars. However, quality and reliability concerns have affected their plans to move into the developed country markets until 2008. Foreign investment plays an important role in China’s automotives sector and FIEs accounted for around three-fourth of China’s passenger car production.
China’s electronic and communications equipment industry is the third largest in the world in terms of output, after the United States and Japan. Electronic and communications equipment also account for the largest share of China’s exports. The export revenue of the sector constitutes nearly one-third of China’s total export value. In the total export proceeds, the share of domestic firms has been insignificant. The central government has adopted several measures to assist the development of the electronic and communications equipment industry, in particular to improve the technological capabilities of domestic enterprises. Under this policy, the government allocates funds to software and IC industries for the establishment of software design centres in, inter alia, universities and research institutes. Preferential policies include VAT rebates, tariff exemptions for imported equipment for own use, export loans provided by EXIM Bank and export credit insurance provided by SINOCUE at favourable terms, government procurement preferences, and a special fund to promote domestic enterprises’ R&D ability in the semi-conductor industry. The government is also encouraging domestic industries to invest abroad in an attempt to upgrade technology and to establish a commercial presence in the international market. China joined the WTO Information Technology Agreement (ITA) in 2003 and 258 tariff lines at the HS eight-digit level were subjected to zero tariffs according to the new agreement. Import licenses and quotas on certain electronic and communications equipment products have been removed.
In the pharmaceutical sector, China is very poorly placed in comparison with India due to a differentiated policy regime and management skills. There is no Chinese product line or new chemical product that has been certified by FDA (Food and Drug Administration of the U.S.). China is mostly a raw materials supplier and is lacking in production of generic branded products. The Chinese market could be potentially a high export market for Indian pharmaceutical products. However, there are reports that in several bulk drugs, producers are complaining about imports of cheap drugs from China. The competition is very severe for firms producing bulk drugs like azithromycin, clarithromycin, ciprofloxacin, norfloxacin, roxycomycin, cephalosporins and anti-quinolines.
3.2.3 Services
The services sector in China has been underdeveloped during the planning era and now presents a significant potential in view of the rapid growth of the economy. In order to tap that potential, the Chinese government has identified the development of services sector as a priority sector in the 11th and 12th Five-year Plans for National Economic and Social Development. With the spectacular performance of exports and imports over the past few years, the contribution of services to GDP in terms of value added has surged from 39.7 per cent in 2005 to 40.1 per cent in 2008. Some of the most important export sectors in services have been transport and other business services during the last decade. Potentially other important export sectors are communication, construction, computer and information, insurance, finance & royalties and license fees, which are expanding fast in recent years.
Both as a matter of policy and as a result of its WTO commitments, China decided to significantly liberalise foreign investment in its service sectors. In its Accession Agreement, China committed itself to the substantial opening of a broad range of services particularly, in sectors of possible importance to India such as banking, insurance, distribution, telecommunications and professionals services. These commitments are in principle far reaching particularly, when compared to services commitments of many other WTO members. These areas also happen to be of interest to the US and there is much potential for India to work jointly with the US companies in expanding India’s presence in China in these areas.
While China continued to keep pace nominally with the openings required by its WTO accession agreement, it frequently maintained or erected terms of entry that were so high or cumbersome as to prevent or discourage many foreign suppliers from gaining access. For example, despite some progress, excessive capital requirements continue to restrict market entry for foreign suppliers in many sectors, such as insurance, banking, securities, non-bank motor vehicle financing, asset management, direct selling, franchising, freight forwarding and telecommunications, among others. In addition, in sectors such as insurance and legal services, restrictions continue on the expansion of branches, which are contrary to China’s commitments to WTO in its services schedules.
In what follows, we discuss the position with respect to some selected services.
Construction, engineering, architectural and contracting services: In September 2002, the Ministry of Construction and MOFTEC jointly issued Decrees 11 and 114, which opened up construction and related construction design services to joint ventures with majority foreign ownership, 2 years ahead of schedule, to wholly foreign-owned enterprises. At the same time, however, these decrees created concerns for the foreign firms by imposing new and more restrictive conditions than those that existed prior to China’s WTO accession. In particular, these decrees for the first time required foreign firms to obtain qualification certificates, effective 1 October 2003. In addition, these decrees for the first time required foreign-invested firms supplying construction services to incorporate in China. High minimum registered capital requirements and foreign personnel residency requirements that are difficult for many foreign firms to satisfy were also imposed. There are other restrictions as well. Foreign firms cannot hire Chinese personnel to practice engineering and architectural services as licensed professionals. Currently, China’s reengineering and architectural firms must approve and stamp all drawings prior to construction.
Accounting and management consultancy services: Upon its accession to the WTO, China agreed to allow foreign accounting firms to partner with any Chinese entity of their choice. China also agreed to abandon the prohibition on foreign accounting firms’ representative offices engaging in profit-making activities. In addition, China agreed that foreign accounting firms could engage in taxation and management consulting services, without having to satisfy the more restrictive requirements on the form of establishment applicable to new entities seeking to provide those services separately. Accounting systems in China are badly in need of modernisation. The MOF has been active on standardising accounting procedures across a wide range of topics including investments, inventories, cash flow statements, and fixed assets. The Chinese Securities Regulatory Commission meanwhile requires a listed company to appoint a certified international CPA firm to conduct audits on prospectuses and annual reports in accordance with international standards. China complied with international accounting standards since 2007. As such the demand for accountants is on the rise and with India’s expertise in accountings services this may a niche market for India.
Finance: Financial sector reforms began in China in 1979, when the monopoly of the People’s Bank of China (PBC) was removed and its commercial functions were separated into four state-owned banks. Joint-stock banks were introduced later to diversify the ownership structure in the banking sector. A notable feature of the financial sector is the high degree of government ownership (WTO, 2007).
The banking sector remains the most important source of credit in the financial sector (Zhou, 2009). The assets of the banking sector are highly concentrated; the largest four banks currently account for 54 per cent of banking assets. The reforms that began over 25 years ago are, however, slowly starting to improve competition in the banking and insurance sectors. Since the 1990s, the government has also been trying to deal with the problem of non-performing loans (NPLs), which remain relatively high in the state-owned banks (Tong, 2002; Lu, Thangavelu and Hu, 2005; WTO, 2007). With official statements claiming to have controlled the NPL ratio, several research reports document that new bad loans are accumulating in the financial system. Further, in the fast moving Chinese economy with accelerating rates of investment, the government has hinted at a tightening of the economic policy to control money supply growth.
WTO’s Trade Policy Review finds that the restrictions on the operations of foreign banks have gradually declined. Since reforms these have been permitted to establish branches, although with geographic, product, and client restrictions. However, as a result of its accession to the WTO, China permitted foreign investment in the banking sector without geographic or client restrictions by the end of 2006. Beijing agreed to free its banking sector to full foreign competition by December 11, 2006 though with proposed regulations that according to some analysts could hamper overseas banks in attracting retail customers.
Movement of professionals: There are no special entry restrictions placed on professionals working in China such as doctors and engineers. Government seems to be considering measures to liberalise access by issuing permanent resident visas to long-term foreign residents of China. Given the shortage of doctors of western medicines in China and India’s expertise in this area there may be large opportunities for Indian doctors perhaps working initially in large cities with a significant expatriate population with international clinics.
4. India-China Bilateral Trade and Economic Relations
4.1 Trends in Chinese Trade with the World
In the resurgence of the Chinese economy in the recent decade, the external sector played an important role, though it passed through a phase of volatility due to the periodic swing of global business cycle. Between 1998 and 2012, Chinese trade with the world economy registered an eleven-fold increase, surpassing the performances of other fast growing countries of the world. The country’s total export was US$ 184 billion 1998 and increased to US$ 2.05 trillion in 2012 (see Table 4.1). Similarly, imports increased from US$140 billion to US$1.8 trillion dollar between 1998 and 2012, showing a more than thirteen-fold increase during the decade. It is important to note that imports increased more rapidly than exports.
Table 4.1: China's Trade with the World Economy |
(US$ Million) |
Trade |
Export |
Import |
Trade Surplus |
Sur/Exp |
| |
Actual |
Growth |
Actual |
Growth |
(percent) |
1998 |
183751 |
|
140385 |
|
43366 |
23.6 |
1999 |
194941 |
6.1 |
165718 |
18.0 |
29223 |
15.0 |
2000 |
249223 |
27.8 |
225175 |
35.9 |
24048 |
9.6 |
2001 |
266723 |
7.0 |
243567 |
8.2 |
23156 |
8.7 |
2002 |
325783 |
22.1 |
295440 |
21.3 |
30343 |
9.3 |
2003 |
438486 |
34.6 |
412837 |
39.7 |
25649 |
5.8 |
2004 |
593770 |
35.4 |
560811 |
35.8 |
32959 |
5.6 |
2005 |
762648 |
28.4 |
660224 |
17.7 |
102424 |
13.4 |
2006 |
969698 |
27.1 |
791795 |
19.9 |
177903 |
18.3 |
2007 |
1218700 |
25.7 |
956264 |
20.8 |
262436 |
21.5 |
2008 |
1429340 |
17.3 |
1131920 |
18.4 |
297420 |
20.8 |
2009 |
1203420 |
-15.8 |
1003910 |
-11.3 |
199510 |
16.6 |
2010 |
1580400 |
31.3 |
1393920 |
38.8 |
186480 |
11.8 |
2011 |
1901480 |
20.3 |
1741450 |
24.9 |
160030 |
8.4 |
2012 |
2051910 |
7.9 |
1817380 |
4.4 |
234530 |
11.4 |
Average for the period |
1999-2001 |
236962 |
13.7 |
211487 |
20.7 |
25476 |
11.1 |
2001-2003 |
343664 |
21.3 |
317281 |
23.1 |
26383 |
7.9 |
2004-2007 |
886204 |
29.2 |
742274 |
23.6 |
143931 |
14.7 |
2007-2010 |
1357965 |
14.6 |
1121504 |
16.7 |
236462 |
17.7 |
2010-2012 |
1844597 |
19.9 |
1650917 |
22.7 |
193680 |
10.5 |
Source: Direction of Trade Statistics, Online accessed on October 27, 2013, IMF, Washington DC.
Note: Sur/Exp denotes share of trade surplus to exports and Growth denotes compounded annual growth rate (CAGR). |
The global business cycle has had a profound impact on the performance of the Chinese external sector. During the slump period of 2001-2003, the average growth rate of the trade sector was 22.1 per cent per annum on an average, and revived during 2004-07 with an average annual growth rate of 26.5 per cent with global recovery. In the recent episode of ‘global financial recession’ (2007-2009), the average annual growth rate remained positive, but remained lowest in recent years owing to the negative external sector growth recorded in 2009. Despite the Euro Zone Crisis’, Chinese external sector resumed with high growth in 2012. During 2010-12, Chinese overall trade expanded at the CAGR of 14.1 per cent, where imports grew faster than its exports. The experience shows that the revival of the Chinese trade sector in the subdued global economy has been very swift in recent years.
One of the important features of the Chinese export sector has been its persistent creation of trade surplus over a period of time despite global recession. The size of trade surplus from merchandise trade was growing at the CAGR of 101.4 per cent during 2004-07. The growth trajectory of trade surplus was so stiff that a negative growth rate was recorded in 2009 after 5 years of persistently positive growth performance. Although the recession continued the world economy until 2009 in the first phase of global recession, China generated a trade surplus of US$ 200 billion, covering 16.6 per cent of its exports. This process continued even during the ‘double-dip’ recession where it registered a trade surplus of US$235 billion in 2012 and grew at the CAGR of 12.1 per cent during the period 2010-12.
China has impressively integrated itself with the world economy, particularly after its accession to the WTO in 2001. During 1998-2009, the world trade grew by 2.3 times, but trade by China grew three times more than that of the global trade. Sparks of such growth performances were felt in both exports and imports of the country. China has gradually improved its global share in exports and imports since the post Asian Financial crisis. In 1998, the country’s share in the global exports and imports were 3.4 per cent and 2.5 per cent respectively, but these shares increased to 9.7 per cent and 7.8 per cent respectively, in 2009. Interestingly, Chinese share in the global trade improved significantly during the period of recession. The global trade increased by 40 per cent during the period 2010-12, but Chinese trade with the world grew faster than the world trade. Chinese exports and imports share with the world were 9.0 and 8.2 per cent respectively during the same period. Chinese exports have been dependent on its imports and opportunities in the import sector have to be explored strategically to have a wider market access in China.
4.2 Changing Trends of Bilateral Trade Engagement
Bilateral trade between India-China has grown rapidly in the past few years and picked up significantly after Chinese accession to WTO. Bilateral trade turnover jumped by nearly twenty five times, from US$ 2.7 billion in 2001 to nearly US$ 68.8 billion in 2012 (Table 4.2). With a conservative estimate, the India-China trade turnover was expected to cross US$ 60 billion in 2010 and further to 125 billion in 2012. The expected target was almost achieved where trade reached US$ 58.9 billion in 2010. However, expected target was significantly under achieved to touch the level of 68.8 billion in 2012 due to ‘double-dip’ recession. China has now emerged as the largest trade partner of India30 since 2008-09.
During the last nine years, exports of India to China have grown at an annual rate of 29.8 per cent and by 2009, formed 7.7 per cent of the total exports. In 2001, China was lagging behind several countries including Belgium and Singapore so far as its share in the total trade of India is concerned. In the same year, China shared 3.5 per cent of India’s total trade whereas the US shared 14.4 per cent, the UK 5.1 per cent and Belgium 4.1 per cent of total India’s trade. The trade scenario changed significantly in 2009 with a sizable increase in India’s bilateral imports. China not only jumped up in its ranking among India’s lead bilateral trade partners but also splashed the Indian market with its exports, causing serious bilateral trade imbalances. It is now sharing nearly 9 per cent of India’s total trade in 2009. Its current bilateral trade is larger than the combined bilateral trade of Germany, the UK and Japan with India.
Table 4.2: India's Bilateral Trade Engagement with China |
(US $ Million) |
Year |
India's Bilateral exports |
India's Bilateral Imports |
Total Bilateral Trade |
Trade Balance |
Actual |
Growth |
Share in Total Exports |
Actual |
Growth |
Share In total Imports |
Actual |
Growth |
1998 |
500 |
|
0.5 |
1102 |
|
0.4 |
1602 |
|
-602 |
1999 |
511 |
2.2 |
0.5 |
1240 |
12.5 |
0.4 |
1751 |
9.3 |
-729 |
2000 |
758 |
48.3 |
0.7 |
1449 |
16.9 |
0.5 |
2207 |
26.0 |
-691 |
2001 |
916 |
20.8 |
0.9 |
1809 |
24.8 |
0.7 |
2725 |
23.5 |
-893 |
2002 |
1720 |
87.8 |
1.6 |
2603 |
43.9 |
0.9 |
4323 |
58.6 |
-883 |
2003 |
2710 |
57.6 |
2.5 |
3738 |
43.6 |
1.3 |
6448 |
49.2 |
-1028 |
2004 |
4178 |
54.2 |
3.9 |
6073 |
62.5 |
2.2 |
10251 |
59.0 |
-1895 |
2005 |
6473 |
54.9 |
6.0 |
9926 |
63.4 |
3.6 |
16399 |
60.0 |
-3453 |
2006 |
7910 |
22.2 |
7.4 |
15813 |
59.3 |
5.7 |
23723 |
44.7 |
-7903 |
2007 |
10195 |
28.9 |
9.5 |
24692 |
56.2 |
8.9 |
34887 |
47.1 |
-14497 |
2008 |
9664 |
-5.2 |
9.0 |
30276 |
22.6 |
10.9 |
39940 |
14.5 |
-20612 |
2009 |
10155 |
5.1 |
9.5 |
28840 |
-4.7 |
10.4 |
38995 |
-2.4 |
-18685 |
2010 |
17519 |
72.5 |
16.3 |
41333 |
43.3 |
14.9 |
58852 |
50.9 |
-23814 |
2011 |
19113 |
9.1 |
17.8 |
55299 |
33.8 |
19.9 |
74412 |
26.4 |
-36186 |
2012 |
14859 |
-22.3 |
13.9 |
53984 |
-2.4 |
19.4 |
68843 |
-7.5 |
-39125 |
Average |
1999-01 |
938 |
51.5 |
2.2 |
1594 |
24.6 |
3 |
2532.2 |
33.4 |
-656 |
2001-03 |
1992 |
57.6 |
3.7 |
2812 |
37.5 |
4.3 |
4803.2 |
44.3 |
-820 |
2004-07 |
7189 |
40 |
6.3 |
14126 |
60.3 |
8.2 |
21315.1 |
52.7 |
-6937 |
2007-10 |
11928 |
25.8 |
6.6 |
31955 |
31.7 |
11.2 |
43883.4 |
29.4 |
-20027 |
2010-212 |
17164 |
19.8 |
16.0 |
50205 |
24.9 |
18.1 |
67369 |
23.3 |
-33042 |
Source: Direction of Trade Statistics, Online accessed on October 27, 2013, IMF, Washington DC.
Note: Growth denotes compounded annual growth rate (CAGR). |
During the last decade, the growing bilateral trade imbalance against India was not corrected, while taking an unmanageable shape even during the current episode of recession. With an increase in the two-way trade, the trade deficit increased exponentially, and it may not be sustainable for a long period of time. While the uncovered trade gap was reported at US$ 602 million in 1998, it increased alarmingly to US$ 39.2 billion in 2012. During the earlier part of the decade (i.e. 2001-02), the size of the trade deficit declined for a few years, but started growing since 2002. During the last decade, the growth of the trade deficit was robust for the period 2004-07 when the global economy was booming. The trade deficit made a quantum jump in 2006 to reach a level of US$ 7.9 billion from US$ 3.5 billion in the previous year, posting an annual growth rate of 129 per cent. A peak bilateral deficit to the extent of 39.2 billion was reported in 2012. However, the growth rate of bilateral trade deficit has started declining since 2006, though the volume of the same is growing significantly over the years except for 2009.
4.3 Changing Composition of Trade
A look at composition of India’s exports to China, however, raises doubts as to whether the recent trends in exports can be maintained. India’s export basket has been dominated by primary and resource-based products. The past growth rates in these exports are unlikely to be maintained, partly because as a part of India’s new mineral policy, it may seek higher value addition for minerals and thus discourage such exports and partly because China’s demand for such imports connected with the current investment boom may not be sustainable. There are some signs of diversification in Indian exports in recent years. Exports of auto components, pharmaceuticals and machinery items have been increasing over the last few years. Acceleration in the growth rates of these manufactured products may be essential for achieving the target31 of India’s exports to China. India’s import from China began to take momentum during the last decade (i.e. since 2001), and this is mostly led by technology-intensive sectors. With India conferring MFN status to China, and the Chinese imports enjoying high demand-elasticity in the domestic market, India’s bilateral imports may not be capped in the medium term. The sensitive issue of bilateral trade imbalance can be addressed effectively by making inroads into the Chinese market with India’s technology-intensive exports.
4.3.1 Structure of India’s Import from China
In recent years, India’s imports from China have been diversified, and certain sectors continue to dominate in the bilateral trade. Other imports are spread thinly in almost all the manufacturing sectors as shown in Table 4.3. India’s imports from China comprise both agricultural and manufacturing products. India imports small quantities of agricultural products and they cover, nearly 1 per cent of its total bilateral imports. These products are mainly from the fruits and vegetables category.
Table 4.3: Structure of India’s Bilateral Import from China: 2004-12 |
HS Sec |
Description of HS Sections |
Imports ( Billion US$) |
Share (%) |
CAGR 2004-12 |
2005 |
2007 |
2008 |
2010 |
2012 |
2007 |
2012 |
(%) |
1 |
Live Animals and Animal Products |
7 |
13 |
8 |
11 |
18 |
0.05 |
0.04 |
10.67 |
2 |
Vegetable Products |
42 |
68 |
88 |
181 |
258 |
0.28 |
0.52 |
28.36 |
3 |
Animal or Vegetable Fats & Oils |
1 |
1 |
17 |
5 |
107 |
0.00 |
0.22 |
79.34 |
4 |
Prepared Foodstuff, Beverages, etc. |
17 |
47 |
41 |
62 |
87 |
0.19 |
0.18 |
31.05 |
5 |
Mineral Products |
970 |
1376 |
1711 |
758 |
990 |
5.69 |
1.99 |
2.29 |
6 |
Products of Chemicals |
1657 |
3787 |
5135 |
6618 |
9357 |
15.65 |
18.84 |
31.43 |
7 |
Plastics & Articles thereof |
223 |
749 |
806 |
1131 |
1607 |
3.10 |
3.24 |
39.82 |
8 |
Raw Hides & Skins, Leather, etc. |
29 |
56 |
74 |
110 |
206 |
0.23 |
0.41 |
37.63 |
9 |
Wood & Articles of Wood |
11 |
42 |
39 |
79 |
134 |
0.17 |
0.27 |
47.44 |
10 |
Pulp of wood or of other Fibers |
59 |
240 |
300 |
276 |
366 |
0.99 |
0.74 |
37.29 |
11 |
Textile & Textile Articles |
1065 |
1306 |
1398 |
1725 |
2165 |
5.40 |
4.36 |
16.73 |
12 |
Footwear, Headgear and Umbrella |
42 |
95 |
121 |
171 |
262 |
0.39 |
0.53 |
36.30 |
13 |
Articles of Stone, Plaster, Cement |
220 |
419 |
575 |
685 |
947 |
1.73 |
1.91 |
31.18 |
14 |
Natural or cultured pearls, Jewellery |
181 |
303 |
383 |
524 |
1263 |
1.25 |
2.54 |
37.65 |
15 |
Base Metals & Articles of Base Metal |
699 |
3179 |
3610 |
3979 |
4497 |
13.14 |
9.05 |
38.88 |
16 |
Machinery & Mechanical Appliances |
4313 |
11149 |
12241 |
18488 |
23340 |
46.08 |
46.99 |
32.00 |
17 |
Vehicles, Aircraft and Vessels |
217 |
624 |
785 |
1854 |
1861 |
2.58 |
3.75 |
72.26 |
18 |
Optical, Photograph & Cinematography |
159 |
332 |
367 |
698 |
1175 |
1.37 |
2.37 |
36.41 |
19 |
Arms and Ammunition |
0 |
0 |
0 |
0 |
1 |
0.00 |
0.00 |
− |
20 |
Miscellaneous Manufactured Articles |
184 |
409 |
431 |
707 |
1033 |
1.69 |
2.08 |
33.40 |
21 |
Works of Art Collectors' Pieces |
0 |
2 |
0 |
2 |
1 |
0.01 |
0.00 |
− |
| |
Total Bilateral Import |
10096 |
24197 |
28130 |
38064 |
49675 |
100.00 |
100 |
30.16 |
Source: Comtrade Online Download January 29, 2012, United Nations.
Note: Estimation based on aggregation of products at 6-digit HS. |
India’s bilateral imports are mostly concentrated in the manufacturing sector. Four dominant sectors comprising of chemicals, machinery, base metals, and textile & clothing contributed around 85 per cent to bilateral imports in 2008. Among these sectors, the largest and the most dynamic sector has been that of machinery import. Its share in the total bilateral imports increased marginally from 46.08 per cent in 2007 to 46.99 per cent in 2012, registering a CAGR of 32 per cent per annum between 2004 and 2012. The chemical sector registered a CAGR of 31.4 per cent during 2004-12, but its share did not increase much during this period due to significant growth in overall bilateral imports. Some of the sectors such as minerals, plastic products, automobile sector and cinematography products also witnessed substantial penetration in the domestic market. According to the UN statistics32, India’s bilateral imports were US$ 24.2 billion in 2007 and increased to US$ 28.9 billion in 2009, despite being affected adversely by the global meltdown during that time. Robust growth has been noticed in some of these sectors which are generally technology-intensive in nature, thus enjoying high demand elasticity in the domestic market. Imports are seen as declining in some sectors due to the Chinese policy restriction of exports in order to conserve domestic resources (WTO, 2010). In terms of composition of India’s bilateral imports from China, sectoral shares are declining for minerals, pulp products, textiles & clothing, and base metals. India’s bilateral pattern of imports clearly indicates that demand for technology-intensive products is becoming strong in the domestic market whereas demand for labour intensive and resource-based products is gradually weakening in recent years.
China’s global pattern of export is similar to its bilateral exports to India. Agricultural products constitute a small proportion of China’s total export, but are expanding over the years. Contrary to its earlier practices, mineral exports are declining in the country’s trade basket and form 2 per cent of the total exports in 2008. Manufacturing exports dominate Chinese global export. Some of the major sectoral drivers of exports are textiles and clothing, machinery, auto sector, and chemicals. Other important export sectors are plastics, footwear, cinematography products, etc. and many of these have grown fast in the pre-crisis period.
Constant up-gradation of technology, product development, constant rise in R&D expenditure and indigenisation of foreign technology accompanying FDI, are the important factors for the structural transformation taking place in Chinese export.
4.3.2 Structure of India’s Exports to China
India’s exports to China are highly concentrated where in four sectors take the lion’s share of 79 per cent of the total bilateral exports in 2012 (Table 4.4). These dominant sectors are mostly resource-based and labour intensive in nature, though some of them are partially technology intensive sectors. Agricultural exports constituted 7.3 per cent of the total bilateral exports of India. The shares of sectors like fruits & vegetables as well as fats & Oil are picking up recently.
For the last several years, mineral sector dominated India’s bilateral export basket with China, but its prominence declined significantly in recent years. Especially during the period of recent episode of recession, the share of mineral sector declined noticeably to emerge as the second largest export sector of India to China in 2012. Share of the mining sector declined from 55.4 percent in 2007 to 24.0 percent in 2012. However, both mineral and base metal sectors have complemented each other in focusing exports to the market of China. From the base metal sector, substantial exports are made in the form of iron ores, slag and ashes. In the process, base metal sector became the third largest export sector of India to China in 2012. During recession, textiles & textile products emerged as the largest exporting sector which is expanding at a CAGR of 49.7 per cent during 2004-12 and its share increased significantly from 10.4 per cent to 26.1 per cent between 2007 and 2012 respectively.
Besides textiles, mineral and metal products, India has a major export interest in the chemical sector including pharmaceutical products. Bilateral exports are also significant in certain sectors like animal products, fruits and vegetables, processed food, footwear, cement and machinery & mechanical appliances. Some of these sectors have not only enjoyed a high export share but have also continued to maintain high growth in recent years, which has also been true of some dynamic sectors such as fruits and vegetables, prepared food, minerals, cement, etc. The nature of India’s bilateral export basket indicates that these sectors fall mostly in the categories of resource-based and labour intensive products. India’s attempts to export technology-intensive products have been much below its potential as shown from its current engagement with China. India needs to improve its export efforts to meet the specific import requirements of China if it is to have wider market access without a bilateral FTA.
Table 4.4: Structure of India’s Bilateral Export to China: 2004-12 |
HS Sec |
Description of HS Section |
Exports (Million US$) |
Share (%) |
CAGR 2004-12 |
2005 |
2007 |
2008 |
2010 |
2012 |
2007 |
2012 |
(%) |
1 |
Live Animals and Animal Products |
139 |
157 |
96 |
274 |
240 |
1.7 |
1.6 |
17.3 |
2 |
Fruits &Vegetable Products |
51 |
115 |
87 |
161 |
429 |
1.2 |
2.9 |
40.0 |
3 |
Animal or Vegetable Fats & Oils |
43 |
65 |
70 |
223 |
380 |
0.7 |
2.6 |
36.8 |
4 |
Prepared Foodstuff, Beverages, etc. |
74 |
162 |
241 |
200 |
27 |
1.7 |
0.2 |
-5.4 |
5 |
Mineral Products |
4130 |
5248 |
6277 |
7032 |
3531 |
55.4 |
24.0 |
7.7 |
6 |
Products of Chemicals |
857 |
973 |
872 |
1210 |
1517 |
10.3 |
10.3 |
12.7 |
7 |
Plastics & Articles thereof |
382 |
292 |
229 |
392 |
637 |
3.1 |
4.3 |
5.6 |
8 |
Raw Hides & Skins, Leather, etc. |
40 |
53 |
56 |
67 |
130 |
0.6 |
0.9 |
19.2 |
9 |
Wood & Articles of Wood |
1 |
1 |
1 |
2 |
3 |
0.0 |
0.0 |
− |
10 |
Pulp of wood or of other Fibers |
1 |
1 |
2 |
3 |
4 |
0.0 |
0.0 |
18.9 |
11 |
Textile & Textile Articles |
286 |
988 |
836 |
2307 |
3834 |
10.4 |
26.1 |
49.7 |
12 |
Footwear, Headgear and Umbrella |
54 |
110 |
99 |
95 |
169 |
1.2 |
1.2 |
20.1 |
13 |
Articles of Stone, Plaster, Cement |
25 |
52 |
91 |
206 |
91 |
0.6 |
0.6 |
26.4 |
14 |
Natural or cultured pearls, Jewelry |
11 |
30 |
25 |
86 |
94 |
0.3 |
0.6 |
23.0 |
15 |
Base Metals & Articles of Base Metal |
873 |
851 |
423 |
4523 |
2698 |
9.0 |
18.4 |
22.2 |
16 |
Machinery & Mechanical Appliances |
151 |
288 |
294 |
487 |
654 |
3.0 |
4.5 |
21.9 |
17 |
Vehicles, Aircraft and Vessels |
15 |
43 |
27 |
53 |
111 |
0.5 |
0.8 |
28.4 |
18 |
Optical, Photograph & Cinematography |
30 |
41 |
50 |
81 |
137 |
0.4 |
0.9 |
25.0 |
19 |
Arms and Ammunition |
0 |
|
0 |
0 |
0 |
0.0 |
0.0 |
− |
20 |
Miscellaneous Manufactured Articles |
3 |
2 |
3 |
7 |
18 |
0.0 |
0.1 |
31.6 |
21 |
Works of Art Collectors' Pieces |
1 |
4 |
5 |
12 |
3 |
0.0 |
0.0 |
5.2 |
| |
Total Bilateral Exports |
7167 |
9476 |
9784 |
17421 |
14707 |
100.0 |
100.0 |
17.4 |
Source: Comtrade Online accessed on October 25, 2013, United Nations.
Note: Estimation based on aggregation of products at 6-digit HS. |
In this context, it is important to examine the import structure of China from the rest of the world. China mostly imports minerals and manufacturing products from the rest of the world, and agricultural import forms a small proportion of its total imports. Agricultural33 imports were 5.2 per cent of its total imports in 2012, and more than half of such import was concentrated in fruits and vegetables (Table 4.5).
In the non-agricultural segment of imports, mineral is an important sector for China, but its imports of machinery products from the rest of the world was more than double the size of its mineral imports in 2007. During the recessionary period, the importance of the machinery sector imports continued and the share of the mineral sector consolidated further. The combined import share of minerals and machinery in total imports was reported to be 58.0 per cent in 2012. China follows a clear policy on imports, where the current import practice is to make either significant import or no import. This signifies that China continues to import those products that are critically required by the domestic economy. In case of ten out of twenty one HS sections, the share of each of these sectors is turning out to be less than 1 per cent of the total import in 2012. The structure of the import basket shows a definite trend, where it is focused on natural resource-based products and technology-intensive products. Technology intensive34 imports constitute nearly two-thirds of its total imports where the shares of primary as well as labour-intensive imports in the total are relatively smaller than that of knowledge-intensive sectors.
Table 4.5: China's Imports from World in 2004-12 |
HS Sec |
Descriptions of HS Sections |
Imports (Billion US$) |
Share (%) |
CAGR 2004-12 |
2005 |
2007 |
2008 |
2010 |
2012 |
2007 |
2012 |
(%) |
1 |
Live Animals and Animal Products |
4.3 |
6 |
7.2 |
9.3 |
13.8 |
0.6 |
0.8 |
17.9 |
2 |
Vegetable Products |
11.2 |
15.1 |
26.3 |
33.2 |
51 |
1.6 |
2.9 |
21.1 |
3 |
Animal or Vegetable Fats & Oils |
3.3 |
7.6 |
10.8 |
8.9 |
13 |
0.8 |
0.7 |
15.2 |
4 |
Prepared Foodstuff, Beverages, etc. |
3.5 |
4.5 |
6.1 |
9.6 |
14.4 |
0.5 |
0.8 |
22.7 |
5 |
Mineral Products |
92.3 |
162.3 |
261.3 |
302.9 |
453.1 |
17.0 |
25.9 |
27.0 |
6 |
Products of Chemicals |
50.6 |
68.6 |
76.9 |
93.2 |
118.1 |
7.2 |
6.8 |
13.6 |
7 |
Plastics & Articles thereof |
38.9 |
55 |
60.8 |
80.7 |
90.2 |
5.8 |
5.2 |
13.5 |
8 |
Raw Hides & Skins, Leather, etc. |
5.4 |
6.9 |
6.8 |
7.7 |
9.9 |
0.7 |
0.6 |
8.6 |
9 |
Wood & Articles of Wood |
5.7 |
8 |
8.1 |
11.3 |
15 |
0.8 |
0.9 |
14.2 |
10 |
Pulp of wood or of other Fibers |
11 |
14.5 |
17.4 |
20.1 |
23.7 |
1.5 |
1.4 |
11.0 |
11 |
Textile & Textile Articles |
23.4 |
25.4 |
25 |
29.6 |
40.9 |
2.7 |
2.3 |
7.5 |
12 |
Footwear, Headgear and Umbrella |
0.7 |
0.9 |
1.2 |
1.4 |
2.2 |
0.1 |
0.1 |
17.6 |
13 |
Articles of Stone, Plaster, Cement |
3.4 |
4.5 |
4.7 |
6.5 |
9.3 |
0.5 |
0.5 |
14.3 |
14 |
Natural or cultured pearls, jewelry |
3.5 |
6.3 |
7.5 |
10.8 |
13.2 |
0.7 |
0.8 |
21.9 |
15 |
Base Metals & Articles of Base Metal |
56.6 |
77.7 |
79.5 |
103.1 |
111.2 |
8.2 |
6.4 |
10.9 |
16 |
Machinery & Mechanical Appliances |
271.1 |
381 |
405.3 |
486.4 |
561.9 |
40.0 |
32.1 |
11.6 |
17 |
Vehicles, Aircraft and Vessels |
19.8 |
35 |
39.8 |
65.6 |
91.2 |
3.7 |
5.2 |
21.3 |
18 |
Optical, Photograph & Cinematography |
51.2 |
71.1 |
79.8 |
92.3 |
112 |
7.5 |
6.4 |
13.3 |
19 |
Arms and Ammunition |
0 |
0 |
0 |
0 |
0 |
0.0 |
0.0 |
− |
20 |
Miscellaneous Manufactured Articles |
2.1 |
3.4 |
3.6 |
5 |
5.3 |
0.4 |
0.3 |
13.0 |
21 |
Works of Art Collectors' Pieces |
0 |
0 |
0 |
0 |
0.1 |
0.0 |
0.0 |
− |
| |
Total Bilateral Exports |
658 |
953.8 |
1128.1 |
1377.6 |
1749.5 |
100.0 |
100.0 |
15.3 |
Source: Comtrade Online accessed on October 25, 2013,, United Nations.
Note: Estimation based on aggregation of products at 6-digit HS. |
As China’s import focus is shifting towards knowledge-intensive products, India has to change its bilateral export basket to accommodate more technology-intensive35 products for wider market access in China. India’s closer engagement with China in the global production network could be a possible way to improve its technology-intensive exports. India has to evolve a strategic approach to deal with the frequent use of NTBs by the Chinese authorities and to address product standard issues for achieving uninterrupted access to the Chinese market, which is expanding fast as seen by trends in the last decade.
4.4. India’s Bilateral Trade Imbalance with China: Sustainability Issue
There is a growing concern in India relating to sustainability of mounting bilateral trade along with surging trade imbalance between them in the medium term. Some argue that India is an emerging country with a large demand for imports to enhance its exports and also to meet growing domestic demand for consumption including modernisation of its industrial sector. While others argue that excess of consumption over production may lead to an unsustainable current account deficit. Both arguments assume that import from China is competitive compared to many other suppliers in the domestic market. However, cost efficiency of Indian imports from China is an empirical question that needs to be examined.
In the trade literature, laissez-faire is preferred because it is welfare enhancing in nature. Cost efficiency principle has been the driving force behind laissez-faire and this has been argued in several trade theories36. In the 1950s, several studies took this argument further to emphasise that trade based on least cost principle became the basis for formation of Regional Trading Agreements (RTAs). Viner (1950) argued that the basis of an RTA could be ‘trade creation’ and ‘trade diversion’, but domestic welfare could be maximised for the importers and also the world welfare, when trade augmentation is driven by ‘trade creation’. According to Viner, ‘trade creation’ takes place when purchases happen on a low cost basis among available suppliers in the importing market. Johnson (1960), Greenway et al. (1989), and Low (2003) have made extensive literature survey to highlight the relevance of trade creation in fostering trade among member countries. The broad conclusions indicate that trade creation based on the most competitive cost structure of imports would enhance the welfare of an importing country and contributes to deep rather than shallow integration (Viner, 1950 and Meade, 1955). Several studies have examined the empirical relevance of such an assertion in a number of RTAs across the world (see for example, Greenaway, Mahabir and Milner, 2008; Bohara, Gawande and Sanguinetti, 2004; and Magee, 2008).
There are reasons to believe that China could be a cheap source of bilateral imports. In recent years, world trade is dominated by ‘global products’ which are produced in several countries at different stages of production, based on an international division of labour. Regional trade is growing fast because of rise in activities relating to ‘production fragmentation’. The basis of production fragmentation has been to bring down the cost of production to maintain global competitiveness. Present global trade flows indicate that China is a major global player in global value chain (GVC) in diversified sectors through production fragmentation, and several such products are found to be competitive in the global market. This phenomenon of Chinese competitiveness could explain India’s bilateral surge of imports in these product segments. Continuation of trade in this sector could promote trade in intermediate products at the bilateral level.
________________________________________________________________________________________________________________________________________________________________
Box 4.1: Classification of technology intensity of tradable products
Primary Products have very little technology basis for retaining comparative advantage.
Resource Based Products, having competitive advantages, arise generally from local availability of natural resources, using simple and labour intensive technology.
Low Technology Products are having well diffused technologies, based on simple technologies. Technologies are mainly embodied in capital equipment and labour constitutes major element of cost in order to make the product competitive. Such products operate under low scale economies with low entry barriers.
Medium Technology products comprise of skill and scale intensive technologies in capital goods and intermediate products. Product development takes place with complex technologies, involving high level of R&D expenditure. It requires lengthy learning periods and subject to high entry barriers.
High Technology products are subject to advanced and fast changing technologies where emphasis is on product design. As product development requires high R&D investments, production of such products involve sophisticated infrastructures, high levels of specialized technical skills and close interactions between firms and universities/research institutions.
________________________________________________________________________________________________________________________________________________________________
India is a major importer of primary and technology intensive products for sustaining its ambitious programme of industrialisation and the country’s growing needs for energy consumption (see box 4.1). As India is gearing up with its new ‘manufacturing policy’37 to intensify its domestic industrialisation in the medium term, its dependence on imports for competitive technology-intensive machineries is becoming important. Since machineries in technology-intensive product segments are expensive in industrialised countries, China could be an alternative source because it is gaining global reputation as a competitive supplier of machineries. However, the competitiveness of Chinese products in the Indian market is an empirical question that needs empirical examination.
Chinese Labour Reforms and Export Competitiveness
Labour cost is an important element of the overall production cost, which can offset the adverse effect of any other macroeconomic misalignments including foreign exchange rate, corruption, other trade policies, etc. Several studies indicate that Indian labour laws are stringent enough to increase the cost of labour dispute ad such problems are more intense in capital-intensive manufacturing industries (Ahsan and Page, 2009). Flexible labour regulation in the country can generate more employment opportunities in the manufacturing sector. Empirical analysis of Amin (2009) indicates that flexibility in labour laws in retail stores can generate additional employment of one fifth of the current level of employment in the sector.
In 2011, the Suzuki Company faced labour problems in Gurgaon and this created uncertainties such as availability of labour and high wage rate in the market. Despite a stable exchange rate in India, the manufacturing cost is high due to lack of labour reforms in the country. In China, several orderly policy reforms took place over a period, leading to a reduction of cost in manufacturing (Meng, 2012). Yuan undervaluation may be there, but it may be over compensated by advantages derived from labour sector advantages. This may enable foreign companies to gain competitiveness in the production sector.
Trends in Uncompetitive Imports from China
It is commonly believed that Chinese products are more competitive than other suppliers in India; and therefore Chinese presence has been strong in the Indian market. However, empirical findings suggest that India’s imports from China have been uncompetitive38 in large number of products, which are spreading into several sectors. In certain critical sectors, the proportion of uncompetitive imports in the total has been significant. It is a matter of concern as the share of uncompetitive products in total imports is increasing over a period of time, which includes trade in normal years. They are both in terms of number of products imported and also in value terms. The magnitude of uncompetitive bilateral imports from China increased from US$ 6.3 billion in 2007 to US$ 8.4 billion in 2008, and further to US$ 9.7 billion in 2012. Despite global recession, such imports grew moderately during the period 2007-12. The relative size of uncompetitive imports to total imports was very high, ranging from 26.0 per cent in 2007 to 29.7 per cent in 2008 but declined to 19.5 per cent in 2012. In terms of number of products imported, India imported 3875 items in 2007; this number increased to 3915 items in 2010 and further to 4060 items in 2012. These products from China are disaggregated at 6-digit HS; nearly one-third of these turned out to be uncompetitive39 in 2007, and the figure declined marginally to 32.6 per cent in 2012.
Import of uncompetitive products from China varies significantly in its structure across sectors and over time. The composition of India’s bilateral uncompetitive imports in broad HS sectors is presented in Table 4.6. The distribution of such imports is disproportionately spread across sectors, and uncompetitive imports are concentrated in certain sectors. It is heavily concentrated in five sectors such as chemicals, textiles, minerals, base metals and machinery where these sectors share around 76.1 per cent to more than 85 per cent of the total uncompetitive bilateral imports during 2007-12. Interestingly, these are the sectors where maximum number of uncompetitive products are imported. There are another three sectors such as plastics, gems & jewelleries, and automotive sectors, where importation of uncompetitive products is important. The combined share of these eight sectors exceeded 87 per cent of total uncompetitive imports in 2012. In the machinery sector, uncompetitive exports increased from US$ 1.4 billion in 2008 to US$ 1.6 billion in 2012. Moreover, instability in the sectoral share of uncompetitive exports has been significant during the period of recession. While such imports increased in chemical sector, relative shares of machinery and base metals declined significantly between 2008 and 2012. Among the lead sectors, import growth of uncompetitive products remained negative in gems & jewelleries and mineral sectors.
Table 4.6: India’s Uncompetitive Import from China: 2007-12 |
HS SEC |
Description |
Uncompetitive Imports (000 $) |
Share (%) |
Growth |
2007 |
2008 |
2012 |
2007 |
2008 |
2012 |
2007-12 |
1 |
Live Animals and Animal Products |
3624 |
5524 |
11219 |
0.1 |
0.1 |
0.1 |
25.4 |
2 |
Vegetable Products |
42326 |
47248 |
130253 |
0.7 |
0.6 |
1.3 |
25.2 |
3 |
Animal or Vegetable Fats & Oils |
117 |
238 |
3239 |
0.0 |
0.0 |
0.0 |
94.4 |
4 |
Prepared Foodstuff, Beverages, etc. |
13582 |
22369 |
20727 |
0.2 |
0.3 |
0.2 |
8.8 |
5 |
Mineral Products |
1179991 |
1514667 |
818890 |
18.7 |
18.1 |
8.5 |
-7.0 |
6 |
Products of Chemicals |
1649952 |
2123811 |
3215123 |
26.1 |
25.4 |
33.3 |
14.3 |
7 |
Plastics & Articles thereof |
81397 |
114075 |
314431 |
1.3 |
1.4 |
3.3 |
31.0 |
8 |
Raw Hides & Skins, Leather, etc. |
21293 |
21906 |
14927 |
0.3 |
0.3 |
0.2 |
-6.9 |
9 |
Wood & Articles of Wood |
17821 |
6607 |
66387 |
0.3 |
0.1 |
0.7 |
30.1 |
10 |
Pulp of wood or of other Fibers |
104720 |
200582 |
170612 |
1.7 |
2.4 |
1.8 |
10.3 |
11 |
Textile & Textile Articles |
639220 |
691098 |
898028 |
10.1 |
8.3 |
9.3 |
7.0 |
12 |
Footwear, Headgear and Umbrella |
3351 |
3406 |
18283 |
0.1 |
0.0 |
0.2 |
40.4 |
13 |
Articles of Stone, Plaster, Cement |
29462 |
111056 |
89824 |
0.5 |
1.3 |
0.9 |
25.0 |
14 |
Natural or cultured pearls, Jewellery |
291244 |
370719 |
164233 |
4.6 |
4.4 |
1.7 |
-10.8 |
15 |
Base Metals & Articles of Base Metal |
845540 |
1403044 |
912689 |
13.4 |
16.8 |
9.4 |
1.5 |
16 |
Machinery & Mechanical Appliances |
985270 |
1425873 |
1566049 |
15.6 |
17.1 |
16.2 |
9.7 |
17 |
Vehicles, Aircraft and Vessels |
329246 |
209990 |
585596 |
5.2 |
2.5 |
6.1 |
12.2 |
18 |
Optical, Photograph & Cinematography |
49230 |
37983 |
334376 |
0.8 |
0.5 |
3.5 |
46.7 |
| |
Total |
6312549 |
8356656 |
9663254 |
100 |
100 |
100 |
8.9 |
Source: RIS estimation based on Comtrade online accessed on October 25, 2013, United Nations. |
Empirical evidences indicate that bilateral imports from China have been uncompetitive in several sectors including textiles and clothing, automotive, chemicals, etc. The textiles and clothing sector is very large in India, and China is gradually withdrawing from the lower end of the sector because of rising wages touching double digit rates in both coastal and inland provinces. This is expected looking at the current trends in China where outsourcing of some products in the production chain of textiles is taking place. In case, the present trend of rising wage rate continues in China, the production base of textiles and clothing will slowly shift to other countries, as has been the case with the textile industries of a number of East Asian countries in the past. India should start preparing itself for such a restructuring in China by getting in to partnership with foreign firms to establish production centres in India for mass production of garments. The Chinese phase out from the garment industry may be an opportunity for India to replace it in the global market in a phased manner.
The automobile industry in India has expanded rapidly during the last two decades and so also is the case in China. In certain product segments, like auto components, small-cars and two-wheelers, India continues to be competitive in the global market. India’s imports from China in many product segments are turning out to be uncompetitive, and imports of these products can be managed efficiently from other competitive suppliers. India is also emerging as competitive player in the niche area of auto designing which is related to the IT sector. These trends indicate that Indian firms can venture into the Chinese market in certain segments though they are likely to face strong competition from various domestic firms and also from other foreign competitors.
Uncompetitive Imports in Technology-Intensity sectors
Medium- and high-technology products dominated India’s bilateral import from China during 2007-12. The share of these two segments decreased from more than 61 per cent in 2009 to over 52 per cent in 2012. On the other hand, the combined share of primary, resource-intensive and low-tech imports constituted around one-third of total bilateral imports during the first phase of global recession but the share increased during the second phase. In the five broad product segments, based on technology intensity, the size of import was diverse in different phase of global business cycle during the last decade. Import in the medium and high technology segment dominated among others in 2009 but combined importance of the sectors declined after 2010. Bilateral import growth was most impressive in the medium-technology intensive sector during the period 2008-12. Global recession had adverse impact on the import profile of India in the resource intensive and high-tech product categories.
While the bilateral imports of uncompetitive products from China is large, the distribution of such imports was skewed across various technology intensive sectors, (Figure 4.1). More than one-third of the uncompetitive imports were registered in 2007, and the proportion declined to 32.6 per cent level in 2012. The largest concentration of such imports was noticed in the segment of medium-technology products. The share of uncompetitive imports in the medium and high technology segments increased during 2009-10 but declined in 2011 and 2012. While uncompetitive import growth was 17.0 per cent per annum for medium-tech sector, similar estimates for the high-tech sector was 3.7 per cent during 2008-12. India’s imports in these two sectors are likely to grow in future in view of present emphasis on industrialisation as discussed in the New Manufacturing Policy of India.
Figure 4.1: India's Uncompetitive Imports from China in 2012
Uncompetitive Imports in Intermediate sectors
In a globally dependent economy, intermediate products are very important for meeting critical export obligations of an emerging country like India and also in supporting domestic production to meet a growing demand in the economy. Imports of intermediate products are likely to increase because of an increased emphasis on exports of manufactures and the growing demand for ‘global products’ in the domestic and external markets. The issue has been to identify these products, and also to locate these products at the most disaggregated level.
The UN Broad Economic Category (BEC) product classification provides a framework to identify the intermediate products at a disaggregated level. These products are again concorded with the Harmonised System (HS) of trade classification in order to identify the intermediate products used in the trade sector. These intermediate products comprise of two sets of products such as semi-finished goods and parts & components. Import of these products is expected to be competitive in order to make the domestic production competitive for meeting its export obligation as well as dealing with foreign competition in the domestic market. Although Chinese intermediate products have considered competitive, the extent to which import of Chinese intermediate products have competitiveness in the Indian market is examined vis-à-vis other competitors in the domestic market, taking India’s bilateral import data at a disaggregated level.
East Asia’s intra-regional trade miracle has been propelled mostly by production fragmentation, based on regional division of labour. To some extent, India’s success on the export front has been partially the outcome of its linkages with the global value chain. China being the hub of the regional value chain40 in East Asia, India’s bilateral import from China is important for its bilateral export to the country and to other markets. In this context, low-cost intermediate imports from China is important for improving India’s overall competitiveness in the exports of final products.
The competitiveness of India’s imports in the intermediate product sector is examined, taking disaggregated products at 6-digit HS from the UN Comtrade database. As an emerging country, India’s import of intermediate products has been important for fostering industrialisation, meeting domestic demand and addressing its export needs. In the total bilateral imports from China, intermediate products constitute nearly two-third of the total. The share of such products was 59.8 per cent in 2007, which increased to 63 per cent in 2008 and declined to 60.9 per cent in 2012 - owing to global recession. Bilateral import in this sector is mostly in the industrial sector though some imports are taking place in agricultural and mineral sectors. Though imports of industrial intermediates spread over several sectors, a high concentration of imports is observed in sectors like chemicals, base metals, automotive and machinery & mechanical appliances. Other important sectors engaged in imports of intermediate products include plastics and textiles & clothing. Some of the dominant sectors clocking a sharp rise in imports, are gems & jewellery, automotive sector and machine & mechanical appliances.
In the intermediates product segment import of uncompetitive products is largely felt in several sectors. The proportion of imports, turning out to be uncompetitive in different sectors, are presented in Table 4.7. It ranges from one-fifth to more than one-third of total sectoral bilateral imports from China depending upon the global situation. Nearly 36.0 per cent of bilateral imports of intermediate products from China happened to be uncompetitive in 2007, which increased to 38.4 per cent in 2008 and declined to 21.5 per cent in 2012. The proportion of uncompetitive imports in some of the important sectoral intermediate imports from China increased during 2007-08. A growing share of uncompetitive intermediate imports is observed in important sectors like textile & clothing and base metal sectors. Some of the other important sectors, experiencing a similar trend of rising share of uncompetitive imports, are cement & plaster and automotive sectors. There is no stylised trend observed in the import of uncompetitive industrial intermediates. While the growth rate of such imports increased rapidly in automobiles and base metal, it became negative in a few other sectors during 2007-09. In 2012, improved sectoral share of uncompetitive imports of intermediate products was noticed in sectors like fats and oils and optical &cinematography products. This is an alarming trend for India’s external sector performance. Rising import costs would not only hamper India’s export performances and maintenance of domestic price stability but would also affect the current account balance and other macro-economic parameters.
Table 4.7: Share of Uncompetitive intermediate imports in total intermediate imports from China |
(in per cent) |
HS SEC |
Desecration |
2007 |
2008 |
2012 |
1 |
Live Animals and Animal Products |
|
|
|
2 |
Vegetable Products |
0.3 |
2.1 |
24.8 |
3 |
Animal or Vegetable Fats & Oils |
17.2 |
1.4 |
3.0 |
4 |
Prepared Foodstuff, Beverages, etc. |
53.8 |
79.6 |
7.8 |
5 |
Mineral Products |
97.3 |
96.8 |
81.4 |
6 |
Products of Chemicals |
43.6 |
41.4 |
34.5 |
7 |
Plastics & Articles thereof |
9.1 |
7.0 |
23.7 |
8 |
Raw Hides & Skins, Leather, etc. |
50.7 |
48.9 |
39.1 |
9 |
Wood & Articles of Wood |
48.9 |
15.8 |
39.7 |
10 |
Pulp of wood or of other Fibers |
45.3 |
69.2 |
52.3 |
11 |
Textile & Textile Articles |
49.8 |
50.5 |
41.7 |
12 |
Footwear, Headgear and Umbrella |
21.9 |
20.8 |
11.0 |
13 |
Articles of Stone, Plaster, Cement |
6.7 |
19.9 |
9.9 |
14 |
Natural or cultured pearls, Jewellery |
99.4 |
99.6 |
12.4 |
15 |
Base Metals & Articles of Base Metal |
26.3 |
39.3 |
20.6 |
16 |
Machinery & Mechanical Appliances |
15.0 |
13.7 |
3.7 |
17 |
Vehicles, Aircraft and Vessels |
17.3 |
22.4 |
19.8 |
18 |
Optical, Photograph & Cinematography products |
1.7 |
1.7 |
9.9 |
20 |
Miscellaneous Manufactured Articles |
1.3 |
1.1 |
24.9 |
| |
Overall |
36.0 |
38.4 |
21.5 |
Source: RIS estimation based on Comtrade, online [Accessed on October 25, 2013, United Nations] |
These empirical evidences suggest that India has been importing a large amount of uncompetitive products that can be easily be supplied by other competitors of China at a competitive cheaper price in India. It may be premature to resolve the problem by general observation of the current trend of bilateral imports unless these issues are considered at the product level. In this analysis, each product at the 6-digit HS is examined separately, and therefore anomalies in imports at the product/suppler level have to be examined carefully. As determination of tariff at a product level is considered by looking at the sensitivity of a product, a similar approach may be considered to understand why an uncompetitive product is being imported from China in the presence of several competitive suppliers available in the domestic economy. In this empirical study, the competitiveness of products is examined at a disaggregated level (i.e., 6-digit HS), and therefore reasons should be explored at the product level which is beyond the scope of this study.
Even though, the figures reported in the study are just indicative estimates, they emphasise the issue of import dependence on a costlier source of imports. This has been contributing to India’s mounting bilateral trade deficit with China, and is also responsible for the country’s overall trade deficit. It is important to note that uncompetitive bilateral import from China is not limited to a few products/sectors, but spreads across most of the trade sectors. In certain cases, levels of uncompetitive imports in different sectors are significant. In terms of volume of uncompetitive imports, certain sectors such as chemicals, textiles, base metals, machinery & mechanical appliances, automotive sector, gems & jewellery, etc, are more adversely affected than others. It is important to know the reasons for such trade distortions.
This brings in the issue of sustainability of India’s bilateral trade deficit with China. It is widely discussed in the literature that China has been using different modes of hidden subsidy to aggressively market its products in various countries including India. In response, India has invoked a large number of anti-dumping cases against China during the last few years. Besides aggressive marketing, China has been using several other instruments such as cheap interest policy, concessional credit facilities, technical collaboration arrangements, etc. for accessing global market for its exports. The implication of these policies on exports of products to other countries, including India, requires further exploration at the product level. However, India’s bilateral trade balance can improve considerably if India could restrict importation of uncompetitive products from China and switch over to more competitive suppliers for its imports.
4.5 Regional Disparity in Trade in China
Although China’s external sector has been expanding rapidly after its accession to the WTO in 2001, the contribution of various regions of the country to the trade sector has been highly skewed. Several parts of the country have not closely integrated with the global economy, particularly the hinterlands. The trade-affluent regions in China are located in a ‘D’ shaped formation, covering the North, East and the Southern regions of the country. This part of the country has been the hub of all trade-related activities since the beginning of its reforms. This part of the region shared nearly 83-91 per cent of the country’s total trade activities and there was no change in the structure of trade activates within the provinces during the period 2003-12 (see Table 4.8).
Table 4.8 Regional Distribution of Trade in China 2003-2012 |
(Billion US$) |
SI No |
Regions |
Trade |
2003 |
2012 |
Share (%) |
2003 |
2012 |
1 |
Central |
Export |
7.8 |
61.7 |
1.8 |
3.0 |
2 |
Central |
Import |
5.8 |
44.0 |
1.4 |
2.1 |
3 |
East |
Export |
153.4 |
1038.3 |
35 |
50.7 |
4 |
East |
Import |
174.4 |
732.8 |
42.2 |
35.8 |
5 |
North |
Export |
40.6 |
148.6 |
9.3 |
7.3 |
6 |
North |
Import |
72.1 |
451.8 |
17.5 |
22.1 |
7 |
North East |
Export |
19.7 |
78.4 |
4.5 |
3.8 |
8 |
North East |
Import |
18.4 |
88.0 |
4.5 |
4.3 |
9 |
North-West |
Export |
5.9 |
33.9 |
1.4 |
1.7 |
10 |
North-West |
Import |
3.9 |
18.3 |
1 |
0.9 |
11 |
South |
Export |
155.8 |
592.7 |
35.5 |
28.9 |
12 |
South |
Import |
133.3 |
434.9 |
32.3 |
21.2 |
13 |
South-West |
Export |
7.2 |
95.4 |
1.6 |
4.7 |
14 |
South-West |
Import |
4.9 |
48.0 |
1.2 |
2.3 |
15 |
Total Exports |
Exports |
438.4 |
2048.9 |
100 |
100 |
16 |
Total Imports |
Imports |
412.8 |
1817.8 |
100 |
100 |
Source: Report on the Foreign Trade Situation of China, various issues, Ministry of Commerce, China.
Note: Share refers to proportion of exports/imports of the region in the total exports/imports of China. |
On the other hand, a large area of China has very little exposure to foreign trade. The coverage of the ‘trade poor’ regions has been Central, North-eastern, North-western, and South-western regions of the country. These regions constitute around 7-10 per cent of country’s overall trade activities during the period 2003-12. The disparity among regions is such that trade activities in some provinces of trade affluent-regions are better than the entire ‘trade poor’ region of the country. Some of these provinces which are performing well over a couple of decades are Jiangsu, Shanghai, Beijing and Guangdong among others.
Most of the trade affluent-regions are not in the close vicinity of India. The regions that are close to India are North Western and South-Western which fall under the ‘trade poor’ region of China. In these regions, the trade activities are also skewed (Table 4.9).
Table 4.9: Distribution of Trade Activities in China Regions Close to India: 2003-2012 |
(US$ Billion) |
Region |
Exports (2012) |
Share |
Growth |
Imports
(2012) |
Share |
Growth |
1995 |
1995-2003 |
2003-2007 |
2007-2012 |
1995 |
2012 |
1995-2003 |
2003-2007 |
2007-2012 |
North |
148.6 |
12.65 |
7.25 |
10.1 |
29.3 |
5.5 |
451.8 |
24.66 |
24.86 |
10.5 |
28.3 |
1.2 |
Beijing |
59.7 |
6.89 |
2.91 |
6.4 |
30.5 |
4.0 |
348.3 |
20.28 |
19.16 |
8.5 |
29.2 |
1.3 |
Tianjin |
48.3 |
2.73 |
2.36 |
17.1 |
27.7 |
4.8 |
67.3 |
3.01 |
3.70 |
18 |
22.1 |
0.7 |
Hebei |
29.6 |
1.93 |
1.44 |
9.5 |
30.2 |
11.7 |
20.9 |
0.80 |
1.15 |
14.2 |
29.3 |
1.9 |
Shanxi |
7.0 |
0.77 |
0.34 |
8.9 |
30.3 |
1.4 |
8.0 |
0.20 |
0.44 |
15.4 |
57.5 |
1 |
Inner Mongolia |
4.0 |
0.34 |
0.19 |
11.1 |
26.4 |
6.1 |
7.3 |
0.38 |
0.40 |
16.4 |
30.1 |
0.3 |
North East |
78.4 |
7.06 |
3.82 |
8.2 |
27.2 |
8.8 |
88.0 |
5.82 |
4.84 |
11.5 |
18 |
1.2 |
Liaoning |
58.0 |
5.54 |
2.83 |
7.4 |
24.7 |
10.4 |
46.0 |
3.75 |
2.53 |
11.6 |
19.3 |
1 |
Jilin |
6.0 |
0.74 |
0.29 |
8.9 |
15.6 |
9.2 |
18.6 |
1.14 |
1.02 |
13 |
12.6 |
1.5 |
Heilongjiang |
14.4 |
0.78 |
0.70 |
11.9 |
43.8 |
3.3 |
23.4 |
0.92 |
1.29 |
9.1 |
19.7 |
1.4 |
East |
1038.3 |
32.90 |
50.67 |
19.3 |
32.2 |
11.0 |
732.8 |
26.46 |
40.31 |
22.3 |
38.2 |
-0.1 |
Shanghai |
206.7 |
8.71 |
10.09 |
17.9 |
31.3 |
7.5 |
229.8 |
8.63 |
12.64 |
24.1 |
21.5 |
0.7 |
Jiangsu |
328.5 |
6.58 |
16.03 |
25.2 |
36.2 |
10.0 |
219.6 |
4.94 |
12.08 |
30.4 |
27.9 |
0.7 |
Zhejiang |
224.6 |
5.17 |
10.96 |
23.5 |
32.5 |
11.8 |
87.7 |
2.89 |
4.82 |
22.9 |
25.1 |
1 |
Anhui |
26.8 |
0.94 |
1.31 |
10.4 |
30.3 |
24.9 |
12.6 |
0.47 |
0.69 |
21.3 |
25.4 |
1.2 |
Fujian |
97.8 |
5.32 |
4.77 |
13.1 |
24 |
14.4 |
58.1 |
4.95 |
3.20 |
10.2 |
103.9 |
-4.3 |
Jiangxi |
25.1 |
0.70 |
1.23 |
4.7 |
38 |
35.7 |
8.3 |
0.21 |
0.46 |
17.5 |
40.8 |
1.6 |
Shandong |
128.7 |
5.48 |
6.28 |
15.9 |
29.7 |
11.4 |
116.8 |
4.38 |
6.43 |
15.3 |
27.2 |
1.4 |
Central |
61.7 |
2.84 |
3.01 |
7.9 |
31.2 |
21.7 |
44.0 |
2.17 |
2.42 |
9.2 |
25.4 |
1.4 |
Henan |
29.7 |
0.91 |
1.45 |
10.3 |
29.5 |
28.7 |
22.1 |
0.66 |
1.21 |
9 |
26.3 |
1.2 |
Hubei |
19.4 |
0.94 |
0.95 |
8.3 |
32.5 |
18.9 |
12.6 |
1.08 |
0.69 |
7 |
28.5 |
1.3 |
Hunan |
12.6 |
0.99 |
0.61 |
4.8 |
32 |
14.1 |
9.3 |
0.43 |
0.51 |
13.7 |
18.9 |
1.8 |
South |
592.7 |
39.79 |
28.93 |
12.9 |
24.6 |
9.5 |
434.9 |
37.98 |
23.92 |
13 |
19.4 |
0.6 |
Guangdong |
574.1 |
38.02 |
28.02 |
13.2 |
24.7 |
9.2 |
409.7 |
35.85 |
22.54 |
13.5 |
19.3 |
0.5 |
Guangxi |
15.5 |
1.14 |
0.75 |
1.8 |
26.9 |
24.8 |
14.0 |
1.05 |
0.77 |
-1.6 |
36 |
1.6 |
Hainan |
3.1 |
0.62 |
0.15 |
-0.8 |
11.9 |
18.2 |
11.2 |
1.08 |
0.62 |
-0.2 |
11.1 |
2.5 |
South-West |
95.4 |
2.67 |
4.65 |
5.4 |
28.6 |
37.2 |
48.0 |
1.92 |
2.64 |
6 |
29.4 |
1.5 |
Chongqing |
38.5 |
0.00 |
1.88 |
19.8 |
27.9 |
34.9 |
20.7 |
0.00 |
1.14 |
21.2 |
24.2 |
2.1 |
Sichuan |
38.6 |
1.53 |
1.88 |
-4.4 |
29.9 |
53.6 |
14.6 |
0.92 |
0.80 |
-2.2 |
30.5 |
1.2 |
Guizhou |
5.0 |
0.30 |
0.24 |
3.6 |
25.6 |
27.6 |
1.7 |
0.17 |
0.09 |
7.5 |
19.5 |
1 |
Yunnan |
10.0 |
0.85 |
0.49 |
3.7 |
29.6 |
16.2 |
11.0 |
0.67 |
0.60 |
1.3 |
42.1 |
0.8 |
Tibet |
3.4 |
0.01 |
0.16 |
39.1 |
28 |
59.4 |
0.1 |
0.16 |
0.00 |
-19 |
14.8 |
-0.1 |
North-West |
33.9 |
1.69 |
1.66 |
11.3 |
34.3 |
11.9 |
18.3 |
0.99 |
1.01 |
14.8 |
22.9 |
1.5 |
Shannxi |
8.7 |
0.85 |
0.42 |
4 |
28.1 |
13.1 |
6.1 |
0.31 |
0.34 |
12.3 |
20.6 |
2.3 |
Gansu |
3.6 |
0.24 |
0.17 |
11.8 |
17.3 |
16.6 |
5.3 |
0.18 |
0.29 |
8.2 |
70.9 |
0.9 |
Qinghai |
0.7 |
0.09 |
0.04 |
9.8 |
9 |
13.6 |
0.4 |
0.02 |
0.02 |
13.3 |
36.4 |
0.8 |
Ningxia |
1.6 |
0.11 |
0.08 |
14.9 |
20.7 |
8.6 |
0.6 |
0.04 |
0.03 |
13.5 |
36.9 |
1.1 |
Xinjiang |
19.3 |
0.40 |
0.94 |
20 |
45.8 |
11.0 |
5.8 |
0.44 |
0.32 |
18.3 |
-0.2 |
1.5 |
China |
2048.9 |
100.00 |
100.00 |
14.5 |
29.1 |
11.0 |
1817.8 |
100.00 |
100.00 |
15.3 |
23.4 |
0.9 |
Source: Report on the Foreign Trade Situation of China, various issues, Ministry of Commerce, China. |
In the North-West region, provinces like Shanxi and Xinjiang are better placed in terms of their trade activities in the region. Similarly, some of the provinces of the South-western region engaged in better trade activities are Chongqing, Sichuan and Yunan. These provinces are located in the hinterland and they have considerable potential for trade activities. Indian businessmen should focus on these provinces that are almost located in the close vicinity of India. The Chinese government has offered preferential treatment to investors in specific regions such as the Western and Southern regions of the country. Since these regions are not considered as global centres for business, Indian investors should explore the possibilities of business opportunities in these regions.
4.6 Constraints to India’s Exports to China
In general, tariffs in China are lower than those in India particularly, for India’s major export items such as ores, pharmaceutical products, plastics, manmade staple fibers, and iron and steel. The non-tariff barriers and informal restrictions are of greater concern. Such restrictions in China on imports of goods and services apply to imports from India as well. Indian industry and business organisations have identified similar constraints in promoting their exports to China, for example: customs procedures, standards, certification and regulatory practices, and quantitative restrictions.
It was noted while examining the customs procedures that even after the issuance of valuation regulations in accordance with WTO Customs Valuation Agreement, many customs officials continue to use the minimum or reference price rather than the actual transaction price for valuation of goods. The same product may be subject to a case-by-case determination of customs value depending on the port of entry and often the decision regarding duty on the products becomes subject to negotiations between traders and customs officials. Re-exporters are allowed to import raw material only through a specified port. If they operate through other ports, they have to follow extremely difficult procedures to avail duty-free clearance of cargo. This problem is especially serious for Indian traders because of the limited transport links between India and China, which do not allow free choice of ports for landing.
Rules and regulations pertaining to standards and certification as applied to imports are different from those applied to domestic goods and these are frequently changed, the details of which are not easily available in a published form in the English language. The implementation of these regulations is different at different levels of government, with very little coordination between national and sub-national levels. Exemption procedures for import of replacement parts or imports of parts for assembly and re-export are burdensome and costly as the application is to be submitted in person and requires knowledge of the local language. Certification remains difficult, time consuming and a costly process for many commodities of interest to Indian exporters. In many cases, foreign companies’ products can only be tested at certain laboratories, and results from other competent authorities are unacceptable. For drugs and pharmaceuticals, the registration fee is very high and it takes a very long time to complete the registration process. Regarding sanitary and phytosanitary measures (SPS), it was noted that the certification requirements for some products, such as seeds, seafood products and fruits and vegetables, exceed what is necessary (as defined by international standards) to protect consumer health and often difficult to meet. In cases of trade disputes, the international system of arbitration for trade disputes is not recognised. It was also mentioned that quantitative restrictions like quota and licensing continue to be practiced by China particularly in certain categories of foodstuffs. Although such trade barriers are tough in China, India can yet explore the opportunity of a large trade potential in China in diversified sectors. Considering the trade opportunities in China and India’s competitiveness in several lines of exports, the present trend of trade imbalances may be settled without limiting the size of bilateral trade.
5. Changing Pattern of Tariff Liberalisation
The tariff policy of a country is closely linked to its production structure, as revealed by the experiences of countries. In relation to sectoral protection, India and China have a strong and divergent opinion on liberalisation in the agricultural sector. India considers agriculture as its important sector from the point of view of ‘livelihood security’, but not for its contribution to GDP. For protecting the interest of the rural poor, the Indian agricultural sector is protected as can be seen from the large gap existing between the domestic and border prices. China takes a lenient view of the protection of agriculture and, therefore, the tariff regime in agriculture was liberalised considerably as compared to India. China has adopted a strategic policy of protecting the domestic mineral resources and import of these to meet the pressing demand of its domestic industrialisation. Therefore, it has pursued a policy of importing minerals freely with a liberal tariff regime. Although India is a ‘mineral scarce’ economy, taking into account its future demand for industrialisation, it has not liberalised its mining sector too much, and, therefore, cannot be compared with China. As India unilaterally decides to bring down its average tariff close to the ASEAN as well as upto China’s level, independent tariff liberalisation in the manufacturing sector may be seen as the hallmark of trade liberalisation in both the countries.
5.1 Overall Liberalisation in the Tariff Regime
India started its comprehensive trade policy reforms one and a half decades later than China, and therefore, the tariff regime in China was much more liberal than in India. In 1992, China’s simple average tariff was 43.2 per cent as against 56.3 per cent in India (Table 5.1). With continued liberalisation, the simple average tariff declined to 9.7 per cent for China whereas it came down to 12.4 per cent for India in 2009. China made significant progress in liberalising the agricultural sector whereas this sector remained protected in India. In the present decade, both the countries have taken conscious decisions to liberalise their trade regimes unilaterally to facilitate their integration with the world economy. It is important to mention that the simple average overall tariff rate in India is lower than in China in the manufacturing sector in 2008. While the overall manufacturing tariff was 9.0 per cent for China the corresponding statistic was 8.7 per cent for India in 2008. The mining sector is relatively more liberalised in China than in India, but NTBs hinder Chinese exports of mining products. The overall import weighted tariff indicates that both the countries have made major strides in bringing down the level of tariffs since 2001. Tariff liberalisation was almost stagnant since 2005 for China, but India brought down its import weighted tariff significantly, mostly in the manufacturing sector in 2008.
Table 5.1: Structure of Tariff in Both Countries |
Sector |
1992 |
1997 |
2001 |
2005 |
2008 |
2009 |
Import Weighted Average Tariff |
China |
Agriculture |
20.8 |
50.3 |
56.6 |
8.8 |
7.6 |
7.1 |
Mining |
3.7 |
1.1 |
1.0 |
1.1 |
0.7 |
0.6 |
Manufacturing |
35.5 |
14.5 |
13.3 |
5.4 |
5.7 |
5.6 |
Overall |
33.1 |
15.5 |
14.1 |
4.9 |
4.8 |
4.5 |
India |
Agriculture |
32.1 |
23.4 |
58.7 |
55.7 |
22.5 |
31.7 |
Mining |
2.1 |
19.7 |
15.9 |
10.7 |
5.6 |
3.5 |
Manufacturing |
41.0 |
23.1 |
28.8 |
12.8 |
6.1 |
8.2 |
Overall |
30.3 |
22.4 |
26.4 |
13.4 |
6.4 |
8.1 |
Simple Average Tariff |
China |
Agriculture |
46.8 |
25.6 |
24.4 |
14.5 |
15.1 |
15.1 |
Mining |
22.6 |
4.2 |
3.7 |
3.6 |
3.1 |
3.0 |
Manufactures |
43.3 |
16.7 |
15.0 |
9.3 |
9.0 |
9.0 |
Overall |
43.2 |
17.6 |
15.9 |
9.8 |
9.7 |
9.7 |
India |
Agriculture |
44.3 |
28.7 |
41.9 |
38.0 |
33.4 |
33.2 |
Mining |
51.7 |
20.7 |
21.7 |
12.5 |
5.8 |
5.3 |
Manufactures |
58.4 |
30.9 |
31.2 |
15.2 |
8.7 |
9.0 |
Overall |
56.3 |
30.3 |
32.4 |
18.3 |
12.3 |
12.4 |
Source: RIS Based on Trains Wits, Online, ITC/World Bank, Geneva.
Note: Both simple and import weighted tariffs are estimated using tariff lines at 6-digit HS. |
As India and China are almost at similar levels of tariff regimes, further tariff liberalisation may not be a critical negotiating point for India in order to secure better market access in China. If preferential reduction of tariff takes place between the two countries, it may be more advantageous to China in the agricultural sector than to India. Considering the small export basket of India to China, peak tariff and preferential tariffs could be detrimental to the export interest of India. China is gradually following regionalism, and extension of tariff preferences to more regional partners could prevent Indian access to the Chinese market and realisation of its export potential. If China continues to maintain peak tariff on certain products which are of export interest to India, and continues to provide tariff preferences to many competing suppliers from emerging countries, India may have to look for an alternative strategy to join more Southern-based Regional Trading Arrangements to compensate the loss of trade in China.
5.1.1 Sectoral Tariff Liberalisation
There is a considerable level of similarity between India and China in the current level of reforms and their commitments for future liberalisation. Despite strongly adhering to the process of regionalism, their commitments to the multilateral process are very strong. These countries have displayed a strong inclination for self-propelled liberalisation to provide opportunities to their domestic firms to compete in a competitive business environment. These policy perceptions can take them forward with the passage of time. A comparative analysis of the existing tariff policies prevailing in India and China can provide some insight into the possibility for comprehensive economic engagement between them.
Table 5.2: Distribution of Average Import-Weighted Tariffs by HS Section |
(in per cent) |
A. China |
Sec |
Description |
1992 |
1997 |
2001 |
2005 |
2008 |
2009 |
1 |
Live Animals and Animal Products |
36.8 |
19.9 |
19.3 |
9.3 |
7.9 |
8.5 |
2 |
Vegetable Products |
3.9 |
87.1 |
91.7 |
6.2 |
4.7 |
4.8 |
3 |
Animal or Vegetable Fats & Oils |
28.0 |
71.3 |
29.8 |
13.0 |
9.9 |
9.2 |
4 |
Prepared Foodstuff, Beverages, etc. |
41.9 |
15.2 |
31.3 |
12.1 |
13.2 |
12.2 |
5 |
Mineral Products |
3.7 |
1.1 |
1.0 |
1.1 |
0.7 |
0.6 |
6 |
Products of Chemicals |
16.7 |
9.7 |
10.3 |
6.5 |
5.4 |
5.5 |
7 |
Plastics & Articles thereof |
32.5 |
16.5 |
18.2 |
9.2 |
6.4 |
6.4 |
8 |
Raw Hides & Skins, Leather, etc. |
82.7 |
19.3 |
17.8 |
7.4 |
7.3 |
7.8 |
9 |
Wood & Articles of Wood |
17.5 |
8.3 |
5.3 |
0.8 |
0.2 |
0.1 |
10 |
Pulp of wood or of other Fibres |
26.0 |
9.5 |
6.8 |
2.6 |
2.0 |
1.9 |
11 |
Textile & Textile Articles |
59.9 |
23.1 |
20.4 |
11.9 |
15.8 |
10.3 |
12 |
Footwear, Headgear and Umbrella |
77.6 |
24.1 |
24.3 |
15.6 |
15.7 |
15.7 |
13 |
Articles of Stone, Plaster, Cement |
43.0 |
18.8 |
14.5 |
11.3 |
12.0 |
12.2 |
14 |
Natural or cultured pearls, Jewellery |
33.2 |
9.9 |
7.3 |
4.7 |
4.5 |
4.8 |
15 |
Base Metals & Articles of Base Metal |
17.0 |
9.7 |
7.9 |
4.8 |
3.6 |
3.1 |
16 |
Machinery & Mechanical Appliances |
27.6 |
13.6 |
13.0 |
3.3 |
4.0 |
4.1 |
17 |
Vehicles, Aircraft and Vessels |
64.0 |
15.3 |
20.0 |
13.7 |
11.9 |
13.0 |
18 |
Optical, Photograph & Cinematography |
33.9 |
13.2 |
11.8 |
7.1 |
7.3 |
7.1 |
19 |
Arms and Ammunition |
60.0 |
15.0 |
13.0 |
13.0 |
13.0 |
13.0 |
20 |
Miscellaneous Manufactured Articles |
73.1 |
23.3 |
20.4 |
10.5 |
8.1 |
9.2 |
21 |
Works of Art Collectors' Pieces |
7.4 |
13.9 |
9.8 |
5.8 |
9.3 |
8.9 |
B. India |
Sec |
Description |
1992 |
1997 |
2001 |
2005 |
2008 |
2009 |
1 |
Live Animals and Animal Products |
55.4 |
15.5 |
35.2 |
31.1 |
33.2 |
33.0 |
2 |
Vegetable Products |
19.7 |
16.7 |
37.1 |
34.8 |
21.0 |
31.5 |
3 |
Animal or Vegetable Fats & Oils |
54.7 |
30.0 |
76.8 |
70.8 |
3.3 |
11.0 |
4 |
Prepared Foodstuff, Beverages, etc. |
71.5 |
31.2 |
47.9 |
60.9 |
66.0 |
74.4 |
5 |
Mineral Products |
2.1 |
19.7 |
15.9 |
10.7 |
5.6 |
3.5 |
6 |
Products of Chemicals |
59.3 |
24.7 |
29.5 |
14.3 |
6.8 |
7.3 |
7 |
Plastics & Articles thereof |
64.9 |
31.9 |
34.7 |
15.2 |
8.4 |
8.8 |
8 |
Raw Hides & Skins, Leather, etc. |
6.7 |
5.7 |
6.4 |
12.4 |
9.1 |
9.0 |
9 |
Wood & Articles of Wood |
13.4 |
2.5 |
6.8 |
6.3 |
7.3 |
7.4 |
10 |
Pulp of wood or of other Fibres |
38.3 |
10.8 |
18.0 |
13.6 |
7.7 |
9.2 |
11 |
Textile & Textile Articles |
39.7 |
30.2 |
20.2 |
15.8 |
8.0 |
10.1 |
12 |
Footwear, Headgear and Umbrella |
65.0 |
40.0 |
35.0 |
15.0 |
9.6 |
10.0 |
13 |
Articles of Stone, Plaster, Cement |
60.9 |
38.3 |
33.2 |
15.0 |
9.0 |
9.1 |
14 |
Natural or cultured pearls, Jewellery |
5.7 |
20.5 |
35.0 |
15.0 |
3.8 |
10.0 |
15 |
Base Metals & Articles of Base Metal |
40.8 |
28.2 |
32.3 |
17.8 |
6.2 |
6.3 |
16 |
Machinery & Mechanical Appliances |
50.7 |
22.8 |
23.8 |
8.9 |
6.1 |
7.1 |
17 |
Vehicles, Aircraft and Vessels |
50.0 |
18.1 |
25.9 |
9.6 |
9.8 |
10.3 |
18 |
Optical, Photograph & Cinematography |
56.9 |
22.4 |
24.5 |
12.6 |
6.5 |
6.8 |
19 |
Arms and Ammunition |
65.0 |
40.0 |
35.0 |
15.0 |
10.0 |
10.0 |
20 |
Miscellaneous Manufactured Articles |
64.9 |
36.3 |
34.1 |
15.0 |
10.0 |
10.0 |
21 |
Works of Art Collectors' Pieces |
59.5 |
37.8 |
34.7 |
15.0 |
10.0 |
10.0 |
Source: RIS Based on Trains Wits, Online, ITC/World Bank, Geneva.
Note: Both simple and import weighted tariffs are estimated using tariff lines at 6-digit HS. |
The disaggregated tariff structure of both the countries show variations in their level of tariff at the sectoral level. A cross-sectoral comparison of import weighted tariffs among the partner countries is presented in Table 5.2. These two countries differ significantly in the coverage and depth of protection provided to different sectors. In both the countries, agriculture is relatively protected and the manufacturing sector is subject to unilateral liberalisation. While all the sectors in agriculture are subject to double digit import weighted tariff in both the countries, China is seen as being more liberal than India in this sector. In the manufacturing sector, India has a more liberalised regime than does China. Among a total of 16 HS sections in the manufacturing sector, India has 13 sectors, with an import weighted average tariff in single digit while the corresponding number of sectors for China is 11 in 2008. A cursory view of the average tariff structure prevailing in India and China indicates that in 8 HS sections, India has a lower tariff than China out of a total of 21 HS sections. India’s robust liberalisation in 2008, left China trailing in the manufacturing sector liberalisation. In fact, China had a more liberal regime than India in most of the manufacturing sectors, except for hide & skin and footwear products until 2007. But the situation changed significantly when India overtook China in manufacturing sector liberalisation in several sectors except chemicals, wood and wood pulp, base metals and its auto sector in 2008. These differences would constitute a significant factor in the sectoral liberalisation negotiations in a regional framework. Both the countries adopted protectionist measures to minimise adverse effects of global recession in 2009. For a comparative analysis, Table 5.3 presents simple average tariffs in the two countries.
Table 5.3: Distribution of Simple Average Tariffs by HS Section |
(in per cent) |
A. China |
Sec |
Description |
1992 |
1997 |
2001 |
2005 |
2008 |
2009 |
1 |
Live Animals and Animal Products |
42.4 |
22.5 |
20.9 |
12.9 |
12.9 |
12.9 |
2 |
Vegetable Products |
39.9 |
23.1 |
21.8 |
13.7 |
15.4 |
15.4 |
3 |
Animal or Vegetable Fats & Oils |
35.1 |
38.3 |
37.0 |
13.7 |
12.0 |
12.3 |
4 |
Prepared Foodstuff, Beverages, etc. |
64.3 |
29.7 |
29.1 |
17.6 |
17.8 |
17.9 |
5 |
Mineral Products |
22.6 |
4.2 |
3.7 |
3.6 |
3.1 |
3.0 |
6 |
Products of Chemicals |
27.6 |
10.7 |
9.7 |
6.6 |
6.4 |
6.4 |
7 |
Plastics & Articles thereof |
35.5 |
15.9 |
16.7 |
10.2 |
9.5 |
9.5 |
8 |
Raw Hides & Skins, Leather, etc. |
72.0 |
22.5 |
19.8 |
13.2 |
12.8 |
12.8 |
9 |
Wood & Articles of Wood |
35.3 |
10.9 |
10.3 |
4.8 |
4.0 |
4.0 |
10 |
Pulp of wood or of other Fibres |
31.2 |
14.3 |
13.1 |
5.6 |
5.4 |
5.4 |
11 |
Textile & Textile Articles |
73.6 |
26.6 |
21.1 |
11.4 |
11.6 |
11.6 |
12 |
Footwear, Headgear and Umbrella |
86.6 |
24.2 |
23.1 |
18.4 |
18.2 |
18.2 |
13 |
Articles of Stone, Plaster, Cement |
49.5 |
18.7 |
18.1 |
13.4 |
12.9 |
12.9 |
14 |
Natural or cultured pearls, Jewellery |
35.9 |
15.0 |
13.6 |
10.1 |
10.1 |
10.1 |
15 |
Base Metals & Articles of Base Metal |
28.2 |
10.7 |
9.8 |
7.5 |
7.2 |
7.2 |
16 |
Machinery & Mechanical Appliances |
31.3 |
15.4 |
14.8 |
8.7 |
7.9 |
7.9 |
17 |
Vehicles, Aircraft and Vessels |
44.4 |
23.0 |
20.8 |
11.9 |
11.3 |
11.3 |
18 |
Optical, Photography& Cinematography products |
38.2 |
15.8 |
14.7 |
10.4 |
10.1 |
10.0 |
19 |
Arms and Ammunition |
60.0 |
15.0 |
13.0 |
13.0 |
13.0 |
13.0 |
20 |
Miscellaneous Manufactured Articles |
68.5 |
21.3 |
20.3 |
12.2 |
13.1 |
13.1 |
21 |
Works of Art Collectors' Pieces |
28.6 |
9.7 |
9.0 |
8.9 |
8.9 |
8.9 |
B. India |
Sec |
Description |
1992 |
1997 |
2001 |
2005 |
2008 |
2009 |
1 |
Live Animals and Animal Products |
17.4 |
14.1 |
36.6 |
31.1 |
30.4 |
31.1 |
2 |
Vegetable Products |
37.4 |
23.9 |
37.3 |
35.7 |
32.4 |
32.6 |
3 |
Animal or Vegetable Fats & Oils |
61.9 |
31.2 |
67.3 |
65.4 |
27.0 |
15.5 |
4 |
Prepared Foodstuff, Beverages, etc. |
79.3 |
51.3 |
48.1 |
42.5 |
39.5 |
40.6 |
5 |
Mineral Products |
51.7 |
20.7 |
21.7 |
12.5 |
5.8 |
5.3 |
6 |
Products of Chemicals |
61.1 |
29.2 |
33.3 |
15.6 |
8.2 |
8.4 |
7 |
Plastics & Articles thereof |
64.8 |
32.6 |
34.7 |
15.3 |
9.4 |
9.6 |
8 |
Raw Hides & Skins, Leather, etc. |
40.6 |
26.0 |
24.0 |
12.8 |
7.4 |
7.4 |
9 |
Wood & Articles of Wood |
54.8 |
26.0 |
28.7 |
13.6 |
9.0 |
9.0 |
10 |
Pulp of wood or of other Fibres |
49.0 |
23.0 |
27.5 |
13.3 |
8.8 |
8.9 |
11 |
Textile & Textile Articles |
62.7 |
38.2 |
30.9 |
15.4 |
9.4 |
10.0 |
12 |
Footwear, Headgear and Umbrella |
65.0 |
40.0 |
35.0 |
15.0 |
9.8 |
10.0 |
13 |
Articles of Stone, Plaster, Cement |
63.6 |
39.6 |
34.4 |
15.0 |
9.7 |
9.7 |
14 |
Natural or cultured pearls, Jewellery |
49.3 |
35.7 |
35.0 |
15.0 |
8.9 |
10.0 |
15 |
Base Metals & Articles of Base Metal |
62.2 |
28.5 |
33.4 |
16.5 |
7.2 |
7.3 |
16 |
Machinery & Mechanical Appliances |
50.3 |
25.3 |
26.5 |
13.6 |
7.1 |
7.7 |
17 |
Vehicles, Aircraft and Vessels |
52.8 |
33.2 |
39.9 |
23.9 |
19.7 |
19.9 |
18 |
Optical, Photograph & Cinematography |
54.6 |
28.9 |
28.1 |
13.7 |
8.3 |
8.7 |
19 |
Arms and Ammunition |
65.0 |
40.0 |
35.0 |
15.0 |
10.0 |
10.0 |
20 |
Miscellaneous Manufactured Articles |
64.5 |
35.1 |
33.4 |
15.0 |
10.0 |
9.6 |
21 |
Works of Art Collectors' Pieces |
46.4 |
34.3 |
30.0 |
12.9 |
8.6 |
8.6 |
Source: RIS Based on Trains Wits, Online, ITC/World Bank, Geneva.
Note: Both simple and import weighted tariffs are estimated using tariff lines at 6-digit HS. |
During the period of recession, China’s import weighted tariff in broad sectors remained unchanged, though sectoral tariff has undergone significant change as shown in Figure 5.1. While average tariff declined in some sectors, intensification of tariff was seen in other sectors in a significant manner. The range of tariff difference among sectors varied between (-) 22.2and 32.2 per cent during 2009-11. Out of 21 sectors reported, average tariff declined in 10 sectors and double digit decline was observed in specific sectors like pulps, minerals and textiles & clothing. On the contrary, average tariff intensified in 8 sectors where stiff hike in average tariff was found in certain agricultural sectors such as animal products, fruits & vegetables, prepared food and automobile sector during 2009-11. Average tariff remained unaltered for some lead sectors of the Chinese economy such as machinery & mechanical appliances and arms & ammunitions during the said period. Adjustment at the level of sectoral tariff has enabled China to maintain average tariffs for the broad sectors despite aggressive tariff restructuring enforced at the micro-sectoral level to arrest recessionary pressure on the domestic economy.
Figure 5.1: Chinese Response to Global Recession
5.2 Impact of Trade Liberalisation on Agricultural and Manufacturing Sectors in India: A Simulation Analysis Using Computable General Equilibrium (CGE)
Since the Uruguay Round of Trade Negotiation, India has been described as a protectionist state, having policies against sectoral liberalisation, particularly, in the agricultural sector. It has been India’s position that a vast majority of India’s rural population is drawing its livelihood from the agricultural sector, and thus, it requires protection for ensuring livelihood security for millions. Experiences of developing countries indicate that radical liberalisation in any sector including the vibrant manufacturing sector can generate imbalances among sectors in the economy. Therefore, the effect of liberalisation in any sector is an empirical question, and the implication of such policies may have nation-wide implications. Considering the sensitivity of the issues, we have used a simulation analysis to examine the impact of specific sectoral policy liberalisation on India economy.
5.2.1. Aggregations of regions and sectors
In a simulation analysis, the implications of complete trade liberalisation in the agriculture and manufacturing sectors are analysed separately on different sectors of the Indian economy in a Computable General Equilibrium (CGE) framework. Global economy in this analysis is aggregated into twelve broad regions where India and China are kept separately in the aggregation, using the GTAP Ver.7 database (see for example, aggregation of regions and sectors in Appendix I). Regionalisation in the model is broadly based on continents and their sub-regions. Similarly, production sectors are aggregated into thirteen broad sectors where the agricultural sector is represented by four sub-sectors and the manufacturing sector by seven sub-sectors. The mining and services sectors are presented separately in the sectoral aggregation.
5.2.2. Agricultural Sector Liberalisation
Effects on Economic Welfare:
The simulation analysis has examined the implication of complete unilateral liberalisation of the agricultural sector on the Indian economy. The liberalisation in the agricultural sector is simulated, leaving the manufacturing and other sectors to operate under the business as usual conditions. The results indicate that complete opening up of the agricultural sector is like to experience losses of economic welfare to India. Surge of agricultural imports and a decline in the production of agricultural products in India may have an adverse impact on some regions of the global economy as for example China, Sub- Saharan Africa, and East Asia, among others.
Adverse Effects on Agricultural Production
Trade liberalisation in agriculture has an adverse impact on the level of sectoral production. Results show that agricultural production in value added terms is expected to decline, following a removal of trade barriers in the agricultural sector. Decline of production will be experienced in several agricultural sub-sectors including food grains, animal products including milk products and processed food and other crops. These sub-sectors cover broad product categories like vegetables and oils & fats; and a declining production performance are likely to be experienced in these sub-sectors.
Complete removal of barriers in the agricultural sector will result in a decline of production by 1.1 per cent of the total output expected to be produced in the sector in the pre-liberalisation period. The largest decline in production will be experienced in the animal product sector (-1.3 per cent), followed by the processed food (-1.25 per cent) and food grains (-1.06 per cent) sub-sectors. Since production bases are different for different sub-sectors, the absolute impact of reduction of production will be felt differently in individual sub-groups.
Shortfall of production is expected to be the largest in the food grain sub-sector, followed by processed food and animal products. Nearly, 57.7 per cent of total contraction of agricultural output will be in the food grain sector whereas the processed food and animal products sectors would share 29.5 per cent and 12.8 per cent respectively, of the total output losses in the event of complete removal of trade barriers in the agricultural sector.
Trade Imbalance
Complete trade liberalisation in the agricultural sector is likely to contribute to a widening of the trade deficit in the sector. The expected sectoral trade deficit alone would be to the level of 2.1 per cent of the total imports of India. The expected agricultural deficit is likely to be 11.5 per cent of the overall trade deficit, which is hovering at around 3.5 per cent of GDP. Full-blown liberalisation in agriculture alone is likely to widen the trade deficit to an unsustainable level of over 0.4 per cent of GDP.
The agricultural sector in the present model comprises of four sub-sectors. In a scenario assuming complete trade liberalisation in the sector, food grains is likely to contribute 52.7 per cent of the total expected agricultural trade deficit. The second largest overall agricultural trade deficit may be processed food with a sectoral contribution of 32 per cent followed by the animal product sector as show in Figure 5.2. Agricultural liberalisation may not necessarily contribute to a depletion of production in all sub-sectors, rather some off-farm activities may be strengthened with farm sector liberalisation, particularly forestry and other allied activities.
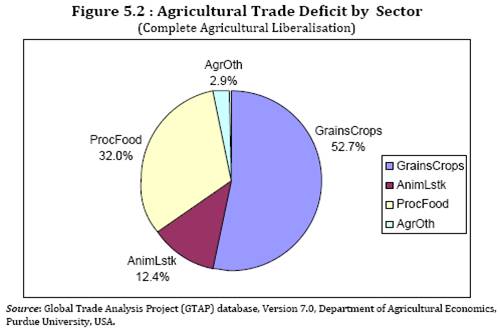 The results are consistent with the overall trade policy of India in the sense that radical liberalisation in the agricultural sector may adversely affect overall welfare of the country on account of reduction of domestic production in agriculture and other allied sectors. Adverse welfare effects may be because of declining purchasing power in the agrarian sector. With increased imports and a declining domestic production, trade imbalances are likely to expand. These developments would adversely affect food and the livelihood security of people living in the rural sector.
5.2.3. Manufacturing Sector Liberalisation
India has considerably liberalised its manufacturing sector to match the tariff level of ASEAN countries in recent years. In many manufacturing sub-sectors, India’s average tariff rates41 are comparable or better than those of China42 in the last decade. In this context, trade theories43 stipulate that protection is required for the manufacturing sector (which may be to a limited extent) for nurturing them in their infancy to compete with the rest of the world at a later stage. Therefore, gradual liberalisation of the manufacturing sector has been the most stylised approach adopted by both developed and developing countries. However, the whole issue is about the speed of liberalisation, which varies across counties depending upon the structure of the manufacturing sector in individual countries. In this analysis, we have examined the implication of complete liberalisation in the Indian manufacturing sector on the rest of the economy, allowing other sectors like agricultural, mining and services to follow the business as usual conditions. In this model, we have assumed unilateral liberalisation committed by India with the rest of the world, without negotiating for reciprocal commitments from the rest of the world.
Effects on Economic Welfare
The results show loss of welfare for the Indian economy while implementing complete unilateral trade liberalisation in the manufacturing sector. Loss of welfare is expected to reach US$ 17.7 billion for the year 2011. This will be around 0.9 per cent of GDP in the same year. The manufacturing liberalisation would invoke loss of welfare due to expected imports in several manufacturing sectors, adverse terms of trade and deteriorating trade balance with the rest of the world. Manufacturing sector liberalisation in India has no adverse impact on the major regions of the world including China, but rather most of them are likely to benefit from a gainin market access in India. If India liberalises, the major beneficiaries are expected to be the European Union, the North America and the East Asian countries. However, India’s liberalisation is likely to enhance global economic welfare, though it is at a minuscule level.
Impact on Balance of Trade
Liberalisation in the manufacturing sector is likely to enlarge trade imbalances of the country, because most of the broad manufacturing sectors are sensitive to radical trade liberalisation. Sectoral trade deficit on account of manufacturing liberalisation could be to the extent US$ 16.9 billion in 2010. The manufacturing trade deficit is like to be 25.6 per cent of the overall trade deficit or 4.5 per cent of India’s present imports.
Complete trade liberalisation in the manufacturing sector is likely to affect all most all the sub-sectors in the Indian economy, leading to further aggravation of the existing trade deficit as shown in Figure 5.3. Among various broad manufacturing sectors in the CGE model, the largest trade deficit will be felt in the textile and clothing sector. The expected trade deficit in the sub-sector is likely to be 16.8 per cent of the overall trade deficit and 3 per cent of country’s total imports. Other sectors also likely to register a trade deficit, include base metal, chemicals, automotive, heavy manufacturing and machinery sub-sectors. Complete trade liberalisation may not have an adverse impact on all the sub-sectors in the manufacturing sector. A positive impact of liberalisation is likely to be felt in the light manufacturing sub-sector, which is represented by industries like leather products, paper, wood products, etc. Prospects of export in the sub-sector are likely to improve, leading to generation of significant levels of trade surplus, which can partly absorb trade imbalances generated in other sub-sectors.
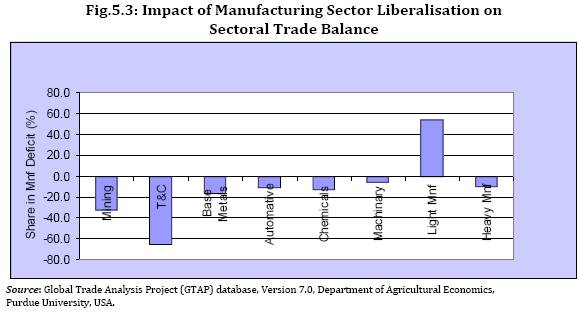 The adverse impact of manufacturing liberalisation is also felt in other sectors. The most affected sector outside manufacturing sector could be the energy sectors, where large pressure is expected for imports. With increased demand for industrial activities, import on petroleum, oil and lubricants (POL) is expected to rise. The results indicate that the trade deficit in the sub-sector would be 8.5 per cent of the overall trade deficit and 1.5 per cent of total import bill of India.
Results of the simulation analysis present that trade prospects of the country are likely to be affected adversely with the radical liberalisation in the manufacturing sector. This is indicated further by the expected decline in India’s terms of trade. The implication of complete trade liberalisation in the manufacturing sector alone may allow terms of trade to deteriorate by 3 per cent. Therefore radical liberalisation in either agricultural or manufacturing sector may adversely impact the overall welfare position of the country. Trade liberalisation unilaterally or on a reciprocal basis should be made gradual, and sequencing of sectoral liberalisation is required on the basis of the sensitivity of sectors.
5.3. India’s Export Potential in China
India has been maintaining a high export growth to China since 2004, but this has been adversely affected by the recent episode of global recession. Growth of imports in most of the important export markets of India became either negligible or negative since September 2008. This trend is slowly turning around in recent months. China is one among the important market destinations in which India’s export potential has been inadequately realised on account of the recent global turmoil. India’s large trade potential is yet to be tapped in diversified sectors of the Chinese market ranging from primary and labour intensive products to various levels of technology-intensive products. The Medium Term Export Strategy (MoC, 2002) has identified nearly twenty-five important destinations to focus on medium-term exports, and China has been identified as one of the most important countries for India.44
China recently became India’s largest trading partner, and its exports have increased so sharply that it is inflicting an unsustainable trade deficit on India which has achieved a moderate bilateral export growth only so far. For reversing the problem of trade imbalances without interrupting the present flow of bilateral trade, sharp focus on the growth of India’s exports may be emphasised for the balanced growth of the domestic external sector. For addressing trade imbalances, India should substantially improve its presence in the Chinese export market. In this context, an attempt has been made to estimate India’s export potential in China at a disaggregated product level based on the export competitiveness of India.
In the economic literature, there are two important approaches, that are commonly pursued to examine the competitiveness of an economy at the disaggregated product level, namely, the Vinerian approach (1950) and the revealed comparative advantage (Balasa, 1973, 1989).45 Between the two approaches, the framework of Viner is considered to be better than the other in terms of examining export competitiveness and the estimation of trade potentials (Greenway et al., 1989; Mohanty, 2009; Mohanty and Arockiasamy, 2010; Mohanty; 2001; Kumar and Mohanty, 2000). Viner evolved dual concepts of trade creation and trade diversion effects to explain the gains from tariff liberalisation between partner countries using policy-induced preferential trade. It is argued that the approach provided the framework for enhancing bilateral trade through trade creating effects which could be the most enduring basis for trade expansion among partner countries. It has mostly focused on demand-driven aspects of trade, taking into account product pricing as the major determinant of trade (see Appendix II for a detailed discussion on the model for the estimation of trade potential using the Vinerian approach). This approach recognises the relevance of supply and non-pricing constraints which have been the guiding factor in determining the magnitude of trade potential in the partner country.
We have modelled both demand and supply factors to examine the level of trade potentials in the Chinese market in the present study. Earlier studies46 in India have estimated the trade potential of India in the Chinese market on the basis of its competitive strength. The Joint Study Group (JSG) report has highlighted the presence of high trade potentials in both the countries. Similar results have been reported by other studies. Based on the empirical results, the JSG report recommended the formation of a Comprehensive Economic Partnership Agreement between the two countries. With global and domestic dynamics, the economic strength of both the countries have changed remarkably, and, therefore, fresh estimation of trade potential is required based on recent trade information.
While examining trade possibilities under the proposed arrangement, price competitiveness forms the basis for identifying potential products exported by a supplier to an importing country. At this point, a comparison is made between the level of demand for a product by an importer and supply capabilities of the exporter and the minimum of the two is considered as trade potentiality of the exporting country in the importing market. In this exercise, potential exporter’s supply price for a product (i.e. at 6-digit HS) is evaluated with other suppliers of the importing country, and in case some existing supplier is found to be uncompetitive to the potential exporter in price competition, then a portion of the current market share retained by the inefficient supplier will be treated as trade potential of the potential efficient exporter. This exercise is iterated for different pairs of countries at the disaggregated product level for estimating the export potential for the partner country. A major disadvantage of this approach is that factors determining competitiveness of a product such as its quality and post delivery services among various others are not accounted for in the model. The approach is constrained by not accommodating these factors in the model. As a matter of fact, international trade data is so distorted that more accurate analysis may not be possible with the existing database.
The trade potential of each trading country in the markets of its trading partners are examined empirically based on the Vinerian framework. In this context, two important issues are discussed in this section. First, attempts have been made to estimate the level of export potential at a more disaggregated level of products,47 on the basis of their price competitiveness. Second, the distributional pattern of export potential is examined across various trade sectors to understand the prospects of gains from the proposed trade liberalisation.
6. Sectoral Distribution of India’s Export Potential
6.1. Estimates of India’s Export Potential in China
India is struggling to be one of the top ten importers of China but with the moderate growth of the bilateral exports, it would be difficult to improve its ranking as a major exporting partner. Though India’s present exports to China constitute a small proportion of China’s overall imports, the total bilateral export potential of India was estimated at US$ 28.4 billion in 200848 and it reached to US$ 53.3 billion in 2012 (see Table 6.1). This is a very conservative estimation that can easily be achieved in the medium term. The export potential of India was nearly 3 times than that of actual bilateral export with China in 2008 and increased further to 3½ times in 2012 due to the decline of bilateral exports in 2012. The potential exports are not likely to be distributed equitably among the sectors as India has developed competitiveness in different lines of products.
Table 6.1: Export Potential of India in China during 2004-12 |
(million US$) |
Sec |
Description |
Export Potential in 2012 |
Share |
CAGR |
2004 |
2007 |
2012 |
2008-12 |
1 |
Live Animals and Animal Products |
404.0 |
0.4 |
0.3 |
0.8 |
31.7 |
2 |
Vegetable Products |
326.8 |
3.8 |
0.3 |
0.6 |
-28.2 |
3 |
Animal or Vegetable Fats & Oils |
483.3 |
0.0 |
0.4 |
0.9 |
23.5 |
4 |
Prepared Foodstuff, Beverages, etc. |
647.1 |
0.8 |
0.6 |
1.2 |
24.3 |
5 |
Mineral Products |
19520.3 |
7.6 |
9.7 |
36.6 |
14.9 |
6 |
Products of Chemicals |
3952.2 |
9.1 |
5.8 |
7.4 |
11.1 |
7 |
Plastics & Articles thereof |
2647.0 |
7.0 |
5.4 |
5.0 |
9.7 |
8 |
Raw Hides & Skins, Leather, etc. |
197.9 |
0.7 |
0.3 |
0.4 |
17.7 |
9 |
Wood & Articles of Wood |
530.0 |
0.3 |
0.5 |
1.0 |
47.9 |
10 |
Pulp of wood or of other Fibers |
246.5 |
0.9 |
0.7 |
0.5 |
4.8 |
11 |
Textile & Textile Articles |
1492.9 |
4.9 |
2.3 |
2.8 |
18.6 |
12 |
Footwear, Headgear and Umbrella |
90.6 |
0.1 |
0.1 |
0.2 |
19.3 |
13 |
Articles of Stone, Plaster, Cement |
370.8 |
0.9 |
0.7 |
0.7 |
15.4 |
14 |
Natural or cultured pearls, Jewelry |
257.4 |
0.5 |
0.8 |
0.5 |
5.3 |
15 |
Base Metals & Articles of Base Metal |
2352.1 |
7.8 |
7.0 |
4.4 |
2.8 |
16 |
Machinery & Mechanical Appliances |
13828.4 |
43.2 |
55.9 |
25.9 |
-3.8 |
17 |
Vehicles, Aircraft and Vessels |
3390.5 |
5.4 |
4.3 |
6.4 |
16.7 |
18 |
Optical, Photograph & Cinematography |
2384.9 |
6.0 |
4.5 |
4.5 |
12.3 |
19 |
Arms and Ammunition |
0.2 |
0.0 |
0.0 |
0.0 |
39.1 |
20 |
Miscellaneous Manufactured Articles |
229.6 |
0.6 |
0.4 |
0.4 |
15.2 |
21 |
Works of Art Collectors' Pieces |
4.2 |
0.0 |
0.0 |
0.0 |
62.7 |
| |
Total |
53356.7 |
100.0 |
100.0 |
100.0 |
6.9 |
Source: RIS estimation based on Comtrade, online [Accessed on October 25, 2013, United Nations]
Note: Export potential and export potential are used interchangeably. Export potential is in million US$, and growth and share in percentage. Export potential is estimated using the model presented in Appendix III. It is estimated at 6-digit HS, using bilateral trade flow. |
In the Indian context, some studies (ADB, 2005; Mohanty and Arockiasamy, 2010) have observed that the volume of exports is important for a country to provide stability to domestic growth, but the most important aspect of export has been its level of margin from the business (UNCTAD, 2002). In order to improve the return of exports, the exportable products need to be more technology intensive and consistent with the global dynamic exports. Often, it is observed that the technology intensity of product composition in the export basket improves as a country progresses in terms of its economic and technological accomplishment. India has been restructuring it export basket to include more technology-intensive products, particularly, globally dynamic products (Mohanty, 2010) since beginning of its second generation of reforms. India is still way behind China49 in terms of restructuring its exports basket.
The Changing pattern in distribution of export potential across the sectors is important for India. It is clearly evident from the sectoral distribution that mineral export potential is likely to dominate the future trade of India and the sector could have shared 36.6 per cent of the total export potential existed in 2012 (see Table 6.1). Surging demand for industrial raw material/intermediates in the Chinese domestic market will be the determining factor for the expected growth of exports from the sector. Moreover, India is strongly endowed with natural resources as well as technology to harness such rich reserves. Apart from minerals, others important potential sectors are mostly driven by the technology, for example: machinery and mechanical appliances, chemicals and pharmaceutical products, plastics, and the auto sector, among others. Other than the mining sector, the largest potential demand for export is in the machinery and mechanical appliances sector. More than one fourth of India’s bilateral export potential falls within this sector. There are several low technology sectors that are likely to get a significant market share in China such as chemicals, base metals and plastics. Some products of the agricultural sector can have some opportunities in the proposed market including vegetable products, and prepared food. The combined share of the agricultural export potential could be more than 3.5 per cent of the potential exports and these sectors could jointly have access to additional export of US$ 1861 million in 2012. However, the Indian export potential is highly concentrated in certain sectors. Nearly seven major sectors are likely to share 90.2 per cent of India’s total potential exports in the medium term and most of them are in the manufacturing sector except mineral sector.
The bilateral export potential of India expanded at a CAGR of 23.3 per cent during 2004-08 and moderated to 6.9 per cent during 2008-12. During 2008-12, export potential in the mining sector grew at a CAGR of 14.9 per cent which is considered high as compared to other major sectors with significant export potential. On the contrary, machinery and mechanical appliances sector, potentially a major sector, witnessed negative growth in export potential during 2008-12. However, recession had the dampening effect on the bilateral export potential of India. The CAGR of bilateral export potential of India declined from 23.3 per cent during global buoyancy to just 6.9 per cent during global recession. The sectoral performance to a large extent was skewed during the period of recession. While some major sectors exhibited the possibility of posting high growth in bilateral export potential, others showed pessimism in this regard. Sectors like textile, automobiles, optical, photograph & cinematography products and chemicals and plastics showed moderate to high growth rate in exports during 2008-12. Worrying factor has been sectors having poor performance like base metals and machinery & mechanical appliances where growth of bilateral export potential was either low or negative during 2008-12. Such capital goods sectors need to be supported to regain their momentum as these sectors need more time to pick up despite return of buoyancy in the global and domestic markets.
6.2 Export Potential of Currently and Potentially Traded Products
India’s export potential can be separated into those products that are currently traded with China and also those potentially traded products that can be tried by Indian exports to the Chinese market by looking at their globally competitive position. The total bilateral export potential of India is separated from currently and potentially traded products (see Table 6.2).
The export potential of currently exported products of India was constituted 60.9 per cent of India’s total bilateral export potential in China in 2008 and increased to 85.5 per cent in 2012. This indicates that there are several products that are not exported to China, but have nevertheless a large export potential in China. India can pursue export of such products to China on the basis of its global competitiveness. Like the current bilateral flow of exports, the export potential of India is also highly concentrated in selected sectors. This is the case for both currently and potentially traded products of India to China. Among the currently exported products, the export potential is more evenly distributed across sectors than among the presently non-exporting sectors.
Table 6.2: Export Potential of India in China in 2012
(For currently and potentially traded products) |
(in million US$) |
Sec |
Description |
Export Potential Currently |
Share (percent) |
Exporting to Total |
Not Exporting |
Exporting |
Not Exporting |
Exporting |
(percent) |
1 |
Live Animals and Animal Products |
203.44 |
38.2 |
11.8 |
0.4 |
15.8 |
2 |
Vegetable Products |
135.42 |
288.3 |
7.9 |
2.8 |
68.0 |
3 |
Animal or Vegetable Fats & Oils |
137.07 |
0.9 |
8.0 |
0.0 |
0.6 |
4 |
Prepared Foodstuff, Beverages, etc. |
105.26 |
80.1 |
6.1 |
0.8 |
43.2 |
5 |
Mineral Products |
112.40 |
564.0 |
6.5 |
5.5 |
83.4 |
6 |
Products of Chemicals |
218.08 |
844.3 |
12.7 |
8.3 |
79.5 |
7 |
Plastics & Articles thereof |
13.39 |
825.5 |
0.8 |
8.1 |
98.4 |
8 |
Raw Hides & Skins, Leather, etc. |
5.09 |
31.5 |
0.3 |
0.3 |
86.1 |
9 |
Wood & Articles of Wood |
6.20 |
35.2 |
0.4 |
0.3 |
85.0 |
10 |
Pulp of wood or of other Fibers |
7.45 |
124.3 |
0.4 |
1.2 |
94.3 |
11 |
Textile & Textile Articles |
17.28 |
435.6 |
1.0 |
4.3 |
96.2 |
12 |
Footwear, Headgear and Umbrella |
0.39 |
11.6 |
0.0 |
0.1 |
96.7 |
13 |
Articles of Stone, Plaster, Cement |
2.83 |
82.4 |
0.2 |
0.8 |
96.7 |
14 |
Natural or cultured pearls, Jewellery |
8.05 |
61.5 |
0.5 |
0.6 |
88.4 |
15 |
Base Metals & Articles of Base Metal |
72.05 |
885.5 |
4.2 |
8.7 |
92.5 |
16 |
Machinery & Mechanical Appliances |
195.91 |
4780.6 |
11.4 |
47.0 |
96.1 |
17 |
Vehicles, Aircraft and Vessels |
369.09 |
517.7 |
21.4 |
5.1 |
58.4 |
18 |
Optical, Photograph & Cinematography |
68.63 |
518.1 |
4.0 |
5.1 |
88.3 |
19 |
Arms and Ammunition |
0.19 |
0.0 |
0.0 |
0.0 |
0.0 |
20 |
Miscellaneous Manufactured Articles |
44.62 |
54.8 |
2.6 |
0.5 |
55.1 |
21 |
Works of Art Collectors' Pieces |
0.00 |
0.1 |
0.0 |
0.0 |
100.0 |
| |
Total |
1722.83 |
10180.2 |
100.0 |
100.0 |
85.5 |
Source: RIS estimation based on Comtrade, online [Accessed on October 25, 2013, United Nations]
Note: Export potential is in million US$, and growth and share in percentage. Export potential is estimated using the model presented in Appendix III. It is estimated at 6-digit HS, using bilateral trade flow. |
Among the currently traded products, export potential is mostly concentrated in seven sectors, namely, minerals, machinery, plastics, chemicals, automobiles, optical & precision instruments and base metals. These sectors share nearly 87.8 per cent of the total bilateral export potentials of India from the currently traded products in 2012.
India is yet to introduce some of its globally competitive products in the Chinese market. These products are mostly concentrated in the mining sector in pre-recession period and there have been many such sectors in recent years. Such existing export potential products are evenly spread over other sectors such as fruits & vegetables, machinery& electrical products, automobiles, chemicals, animal products, processed food, and minerals, among others.
We bring home the point that the export potential in India’s currently and potentially traded sectors are mostly linked to diversified sectors. However, Chinese imports have been more inclined towards technology-intensive sectors since its exports are becoming more technology intensive in recent years. India has to restructure its export orientation to meet the specific import requirements of China, so that it can have wider access to the domestic market. If product restructuring is initiated in the Indian export basket, it can reduce its current pressure on bilateral trade imbalance so as to normalise its trade with China in the medium term.
7. Engagement of China and India in Global Value Chain
Global trade has been growing faster than global production during the last few decades. In global trade the segment that is surging faster than rest of the trade has been the Global Value Chain (GVC). Empirical evidences show that three sectors namely textiles & apparel, electronics and auto components are expanding rapidly and their share in the global export has been increasing significantly in recent years. In the context of regional analysis, some studies indicate that the prospects of welfare gain from the regional value chain (RVC) have been much larger than that from other modalities of regional trade liberalisation including FTA. While examining benefits accruing from the regional trade liberalisation, particularly through PTAs/FTAs, some studies show that the magnitude of gains could be between 2 and 4 per cent of GDP in Asia (Kawai and Ganesh, 2007; Mohanty and Arockiasamy, 2010). On the contrary, the expected gains from the GVC approach could be much higher than regional trade liberalisation. It is estimated that gains from trade liberalisation within the framework of GVC could range between 10 and 20 times larger than those accruing through trade liberalisation (Moran, 2002). Taking into account the strong economic benefits associated with the GVC, India can take advantage of her trade linkages with China in the Global Production Network (GPN).
The Multi-National Corporations (MNCs) are the principal drivers of global exports in the value chain sector. Production cost plays an important role in the approach. MNCs require free movement of intermediates and final good across the border and reduction of transaction cost as well as use of real time to keep the production cost low50. With trade and production fragmentation, the level of specialisation in production increases, and no country could have comparative advantage in all segments or for all stages of production in a product/sector. Strong adherence to such production processes could increase interdependence between counties and with the rise of trade interdependence, bilateral trade is likely to increase, but it has significant implications for India’s trade policy.
The stylised behaviour of MNCs indicates that they have complete control over entire range of production activities including conceptualisation of a product, choice and access to materials, production capabilities, R&D, access to technology, marketing strategies, brand name, packaging, product delivery and post-delivery services. But they often share some of their production activities with local firms on account of low wage rates and other natural endowments available with the host country. In the case of production sharing with local firms, the transaction cost of the MNCs remains low. The preference for production operation is always a region that has greater proximity to the market. Since Asia is growing fast and its growth centres are spreading from east towards south, there exists a high concentration of MNC activities in East and South-East Asia, mostly in China.
In the scheme of GPN, local firms have a major role to play. Engagement of local firms with MNCs has been a key element of this network where a sizable number of production activates is shared by them. MNCs often collaborate with local firms only in the unskilled and low-technology part of the production process, while the more sophisticated and key components of such processes are managed on their own. Evidences indicate that local firms improve their capabilities in association with the MNCs. In the process, local firms upgrade their brand building competence and other trade promotion ventures, as they strengthen their production capabilities. Gradually these local firms emerge as regional MNCs over a period of time.
China has been the global hub of the GVC activities and its local firms have played an active role in these growing production fragmentation activities and subsequently have emerged as transnational companies during the last two decades. For various sectors until the 1990s, regional hubs for the production network were located in several Asian countries such as Singapore, Hong Kong, Malaysia and South Korea, among others. The situation changed significantly with the polarisation of sectoral hubs to China, and the country has emerged as a hub for several production assembly lines. This has not only improved trade dependence on ASEAN countries but also improved their intra-regional trade. The sector has been one of the most important foreign exchange earners for China. Apart from ASEAN, China has strong trade ties with the industrialised countries, particularly, with the EU and the US. Two-way flow of bilateral trade of China with these destinations is significant for parts and components.
One of the best performing RTAs in the context of developing countries is ASEAN where the regional value chain has contributed to the growth of their intra-regional trade in industrial intermediates, particularly in parts and components. Various agreements with China, both bilaterally and regionally, have contributed to their engagement with China. For initiating such production activities in the region, several production and trade-facilitating Agreements were signed. India has high degree of competence to produce internationally competitive products with quality. It has the potentiality to integrate itself with several competitive sectors such as textiles & apparels, leather, food processing, automobiles, pharmaceuticals & traditional medicines, cement, and IT software, among others.
Although China has been importing significantly from East and South-East Asia51 and from industrialised countries, India’s experience in the bilateral exports of parts and component products to China has been dismal. India has competitiveness in a number of products for the Chinese market and therefore it has large export potential in the country. Experience shows that India can replace many suppliers to China from ASEAN countries for several parts and components products. Realisation of such trade potential could support India’s endeavour to reduce its bilateral trade imbalances with China. Therefore, an analysis of trade linkages related to the Global Value Chain (GVC) is important in the context of India-China future trade engagement.
7.1 Methodological Issues
Although GVC has been relevant from the point of view of global production and trade, very little has been achieved so far in tracking the fragmentation of production and trade in various sectors. There has been persistent endeavour to evolve a product classification to accommodate the complex production processes of GVC using national trade statistics. Discussions to include GVC elements in the product classification were initiated since adoption of SITC Rev.1. In SITC Rev.3, some agreement was made to segregate products of the Parts and Components sector which was the single largest segment in the global trade of GVC. Therefore, GVC analysis can be pursued using secondary disaggregated data for the parts and component (P&C) sector.
The literature on GVC highlights that, parts and components form the essential part of the supply chain. Nearly 350 products at the 6-digit HS from capital goods and transport equipment and auto sectors form the part of GVC. They are spread over eight HS sections and sixteen HS chapters. Substantial trade takes place in sectors like machinery and mechanical appliances, auto sector and plastic products. Trade is thinly spread in other sectors within the broad GVC sector. This product classification provides a complete framework to analyse trade flows within the sector.
7.2 Trade Dependence of China on GVC sector
Trade in GVC forms an important component of China’s total trade and the volume of such trade is growing over time, but the trade prospect of this sector was seriously affected by the global economic recession. Imports of parts and components was 25.9 per cent of total imports and sectoral exports formed 16.8 per cent of exports in 2008. Between 2008 and 2009, overall trade declined more sharply than the parts and component sector and this happened both in the export and import sectors. However, during 2008-09, exports of parts and component declined (-15.3 per cent) more sharply than for imports (-7.3 per cent). There was recovery in 2010 with a significant increase in Chinese trade in parts and component with a growth rate of 33.9 percent per annum. Since then the sectoral trade increased with a declining rate and growth rate was reduced to 6.7 percent in 2012. However, sectoral exports growth remained higher than the growth of imports during the period 2010-12.
During the global boom (2004-07), export of parts and component sector was growing at the CAGR of 28.6 per cent whereas imports expanded at the CAGR of 20.6 per cent during 2004-07. Sectoral exports reached a level of US$ 240.7 billion and imports to US$ 292.2 billion in 2008. Since the onset of the global recession, sectoral exports declined to US$ 204.3 billion whereas imports declined to US$ 270.9 billion in 2009. The sectoral exports and imports showed significant increase to US$ 278.5 billion and US$ 357.9 billion respectively in 2010, showing the sign of recovery. Since 2011, sectoral trade increased with a declining rate due to resurgence of crisis. The sectoral export reached the level of US$349.7 billion and imports US$419.5 billion, posting a sectoral deficit of US$ 69.8 billion in 2012.
As global recovery is gradually gaining momentum with the partial recovery of the US economy (IMF, 2012b), the sector is likely to boom in the coming years.
7.3 China’s trade linkages with the European Union (EU) and the United States (U.S.)
Chinese trade in parts and components with the rest of the world stood at US$ 532.9 billion in 2008, but sectoral total receded to US$ 475.2 billion on account of the global meltdown in 2009. The sectoral trade deficit of the sector narrowed down in 2008 but exploded further in 2009, despite a fall in the sectoral imports.
The volume of sectoral trade with the US52 and the EU53 is very high. The US is the largest trading partner of China for both imports and exports of parts and components than any single country in the EU. In the total bilateral exports from China, the share of the parts and component sector was 13.1 per cent for the USA and 14.6 per cent for the EU in 2012 (see Table 7.1). The corresponding figures for Chinese bilateral imports from both destinations are much higher than export figures. In volume of bilateral trade, China is a net surplus country with respect to both the destinations. The US and the EU dominate Chinese imports of P&C products where they share 15.5 per cent and 21.8 per cent of the total respectively in 2012. During 2004-07, Chinese exports of P&C to these markets grew more rapidly than its imports of P&C products. Sectoral export to the EU and the US expanded at the CAGR of 34.3 per cent and 25.1 per cent respectively for the period 2004-07. During 2008-12, the Chinese bilateral imports from the EU grew more rapidly than exports in the P&C sector. However, in the same period, exports of P&C products to these markets has grown more than the imports, thereby becoming a net surplus country even during the period of ‘double-dip’ recession. During the period of global recession and crises, Chinese sectoral export was affected more adversely in the EU markets than in the US market. Major export sectors in this sector have been machinery and mechanical appliances and auto sector, and other important sectors have been plastics and cinematography products. Export patterns of China with these countries are similar to its overall export structure with the rest of the world.
Table 7.1: China’s Parts and Component Trade with the US and the European Union |
Destination |
Units |
2005 |
2007 |
2008 |
2010 |
2012 |
CAGR |
| |
|
|
|
|
|
|
2004-07 |
2008-12 |
China’s Imports from |
US |
US$ Billion |
11.2 |
16.1 |
17.9 |
19.8 |
19.9 |
18.3 |
3.3 |
EU |
US$ Billion |
18.9 |
29.4 |
34.9 |
40.7 |
46.3 |
15.4 |
7.3 |
| |
|
|
|
|
|
|
|
|
US |
Share (%) |
23.2 |
23.1 |
21.4 |
19.4 |
15.5 |
|
|
EU |
Share (%) |
25.6 |
26.6 |
26.3 |
24.2 |
21.8 |
|
|
China’s Exports to |
US |
US$ Billion |
19.8 |
29.8 |
31.9 |
36.9 |
46.3 |
25.1 |
9.7 |
EU |
US$ Billion |
19.5 |
35.7 |
46.4 |
57.2 |
48.7 |
34.3 |
1.2 |
| |
|
|
|
|
|
|
|
|
USA |
Share (%) |
12.2 |
12.8 |
12.6 |
13 |
13.1 |
|
|
EU |
Share (%) |
13.4 |
14.5 |
15.8 |
18.4 |
14.6 |
|
|
Source: RIS estimation based on Comtrade, online accessed on October 25, 2013, United Nations.
Note: Share refers to proportion of bilateral trade (exports/imports) in parts and components to total bilateral trade (exports/imports). |
Chinese imports from the US and the EU are dissimilar to her exports to these destinations. China’s imports of parts and components from those two destinations constitute 37.3 per cent (15.5 per cent from the US and 21.8 per cent from the EU) of her total sectoral imports from the rest of the world. However, 27.7 per cent of Chinese sectoral export is targeted to these markets in 2012.Therefore, a large part of her imports of parts and component was sourced from other destinations, including East and South East Asia54.
7.4 India’s Parts and Components Trade with China
The size of the parts and components trade of India is much smaller than China’s trade in the sector which was 14 times larger than that of India in 2012. India’s total sectoral export was US$ 3.2 billion in 2003 against US$ 18.7 billion imports in 2012. Trade in the parts and component sector grew slower than the overall trade sector of India for the periods 2003-07 and 2008-12. During the recent episode of recession, sectoral imports continued to grow faster than sectoral exports. In the pre-recession period (2003-07), sectoral imports grew marginally faster (30.4 per cent CAGR) than the sectoral exports (29.1 per cent CAGR), and sectoral deficit grew significantly on account of variations in levels of sectoral exports and imports.
Similar to China, the sectoral trade in India is concentrated in the two major sectors namely, machine & mechanical appliances and automobile sector as well as three other sectors including plastics, base metals and cinematography products in 2012. India exports a negligible proportion of its parts and components to China whereas one fifth of the sectoral exports was absorbed by the EU and the US markets in 2012. India’s sectoral export to China formed only 2.7 per cent of the total parts and component exports in 2012. The EU continues to be India’s top destination for exports and imports of parts and components. On the contrary, India imports over one-fifth of its sectoral requirements from China. Nearly 93 per cent of India’s imports in parts and components fell under the category of machinery & mechanical appliances and vehicles in 2012. India’s growing demand for efficiency seeking industrialisation has been the most important reason for such trade linkages with China.
The present pattern of India’s trade linkages with China in parts and components has been one-sided. While sectoral bilateral imports from China increased from US$ 0.7 billion in 2004 to US$ 9.95 billion in 2012, the corresponding bilateral export figures of India increased from US$ 0.1 billion in 2005 to US$ 0.5 billion in 2012. This has caused asymmetry in bilateral trade, and the sectoral deficit increased robustly during 2005-12. India has to improve its export profile in the sector to overcome its sectoral trade imbalances without compressing her sectoral imports. India’s trade potential in this sector and her competitiveness vis-à-vis other East and South East Asian countries can provide more insights into the bilateral trade relationship between India and China.
7.5 India’s Sectoral Export potential in China and Competition with ASEAN countries
India has bilateral export potential in the parts and component sector which grew moderately in the pre-recessionary phase but started shrinking during the recession. In 2008, India’s export potential in China was US$ 12.7 billion in the P&C sector which was rising at the CAGR of 51.8 per cent during the period 2004-07 (Table 7.2). With the surfacing of recession, the sectoral export potential of India grew moderately in 2008 in comparison with 2007 and the sector displayed a poor show in the following years. However, sectoral export reached the level of US$ 9.3 billion dollar in 2012, posting a negative CAGR of -7.5 per cent during 2008-12.
The bilateral trade potential of India in parts and components is spreading over a number of sectors, which are, however, not a homogeneous spread across sectors (see Table 7.2). Some of these sectors with a high concentration of India’s export potential are machinery, motor vehicles, electric machinery and precision instruments. These four sectors share more than 98 per cent of the total sectoral bilateral export potential of India in 2012. The export potential was growing moderately during the pre-recession period. However, export growth rates in various sub-categories ranged between 13.3 per cent and 64.6 per cent during 2004-07. Among various sub-groups, the size of exports potential was low in the chemical products, fibre & cloth, metal products etc., but these sectors registered positive growth during 2008-12. However, machinery, electric machinery, auto component and precision instruments are the key sectors that India could focus to have greater access in the Chinese market in the parts and component sector.
Table 7.2: India’s sectoral export potential in China: Parts and Components |
(Million US$) |
SECTOR |
2005 |
2007 |
2008 |
2010 |
2012 |
Share |
CAGR |
2007 |
2012 |
2004-07 |
2008-12 |
Chemical products |
13.8 |
22.8 |
27.4 |
34.3 |
43.8 |
0.2 |
0.5 |
22.7 |
12.4 |
Fibber and Cloths |
11.4 |
16.8 |
16.2 |
15.5 |
21.5 |
0.1 |
0.2 |
21.1 |
7.3 |
Metal Products |
58.1 |
84.5 |
79.1 |
31.6 |
111.6 |
0.7 |
1.2 |
22.4 |
9 |
Machinery |
1223.1 |
2186.3 |
2463.8 |
946.5 |
2640.8 |
18 |
28.3 |
38.2 |
1.7 |
Electrical Machinery |
2433.2 |
8949.4 |
9176.4 |
855.4 |
4849.5 |
73.7 |
52.1 |
64.6 |
-14.7 |
Motor Vehicles |
333.8 |
545.1 |
553.5 |
450.6 |
1122.8 |
4.5 |
12.1 |
13.3 |
19.3 |
Other Transport Equipment |
47.7 |
44.6 |
68.3 |
31.6 |
66.5 |
0.4 |
0.7 |
32.6 |
-0.7 |
Precision instruments |
203.3 |
284.5 |
325.4 |
104.9 |
448.1 |
2.3 |
4.8 |
19.3 |
8.3 |
Total |
4330.7 |
12140.5 |
12715.7 |
2473.2 |
9315.6 |
100 |
100 |
51.8 |
-7.5 |
Source: RIS estimation based on Comtrade, online accessed on October 25, 2013, United Nations.
Note: The sector classification is based on Lemoine and Ünal-Kesenci (2002). Estimation is made at 6-digit HS with bilateral time series data. |
China is heavily dependent on the imports of parts and component to support its export sector. In the process, several countries/regions are emerging as dominant suppliers to China. Most of the ASEAN countries are beneficiaries from this sector as exporters despite their weak competitive position in some product segments. This may be on account of China’s engagement with the ASEAN countries through several regional, bilateral and sectoral Agreements. In several lines of products in the sector, India can emerge as an efficient supplier to China. On the basis of relative competitiveness, India can access parts of their market share in China in the medium term.
In several product lines, some ASEAN countries are relatively uncompetitive with respect to India in the parts and component sector. Except a few less industrialised economies in ASEAN-10 including Laos, Cambodia and Brunei; India can replace some ASEAN countries in various product segments as an efficient supplier (see Table 7.3). In case India takes the place of some of the ASEAN countries as a supplier to China, the largest loser would be Thailand, followed by Malaysia, Singapore and the Philippines, among others in terms of volume of exports. Bilateral exports of most of the ASEAN-6 countries to China will be affected in most of the crucial sub-sectors of parts and components, but different sub-sectors will be affected differently. While the Philippines, Malaysia, Singapore and Thailand would be more affected in the electrical machinery sector; similar effects would be felt in Thailand and the Philippines in the machinery sector. Thailand and Malaysia would find a difference in precision instrument sector following India’s appearance in the export scene.
Table 7.3: India's Export more Competitive than ASEAN in China: Parts and Components in 2012 |
(Million US$) |
Sector |
BRN |
IDN |
KHM |
LAO |
MMR |
MYS |
PHL |
SGP |
THA |
VNM |
Chemical products |
0.0 |
0.74 |
0.0 |
0.0 |
0.0 |
0.50 |
0.00 |
0.05 |
1.47 |
0.02 |
Wood & paper products |
0.0 |
0.00 |
0.0 |
0.0 |
0.0 |
0.08 |
0.05 |
0.00 |
0.00 |
0.00 |
Fibber and Cloths |
0.0 |
0.11 |
0.0 |
0.0 |
0.0 |
0.40 |
0.01 |
0.18 |
0.20 |
0.19 |
Metallurgy Products |
0.0 |
0.00 |
0.0 |
0.0 |
0.0 |
0.00 |
0.00 |
0.13 |
0.00 |
0.00 |
Metal Products |
0.0 |
0.03 |
0.0 |
0.0 |
0.0 |
0.15 |
0.07 |
0.90 |
0.28 |
0.09 |
Machinery |
0.0 |
13.03 |
0.0 |
0.0 |
0.0 |
31.22 |
87.36 |
44.05 |
99.44 |
14.11 |
Electrical Machinery |
0.0 |
15.39 |
0.0 |
0.0 |
0.1 |
150.32 |
91.50 |
57.95 |
61.44 |
27.96 |
Motor Vehicles |
0.0 |
7.69 |
0.0 |
0.0 |
0.0 |
5.72 |
0.78 |
6.25 |
4.45 |
1.28 |
Other Transport Equip. |
0.0 |
0.00 |
0.0 |
0.0 |
0.0 |
0.00 |
0.19 |
0.78 |
0.00 |
0.00 |
Precision instruments |
0.0 |
0.57 |
0.0 |
0.0 |
0.0 |
5.04 |
3.37 |
3.59 |
17.95 |
0.68 |
Total |
0.0 |
37.55 |
0.0 |
0.0 |
0.1 |
193.42 |
183.32 |
113.88 |
185.23 |
44.34 |
Source: RIS estimation based on Comtrade, online [Accessed on October 25, 2013, United Nations]
Note: The sector classification is based on Lemoine and Ünal-Kesenci (2002). Estimation is made at 6-digit HS with bilateral time series data. |
India has global competitiveness in number of products in the parts and component sector in the Chinese market. India is yet to seize the opportunities existing in China whereas other countries have used their special trade arrangements to gain market access in China without being competitive. With new initiatives, if such trade distortions are effectively addressed, India can have large market access in China in the parts and component sector and can also effectively address its current bilateral trade deficit in the medium term.
8. Implications of Yuan Appreciation on Export Prospects of India in the Third Country Markets
Before the recent global financial crisis emerged, international debate was focused on the undervaluation of the renminbi. This currency policy has enabled China to remain the largest exporting economy of the world with a huge current account surplus, and at the same time has contributed to the global imbalances (Iley and Lewis, 2011). According to various studies, Yuan is substantially undervalued over a period (Goldstein and Lardy, 2008; Yu 2010; IMF, 2011) and the level of currency depreciation ranged somewhere between 0 to 50 per cent (Hoggarth and Tong, 2007). However, the renminbi registered modest currency appreciation in 2010 along with several other currencies in Asia (IMF, 2011b). The impact of China’s policy was so great that it was identified as a major source of global imbalances (Yu, 2007; Bagnai, 2009). Moreover, the exchange rate misalignment has had a lasting impact on its exports competitiveness and explains trade surpluses. China being a major production hub in the Asian production network, the effects of renminbi appreciation may spill from the domestic economy to the neighbouring countries in East Asia and other regions of Asia. As India and China gain prominence55 in the changed global trade scenario, it is imperative to assess the possible effects of renminbi appreciation on the rupee as well as on the exports of India to rest of the world in the presence of competition from China.
8.1. Emerging Issues
India has been exporting a host of products to different parts of the world which is also the case with China. Over the years, several important markets are common to both countries, and are also becoming shared ground for competition to gain market access in several lines of production. Although both the countries form part of the Middle Income Countries (MIC) group, production conditions are different, leading to a significant cost difference between them in several products/sectors. Considering these structural differences, the level of competition is expected to be dissimilar in a number of markets, depending on the nature of competition and structure of products exported from both countries to these markets. It is evident from the literature that the competition of China with developed countries is different from those of developing countries including India (Eichengreen, Rhee and Tong, 2006). Therefore, Chinese competition is relatively robust with India, and the level of competition varies across product segments56. Moreover, export competition between both the countries in their major markets is changing over a period. Although export competition is taking place in primary, intermediate and the final goods sectors, the nature of competition differs significantly in further specific sub-sectors. Within a sector, product specialisation is moving towards high-end products. In the process, the level of competition is becoming slender in certain sectors and robust in others. In this context, the impact of upward adjustment of the renminbi may have a certain impact on India’s export prospects in the third country trade57, but all this is relative to the magnitude of the revaluation of the renminbi. India’s exports to the third world market in various sectors are likely to be affected differently in the event of appreciation of the renminbi, depending upon the elasticities of these export sectors and the strength of Chinese competition in these markets. In a recent paper, Arunachalaramanam and Golait (2011) analysed the impact renminbi appreciation on external sector of India. This section examines the implication of revaluation of the renminbi on export prospects of India in specific sectors in third markets, which are important to both India and China. This section shows evidence of heterogeneous long-run relationship between India’s bilateral flow of sectoral exports with trade structure of its major destinations and revaluation of Chinese renminbi.
8.2 Literature Review
Assuming a significant third country effect, Hoggarth and Tong (2007) find that the positive effects of renminbi appreciation may not be that large. While its impact is expected to be weak on countries exporting consumer goods, it may have negative effects on countries supplying capital and intermediate goods.
Wei et al. (2000) examined the impact of a devaluation of the renminbi on the external sector of Hong Kong. The results show that the impact of currency devaluation would be negligible for Hong Kong’s foreign exchange reserve. There are some attempts to examine the extent of undervaluation in the renminbi.
Prasad (2009) argues that China has been pursuing protectionist policies by continuing with substantial undervaluation of exchange rate to maintain its competitive advantage in the international market. Recent Chinese monetary policies allowed the renminbi to appreciate since July 2005, but undervaluation in the currency remain until 2009. Undervaluation was weak in the first quarter of 2009, and this had an adverse impact on Chinese economy in the form of a sharp fall in the foreign exchange reserves, slowing down of capital inflows, and a declining trade surplus.
According to Tung and Baker (2004),the exchange rate regime in China is de-facto pegged to US dollar since the devaluation of RMB in 1994. Over a period, RMB is overvalued vis-à-vis US dollars and several other currencies globally. In the presence of deliberate policy of keeping RMB undervalued, it is argued in the paper that a one-time ‘maxi revaluation’ of around 15 per cent versus the US dollar could facilitate China to move towards a more flexible exchange rate regime. In another study, Dunaway and Li (2005) estimated the extent of undervaluation in the renminbi, ranging between 0 and 50 per cent.
Using quarterly trade data for the period 2000-10, Arunachalaramanam and Golait (2011) analysed the impact of appreciation of the renminbi on India’s bilateral trade with China. The study estimated both bilateral export and import functions using least square and VECM models. Results show that the relative appreciation of the RMB with respect to rupee has a positive impact in favour of India in improving its market access in China and arresting its bilateral imports significantly. Moreover, bilateral exchange rate elasticity of imports was higher than exports, which is causing persistence of India’s bilateral trade deficit over a period.
To sum up, the exchange rate regime in China has evolved in a manner so as to support its external sectors to grow. Accumulated over the years, the renminbi has been kept undervalued in the range of 15-50 per cent vis-à-vis the US dollars and hence with many currencies in the world including the Indian rupee. There is global pressure for the revaluation of the RMB and China has initiated some measures in this direction. The implication of a one-time discrete devaluation is expected from the Chinese monetary authority. The implication of such an initiative could be a step forward in improving the export prospects of major trading partners of China, though some feel the impact could be mixed. While some countries expect to benefit from the RMB’s appreciation in terms of gaining market access in China and third countries, others paint a pessimistic scenario. India is expected to benefit from an appreciation of the renminbi in terms of improving its bilateral market access in China and also restraining the present level of unsustainable bilateral imports. The manner in which India would respond to improve its export profile in other major export destinations as a consequence of a revaluation of the Chinese renminbi, is an empirical question that needs to be addressed.
8.3. Empirical Model
Trade flows between countries are determined by a host of domestic as well as external factors. The bilateral exchange rate between the trading nation and its partners often serves as a proxy for the relative price of domestic goods in foreign markets. Barring the individual effect of changes in home currency, movements in the competitors’ currencies do exert significant impact on the exports of a trading nation. In many important markets, India and China are significant suppliers and movements in their real exchange rates have an important bearing on their trade flows to third countries. After the recent global economic crisis, the undervaluation of Chinese renminbi, has emerged as the single most contentious issue in the global trading arena over the past few years as discussed in the earlier section. For India, China is not only a major competitor in the Asian region but also in many of its major trade destinations. China has a strong export presence in many sectors where India is an important supplier. Chinese exports, supported by its aggressive export financing approach along with scores of other incentives to importer, have been detrimental to India’s presence in these markets. Both countries are suppliers to these destinations in many sectors. Often the size of Chinese market share in specific product segments in these destinations matters for India in its active engagement in export. In this context, the expected gains for India in exports resulting from a revaluation of the renminbi may be significant. The equation for India’s bilateral exports to third countries is:
Exports from India = ƒ (demand of importers, movement in renminbi, Chinese
exports, structure of Indian exports) ………...………… (3)
The underlying argument for export gains to India from yuan appreciation lies in the fact that currency appreciation deteriorates China’s export competitiveness and thereby creates opportunities for its competitors like India to export more. Whether this applies to all commodities or not depends on the commodity structure of India’s exports. In order to account for the asymmetric effect of trade sectors to renminbi revaluation the model considers an interaction term involving both bilateral sectoral exports and structure of India’s exports. We consider the revaluation effects of the yuan on India’s exports may be different in various sectors. Factoring in these dynamisms in the model, we have the following export function:
ln Indijt = ƒ (ln GDPjt, ln Chnijt, ln REERchn,t, ln POPjt, ln Impjt, Zindijt) ……………. (4)
Where Indxijt denotes India’s exports from i-th trade sector to j-th trade partner,
GDPjt denotes GDP of the partner country,
POPjt denotes population of partner countries,
Impjt denotes imports of partner countries,
REERchnt denotes real exchange rate of China,
Chnxijt denotes China’s exports from i-th trade sector to j-th trade partner,
Zindit denotes interactive variable of India’s sectoral structure of exports with India’s bilateral sectoral exports to j-th trade partner, and ‘t’ stands for time (year).
As discussed earlier, equation (4) represents India’s sectoral export function with its major exports destinations. India’s substantial exports are segregated into five broad sectors. For each sector, we will be having a separate Equation (4). Therefore, in this analysis, variants of five different export sectors are considered in the framework of a panel cointegration model.
For empirical estimation of equation (4), several econometric techniques could be considered. These include single-equation standard pooled OLS, LSDV, panel fixed and random effects, dynamic models like Arellano and Bond (1991), generalised method of moments (GMM), and system GMM estimators. Most of these are stationary models with variables in first differences accounting for endogeneity and correction for serial correlation in residuals. With increasing application of time series techniques like VAR and cointegration in panel data, traditional panel data models are not used extensively in the current literature.
Panel cointegration-based estimation procedures are used in contemporary empirical research. In this context, other sets of models including Pedroni (1999), Pedroni (2004), Kao (1999), Maddala and Wu (1999), etc among others, are used to estimate the panel cointegration test. In this framework, the long-run cointegrating equations are estimated using OLS (Montalvo, 1995), canonical cointegration regression estimator (Park, 1992), fully-modified OLS (FMOLS) (Phillips and Hansen, 1990; Pedroni, 2000), and dynamic OLS estimators (Stock and Watson, 1993; Kao and Chiang, 2000). Based on the practice and utility of these models in the field of international trade, we consider the panel cointegration approach to estimate equation (4).
The exogenous variables used in this study are four, and three control variables (GDP, population and imports of partner countries) are tried alternatively in the models for different sectors. Improvement in income in foreign markets raise their purchasing power, and therefore the sign of the foreign demand coefficient in the export equation (4) is expected to be positive. Besides GDP, we are trying with the alternative control variable like population and import of partner countries in the equation and the signs are expected to be similar to GDP. Similarly, a positive relationship is assumed to hold for yuan in the export model. Given the possibility of the contemporaneous relationship between Indian exports and Chinese exports, the inclusion of Chinese exports in the export equation seem theoretically plausible. Since its empirical behaviour is unknown the sign of Chinese exports is ambiguous in the equation. India’s bilateral exports to third countries is expected to rise in certain sectors with an appreciation of Chinese renminbi because Chinese exports would be more expensive to India’s competing product. If India’s bilateral export rises in its export destinations, the sign of the interactive variable will be positive.
8.3.1. Data and Variable Definitions
The panel cointegration model has been estimated to test the possible impact of renminbi revaluation on India’s exports in third markets. The bilateral export equation aims to capture the effects on India’s exports across five sectors. Each Sector is represented by a separate panel. The joint effect of renminbi revaluation and the associated shift in global demand are captured in a multi-country export equation. Each panel data58 for the empirical exercise covers 25 countries and 7 years from 2003 to 2010.
We have identified the most important trade destinations for both India and China separately employing bilateral trade flows using the Direction of Trade Statistics online database, IMF. Taking top ranking countries from both lists, 25 most important countries are for the panel (see Appendix IV). Among the top 25 countries, 7 countries are from the European Union, 5 from other developed countries, 8 from developing Asia, 2 from the Middle-East, and 3 are from the Emerging economies. These 25 countries are represented in different panels used for the cointegration analysis.
Disaggregated time series trade data is taken from the UN-Comtrade at 6-digit HS with the nomenclature of HS 2002. The UN Statistical Division developed the Broad Economic Categories (BEC)59 which is consistent with the NAS and presented a correspondence table between BEC and Harmonised System. Under the broad framework of the BEC, trade data is grouped into three categories namely primary, intermediate and final goods, and latter two categories are again subdivided into two sub-groups each using concordance table. Therefore, substantial trade data is segregated into five groups namely primary, semi-finished, parts and components, consumption and capital goods. As UN-Comtrade provides time series bilateral trade flows (exports and imports separately) data, new bilateral trade series are constructed for each destination and for all the five categories. Such trade series are formed for India and China separately to prepare sector-specific panels.
The variables considered in the model are widely used in the empirical literature on exchange rate effects on exports. By using quarterly data for China for the period 1996-2009, Ahmad (2009) finds that real exchange rate appreciations have contemporaneous and lagged effects on real export growth. Foreign consumption representing economic activity in top ten trade destinations has a positive effect on Chinese exports. Estimating a dynamic OLS model, Thorbecke (2011) establishes a strong causality among exchange rate, foreign income and exports. The study observes that a generalised appreciation in both China and East Asia produces a large drop in processed exports. Foreign income is positively related to export of processed goods from these economies. Likewise, Yu (2009) observes a dampening effect of renminbi revaluation on Chinese exports to the United States. Garcia-Herrero and Koivu (2009) find that real appreciation of the renminbi not only affects processed exports but also ordinary exports of China in the long-run. A similar effect holds for imports to China also. Unlike other studies, this study observes a positive but weak effect of foreign demand on Chinese exports. These papers provide the rationale for including Chinese REER and foreign demand as explanatory variables for the export equation.
The variable definitions are given below. All variables except ‘z’ and ‘zind_sector’ are expressed in natural logarithms.
logind_sector:- Sectoral exports from India to country ‘j’ in US billion dollars. ‘Sector’ includes ‘cap’ (capital goods), ‘cons’ (consumer goods), ‘pc’ (parts and components), ‘pri’ (primary goods) and ‘semi’ (semi-finished goods). Bilateral trade data is taken from UN-Comtrade.
logreer: Real effective exchange rate of China (2005 =100). REER of China is obtained from International Financial Statistics, IMF.
logmpart: Imports of partner country ‘j’ from the world in US billion dollars. Global imports for India’s major trade destinations are drawn from Direction of Trade Statistics, IMF.
loggdpusd: Gross domestic product of partner country ‘j’ in US billion dollars. GDP of individual countries in the panel is taken from World Economic Outlook, April 2011.
logpop: Population of partner country ‘j’ in millions. Population of partner countries are drawn from World Economic Outlook, April 2011.
logchn_sector: Sectoral exports of China to country ‘j’ in US billion dollars. ‘Sector’ includes ‘cap’ (capital goods), ‘cons’ (consumer goods), ‘pc’ (parts and components), ‘pri’ (primary goods) and ‘semi’ (semi-finished goods).
z: Commodity structure of India’s exports measured as the ratio of sectoral exports to country ‘j’ to its total exports to country ‘j’.
zind_sector: Interaction term between ‘z’ and ‘ind_sector’, and ‘ind_sector’ represents India’s sectoral exports to country ‘j’ where j =1,2,3,………,25
The estimation procedure in the study is carried out in three steps. We apply the panel unit root tests in order to find the stationary of the variables in the panel. The second step in our analysis is to test whether the variables are cointegrated, as presented in equation (4). In the last step, the panel cointegration test is applied to show the existence of a long-run relationship between India’s bilateral exports to third countries in the event of an appreciation of the Chinese renminbi.
8.4. Empirical Results
Considering the implications of the renminbi’s appreciation on various segments of the world economy, we have taken up the issues that concern India’s bilateral exports in the third markets. This is examined using panel data.
India’s bilateral exports in the third county on account of revaluation of the yuan are examined in five sectors. Sectoral effects on bilateral exports are presented by alternative model specifications through controlled variables.
8.4.1. Panel Unit Root Test
Macro-economic variables do exhibit time-varying features and follow different autoregressive structure. Following the standard econometric procedures, the two panel unit root tests such as Levin, Lin and Chu (LLC) (2002) and Fisher-ADF by Maddala and Wu (1999) and Choi (2001) are employed to determine the order of integration in the model variables. These two tests represent two different dimensions in the family of unit root testing procedures. While LLC assumes constant variance across panels, the Fisher-ADF test relaxes this assumption and accounts for panel-specific heterogeneity in the cross-section units.
Typically, the data generating process for AR(1) variables is explained by the following model:


Table 8.1: Panel Unit Root Test Results |
Variable |
LLC without Intercept |
Fisher-ADF without Intercept |
Level |
1st Difference |
Level |
1st Difference |
Statistic |
P-Value |
Statistic |
P-Value |
Statistic |
P-Value |
Statistic |
P-Value |
(1) |
(2) |
(3) |
(4) |
(5) |
(6) |
(7) |
(8) |
(9) |
logindcap |
9.02 |
1.00 |
-7.54 |
0.00 |
3.01 |
1.00 |
112.89 |
0.00 |
logindcons |
8.04 |
1.00 |
-6.67 |
0.00 |
9.60 |
1.00 |
116.10 |
0.00 |
logindpc |
7.00 |
1.00 |
-7.03 |
0.00 |
20.86 |
0.99 |
107.17 |
0.00 |
logindpri |
4.54 |
1.00 |
-10.82 |
0.00 |
14.5 |
1.00 |
171.47 |
0.00 |
logindsemi |
8.51 |
1.00 |
-7.28 |
0.00 |
11.78 |
1.00 |
108.28 |
0.00 |
loggdpusd |
-1.35. |
0.10 |
.. |
.. |
41.74 |
0.79 |
90.15 |
0.00 |
loggdpppp |
2.96 |
1.00 |
-4.30 |
0.00 |
127.63 |
0.00 |
.. |
.. |
logimpt |
4.41 |
1.00 |
-6.67 |
0.00 |
16.84 |
1.00 |
91.05 |
0.00 |
logreer |
7.69 |
1.00 |
-4.51 |
0.00 |
2.94 |
1.00 |
59.61 |
0.16 |
logchncap |
0.27 |
0.61 |
-8.13 |
0.00 |
45.95 |
0.64 |
118.86 |
0.00 |
logchncons |
19.89 |
1.00 |
-2.26 |
0.01 |
11.61 |
1.00 |
88.24 |
0.00 |
logchnpc |
2.86 |
1.00 |
-7.35 |
0.00 |
32.34 |
0.98 |
103.96 |
0.00 |
logchnpri |
3.16 |
1.00 |
-20.14 |
0.00 |
23.07 |
0.99 |
187.29 |
0.00 |
logchnsemi |
1.59 |
1.00 |
-6.30 |
0.00 |
47.96 |
0.55 |
85.54 |
0.00 |
zindcap |
3.35 |
0.99 |
-8.75 |
0.00 |
15.49 |
1.00 |
143.15 |
0.00 |
zindcons |
-0.85 |
0.20 |
-10.39 |
0.00 |
75.86 |
0.01 |
.. |
.. |
zindpc |
0.33 |
0.63 |
-12.32 |
0.00 |
37.58 |
0.90 |
173.09 |
0.00 |
zindpri |
-3.17 |
0.00 |
.. |
.. |
62.70 |
0.11 |
191.86 |
0.00 |
zindsemi* |
-1.30 |
0.79 |
-2.21 |
0.02 |
42.87 |
0.75 |
77.95 |
0.01 |
Note: Lag selection through automatic selection by Schwarz Info Criterion (SIC).
‘*’ Im-Pesaran-Shin (IPS) t-bar statistic with individual intercept. LLC test refers to Levin, Lin, and Chu (2002)test. Fisher-ADF test was developed by Maddala and Wu (1999). |
From the results presented in Table 8.1, it is evident that all the variables are non-stationary in levels I(0) and stationary in first differences I(1). Both the tests confirm the same order of integration in the model variables. As most integrated variables show contemporaneous relations, the test for cointegration in the panel units is likely.
8.4.2. Cointegration Test
This section proceeds to test the bilateral exports of India and other exogenous variables including GDP of partners, REER of China, bilateral Chinese exports and export structure of India for cointegration to determine if there is a long-run relationship in the econometric specification. The likelihood of cointegration is higher for these series. Accordingly, the Kao (1999) residual-based test is considered for determining the presence of cointegration among the model variables. Kao (1999) derives a test for cointegration by examining the LSDV estimator from a spurious regression model that contains non-stationary variables.
The estimated equation for the cointegration test is given by:
The results of the cointegration test are presented in Table 8.2. As observed, the null hypothesis of no cointegration is rejected at the 1 per cent significance level for all the five sectors, for example, capital goods, consumer goods, parts and components, primary goods and semi-finished goods.
Table 8.2: Kao (1999) Residual Cointegration Test |
[ logindxijt = f (loggdpjt, logreerchnt, logchnxijt, zindit)]
(i = trade sectors; j = trade partners; t = year) |
Sector |
t-Statistic |
Prob. |
(1) |
(2) |
(3) |
Capital Goods |
-4.18 |
0.00 |
Consumer Goods |
-6.22 |
0.00 |
Parts and Components |
-7.26 |
0.00 |
Primary Goods |
-5.69 |
0.00 |
Semi-finished Goods |
-7.86 |
0.00 |
Note: Null Hypothesis under the Kao (1999)test is no cointegration. |
As mentioned above, the long-run parameters of a panel cointegrating equation are usually estimated by Fully-modified ordinary least squares (FMOLS), dynamic ordinary least squares (DOLS), Pooled Mean Group (PMG) estimators, generalised method of moments (GMM) and system GMM. As OLS and FMOLS suffer from the problem of small sample bias, the DOLS have an edge over other estimators.60 Kao and Chiang (2000) show that both the estimators yield biased estimates in homogenous as well as heterogeneous panels. In the case of homogeneous panels, OLS is biased in the presence of negative serial correlation and endogeneity parameters whereas FMOLS is biased when both the parameters are positive. This suggests the suitability of the dynamic OLS model in panel data involving cointegrating variables. From a comparative analysis, Montalvo (1995) observes that the DOLS estimator61 has a relatively smaller bias and root mean squared error than the canonical correlation regression estimator (CCR). This prompts us to consider the Kao and Chiang (2000) DOLS model for estimating the cointegrating equations.
8.4.3 Long-Run Estimates of Cointegrating Equation
The DOLS model is estimated with exports of India as the dependent variable and GDP, Chinese exchange rate, Chinese exports and the interaction term between commodities structure of India’s exports and Chinese exchange rate as the independent variables. Alternate models with another sets of control variables such as GDP, population and import of partner countries to demand conditions in these countries are looked at. The major findings of the empirical exercise are summed up (in Table 8.3).
Most variables of the export equation have expected signs and significant coefficients. As hypothesised, the Chinese REER is found elastic and highly significant at the 1 per cent level of significance for all the five sectoral equations implying a positive impact of renminbi revaluation on India’s exports. However, the elasticity values of the Chinese REER differ across the trade sectors, indicating differential impacts are likely to be felt following an appreciation of the renminbi.
The effect of renminbi revaluation seems to be stronger for capital goods and primary goods. The estimated REER coefficients for these two sectors are relatively higher compared to the other sectors. For consumer and semi-finished goods, the exchange rate effect on exports is large whereas it is substantially low for the parts and components segment.
Even though the overall positive effects hold good for all trade sectors, the impact of renminbi appreciation may vary with respect to the structure of the country’s export basket. The significant coefficients of the interaction term between sectoral share of exports and Chinese REER confirm this observation. It suggests that sectoral exports from India may increase when sectoral shares rise along with renminbi revaluation. In other words, trade sectors having higher share in exports to a particular country may export more in an event of renminbi appreciation.
Like the individual effect of renminbi on Indian exports, the joint effects of sectoral share and exchange rate diverge from sector to sector depending on the estimated values of the interaction coefficient. The findings show that sectoral export gain is sufficiently large for primary goods, capital goods, and parts and components. In contrast to the sole effect of renminbi revaluation, the exchange rate effect is found to be sizeable for the parts and components sector. This indicates that any rise in exports of parts and components from India in view of yuan appreciation may induce a large increase in exports of this sector in relation to other sectors. On the other hand, the interaction effect is seemingly weak for the semi-finished goods sector. In terms of absolute value, the interaction term shows inelastic response to yuan revaluation.
Table 8.3: Dynamic OLS Estimates of Cointegrating Regressions |
[logindxijt = f (loggdpjt, logreerchnt, logchnxijt, zindit)]
(i = trade sectors; j = trade partners; t = year) |
Variables |
Capital Goods |
Consumer Goods |
Parts and Components |
Primary Goods |
Semi-finished Goods |
(1) |
(2) |
(3) |
(4) |
(5) |
(6) |
(7) |
(8) |
(9) |
(10) |
(11) |
(12) |
(13) |
(14) |
(15) |
(16) |
Dependent Variable |
logindcap |
Logindcons |
logindpc |
logindpri |
Logindsemi |
Independent Variables |
loggdpusd |
0.16 |
.. |
.. |
-0.23 |
.. |
.. |
0.14 |
.. |
.. |
-0.04 |
.. |
.. |
-0.12 |
.. |
.. |
logpop |
.. |
0.10 |
.. |
.. |
-0.08 |
.. |
.. |
.. |
0.03 |
.. |
.. |
-0.15 |
.. |
-0.06 |
.. |
logimpt |
.. |
.. |
0.17 |
.. |
.. |
0.02 |
.. |
0.41*** |
.. |
.. |
0.27*** |
.. |
.. |
.. |
0.07 |
logreer |
11.84*** |
10.46*** |
10.59*** |
7.31*** |
3.96*** |
3.69*** |
1.94*** |
2.65*** |
2.73*** |
10.17*** |
10.47*** |
6.59*** |
6.48*** |
7.20*** |
5.29*** |
logchncap |
0.08 |
0.28*** |
0.09 |
.. |
.. |
.. |
.. |
.. |
.. |
.. |
.. |
.. |
.. |
.. |
.. |
logchncons |
.. |
.. |
.. |
0.36*** |
0.29*** |
0.21** |
.. |
.. |
.. |
.. |
.. |
.. |
.. |
.. |
.. |
logchnpc |
.. |
.. |
.. |
.. |
.. |
.. |
0.07 |
-0.09 |
0.22*** |
.. |
.. |
.. |
.. |
.. |
.. |
logchnpri |
.. |
.. |
.. |
.. |
.. |
.. |
.. |
.. |
.. |
0.17** |
0.03 |
0.22*** |
.. |
.. |
.. |
logchnsemi |
.. |
.. |
.. |
.. |
.. |
.. |
.. |
.. |
.. |
.. |
.. |
.. |
0.54*** |
0.56*** |
0.37*** |
zindcap |
11.13*** |
8.94*** |
10.3*** |
.. |
.. |
.. |
.. |
.. |
.. |
.. |
.. |
.. |
.. |
.. |
.. |
zindcons |
.. |
.. |
.. |
4.86*** |
4.47*** |
4.36*** |
|
.. |
.. |
.. |
.. |
.. |
.. |
.. |
.. |
zindpc |
.. |
.. |
.. |
.. |
.. |
.. |
10.37*** |
9.17*** |
11.38*** |
.. |
.. |
.. |
.. |
.. |
.. |
zindpri |
.. |
.. |
.. |
.. |
.. |
.. |
.. |
.. |
.. |
9.68*** |
12.61*** |
11.39*** |
.. |
.. |
.. |
zindsemi |
|
.. |
.. |
.. |
.. |
.. |
.. |
.. |
.. |
.. |
.. |
.. |
0.72** |
0.89** |
1.46*** |
Wald Chi2 |
1128.3*** |
902.6*** |
1178.1*** |
689.5*** |
305.9*** |
283.8*** |
265.4*** |
383.4*** |
449.01*** |
576.8*** |
934.3*** |
265.5*** |
977.9*** |
1228.01*** |
742.4*** |
N |
175 |
175 |
175 |
175 |
175 |
175 |
175 |
175 |
175 |
175 |
175 |
175 |
175 |
175 |
175 |
Note : ‘***’ and ‘**’ denote level of significance at 1 per cent and 5 per cent respectively. The estimation is based on the Kao and Chiang (2000) model. While estimating, we have taken one lead and one lag in the model |
Three alternative indicators namely GDP, imports, represent the size of the economy and population has least effect on export prospects of India except two sectors. Import of partner countries is found as a significant predictor of India’s exports in the parts and components sectors. For all other sectors, the measures of economic activity are insignificant and inelastic. Inclusion of alternative proxies for size of the economy does not alter the basic results of the estimated model.
Conforming to our hypothesis, it is observed that India’s exports to third country markets rise when Chinese exports to those countries increase. For three trade sectors, for example, consumer goods, primary goods and semi-finished goods, the coefficients of Chinese exports are significant and inelastic showing a weak degree of pro-cyclicality in India’s exports with Chinese exports. This finding in conjunction with exchange rate effects reveals a favourable effect of renminbi revaluation on India’s exports to the rest of the world. In view of mild pro-cyclicality, the strong positive association between Chinese REER and India’s exports suggest a rise in exports from India in event of renminbi revaluation.
To sum up, examination of the empirical results above is indicative of the fact that renminbi appreciation/depreciation has significant effects on India’s exports to other countries. This is consistent with our prior assumption that renminbi appreciation erodes China’s competitiveness thereby raising export prospects for India. Contrary to our expectations, the control variables such as GDP, population and imports do not explain exports from India to the third countries. As the literature highlights the discriminating impact of currency revaluation on exports, various export sectors of India are likely to experience a different impact of the renminbi revaluation in the third markets.
9. Approach towards Regional Trading Arrangements
India’s ‘Look East’ policy in the early 1990s and consolidation of the ASEAN process have helped India in integrating itself with the global economy. With close engagement with the East and South East Asian economies, India’s trade become ‘Asia Centric’.62 Various studies indicate that India’s long-term trade interest is in Asia, particularly with the ASEAN.63 During the last three decades, the ASEAN region is passing through a phase of significant restructuring. The economic caucus enlarged to the ASEAN+3 and to the ASEAN+4 and further to the East Asian Summit (EAS).64 For initiating deeper integration in the region, there are two alternative competing processes under consideration (ASEAN+3 or EAS). India considers that her long-term economic interest could be with the EAS process.
China is a late starter in pursuing the policy of regionalism, but it has taken active interest in bolstering regional integration in Asia. However, China has entered into consultation and cooperation arrangements with both developed and developing countries, though the depth of cooperation varies from one group to another. China has signed Comprehensive Economic Partnership Agreements (CEPAs) with Hong Kong and Macao, under which China fully eliminated tariffs on imports originating from Hong Kong and Macao in 2006. China has signed an Early Harvest Agreement under the bilateral FTA with Pakistan and tariff liberalisation is scheduled to be implemented in 2008. With India, a feasibility study on a bilateral RTA was concluded in 2004. China acceded to the Bangkok Agreement in 2001 and under the Agreement, in 2005, 749 tariff lines carry rates that are lower than the MFN rates.
At the regional level, Chinese engagement with ASEAN has been deepening over the years. China entered into a Framework Agreement on Comprehensive Economic Cooperation with ASEAN in November 2002. Under the Agreement, both parties agreed to negotiate for the establishment of an ASEAN-China Free Trade Area (ACFTA) within ten years by eliminating tariff and non-tariff barriers on goods and services. In the meantime, each of the ten ASEAN countries recognises China as a market economy. At the ASEAN Summit in January 2007 in Cebu, China attracted attention with a new Agreement signed on Trade in Services with ASEAN covering high-tech services, energy and construction. Under the ASEAN+3 framework (APT), China has been interacting with ASEAN, Japan and South Korea since 1997. It participates in the Chiang Mai Initiative (CMI) which represents a web of bilateral swap arrangements between APT countries. Estrada et al (2013) found that China is expected to gain from all three bilateral FTAs (i.e., ASEAN, Korea and Japan) in terms of output and welfare gains.
China participated in the East Asia Summit (EAS) launched in Kuala Lumpur in December 2005. China was keen to keep the participation in EAS limited to APT members only. It had also suggested that EAS members be divided into “core” (ASEAN+3) and “secondary” (India, Australia and New Zealand) groups. In the ongoing discussion to launch a broader arrangement for regional economic integration, the Chinese policy has been towards a preference for APT as a forum rather than more inclusive EAS thus keeping India out of the emerging regional architecture.
India is supportive of the idea of full participation of all Member countries in the EAS process, so that inclusion of India is secured and this initiative is supported by Japan and other like-minded Members of ASEAN. China’s position is to limit the participation of East Asian engagement to ASEAN+3, and this position is supported by some Members of ASEAN countries. In the entire debate, the core issue has been centered around inclusion of India in the mainstream economic activities of ASEAN.
Under the processes of ASEAN+3 and EAS, ASEAN is in the driver’s seat. ASEAN has to take a view regarding the future architecture of the regional forum taking into account its long-term interest. The effect of India’s inclusion in the ASEAN process is an important issue for policy making. In a recent study, the implication of India’s65 inclusion in the ASEAN+3 process and gains from individual countries in the regional forum is empirically examined in a Computable General Equilibrium (CGE) framework. The results show that regional countries are likely to gain substantially with the inclusion of India in the regional forum. For enhancing gains for the individual member countries of the region, the economic engagement should be more comprehensive with liberalisation in order to cover broad sectors such as trade, investment and service.
9.1 Regional Interest of China and India in EAS: In a CGE Framework
As discussed earlier, India’s long-term interest will be in its association with the EAS process66. The ASEAN+3 process is getting wider acceptability within the region with the recent changes in the political regime in Japan, but the EAS process is also active in the regional forum. A firm decision in this regard is still under consideration. The present exercise is to focus on the advantages of the EAS over the ASEAN+3 in meeting the aspirations of peoples of the region and the specific advantage of India from the process by using a CGE model.67
9.1.1 Model Specification
In this regard two issues need attention in order to take a view on the future architecture of EAS. These are as follows: (a) What could be the ideal process in EAS (i.e. ASEAN+3, ASEAN+4 or ASEAN+6) which can maximise the economic interest of the ASEAN Member countries; and (b) What should be the sectoral coverage of economic liberalisation to make the EAS an effective regional trading arrangement.
It is apparent from the recent spate of activities that the EAS is to be reconstituted keeping the ASEAN in the driver’s seat. ASEAN’s view is an authoritative one in the shaping of the architectural structure of the new caucus.
Taking into account the economic interest of the regional grouping, a CGE model is carried out in this Section. In the broad architecture of the EAS, there could be three sets of counties which could be considered as the ‘core’ group of the EAS (i.e., ASEAN+3, ASEAN+4 and EAS or ASEAN+6). Another issue concerns the scheme of sectoral liberalisation, ranging from trade to a more comprehensive form of liberalisation. In the economic literature, various schemes of economic liberalisation are discussed including trade, ‘Singapore issues’ and services, among others. As most of the Member states of ASEAN are in favour of comprehensive economic cooperation (CEC), we have taken most elements of CEC in the model. We have taken tariff liberalisation to cover trade; investment for covering ‘Singapore Issues’, and ‘movement of natural persons’ to represent services.
In the CGE modelling literature, discussion often refers to an underlying assumption relating to the structure of the economies (i.e. modelling with perfect competition or monopolistic competitions). Assumption of monopolistic competition is mostly preferred to perfect competition in the CGE modelling framework. In this case, a monopolistic68 version of the multi-regional CGE model is used in the present simulation analysis to estimate the welfare implications of the EAS. For the estimation of the model, the GTAP database is used where we have grouped global economic activities into 26 aggregated sectors and 16 aggregated regions/countries including rest of the world.69 The GTAP database70 is supplemented by additional data from other sources.71
This model pays attention to three principal factors of production, namely, unskilled labour, skilled labour and capital. Among these factors, unskilled labour is considered mobile perfectly across sectors within a country and not across the EAS Member countries. This assumption is uniformly maintained in all scenarios of the model. However, it is assumed that factors like skilled labour (representing ‘natural persons’) and investment are perfectly mobile across all sectors and EAS Member countries, depending upon the model specifications in different scenarios.72
Several scenarios are drawn based on the above factors and alternative regional groupings of the EAS. The alternative country-groupings are ASEAN+3, ASEAN+4 and ASEAN+6 in the model. It is assumed that, for effective regional arrangement in the EAS, deeper integration is required. Taking this into account deepening of integration in the region, more sectors are introduced gradually through the model in different scenarios. For each alternative regional grouping, three alternative scenarios are undertaken based on liberalisation of the number of sectors. To begin with, the first scenario takes into account liberalisation of tariff, followed by liberalisation of tariff and investment together in the second scenario while the last scenario covers simultaneous liberalisation of trade, investment and movement of natural persons.
In this section, nine alternative scenarios are conceptualised involving the EAS, and they are presented in Table 9.1. As we move from the first row towards the third, greater deepening of the region in terms of liberalising additional sectors is displayed.
Table 9.1: Alternative scenarios for East Asian Summit: simulation analysis |
| |
ASEAN+3 |
ASEAN+4 |
ASEAN+6 |
Free Trade Area (FTA) |
I |
II |
III |
FTA+ Singapore Issues |
IV |
V |
IV |
FTA+ Singapore Issues +Services |
VII |
VIII |
IX |
Note: These scenarios are simulated using monopolistic CGE models. |
9.2 ASEAN+3, ASEAN+4 or EAS: Results of Regional Welfare Gains
Very often the regional process is considered as being inferior to the multilateral process on the grounds that the former is trade diverting in nature, which would increase regional welfare at the cost of global welfare. For making the EAS process meaningful, it should be trade creating in nature rather than trade diverting.73 Trade liberalisation policies, following formation of the EAS, may result in reallocation of productive factors across sectors owing to an increase in demand for tradable sectors within the region. In the process, the allocative efficiency of the existing factor endowments alters, and so also the relative real prices of different factors. The scale and level of production also undergo changes in regional economies. On the whole, the implications of such efficiency-seeking restructuring are likely to be reflected in the estimation of welfare gains.
With the formation of an FTA under the EAS, the regional welfare gains could be within a range of US$ 128.8 billion to US$ 502.8 billion, depending upon the composition of membership and depth of economic liberalisation between member countries as shown in Table 9.2. The results indicate that the proposed FTA is likely to enhance welfare of both regional and individual member countries. The EAS would be trade creating in nature where both the EAS and the global economy are likely to benefit in terms of welfare gains. All the major regions of the world would benefit from the trade liberalisation in the EAS when deepening of the region becomes more comprehensive.
It is shown in Table 9.2 that EAS countries are vibrant countries and, therefore, their welfare gains increase as the grouping is becoming wider. In fact, the welfare gain for the EAS is higher than for ASEAN+3 or ASEAN+4, irrespective of the coverage of sectors under liberalisation. Similarly, as we move from a shallow to deeper level of integration, the welfare gains are likely to improve. This brings home the point that both the region and individual countries can maximise their welfare gains when the ASEAN+6 is considered under the EAS process and three broad sectors outlined in the model are liberalised simultaneously. It is interesting to note that India’s inclusion in the regional caucus makes a significant difference to the whole region in terms of enhancing welfare gains for the region and individual member countries. For example, the absolute level of welfare gain rises between 23.7 per cent to more than 45 per cent in various schemes of trade liberalisation when India joins the ASEAN+4 as compared the ASEAN+3 alone. The region is likely to benefit more when investment along with skilled labour is allowed to move freely within the EAS region. The magnitude of absolute increase in welfare gains under the comprehensive trading arrangement would be US$ 502.8 billion per annum.
Table 9.2: Absolute Change in Welfare Gains from the East Asian Economic Integration |
(Billion US$) |
| |
Scenario:I |
Scenario:II |
Scenario:III |
Scenario:IV |
Scenario:V |
Scenario:VI |
Scenario:VII |
Scenario:VIII |
Scenario:IX |
FTA |
FTA and Singapore Issue (SI) |
FTA, SI and GATS |
ASEAN+3 |
ASEAN+4 |
ASEAN+6 |
ASEAN+3 |
ASEAN+4 |
ASEAN+6 |
ASEAN+3 |
ASEAN+4 |
ASEAN+6 |
Indonesia |
-0.8 |
4.2 |
5.1 |
-0.8 |
1.7 |
4.2 |
1.7 |
27.9 |
39.7 |
Malaysia |
6.4 |
7.5 |
8.1 |
5.9 |
9.2 |
10.0 |
3.9 |
6.4 |
8.6 |
Philippines |
1.7 |
2.1 |
2.3 |
2.3 |
2.8 |
3.2 |
3.6 |
4.3 |
6.0 |
Singapore |
3.4 |
4.2 |
4.2 |
3.6 |
4.7 |
4.7 |
2.3 |
2.6 |
3.9 |
Thailand |
7.9 |
9.0 |
10.0 |
9.3 |
11.1 |
12.4 |
5.9 |
7.6 |
11.4 |
Japan |
29.3 |
35.2 |
41.1 |
76.3 |
88.0 |
93.9 |
88.0 |
88.0 |
129.1 |
Korea |
13.4 |
15.6 |
16.7 |
21.2 |
25.7 |
27.9 |
17.9 |
21.2 |
30.1 |
China |
43.8 |
51.1 |
58.4 |
0.0 |
21.9 |
43.8 |
65.7 |
94.9 |
167.9 |
India |
25.1 |
31.8 |
33.5 |
36.9 |
58.7 |
63.7 |
40.2 |
58.7 |
75.4 |
Australia |
-1.5 |
-1.5 |
14.9 |
-1.5 |
-1.5 |
26.8 |
6.0 |
22.3 |
25.3 |
New Zealand |
0.0 |
0.0 |
2.9 |
0.0 |
0.2 |
4.9 |
0.8 |
2.1 |
5.3 |
Total |
128.8 |
159.3 |
197.2 |
153.2 |
222.3 |
295.5 |
236.0 |
336.0 |
502.8 |
Note: Additional increase in welfare in terms of percentage point in GDP growth for each country in the event of different scheme of regional integration. Under the ‘Singapore Issues’ and GATS; investment and free movement of natural persons are covered in the simulation model. Base value used here is 2011. |
The level of welfare gain for individual countries differs from one member country to another depending upon the maturity of economies, composition of trade, level of openness, trade potentials, etc. The size of a member country matters in attaining total volume of welfare gains from the regional liberalisation process, and gains are conceptually proportionate to the size of country under similar conditions. Therefore, the welfare effect of a country/region is viewed in relation to its GDP.
Table 9.3 provides estimates of the potential welfare effect with respect to the GDP of each country and also for the region. The overall responses of member countries indicate that the level of gain increases as one moves from a shallow to a deeper level of integration, though there are a few exceptions. In the ASEAN, countries like Indonesia and the Philippines, which are performing well enough to catch up with other advanced countries within the region, are likely to gain more from comprehensive economic cooperation than others. China has maintained that the ASEAN+3 should be at the core of EAS to start with for obtaining maximum welfare gain for the region, but the results show that China’s economic interest is in the EAS with the ASEAN+6.
India’s expected gain from the regional liberalisation process may be ranging between US$ 31.8 billion to US$ 75.4 billion, depending upon the coverage of the region and the level of regional liberalisation. If the so-called core group (ASEAN+3) starts liberalising among its member countries, India is likely to gain from the region to the extent of more than US$ 25.1 billion due to synergies created in the region.
Table 9.3: Welfare Gains from the East Asian Integration: Percentage Change |
(in percent) |
| |
Scenario:I |
Scenario:II |
Scenario:III |
Scenario:IV |
Scenario:V |
Scenario:VI |
Scenario:VII |
Scenario:VIII |
Scenario:IX |
| |
FTA |
FTA and Singapore Issue (SI) |
FTA, SI and GATS |
| |
ASEAN+3 |
ASEAN+4 |
ASEAN+6 |
ASEAN+3 |
ASEAN+4 |
ASEAN+6 |
ASEAN+3 |
ASEAN+4 |
ASEAN+6 |
Indonesia |
-0.1 |
0.5 |
0.6 |
-0.1 |
0.2 |
0.5 |
0.2 |
3.3 |
4.7 |
Malaysia |
2.3 |
2.7 |
2.9 |
2.1 |
3.3 |
3.6 |
1.4 |
2.3 |
3.1 |
Philippines |
0.8 |
1.0 |
1.1 |
1.1 |
1.3 |
1.5 |
1.7 |
2.0 |
2.8 |
Singapore |
1.3 |
1.6 |
1.6 |
1.4 |
1.8 |
1.8 |
0.9 |
1.0 |
1.5 |
Thailand |
2.3 |
2.6 |
2.9 |
2.7 |
3.2 |
3.6 |
1.7 |
2.2 |
3.3 |
Japan |
0.5 |
0.6 |
0.7 |
1.3 |
1.5 |
1.6 |
1.5 |
1.5 |
2.2 |
Korea, South |
1.2 |
1.4 |
1.5 |
1.9 |
2.3 |
2.5 |
1.6 |
1.9 |
2.7 |
China |
0.6 |
0.7 |
0.8 |
0.0 |
0.3 |
0.6 |
0.9 |
1.3 |
2.3 |
India |
1.5 |
1.9 |
2.0 |
2.2 |
3.5 |
3.8 |
2.4 |
3.5 |
4.5 |
Australia |
-0.1 |
-0.1 |
1.0 |
-0.1 |
-0.1 |
1.8 |
0.4 |
1.5 |
1.7 |
New Zealand |
0.0 |
0.0 |
1.8 |
0.0 |
0.1 |
3.0 |
0.5 |
1.3 |
3.3 |
South Asia |
-0.1 |
-0.1 |
-0.1 |
-0.1 |
-0.2 |
-0.2 |
0.3 |
1.0 |
1.5 |
NAFTA |
-0.1 |
-0.1 |
-0.1 |
-0.1 |
-0.1 |
-0.2 |
0.2 |
0.9 |
1.3 |
EEA |
-0.1 |
-0.1 |
-0.1 |
-0.2 |
-0.1 |
-0.2 |
0.2 |
1.0 |
1.5 |
Oceania |
-0.1 |
-0.1 |
-0.2 |
-0.1 |
-0.1 |
-0.2 |
0.3 |
1.0 |
1.7 |
Rest of World |
-0.1 |
-0.1 |
-0.1 |
-0.1 |
-0.1 |
-0.2 |
0.2 |
0.9 |
1.4 |
Note: Additional increase in welfare as a percentage of GDP of individual Countries in the Event of FTA and CEC in the Region. |
Most of the regional countries are likely to gain at a maximum when the EAS (i.e., ASEAN+6) countries will go in for more comprehensive liberalisation, covering trade, investment and movement of natural persons. Liberalisation among ASEAN+3 countries alone may not generate the expected level of welfare gain irrespective of their level of economic integration.
India is likely to gain from the EAS process regardless of whether it is included in the EAS caucus or not. India’s inclusion in the EAS would improve its gains from the regional integration. Gains from the EAS integration could be ranging between 1.3 percentage points to 2.1 percentage point for India, depending upon the level of integration adopted by the regional economies. Any forward movement in EAS integration with or without India could be beneficial for India. Therefore, India’s association with the ASEAN process could be rewarding in the medium term. Recently, the USA and Russia joined the EAS. Expansion of the EAS Membership has wider implications for the regional grouping in future.
10. Conclusions
The Sino-Indian bilateral trade relationship took an impressive turn during the last decade as China gradually ascended to become the largest trading partner of India since 2008. Bilateral two-way trade jumped by nearly ten and a half times during 2003-12 and total trade reached the level of US$ 68.8 billion by the end of 2012. During the last decade74, exports of India to China grew at the rate of 30.1 per cent per annum, and formed nearly 5.0 per cent of the total exports of India in 2012. During global recession, India’s bilateral imports expanded faster than the bilateral exports. With an increase in two-way trade, the trade deficit increased exponentially, and bilateral trade imbalance caused concern about the sustainability of rising bilateral trade over a time. However, both countries have aimed at achieving the trade target of US$100 billion by 2015. As external sector is turning to be a major driver of growth during the last decade, both the economies have been dealing with appropriate development strategies to keep their economies on high growth trajectory. Deliberate policy interventions have been experimented systematically to insulate these economies from the vagaries of intermittent global shocks and mitigating challenges of being middle-income country. Both the countries have resorted to rapid trade liberalization, mostly induced by unilateral initiative to cope with the global trading environment. Both countries witness regional disparity in having access to international trade and this development gap provide an opportunity to augment bilateral trade between them.
India has a large export potential in China, and it could emerge as a competitive supplier in the Chinese market, based on its global competitiveness. India is yet to introduce a number of products, which are globally competitive in the Chinese market. Having a large domestic market in value chain in a number of sectors, including the parts and component sector, India can complement China as an efficient partner in this sector and could be more competitive than several South East Asian economies upon whom China is seriously dependent for intermediate input supplies. Moreover, undervaluation of renminbi has posed certain amount of threat to India where both counties are competing for market access for same set of products. Revaluation of renminbi could improve India’s export prospects in some sectors if not all. Both countries can play a constructive role in the regional integration process in East Asia. EAS process is marred by the Chinese stand on ASEAN-Plus Three (APT), but realization of Regional Comprehensive Economic Partnership (RCEP) (which was known as EAS earlier) could steer the region on a high growth track, and China is likely to benefit more than what is expected from the APT process.
Sources of Domestic Growth
There has been serious thinking about the appropriate development strategy to sustain high grow over a long period. South-East Asian countries had successfully experimented with the Export Led Growth (ELG) strategy, but they lost ground during the last ‘Asian Financial Crisis’ as well as in the recent episode of global financial crisis. The Domestic Demand Led Growth (DDLG) has been an alternative development strategy for many to overcome the impediments of being Middle Income Country (MIC). India and China have been pursuing these strategies alternatively in different phases of global business cycle (i.e. global buoyancy and recession) to optimize their growth potentials from the constantly changing global and domestic situations. Empirical evidences, using growth decomposition model, indicate that external sector has been an important growth driver for both economies. Effective policy switching in favour of domestic demand during global recession and for the export sector during the global buoyancy had enabled them to maintain sustained high growth during any phase of a global business cycle. During the last two decades, emergence of external sector has improved growth predictability of both countries and has engaged them significantly than before.
China’s Global Imports
China’s exports and imports are growing very fast with the rest of the world during the last decade. Its imports are becoming technology intensive but relevance of primary products is not undermined. Major sectors in Chinese imports are machinery and mining products and combined share of these sectors in total imports was reported to be 58.0 per cent in 2012. Its import of machinery products from rest of the world was more than its mineral imports in 2012. Technology intensive imports constitute nearly two-thirds of its total imports where shares of primary as well as labour-intensive imports in the total are relatively small. As industrialisation has been a priority in country’s development agenda, import of machinery products assumes importance. For accessing the Chinese market, India has to transform its export basket to meet the requirement of Chinese imports and has to find ways to overcome the constraints faced by the Indian exporters in the Chinese market.
India’s Bilateral Exports
India’s export to China is highly concentrated, limiting to four sectors with a contribution of 78.8 per cent of India’s total bilateral exports in 2012. The textile & clothingforms the largest bilateral exporting sector followed by the mining sector, constituting 24.0 per cent of the total bilateral exports in 2012, but its sectoral share is declining in total bilateral exports. Other important sectors of India’s bilateral exports are base metals and chemicals where export performances are significant in 2012. As most of the important sectors contributing to export are primary and resource-based sectors, exports of these products may not be sustainable in the long-run as demand for imports in these sectors are receding. Medium and high technology products dominate the Chinese export basket and they are rising fast. Products of global value chain in manufacturing sector are becoming important for Chinese global imports. Considering the changing demand pattern of imports in China, India needs to diversify its exports and to introduce its new products, having global competitiveness, in order to access the Chinese market.
India’s Bilateral Imports
Rising bilateral trade imbalance may be attributed to the changing composition of India’s imports from China during the last decade. India’s bilateral imports are mostly concentrated in the manufacturing sector, comprising three dominant sub-sectors including chemicals, machinery and mechanical appliances and base metals, contributing around 74.9 per cent of bilateral imports in 2012. Machinery & mechanical appliances and chemicals are the two most important sectors where the growth rates have been significant during 2004-12. Moreover, medium- and high-technology intensive products also remain important for India’s imports.
Trade Policy Reforms
India started its comprehensive trade policy reforms much later than did China, reflecting in a less liberal tariff regime than China. With the continued liberalisation, simple average tariff declined to 9.7 per cent for China whereas it came down to 12.4 per cent for India in 2009. Both countries differ significantly in terms of their sectoral coverage and depth of tariff protection. While agriculture is protected, the manufacturing sector is subject to unilateral liberalisation in both countries. However, the agricultural sector was more protected in India than in China. Simulation results in the study, using Computable General Equilibrium (CGE), indicate that aggressive agricultural liberalisation could have adversely effected the Indian economy by affecting overall welfare of the country. This is because of several factors including reduction of production in agriculture (and its allied sectors); declining purchasing power in the agrarian sector; aggravating trade imbalances; increasing agro-imports and consequently affecting food and livelihood security of people in the rural area, etc. among others.
The situation is different in the manufacturing sector where India made robust liberalisation, leaving China behind. The simple average tariff rate in India was lower than China in the manufacturing sector in the years 2008 and 2009. This has been the outcome of tariff liberalization in substantially large number of sub-sectors in the manufacturing sector. Continuation of global recession compelled China to restructure its tariff structure without altering the overall level of tariff protection. CGE results in the study indicate that radical liberalization in the manufacturing sector may adversely impact the overall welfare position of the country. Trade liberalisation unilaterally or on a reciprocal basis should be made gradual, and sequencing of sectoral liberalisation is required based on sensitivity of sectors. Time is not yet appropriate to move towards ‘zero tariff’ regime in the manufacturing sector. As India and China are almost at similar levels of tariff regimes, further tariff liberalisation may not be a critical negotiating point for India in order to secure better market access in China.
Trade potential
With liberal trade policy regimes in both the countries, India has been maintaining high export growth with China since 2004, but it is adversely affected by the recent episode of global recession. India’s exports to China constituted a small proportion of China’s overall imports. Using Viner’s ‘trade creating’ approach in a partial equilibrium framework, the total bilateral export potential of India was estimated at US$ 53.4 billion based on the Chinese imports in 201275. Moreover, the export potential of India has been significant for those products which are currently exported to China in recent years. The largest trade potential is concentrated in the mining sector, followed by chemicals and pharmaceutical products, plastics, auto sector, among others. Most of these sectors are technology intensive in nature. Other than the mining sector, the second largest potential demand for export is in the machinery and mechanical appliances sector and it shares more than one-fourth of India’s total bilateral export potential in China. Bilateral export potential of India was expanding at the CAGR of 6.9 per cent during 2008-12. However, they are India’s lost opportunities, which were not tapped fully in subsequent years.
This study has estimated the trade potential of currently traded products and also other products which can be exported by India to China in future. The trade potential of currently exported products of India constitutes 85.5 per cent of India’s total bilateral trade potential in China in 2012. Among the currently traded products, trade potential is mostly concentrated in 5 sectors, namely minerals, machinery, plastics, chemicals and base metals. These sectors constitute nearly 77.6 per cent of the total bilateral trade potential of India from the currently traded products.
Sectoral Partnership in GVC
China has been the global hub of the Global Value Chain (GVC) activities and its local firms have played an active role in these growing production fragmentation activities. For various sectors until the 1990s, regional hubs for the production network were located in several East and South-East Asian countries but polarization started taking place around China during the last decade. China took advantage of recent development as the sector became one of the most important foreign exchange earners for the country. Surging of the Parts & Component (P&C) sector has not only increased trade dependence of China on ASEAN countries but also improved intra-regional trade of the participating economies. For initiating such production activities in the region, various production and trade-facilitating agreements with the participating countries were signed, both bilaterally and regionally to contribute to their engagement.
Similar to East and South East Asian countries, China is also strategically engaged with the EU and the US in the P&C trade. It is becoming a net surplus country with respect to both the destinations. During 2005-08, Chinese exports of P&C to these markets grew more rapidly than its overall trade.
Unlike China, India is a small global player in the P&C sector where the market size of Chinese trade in the P&C sector was around 14 times larger than that of India in the 2000s. At the beginning of the global recession, the global sectoral export of India was US$ 3.7 billion against US$ 18.7billion imports in 2012. India’s sectoral deficit in P&C was significantly large and growing because of rising demand for sectoral imports.
India has high competence to produce internationally competitive products with quality. It has the potentiality to integrate itself with several competitive sectors such as textiles & apparels, leather, food processing, automobiles, pharmaceuticals & traditional medicines, cement, IT software, etc. among others.
Empirical evidences based on 350 (6-digit HS) product lines, which form the core of P&C sector, indicate that India’s sectoral trade is concentrated in two major sectors including, machine & mechanical appliances and auto sector as well as three other sectors including plastics, base metals and cinematography products within the P&C sector. The bulk of India’s imports in P&C fall under the category of machinery & mechanical appliances and automobiles in 2012.India’s export sector in P&C is small, and One-fifth of its exports is absorbed by markets like the EU and the US, and a negligible proportion of its goes to China. The EU continues to be India’s top destination for exports and imports of P&C. On the contrary, India imports nearly one-fifth of its sectoral requirements from China.
The present pattern of India’s trade linkages with China in P&C has been one-sided. While sectoral bilateral imports from China increased from US$ 0.9 billion in 2004 to US$ 9.95 billion in 2012, the corresponding bilateral export figures of India increased from US$ 0.1 billion in 2005 to US$ 0.5 billion in 2012.The bilateral trade potential of India in parts and components though spreading over a number of sectors, is however, not a homogeneous spread across sectors. Some of these sectors with a high concentration of India’s export potential are mechanical appliances, electric machinery and precision instruments.
In several product lines, some ASEAN countries are relatively uncompetitive with respect to India in the P&C sector. Based on its competitiveness, India can potentially replace some ASEAN countries in various product segments as an efficient supplier. In case India replaces some of the ASEAN countries as a supplier to China, the largest loser would be Malaysia, followed by Thailand, the Philippines, Singapore, etc. India and China can negotiate to provide market access to each other in this sector. Experiences show that the P&C sector presents a better performance during the period of buoyancy. As global recovery is low with the partial recovery of the US economy, the sector is likely to boom in the coming years. India should negotiate to cooperate in this sector in order to seize the opportunities in the Chinese market.
Realignment of Renminbi and Competition with China in Third Market
The exchange rate regime in China has evolved in a manner that support its external sectors to grow. Accumulated over the years, the renminbi has been kept undervalued in the range of 15 to 50 per cent vis-à-vis the US dollar and hence with many currencies in the world including the Indian rupee. The recent international debate have identified the growing trade surplus of China as the major source of global imbalances by linking structure of the global financial crisis with the undervaluation of the renminbi. The domestic currency policy has enabled China to remain the largest exporting economy of the world with a huge current account surplus, and at the same time has contributed to the global imbalances.
China being a major production hub in the world, the effects of renminbi appreciation may spill from the domestic economy to the neighbouring countries in East Asia and other regions of Asia. As India and China gain prominence in the changed global trade scenario, it is imperative to assess the possible effects of renminbi appreciation on the rupee as well as on the exports of India to rest of the world in the presence of competition from China.
India has been exporting a host of products to different parts of the world which is also the case with China. Several important markets are common to both countries, and are also becoming shared ground for competition to gain market access in several lines of production. As production conditions differ in India and China, the level of competition is expected to be dissimilar in a number of markets, depending on the nature of competition and structure of products exported from both countries to these markets. Chinese competition is relatively robust with India, and the level of competition varies across product segments.
In this context, the impact of upward adjustment of the renminbi may have a certain impact on India’s export prospects in third country trade, but all this is relative to the magnitude of the revaluation of the renminbi. India’s export to third world market in various sectors are likely to be affected differently in the event of appreciation of the renminbi, depending upon the elasticities of these export sectors and the strength of Chinese competition in these markets.
Using a panel cointegration model, covering 25 countries and 7 years from 2003 to 2010, the bilateral export equation aims to capture the effects on India’s exports across five sectors. We have identified the most important trade destinations for both India and China separately employing bilateral trade flows. The empirical results are indicative of the fact that renminbi appreciation/depreciation has significant effects on India’s exports to other countries. This is consistent with our prior assumption that renminbi appreciation erodes China’s competitiveness thereby raising export prospects for India. As the literature highlights the discriminating impact of currency revaluation on exports, various export sectors of India are likely to experience a different impact of the renminbi revaluation in the third markets. Even though the overall positive effects hold good for all trade sectors, the impact of renminbi appreciation may vary with respect to the structure of the country’s export basket. The effect of renminbi revaluation seems to be stronger for capital goods and primary goods. The estimated Real Effective Exchange Rate (REER) coefficients for these two sectors are relatively higher compared to the other sectors. For consumer and semi-finished goods, the exchange rate effect on exports is large whereas it is substantially low for the parts and components segment.
India and China in the RCEP/EAS Process
Both China and India are of the view that regionalism can offer a credible platform to augment regional trade. As their trade is mostly concentrated in Asia, particularly in South-East and East-Asia, this trade area is becoming important for accessing the regional market.
India has been pursuing a ‘Look East’ policy since the early 1990s, and there is a dominant view that its long-term economic interest could be served better with its association with the EAS. As a late entrant in regionalism, China suggested that the EAS should start with the ‘core’ (i.e., ASEAN+3) including ASEAN, China, Japan and Korea; and other members of the EAS including India, Australia and New Zealand should be relegated to a ‘secondary’ group of countries. Since ASEAN is in the driving seat, its economic interest would guide the future course of regional alliance. With different regional groupings, and sectors for liberalisation, a CGE modeling analysis is undertaken to identify the most optimal set of countries and sectors for liberalisation, which could maximise welfare gains of the ASEAN countries and other members in the EAS. Presently, the process is known as Regional Comprehensive Economic Partnership (RCEP), and trade negotiation between Member countries are to be completed within a stipulated period.
With the formation of an FTA under the RCEP, the regional welfare gains could be within a range of US$ 128.8 billion to US$ 502.8 billion in 2012, depending upon the composition of membership and depth of economic liberalisation between member countries. The EAS would be trade creating in nature.
Simulation results indicate that region and individual countries can maximise their welfare gains when ASEAN+6 is considered under the RCEP process and three broad sectors outlined in the model including trade, investment and services (i.e. Mode-4) are liberalised simultaneously. It is interesting to note that India’s inclusion in the regional caucus makes significant difference to the whole region in terms of enhancing welfare gains for the region and individual member countries. India’s expected gain from the regional liberalisation process may range between US$ 25.1 billion to US$ 75.4 billion, depending upon the coverage of the region and the level of trade liberalisation. India is likely to gain from the RCEP process whether it is included in the regional caucus or not. India’s inclusion in the RCEP would improve its gains from the regional integration. Gains from the RCEP integration could range between 1.9 per cent to 4.5 per cent of its GDP for India, depending upon the level of integration adopted by the regional economies. Therefore, India’s association with the ASEAN process could be beneficial in the medium term. India needs to generate its own influence in the ASEAN to bring China into the fold of the RCEP process, which will be beneficial to all member countries in the caucus including China. Joining of the USA and Russia in the EAS-18 has changed the geopolitics within the region.
To sum up, India is likely to gain from its engagement with China, provided a cautious approach is pursued to protect long-term interests of India in the context of its bilateral economic engagement. This requires restructuring of India’s domestic and external policies to ensure effective partnership between two neighbouring countries.
References
ADB (2005), Asian Development Outlook, Asian Development Bank, Manila.
ADB (2011), Asian Development Outlook, Asian Development Bank, Manila.
ADB (2012), Asian Development Outlook, Asian Development Bank, Manila.
Ahmad, A. and C. Page (2009), ‘Are all Labour Regulations Equal? Evidence from Indian Manufacturing’, Journal of Comparative Economics, 37 (1), 62-75.
Ahmad, Shaghil, (2009), ‘Are Chinese Exports Sensitive to Changes in the Exchange Rate?’International Finance Discussion Paper No. 987, December.
Aiyar, Shekhar and Ashok Modi (2011), ‘The demographic dividend: Evidences from the Indian states’, Working Paper No WP/11/38, International Monetary Fund, Washington DC, February.
Alvarez, R. and S. Claro (2009),‘David versus Goliath: The Impact of Chinese Competition on Developing Countries’, World Development, 37(3), 560-571.
Amin, M (2009), ‘Labour Regulation and Employment in India’s Retail Stores’, Journalof Comparative Economics, 37 (1), 47-61.
Arellano, M. and S. Bond (1991), ‘Some test of specification for panel data: Monte Carlo evidence and an application to employment equations’, Review of Economic Studies, 58, 277-299.
Arunachalaramanan, S. and Ramesh Golait (2011), The Implication of Renminbi Revaluation on India’s Trade, RBI Working Paper Series, March, WPS (DEPR), 2/2011, Reserve Bank of India, Mumbai.
Asher, Mukul G. and Rahul Sen (2008), ‘India and Asian Economic Integration’, in Nagesh Kumar, K Kesavapany and Yao Chaocheng (eds.) Asia’s New Regionalism and Global Roal: Agenda for the East Asian Summit, RIS, New Delhi and Institute of Southeast Asian Studies, Singapore.
Athukorala, Prema-Chandra (2009),‘The Rise of China and East Asian Export Performance: Is the Crowding-Out Fear Warranted?’, The World Economy, 32(2), 234-266.
Bagnai,Alberto (2009), ‘The role of China in global external imbalances: Some future evidences’, Economic Review, 20 (3), September, 508-526.
Bahmani-Oskooee, M., Mohtadi, H., and Shabsigh, G. (1991), ‘Exports, growth and causality in LDCs: A re-examination’, Journal of Development Economics, 36,405–415, October.
Bair, J. and E. Dussel Peters (2006),‘Global Commodity Chains and Endogenous Growth: Export Dynamism and Development in Mexico and Hoduras’, World Development, 34(2), 203-221.
Balance, R.H., H. Forstner and T. Murray (1987), ‘Consistency Tests of Alternative Measures of Comparative Advantage’, Review of Economics and Statistics, 69, 157-61.
Balassa, B. (1989), Comparative Advantage, Trade Policy and Economic Development, Harvester Wheatsheaf, New York.
Balassa, Bela A. (1973), ‘The theory of economic integration’, Allen and Unwin, London.
Balassa, B. (1965), ‘Trade Liberalisation and ‘Revealed’ Comparative Advantage’, The Manchester School, 33, 99-123.
Bangake, C., Eggoh, C. (2011), ‘The Feldstein–Horioka Puzzle in African Countries: A Panel Cointegration Analysis’, Economic Modelling, 28, 939-947.
Barboza, D (2006), ‘Made in China’ labels don’t tell the whole story’, International Herald Tribune, February 9.
Birnik, A., Birnik, A-K & Sheth, J. (2010), ‘The branding challenges of Asian manufacturing firms’, Business Horizons, 53(5): 523-532.
Bohara, Alok K, Gawande Kishore and Pablo Sanguinetti (2004), ‘Trade diversion and declining tariffs: evidence from Mercosur’, Journal of International economics, 64, 65-88, October.
Cai, Fang and Dewen Wang (2005), ‘Demographic Transition: implications for growth’ in Garnaut and Song, eds., The China Boom and its Discontents, Asia-Pacific Press, Canberra.
Chen, M (2005), ‘Made in China: China is working to raise the value of its exports’, China Business Review, 32(3), 42-46.
Choi, I. (2001), ‘Unit root tests for penal data’, Journal of International Money and Finance, 20, 249-272.
Cline, William R. (2012), Projecting China’s Current Account Surplus, Peterson Institute for International Economics Policy Brief No 12-7, April, , Washington.
Cline, William R. and John William (2011), The Current Currency Situation, Peterson Institute for International Economics Policy Brief No 11-18, April, , Washington.
Confederation of Indian Industries (2004), Export Potential of Indian Engineering Goods and Machinery to China, New Delhi.
Cook, Sarah, Shujie Yao and Juzhong Zhuang (2000). The Chinese Economy under Transition. Studies on the Chinese Economy, Macmillan Press Ltd: London.
Demurger, Sylvie (2000). ‘Economic Opening and Growth in China: International Development’, Development Centre Studies, OECD, Paris.
Dimelis, S. and K. Gatsios (1995), ‘Trade with Central and Eastern Europe: The Case of Greece’, in R. Faini and R. Portes (eds.), EU Trade with Eastern Europe: Adjustment and Opportunities, London: CEPR.
Dodaro, S. (1993), ‘Export and growth: Are consideration of causality’, Journal of Developing Areas, 27, January, 227–244.
Du, JUlan and Chenggang Xu (2009). ‘Which Firms went Public in China? A Study of Financial Market Regulation’, World Development, Special Issue on Law, Finance and Economic Growth in China, 37(4), 812-824.
Dunaway, S and X Li (2005), ‘Estimating China’s ‘equilibrium’ real exchange rate’, IMF Working Paper No. 05/202, IMF, Washington DC.
EAF (2012), ‘Narrowing China’s Current Account Surplus’, 17th October, East Asia Forum, Economics, Politics and Public Policy in East Asia and the Pacific, http://www.eastasiaforum.org/2012/10/17/narrowing-chinas-current-account-surplus/Eichengreen, Barry, Yeongseop Rhee and Hui Tong (2006), ‘China and the Exports of Other Asian Countries’, An early version of per was presented at the KIEP/Claremont conference on East Asian regionalism, Seoul, January.
Economist (2010), Issue, August 21-27.
ESCAP (2012), Economic and Social Survey of Asia and the Pacific 2012, Bangkok.
Estrada, Gemma, et. al. (2013), ‘The PRC’s Free Trade Agreements with ASEAN, Japan and the Republic of Korea: a comparative analysis, Working Paper No 93, January, Paper Series on Regional Economic Integration, Asian Development Bank.
Fan, Y (2006), ‘The globalisation of Chinese Brands’, Marketing Intelligence and Planning, 24(4), 365-379.
Fatimah, M. A and Alias, R (1997), ‘Export Performance of Selected Electrical and Electronic Products’. Paper presented at the 2nd Asian Academy of Management Conference, Langkawi, 12-13 December.
Feder, G. (1983), ‘On exports and economic growth’, Journal of Development Economics, 5, 59–73.
Felipe, J. (2003), ‘Is Export-led Growth Passe? Implications for Developing Asia’, ERD Working Paper No.48, Manila: Asian Development Bank, December.
Felipe, J., E. Lavina and E. X. Fan (2008). ‘The Diverging Patterns of Profitability, Investment and Growth of China and India during 1980-2003’, World Development, 36(5), 741-774.
Felipe Jesus and Joseph Lim, (2005), Export or domestic-led growth in Asia?, ERD working paper no. 69. 1655-5252, May, Asian Development Bank, Manila.
Fertö, I. and L.J. Hubbard (2003), “Revealed Comparative Advantage and Competitiveness in Hungarian Agri-Food Sectors”, The World Economy, 26(2), 247-59.
Fu, Xiaolan and V. N. Balasubramanyam (2005). ‘Exports, Foreign Direct Investment and Employment: The Case of China’, The World Economy, 28(4), 607-626.
Garcia-Herrero, A. and Koivu (2009), ‘China’s Exchange Rate Policy and Asian Trade,’BIS working paper No. 282.
Girardin, Eric (1997). ‘Banking Sector Reform and Credit Control in China’, Development Centre Studies. OECD: Paris.
Girma, Sourafel and Yundan Gong and Holger Gorg (2009). ‘What Determines Innovation Activity in Chinese State-Owned Enterprises? The Role of Foreign Direct Investment’, World Development, Special Issue on Law, Finance and Economic Growth in China, 37(4), 866-873.
GoI (2008), Economic Survey for 2007-2008, Ministry of Finance, Government of India, New Delhi.
Goldstein, Morris and Nicholas R. Lardy (eds.) (2008). Debating China’s Exchange Rate Policy, Peterson Institute for International Economics, Washington D. C.
Golley, Jane, and Rod Tyers (2012), ‘Demographic Dividends, Dependencies And Economic Growth In China And India’, University of Western Australia, Discussion Paper 12.03.
Greenaway, David, Chris Milner and Aruneema Mahabir (2008), ‘Has China Displaced Other Countries' Exports?’, China Economic Review, 19, 152-169.
Greenaway, D. and C. Milner, (1993), Trade and Industrial Policy in Developing Countries: A Manual of Policy Analysis, esp. Part IV Evaluating Comparative Advantage, London: The Macmillan Press, 181-208.
Greenaway, David, Thomas Hyclak, and Robert J. Thornton, (1989) (eds), Economic Aspects of Regional Trading Arrangements, New York: Harvester Wheatsheaf.
Harwit, Eric (2008). China’s Telecommunications Revolution. Oxford University Press.
Heller, P. S. and Porter, R. C. (1978), ‘Exports and growth: An empirical reinvestigation’, Journal of Development Economics, 5, 191–193.
Herzer, Dierk, Felicitas Nowak-Lehmann D., and Boriss Siliverstovs (2006). ‘Export-Led Growth in Chile: Assessing the Role of Export Composition in Productivity Growth’, The Developing Economies, XLIV (3), 306-328, September.
Hinloopen,J. and C. Van Marrewijk (2001),‘On the Empirical Distribution of the Balassa Index’, Weltwirtschaftliches Archiv, 137,1-35.
Hoggarth, Glenn and Hui Tong, (2007), ‘The Impact of Yuan Revaluation on the Asian Region’, Working Paper No 329, Bank of England, July.
Holbig, Heike and Robert Ash (eds.) (2002). China’s Accession to the World Trade Organisation: National and International Perspectives. Routledge: London: USA: Canada.
Holz, C. A. (2008). ‘China’s Economic Growth 1978-2025: What We Know Today about China’s Economic Growth Tomorrow’, World Development, 36(10), 1665-1691.
Hsiao, M. W. (1987), ‘Tests of causality and exogeneity between export growth and economic growth’, Journal of Development Economics, 18, 143–159.
Iley, Richard A. and Mervyn Lewis, 2011), ‘Has the global financial crisis produced a new world order?’, Accounting Forum, 35(2), 90-103.
IMF (2013a), World Economic Outlook, October, International Monetary Fund, Washington DC.
IMF (2013b), Direction of Trade Statistics, International Monetary Fund, Washington DC.
IMF (2012a), World Economic Outlook, October, International Monetary Fund, Washington DC.
IMF (2012b), Regional Economic Outlook: Asia and Pacific – Managing spillovers and advancing economic rebalance, April, International Monetary Fund, Washington DC.
IMF (2012c), International Financial Statistics, International Monetary Fund, Washington DC.
IMF (2011), World Economic Outlook, April, International Monetary Fund, Washington D.C., September.
Interbrand (2012), Best Global Brands, Retrieved on September 30, 2012, from http://www.interbrand.com/en/best-global-brands/2012/Best-Global-Brands-2012.aspx#
ITC/World Bank (2012), Trains Wits, Geneva.
Ivarsson, Inge and Claes Goran Alvstam (2005). ‘Technology Transfer from TNCs to Local Suppliers in Developing Countries: A Study of AB Volvo’s Truck and Bus Plants in Brazil, China, India and Mexico’, World Development, 33 (8), 1325-1344.
Jenkins, Rhys (2008). ‘Measuring the Competitive Threat from China for other Southern Exporters’, The World Economy, 31(10), 1351-1366.
Jianlin, Jiang and Cai Li (2013), “Analysis of Trade Development between China and Association of Southeast Asian Nations”, Journal of Behavioral Economics, Finance, Entrepreneurship, Accounting and Transport, Vol. 1(1), pp15-20.
Johnson, Harry G. (1960), 'The Economic Theory of Customs Union', Pakistan Economic Journal, X (1), March, 14-32.
Johansson, Anders C. and Christer Ljungwall (2009),‘Spillover Effects Among the Greater China Stock Markets’, World Development, Special Issue on Law, Finance and Economic Growth in China, 37(4), 839-851.
Joint Study Group Report (2004), India-China Joint Study Group Report, Government of India and Government of PRC, Ministry of Commerce, New Delhi.
Jung, W. S., and Marshall, P. J. (1985), ‘Exports, growth and causality in developing countries’, Journal of Development Economics,18, May/June, 1–12.
Kannapiran, C A and E M, Fleming (1999), ‘Competitiveness and Comparative Advantage of Tree Crop Small-holdings in PNG’, Working Paper No. 99-10. University of New England, Australia.
Kao, C. (1999), ‘Spurious regression and residual-based tests for cointegration in penal data’, Journal of Econometrics, 115, 53-74.
Kao, C., and M. H. Chiang (2000), ‘On the estimation and inference of a cointegrated regression in panel data’, Advances in Econometrics 15, 179–222.
Kavoussi, R. M. (1984), ‘Export expansion and economic growth: Further empirical evidence’, Journal of Development Economics, 14, 241–250.
Kawai, Masahiro and Ganeshan Wignaraja (2007), ‘ASEAN+3 or ASEAN+6: Which Way Forward?’, ADB Institute Discussion Paper No. 77, Tokyo, September.
Kochak, Anjani K. (2005). ‘Development Indices: A Comparative Study of India and China’. Institute of Chinese Studies, Occasional paper No. 4, June.
Kumar, Nagesh (2008), ASEAN FTAs and Prospects of Broader Regional Cooperation in Asia, Japan Spotlight, March/April 2008: 34-36.
Kumar, Nagesh and S K Mohanty, (2000), ‘Relevance of Clearing and Payments Arrangement for the IOR-ARC Region’, in J M Reddy (ed.) Trade and Investment: Issues in the Indian Ocean Rim, Sterling Publishers, Co-authored, 454-466.
Kumaran, V. Lakshmi (2005). ‘The 10 Major Problem with the Anti-Dumping Instrument in India’, Journal of World Trade, 39(1), 115-124.
Kunimoto, K. (1977), ‘Typology of Trade Intensity Indices’, Hitotsubashi Journal of Economics, 17, 15-32.
Lai, Yew Wah (2004), ‘The role of domestic demand in the economic growth of Malaysia: A Cointegration Analysis’, International Economic Journal, 18(3), 337-352.
Lederman, Daniel, Marcelo Olarreaga, Guillermo E. Perry (eds.) (2009). China’s and India’s Challenge to Latin America: Opportunity or Threat?, The World Bank.
Leishman, D, Mankhaus, D.J, and Whipple, G.D. (2002), ‘Revealed Comparative Advantage and the Measurement of International Competitiveness for Agricultural Commodities: An Empirical Analysis of Wool Exporters’. Presented at Western Agricultural Economics Annual Meeting.
Lemoine, Françoise and Deniz Ünal-Kesenci (2002), China in the International Segmentation of Production Processes, Working Paper No 2002-02, CEPII.
Levin, A., Lin, C., & Chu, C. (2002). ‘Unit root test in panel data: asymptotic and finite sample properties’, Journal of Econometrics, 108 (1), 1-24.
Li, Feng and Jing Li (1999). Foreign Investment in China. Macmillian Press Ltd: London.
Li, Xuan (2008). ‘The Impact of Higher Standards in Patent Protection for Pharmaceutical Industries under the TRIPs Agreement – A Comparative Study of China and India’, The World Economy, 31(10), 1367-1382.
Li, Yuefen and Bin Zhang (2008). ‘Development Path of China and India and the Challenges for their Sustainable Growth’, The World Economy, 31(10), 1277-1291.
Lian, Deniel (2004), ‘Mr. Thaksin has a Plan’, Morgan Stanley, Equity Research Asia/Pacific, 21 September.
Liesner, H.H. (1958), ‘The European Common Market and British Industry’, Economic Journal, 68, 302-16.
Lin, Justin; and Li, Yongjun (2002). ‘Export and Economic Growth in China: A Demand-side Analysis.’CCERWorking Paper, No. C2002008.
Love, J. (1994), ‘Engines of growth: The exports and government sectors’, World Economy, 17, 203–218.
Love, Jim and Ramesh Chandra, (2005), ‘Testing export-led growth in Bangladesh in a multivariate VAR framework’, Journal of Asian Economics, 15, 1155–1168.
Low, L. (2003), ‘Multilateralism, regionalism, bilateral and cross-regional free trade arrangements: All paved with good intensions for ASEAN?’, Asian Economic Journal, 17, 65-86.
Lu, Ding, Shandre M. Thangavelu and Qing Hu (2005). ‘Biased Lending and Non-performing Loans in China’s Banking Sector’, The Journal of Development Studies, 41(6), 1071-1091, August.
Lu, S. Feng and Y. Yao (2009). ‘The Effectiveness of Law, Financial Development, and Economic Growth in an Economy of Financial Repression: Evidence from China’, World Development, Special Issue on Law, Finance and Economic Growth in China, 37 (4), 763-777.
Maddala, G.S., and Wu, S. (1999),‘A comparative study of unit root tests with panel data and a new simple test’, Oxford Bulletin of Economics and Statistics, 61, 631-52.
Magee, C. (2008), ‘New measures of trade creation and trade diversion’, Journal of International Economics, 75, 349-62.
Meade, J. (1955), The theory of customs union, North Holland, Amsterdam.
Mehta, R and S.K Mohanty (2001a), WTO and Industrial Tariff: An Empirical Analysis for India, Monograph Series, Research and Information System for the Non- Aligned and Other Developing Countries (RIS), New Delhi.
Mehta, Rajesh and S K Mohanty (2001b), Alternative Forms of Trading Arrangements in Indian Ocean Basin, Indian Journal of African Studies, XII (1&2), April-October.
Meng, Xin (21012). ‘Labour Market Outcomes and Reforms in China’, Journal of Economic Perspective, 26 (4), 4 Fall, 75-102.
Michaely, M. (1977), ‘Exports and growth: An empirical investigation’, Journal ofDevelopment Economics, 4, 49–53.
MOCI (2002), Term Export Strategy of India: (2002-06), Ministry of Commerce and Industries, Government of India.
MoC (2011), Report of the foreign trade situation of China, Autumn, Ministry of Commerce, People’s Republic of China, Beijing.
Mohanty, S K (2012a), ‘Economic Growth, Exports and Domestic Demand in India: In Search of a New Paradigm of Development’, Paper presented in an International Conference onMoving Toward a New Development Model for East Asia: The Role of Domestic Policy and Regional Cooperation, Organised by Chinese Academy of Social Sciences (CASS) and Economic Research Institute for ASEAN and East Asia (ERIA), Beijing, June 25-26.
Mohanty, S K (2012b), ‘Can Regional Value Chain be a New driver of South Asian Intra-Regional Trade?: A parts and components trade perspective’, Asian Development Bank (forthcoming).
Mohanty, S K (2010), ‘Are Indian Exports Consistent with the Global Demand?: How regional Approach Promotes Exports?’, background paper for the Union Budget, Ministry of Finance, Government of India.
Mohanty, S K (2009), Are Indian Exports Consistent with the Global Demand? How regional Approach Promotes Exports? Ministry of Finance, Government of India, Background Paper for the Economic Survey on India.
Mohanty, S K (2008), Towards a New East Asian Economic Integration: Trends, Potentials and Challenges for an Emerging Pan-Continental RTA, A study conducted for Observer Research Foundation, New Delhi.
Mohanty, S K (2005), ‘Is South Asian Economic Cooperation Sustainable?: Strategy for Meaningful Transition from SAPTA to SAFTA’, Presented in the Eight GTAP Conference held in Lubeck, Germany, June 9-11.
Mohanty, S. K. (2003a), Implication of SAPTA on Intra-Regional Trade Flows of the South Asian Region: An Empirical Assessment, Study for the ESCAP, January. http://www.unescap.org/tid/mtg/mohanty.pdf
Mohanty, S. K. (2003b), ‘Possibility of Close Economic Cooperation between India and Singapore’, RIS Discussion Paper No. 45, Research and Information System for Developing Countries, New Delhi.
Mohanty, S. K., (2001), Towards an Indo-Singapore Free Trade Area, Study submitted to the Ministry of Commerce, Government of India.
Mohanty, S K and Robert Arockiasamy (2010), Prospects for Making India’s Manufacturing Sector Export Oriented, RIS study for the Ministry of Commerce and Industries.
Mohanty, S K and Sachin Chaturvedi (2006), ‘Rising Tiger and Leaping Dragon: Emerging Global Dynamics and Space for Developing Countries and Least Developed Countries’, IDS Bulletin, January 37 (1), Sussex, UK. http://www.ids.ac.uk/ids/bookshop/bulletin/rising.
Mohanty, S K, Pohit and Saikat Sinha Roy (2004), Towards Formation of Close Economic Cooperation among Asian Countries, RIS Discussion Paper #78, Research and Information System for Developing Countries, New Delhi.
Montalvo, J. G. (1995), ‘Comparing cointegration regression estimators: Some additional Monte Carlo results’, Economic Letters, 48, 229-234.
Montobbio, F. and F. Rampa (2005),‘The Impact of Technology and Structural Change on Export Performance in Nine Developing Countries’, World Development, 33(4), April, 527-548.
Moreira, Mauricio Mesquita (2007),‘Fear of China: Is there a Future for Manufacturing in Latin America’, World Development, 35(3), 355-376.
Morrison, Wayne M. (2013), China-US Trade Issues, December 16, Congressional Research Service, CRS report for Congress, Washington DC.
Neilson, J. (2008),‘Global Private Regulation and Value-Chain Restructuring in Indonesian Smallholder Coffee Systems’, World Development, 36(9), 1607-1622.
Nolan, Peter (2001),China and the Global Economy. Palgrave: New York.
OECD (2007), OECD Reviews of Innovation Policy-China: Synthesis Report, Ministry of Science and Technology, OECD, Paris.
OECD (2009), ‘China: Defining the Boundary between the Market and the State’. OECD Reviews of Regulatory Reform Organisation for Economic Co-operation and Development.
OECD (2012), Looking to 2060: Long-term Global Growth Prospects, A Going for Growth Report, OECD Economic Policy Paper, No. 03, Paris.
OSC (2013), China-Africa Economic and Trade Cooperation, White Paper, August, Information Office of the State Council, The People’s Republic of China, Beijing.
Palley, Thomas I. (2011), ‘The end of export-led growth: Implications for emerging countries and the global economy’, Briefing Paper No. 6, Friedrich Ebert Stiftung, Shanghai, March, 1-8.
Panitchpakdi, Supachai and Mark L. Clifford (2002),China and the WTO: Changing China, Changing World Trade. John Wiley and Songs (Asia) Ptd Ltd.: Singapore.
Park, J. (1992), ‘Canonical cointegration Regression, Econometrica, 60, 119-143.
Pedroni, P. (1999), ‘Critical values for cointegration tests in heterogenous panels with multiple regressors’, Oxford Bulletin of Economics and Statistics, Special Issue, 653-670.
Pedroni, P. (2000),‘Fully Modified OLS for Heterogeneous Cointegrated Panels,’ in Baltagi, B., C.D. Kao (Eds.), Advances in Econometrics, Nonstationary Panels, Panel Cointegration and Dynamic Panels, Elsevier Science, New York, 93-130.
Pedroni, P. (2004), ‘Penal cointegration and finite properties of pooled time series tests with an application of the PPP hypohesis’, Econometric Theory, 20, 597-625.
Phillips, P. C. B. and B. E. Hansen (1990), ‘Statistical inference in instrumental variables regression with I (1) process’, Review of Economic Studies, 57 (1), 99-125.
Phillips, P. C. B. and H. R. Moon (1999), ‘Linear regression limit theory for non-stationary panel data’, Econometrica, 67, 1057-1111.
Prasad, Eswar. S. (2009), ‘Effects of the Financial Crisis on the US-China Economic Relationship’, Cato Journal, 29(2), 223-235.
Qureshi, Mahvash Saeed and Guanghua Wan (2008),‘Trade Expansion of China and India: Threat or Opportunity?’, The World Economy, 31(10), 1327-1350.
Ram, R. (1987), ‘Exports and economic growth in developing countries: Evidence from time–series and cross-section data’, Economic Development and Cultural Change, 36(1), 51–72.
Rodrik, Dani and Arvind Subramanian (2004), ‘From ';Hindu Growth'; to Productivity Surge: The Mystery of the Indian Growth Transition, ’IMF Working Papers 04/77, International Monetary Fund.
Stock, J., and Watson, M. (1993), A simple estimator of cointegrating vectors in higher order integrated systems. Econometrica, 61, (4), 783-820.
Tam, S.Y. (2001),‘Can Malaysian Manufacturing Compete with China in WTO?’Asia-Pacific Development Journal, 8 (2).
Tang, Sumei, E. A. Selvanathan and S. Selvanathan (2008),‘Foreign Direct Investment, Domestic Investment and Economic Growth in China: A Time Series Analysis’. The World Economy, 31(10), 1292-1309.
Thorbecke, W. (2011), ‘Investigating the effect of exchange rate changes on Chinese processed exports’, Journal of Japanese and International Economics, 25(2), 33-46.
Tong, Donald D. (2002),The Heart of Economic Reform: China’s Banking Reform and State Enterprise Restructuring’, The Chinese Economy Series. Ashgate: England.
Tung, Chen-Yuan and Sam Baker (2004), ‘RMB revaluation will serve China’s self-interest’, China Economic Review, 15, 331-335.
Tyler, W. (1981), ‘Growth and export expansion in developing countries: Some empirical evidence’, Journal of Development Economics, 9(1), 121–130.
UNCTAD (2002), Trade and Development Report, United Nations Conference on Trade and Development, Geneva.
UNSD (2012), Comtrade, Online database, Geneva.
Viner, J. (1950), The Custom Union Issue New York, Carnegie Endowment for International Peace, New York.
Vollrath, T.L., (1991), ‘A Theoretical Evaluation of Alternative Trade Intensity Measures of Revealed Comparative Advantage’, Weltwirt-schaftliches Archiv, 130, 265-79.
Wah L. Y. (2004),‘The role of domestic demand in the economic growth of Malaysia: a cointegration analysis’. International Economic Journal, 18 (3).
Wang, Jiangyu (2007),‘Financial Liberalisation and Regulation in East Asia: Lessons from Financial Crises and the Chinese Experience of Controlled Liberalisation’, Journal of World Trade, 41(1), 211-242.
Wei, S-J, Liu, L, Wang, Z and Woo, W T (2000), ‘The China money puzzle: will devaluation of the yuan help or hurt the Hong Kong dollar?’, China Economic Review, 171-88.
Wilson, Dominic and Roopa Purushothaman (2003), ‘Dreaming with BRICs: The Path to 2050’, Goldman Sachs, Global Economic Paper No 99.
Wolf, Charles, Jr., et al. (2011), China and India, 2025: A Comparative Assessment, Rand National Defense Research Institute.Wong, Hock Tsen, (2007),‘Export, Domestic Demand and Economic growth: some empirical evidence of the Middle East Countries’, Journal of Economic Cooperation, 28 (2), 57-82.
Wong, Hock Tsen, (2008), “Exports and Domestic Demand: Some Empirical Evidence In Asean-5”, Labuan Bulletin of International Business and Finance, 6, 39-55.
World Bank (2010), Doing Business: 2010, World Bank, Washington DC.
World Bank (2011), World Development Indicators, World Bank, Washington DC.
WTO (2007),Trade Policy Review: China, PRC, WTO, Geneva.
WTO (2010),Trade Policy Review: China, PRC, WTO, Geneva.
WTO (2010), Trade Policy Review by WTO Secretariat, WTO, Geneva
WTO (2012),Trade Policy Review: China, PRC, WTO, Geneva.
WTO and IDE-JETRO (2011), ‘Trade Patterns and Global Value Chains in East Asia’, WTO, Geneva.
WTO (1999), Legal Text: The Results of the Uruguay Round of Multilateral Trade Negotiations, Cambridge University Press.
Xin, Chen (2013), China-EU Trade and Economic Relations (2003-13), Institute of European Studies, Chinese Academy of Social Sciences, Beijing, China.
Yeasts, A. J. (1985), ‘On the Appropriate Interpretation of the Revealed Comparative Advantage Index: Implications of a Methodology Based on Industry Sector Analysis’, Weltwirtschaftliches Archiv. 121 (1), 61-73.
Yu, Y. (2007) “Global imbalances and China”, Australian Economic Review, vol. 40, pp. 3-23.
Yu, Miaojie (2009), Revaluation of Chinese Yuan and Triad Trade: A Gravity Assessment, Journal of Asian Economics, 20, 655-668.
Yu, Miaojie (2010), “Does Appreciation of the RMB Decrease Imports to the U.S. from China?,” Trade Working Papers 2010.22, East Asian Bureau of Economic Research.
Yu, Kang, Xiangyong Tan, Xian Xin (2008), ‘Have China’s FDI Policy Changes been Successful in Reducing its FDI Regional Disparity?’, Journal of World Trade, 42(4), 641-652.
Zheng, Jinghai, Arne Bigste and Angang Hu (2009),‘Can China’s Growth be Sustained? A Productivity Perspective’, World Development, Special Issue on Law, Finance and Economic Growth in China, 37(4), 874-888.
Zhou, W. (2009),‘Bank Financing in China’s Private Sector: The Payoffs of Political Capital’, World Development, Special Issue on Law, Finance and Economic Growth in China, 37(4), 787-799.
Zhou, Yu (2008),‘Synchronizing Export Orientation with Import Substitution: Creating Competitive Indigenous High-Tech Companies in China’, World Development, 36(11), 2353-2370.
Appendix I
A: Sectoral Aggregations for Agricultural and Manufacturing Trade Liberalisation in India: CGE |
Sl No. |
Sector |
Description of Sectors |
1 |
GrainsCrops |
Food grains and other related products |
2 |
MeatLstk |
Livestock including meat, milk and other animal products |
3 |
ProcFood |
Processed food |
4 |
AgrOth |
Other sub-sectors in the agricultural sectors |
5 |
POL |
POL minerals |
6 |
TextWapp |
Textiles and clothing |
7 |
Metal |
Base metals |
8 |
Auto |
Automotive sector |
9 |
Chemi |
Chemicals |
10 |
Machine |
Machinery |
11 |
LightMnfc |
Light manufacturing |
12 |
HeavyMnfc |
Heavy manufacturing |
13 |
Serv |
All Services |
Source : Global Trade Analysis Project (GTAP) database, Version 7.0, Department of Agricultural Economics, Purdue University, USA. |
B: Regional Aggregations for Agricultural and Manufacturing Trade Liberalisation in India |
Sl. No |
Region |
Description of Regions |
1 |
India |
India |
2 |
China |
China |
3 |
Oceania |
Oceania |
4 |
EastAsia |
East Asian Countries |
5 |
SEAsia |
South East Asian Countries |
6 |
SouthAsia |
South Asian Countries |
7 |
NAmerica |
North America |
8 |
LatinAmer |
Latin America and Caribbean |
9 |
EU_25 |
European Countries (25) |
10 |
MENA |
The Middle East and North Africa |
11 |
SSA |
Sub-Saharan Africa |
12 |
RestofWorld |
Rest of the World |
Source : Global Trade Analysis Project (GTAP) database, Version 7.0, Department of Agricultural Economics, Purdue University, USA. |
Appendix II
Export Competitiveness and Revealed Comparative Advantage
It must be noted that there are difficulties in measuring the comparative advantage, and the issue remains complex till today. Balassa (1989) observed that relative prices under autarky are not observable. Balassa (1965) argued that it may not be necessary to include all constituents affecting a country’s comparative advantage. Instead, the comparative advantage of a country is ‘revealed’ by its observed trade patterns, and for this purpose, one may not require pre-trade relative prices which are not observable. Thus he proposed a derived index to estimate the comparative advantage from observed data, and the index is known as “Balassa Index”. During the last four decades, there have been attempts to develop new indices to overcome the deficiencies in the Balassa Index. However, the Balassa Index still remains a commonly accepted measure to analyse trade data.
The trade competitiveness of a country shows whether it has specialisation in the production of a good (Tam, 2001). A country has a comparative advantage when it can produce the good more cheaply than other suppliers in the market. As indicated by Kannapiran and Fleming (1999), a country has a comparative advantage over the others if that country can do so at a lower cost. Gain from exporting products continues for a country so long as it enjoys a margin over the world price (Leishman et al., 2002).
Indices on the revealed comparative advantage (RCA) are commonly used as proxies to measure trade competitiveness. RCA assumes that the comparative advantage of a country is reflected or revealed in a market over a selected set of prospective products (Tam, 2001). The RCA provides a rough indicator of the strength of a product in terms of its comparative advantage in the world market, relative to others (Fatimah and Alias, 1997).
The Balassa Index was developed in an evolutionary process. Liesner (1958) is the first to contribute to the empirical study in the area of RCA to examine the competitiveness of the UK in the European Common Market. Since then, the definition of RCA has been revised and modified over the last four decades. The Balassa index is used in varieties of situations to examine the competitiveness of a country in different lines of products/ industries. For example, while Balassa, (1965) used this approach to estimate the competitiveness at the sub-global/regional level, Vollrath (1991) used it to analyse the specialisation in trade at the global level. In a related study, Dimelis and Gatsios (1995) used this approach to examine the competitiveness at the bilateral level.
A simple measure of RCA used in the study is as follows:
where X denotes exports, i for country, j for product ( or industry), and n for a set of countries (e.g. any RTA).
Balassa (1965) presented a comprehensive measure of the relative comparative advantage index. The RCA has gained wider acceptance among the applied international trade economists, as it is a more comprehensive indicator of the concept of specialisation. It provides a better measure of the overall specialisation pattern of a country. Kunimoto (1977) provides a statistical framework in which the Balassa Index can be interpreted as the ratio between actual and expected trade. The RCA Index is expressed as follows:
where X stands for exports, i for ith country, j for jth product (or industry). RCA2j measures ith country’s exports of the jth product (or industry) relative to its total exports and to the corresponding exports of a reference group or World.
When RCA2j >1, it may be interpreted that the reference country has a revealed comparative advantage in the export of jth product to a reference group or World. If RCA2j is less than unity, the country is said to have comparative disadvantage in the product/industry. Greenaway and Milner (1993) have argued that the RCA2 index is lopsided due to exclusion of imports from the index. In order to correct the export bias in the RCA index, several indices are proposed in the literature by introducing imports in the modified indices. Greenaway and Milner (1993) have proposed “own” country trade performance. A number of other transformed indices are also seen in the literature, and most of them are very similar to Balassa Index.
Some significant improvement is suggested by Vollrath (1991) to transform the RCA index. He has proposed three alternative ways of measuring a country’s RCA using both export and import variables. These alternative specifications of RCA are called the relative trade advantage (RTA), the logarithm of the relative export advantage (ln RXA), and the revealed competitiveness (RC). One of the advantages of presenting Vollrath’s three alternative measures is that the positive value of revealed comparative advantage reveals a comparative/ competitive advantage, whereas the negative values indicate comparative/ competitive disadvantage. This condition is applicable to all the three alternative measures of Vollrath (1991).
The aforesaid measures are effective so long as trade practices are carried out in a distortion free environment. However, the trade patterns of countries are very often distorted on account of intervention of Governments in the form of import restrictions, export subsidies and other protectionist policies. Such anomalies in trade practices also affect the effectiveness of the RCA index as a sound instrument to measure the comparative advantage of domestic tradable products/sectors. Several studies have proposed a number of measures to remove the prevailing anomalies in trade practices, on account of Government intervention. For example, the study of Fertö and Hubbard (2003), uses nominal assistance coefficients (NACs) estimated by the OECD for country and commodity sectors to filter the effects of possible distortions in measuring Hungarian Agri-food sector RCAs vis-à-vis the EU. Greenaway and Milner (1993), on the other hand, suggest the advantage of a price-based measure of RCA called “implicit revealed comparative advantage” (IRCA) to remove the distortion caused by the post-policy intervention. Vollrath (1991) suggests that the Revealed Competitiveness (RC) index is preferable since supply and demand balance is embodied in the index. It may be noted that although the use of Balassa and Vollrath indices are very much in vogue to examine the competitiveness of a country, they are not strictly comparable.
The existing literature presents a range of RCA alternative indices to measure the comparative advantage, and sometimes the use of different RCA indices may lead to inconsistent results and interpretational difficulties. Moreover, a number of studies have raised apprehensions about the stability and the consistency of alternative measures of RCA (e.g. Balance et al., 1987; Yeats, 1985; Hinloopen and Van Marrewijjk, 2001).
Appendix III:
Measuring Competitiveness and Export Potentials: Viner’s Trade Creation and Trade Diversion
The other important partial equilibrium approach to estimate export competitiveness is the trade creation/trade diversion effects (Viner, 1950). Under this approach, if a product is competitive, naturally, on the basis of comparative cost advantage, it becomes trade creation. If a product is naturally uncompetitive, but acquires competitiveness through tariff adjustment under preferential arrangement, it becomes trade diversion.
For estimation of price competitiveness, each product is considered separately at a disaggregated level (i.e. at 6-digit HS level). In this approach, the export price of each product group (at the 6-digit level) from India is compared with the corresponding prices offered by its competitors in the global market.
Let us assume that India exports ith product to the world at a given price (PXkij). Let us also assume that another competing supplier also exports the same product to world at a different price (PXkij), where PXNij denotes export price of India, for the ith product in jth market (world), PXkij represents export price of k-th competitor, for the ith product in the jthmarket, and N represents India.
For the ith product, if India has price competitiveness over other competitors in the jth market then the export price of India should be lower than those of other competitors. In such a case, the condition may be
If India has price competitiveness in one product, it does not mean that all the competitors in that product category necessarily have higher prices than that of India. For a given product, some of the competitors may also offer lower prices than India. In that case, India must look at the market share of those competitors, whose export prices are higher than that of India. The export market share of India’s inefficient competitors may be considered as India’s export potentials.
Suppose that India exports ith product, while another K-1 number of suppliers are also present for the same product segment in the world market. Each competitor holds some portion of the market share (Shikj) in the import of the ith product by world. Therefore, the total market for the ith product is shared by all the k suppliers in the world. It means,
where, Shikj stands for the market share of k exporters of the ithproduct to the world. Suppose that India has price competitiveness over a few competitors (but not all of them) in the export of ith product, and in case India effectively enters the world market as a supplier, the combined market share of uncompetitive competitors, assuming the ratio to be á, may be treated as India’s potential export share.
0<á<1...........................................(5)
where, á denotes the proportion of the market for the ith product, which is covered by the exports of less competitive competitors of India in the world market. The export potential of India (POTNij) in the exports of ith product in world may be estimated as:
POTNij = ψIMij …….…………(6)
where, IMij stands for total imports of the ith product by world from all sources.
If ψ is less than 1, it means that India has a price edge over a few competitors and a part of the ith import market of the world will constitute India’s potential export. If ψ is equal to 1, it means that the entire import of the ith product by world would be India’s potential export. Jacob Viner denotes such trade potential as the trade creation effect of a regional trading arrangement.
In this measure, we assume that with changes in the policy environment, India may be able to improve its market share by taking over market segments from less efficient competitors in the world on the basis of absolute cost comparative advantage. One of the limitations of this measure is that it cannot explain a situation where a product of India has global competitiveness, but is yet to tap the export potentials in the world economy. This issue is empirically examined in some studies (for details see Mohanty, 2003, and Mehta and Mohanty, 2001a, 2001b). Since the actual prices of tradable products are not directly observable for comparative purposes, on account of distortions, the RCA measure could be a better alternative approach to deal with the issue of competitiveness.
Appendix IV
Major Exporting Destinations Common to Both India and China
Groups |
No |
ISO |
Major Destinations |
Developed (excluding the EU) |
5 |
AUS |
Australia |
CAN |
Canada |
JPN |
Japan |
SGP |
Singapore |
USA |
United States of America |
Developed from the EU |
7 |
BEL |
Belgium |
DEU |
Germany |
ESP |
Spain |
FRA |
France |
GBR |
United Kingdom |
ITA |
Italy |
NLD |
Netherlands |
Developing Asia |
8 |
BGD |
Bangladesh |
HKG |
Hong Kong |
IDN |
Indonesia |
IRN |
Iran |
KOR |
Korea, REP |
LKA |
Sri Lanka |
MYS |
Malaysia |
PAK |
Pakistan |
Middle East |
2 |
ARE |
United Arab Emirates |
SAU |
Saudi Arabia |
Emerging Economies |
3 |
BRA |
Brazil |
RUS |
Russian Federation |
ZAF |
South Africa |
Appendix V
Computable General Equilibrium Model for EAS
The approaches discussed earlier have limited scope in dealing with the effects in the external sector. Moreover, the implications of trade liberalisation and other policy shocks on different segments of the domestic economy, and other related economies may not be examined by the partial equilibrium approach. For this purpose the CGE model is used relying on the Global Trade Analysis Project (GTAP) database
The GTAP is a multi-regional Computable General Equilibrium (CGE) database which covers world economic activities of 57 different industries (version 7). In order to make the analysis meaningful and manageable, the aggregated version of this database is clubbed into 21 sectors across several regions including eight RTAs.
As discussed earlier, India’s exports are diversified and they reach many export destinations. The export performance of all the export products originating from India is not the same in all the export destinations. While some of them perform exceedingly well in some destinations, others are yet to pick up. Taking this trend into consideration, India’s new export strategy will be to tie up with those regions, where export performance remains impressive in recent years. Under the regional approach, India can associate with specific regions under certain preferential arrangements or it can single out some key countries for closer economic cooperation. Thus, in order to understand the implications of the regional approach, multiple CGE models are used to assess the overall situation in specific regions.
The theory behind the GTAP model is similar to that of the standard multi-regional CGE model. The underlying equation system of GTAP includes two different kinds of equations, accordingly. One part covers the accounting relationships, which ensures that receipts and expenditures of every agent in the model economy are balanced. The other part of the system consists of behavioural equations, which are based on microeconomic theory. These equations specify the behaviour of the optimizing agents in the economy such as demand functions.
There are three principal factors of production in the GTAP model, namely, labour, capital and land. Out of these three factors, the first two are considered to be perfectly mobile across sectors. Consequently, these factors earn the same market return regardless of where it is employed. In the case of immobile or sluggish endowment commodities, returns in the equilibrium may differ across sectors.
The GTAP model employs the Armington assumption in the trading sector which provides the possibility to distinguish the imports by their origin, and explains intra-industry trade in similar products. Thus, imported commodities are assumed to be separable from domestically produced goods, and they are combined in an additional nest in the production tree. The elasticity of substitution in this input nest is equal across all uses. Under these circumstances, the firms decide on the sourcing of their imports, based on the composite import price, and then determine the optimal mix of imported and domestic goods.
The market structure in all the sectors of the model is assumed to be perfect competition.77 This is definitely a weakness of the model. 78Commodity supplies are based on single output production functions. Substitution between inputs is modeled with two-level nested production functions. Demand for land, labour and capital are based on Constant Elasticity of Substitution (CES) functions. International trade clears commodity markets, with each commodity being differentiated by its place of origin. Trade polices operate as ad valorem distortions, which in addition to transportation costs, form a wedge between domestic and world prices.
Households maximize the utility derived from market goods (i.e. consumption and savings) subject to regional income, which consists of primary factor payments and net tax collections. Regional production of new capital goods is financed by domestic savings and net capital inflow.
In the present study, we have taken a number of regions to examine the implication of an expanding trade relationship with them, along the path of preferential trade liberalisation.
Regional and sectoral aggregations for the East Asian Summit Simulations Sectoral Aggregation |
Sl. No. |
Sectors |
1 |
Rice |
2 |
Other Cereals |
3 |
Dairy & Meat Products |
4 |
Processed food |
5 |
Oil and oil seeds |
6 |
Textile fibres |
7 |
Mining |
8 |
Energy Products |
9 |
Forestry & Logging |
10 |
Other Agri. Products |
11 |
Textile and Apparel |
12 |
Beverages and Tobacco |
13 |
Leather Products |
14 |
Wood & Paper Products |
15 |
Petroleum and Coke |
16 |
Chemical Products |
17 |
Iron and Steel |
18 |
Other Metal Products |
19 |
Machinery |
20 |
Electronic Equipment |
21 |
Transport Equipment |
22 |
Other Manuf. Products |
23 |
Transport Services |
24 |
Communication |
25 |
Financial Services |
26 |
Other Services |
| Source: Global Trade Analysis Project (GTAP) database, Version 7.0, Department of Agricultural Economics, Purdue University, USA. |
Regional Aggregation |
Sl No. |
Country /Region |
1 |
Japan |
2 |
South Korea |
3 |
China |
4 |
India |
5 |
Indonesia |
6 |
Malaysia |
7 |
Philippines |
8 |
Singapore |
9 |
Thailand |
10 |
Rest of South Asia |
11 |
NAFTA |
12 |
EEA |
13 |
Oceania |
14 |
Rest of the World |
Source : Global Trade Analysis Project (GTAP) database, Version 7.0, Department of Agricultural Economics, Purdue University, USA. |
Appendix VI
Technology-Intensity of International Trade Using HS Trade Classification:
A New Approach
Sector |
Chp |
Sec |
Section Description |
PP |
RB |
LT |
MT |
HT |
Agriculture |
1-5 |
1 |
Live Animals and Animal Products |
189 |
31 |
|
|
|
6-14 |
2 |
Vegetable Products |
227 |
42 |
|
|
|
15 |
3 |
Animal or Vegetable Fats & Oils |
3 |
42 |
|
1 |
|
16-24 |
4 |
Prepared Foodstuff, Beverages, etc. |
41 |
151 |
|
2 |
|
Minerals |
25-27 |
5 |
Mineral Products |
84 |
68 |
|
|
|
Manufactures |
28-38 |
6 |
Products of Chemicals |
3 |
424 |
6 |
294 |
86 |
39-40 |
7 |
Plastics & Articles thereof |
6 |
77 |
38 |
91 |
|
41-43 |
8 |
Raw Hides & Skins, Leather, etc. |
17 |
|
57 |
|
|
44-46 |
9 |
Wood & Articles of Wood |
8 |
71 |
5 |
|
|
47-49 |
10 |
Pulp of wood or of other Fibres |
|
92 |
58 |
|
|
50-63 |
11 |
Textile & Textile Articles |
26 |
20 |
672 |
130 |
|
64-67 |
12 |
Footwear, Headgear and Umbrella |
|
|
55 |
|
|
68-70 |
13 |
Articles of Stone, Plaster, Cement |
|
106 |
32 |
2 |
|
71 |
14 |
Natural or cultured pearls, Jewellery |
22 |
15 |
14 |
|
|
72-83 |
15 |
Base Metals & Articles of Base Metal |
94 |
51 |
353 |
86 |
|
84-85 |
16 |
Machinery & Mechanical Appliances |
|
1 |
18 |
569 |
211 |
86-89 |
17 |
Vehicles, Aircraft and Vessels |
|
|
2 |
117 |
15 |
90-92 |
18 |
Optical, Photograph & Cinematography Products |
|
|
35 |
75 |
129 |
93 |
19 |
Arms and Ammunition |
|
|
8 |
13 |
|
94-96 |
20 |
Miscellaneous Manufactured Articles |
|
1 |
122 |
7 |
|
97 |
21 |
Works of Art Collectors' Pieces |
|
|
7 |
|
|
All Sectors |
720 |
1192 |
1482 |
1387 |
441 |
Source : Mohanty (2003a)
Note: PP refers to primary products, RB to resource-based, LT to low technology intensive, MT to medium technology intensive and HT to high technology intensive products respectively. In this Table, HS 2002 products are taken at 6-digit level. |
|