With government finances deteriorating due to the post-crisis fiscal stimulus, there has been a renewed focus,
globally as well as domestically, on working towards a phased reduction of elevated public debts to sustainable
levels. While the sharp fiscal deterioration in the late 1990s and early 2000s led to mounting debt at the
sub-national level in India, the reversal of the interest rate cycle in the mid-2000s played a critical role in
alleviating the interest burden on debt, ensuring that the consolidated state government debt did not grow
along an explosive trajectory. This was complemented by efforts at fiscal consolidation and institutional reforms
to get onto the fiscal correction path. Debt relief and interest relief provided by the centre were linked with
the implementation of reforms and thereby helped avoid moral hazard problems. However, while the focus has
been mainly on direct debt obligations, contingent liabilities pose a risk to state finances, unless monitored and
adequately controlled. Moreover, the aggregate picture masks interstate disparities and vulnerabilities, which
require customised reforms and correction packages rather than a one-size-fits-all approach. An indicator
analysis of debt sustainability for states shows progress on most indicators of fiscal and debt sustainability since the
onset of fiscal consolidation. Although the essential and sufficient conditions for sustainability were met during
the phase of fiscal consolidation, the sufficient condition of primary surpluses has not been fulfilled in the post-fiscal consolidation period, indicating the need to limit non-interest expenditure. Empirical evidence using panel
regression analysis shows that apart from the reversal of the interest rate cycle, the higher growth in nominal
GSDP and policy measures such as the DSS and the DCRF contributed to the debt reduction. It is, therefore,
necessary that states focus more on revenue-enhancing and expenditure compression measures that are more
durable to improve their debt sustainability. Since revenues cannot be augmented beyond a certain level and
are prone to cyclicality, the focus has to be on expenditure compression to improve the debt sustainability position
of the state governments. Strengthened debt management capacity and institutional arrangements at the state
level, with a more active risk management approach, will be required to meet future challenges.
1. Introduction
6.1 The consensus on policies prior to the global
financial crisis favoured reorienting government
finances towards medium-term fiscal sustainability
so as to provide a stable environment for the
operation of the private sector. With government
finances deteriorating due to the post-crisis
stimulus, there has been a renewed focus, globally
as well as domestically, on working towards a
phased reduction of elevated public debts to
sustainable levels. In this context, determining the
correct size of debt, including its components, is of
critical importance for assessing the sustainability.
The analysis of fiscal sustainability assumed
significance during the late 1980s, with sharp
fiscal deterioration witnessed at both the national as well as sub-national levels in India. Fiscal stress
and debt repayment pressures have been
experienced by state governments in the late
1990s, with continued deterioration evidenced in
the early 2000s. Although there has not been any
debt default among the Indian states, successive
Finance Commissions in India have expressed
concern over the growing debt of states and
looked at the issue of debt sustainability at the
state level within their terms of reference.
6.2 While the progressive decline in average
interest rates since 2004-05 played a part in
alleviating the interest burden on debt and
ensuring that the debt of states does not grow
along an explosive trajectory, major reforms were
implemented to reverse the fiscal deterioration, develop fiscal responsibility rules to ensure
sustained adjustment, and move towards market-based
financing of state deficits. Notwithstanding
a deviation from the fiscal consolidation path in
the wake of expansionary fiscal measures
undertaken by some state governments in 2008-
09 and 2009-10, the debt-GDP ratio of states
exhibited a declining trend during the period and it
has continued thereafter.
6.3 Against this background, this chapter
undertakes an assessment of the public debt
sustainability of state governments. Section 2
deals with the definition and measurement of state
government debt. Section 3 provides an overview
of the evolution of state government debt in various
phases. The role played by Finance Commissions
in the states’ debt sustainability is detailed in
Section 4. Debt restructuring and institutional
measures initiated by the central government in
fulfillment of the recommendations of the Eleventh
and Twelfth Finance Commissions, i.e., the debt
swap scheme (DSS) and the debt consolidation
and relief facility (DCRF), to restructure and
alleviate states’ debt and their impact have been
dealt with in Section 5. The role of fiscal and debt
rules in the debt sustainability of states has been
discussed in Section 6. Although the implicit
liabilities of state governments including
guarantees and off-budget borrowings are
excluded from the definition of state government
budgetary liabilities, there is risk of these liabilities
devolving on the state governments if there are
defaults by the borrowing entities. Section 7
discusses the fiscal implications of these
contingent liabilities. Section 8 undertakes an
assessment of public debt sustainability at the
sub-national level in India based on indicator
analysis. A vulnerability matrix has also been
constructed for the pre-debt consolidation and
post-debt consolidation phases to observe the
impact of policy-induced debt reduction measures
on the debt servicing and debt-GSDP ratios of states. A panel regression framework has been
employed to study the relative importance of
various fiscal and macroeconomic variables in the
determination of debt. Concluding observations
and the way forward are provided in the last
section.
2. Definition and Measurement of State
Government Debt
6.4 Accumulation of debt reflects the outcome
of state governments’ fiscal operations on the
revenue and expenditure sides of their budgets. If
expenditure, whether committed or discretionary,
exceeds revenues – tax and non-tax – the excess
can only be financed through fresh borrowings. If
the mismatch in the growth of revenues and
expenditure is of a temporary nature, borrowing
provides a mechanism by which the gap between
the two is bridged. However, if the mismatch
persists over a long period and grows in volume,
with the increase in revenue receipts turning out to
be inadequate to cover the interest liabilities that
are required to service the debt, it leads to growing
revenue and fiscal deficits. This, in turn, results in
unsustainable debt. The sustainable level of fiscal
deficits can be derived with reference to three key
parameters: growth rate, ratio of revenue receipts
to GDP/GSDP and the interest rate on borrowings.
The existing level of debt-GDP ratio is also quite
material in the context of fiscal sustainability. Fiscal
sustainability requires that a rise in fiscal deficit is
matched by a rise in the capacity to service the
increased debt.
6.5 The terms debt and liabilities are often used
interchangeably. Accordingly, all borrowings that
are repayable and/or on which interest accrues
are considered as debt. Transparency, reliability
and consistency in the data relating to debt are
crucial for prudent fiscal management. In this
context, determining the appropriate size of debt,
including its components, is of critical importance
for assessing debt sustainability.
6.6 As regards the compilation of debt of state
governments, there have been different
approaches adopted by different bodies such as
the state governments, the Reserve Bank of India,
Office of the Comptroller and Auditor General of
India (CAG) and the Finance Commissions (FCs),
leading to differences in the measurement of debt
(Table VI.1). State debt is classified by the CAG
under the three broad categories of (i) internal
debt which, inter alia, includes ways and means
advances (WMA) and overdrafts (OD) from the
Reserve Bank, (ii) loans and advances from the
central government and (iii) small savings,
provident funds and obligations like reserve funds
and deposits, both interest and non-interest
bearing. While the broad definition of states’ debt
followed by the FCs includes the same heads as
that by the Office of the CAG, their narrow definition
excludes WMA and OD from the Reserve Bank.
Dholakia and Karan (2004) excluded WMA and
OD from the Reserve Bank, but included suspense
& miscellaneous and contingency fund in their
definition of liabilities.
6.7 There appeared to be no unanimity about
the composition and the methodology for compiling
the liabilities of state governments in India until
2004-05. In fact, there was a great deal of ad hocism in the compilation of debt statistics. In view
of the substantial differences in the definition and
coverage of liabilities in the publications presenting
states liabilities and the need for reliable and
credible statistics on public debt comparable
across states, a Working Group on ‘Compilation of
State Government Liabilities’ was constituted in
the Reserve Bank, which submitted its report in
December 2005. Based on the recommendations
of the Working Group, the coverage of liabilities of
the state governments was made more
comprehensive, while ensuring that the compilation
of states’ liabilities was consistent with gross fiscal
deficit. Data on outstanding liabilities1 reflect the
latest available data on various components of
debt from their respective primary sources, viz.,
CAG, the Reserve Bank and Ministry of Finance
(MoF), and adding to this the flows on the
corresponding items reported in the budget
documents of the states for the revised estimates
and the budget estimates of the subsequent years.
6.8 Under the revised coverage followed by the
Reserve Bank, total outstanding liabilities
comprise various items under consolidated fund,
public account and contingency fund. Total
budgetary liabilities of the state governments are
classified under four categories, viz., (i) public
debt; (ii) ways and means advances and overdrafts from the Reserve Bank or other banks2; (iii) public
accounts; and (iv) contingency fund. Public
account liabilities relate to liabilities other than
those included in the consolidated fund. These
liabilities are unfunded, implying huge risks on the
budgets of the states. The WMAs from the Reserve
Bank are designed to meet temporary liquidity
shortfalls, which are formula-based and depend
on the states’ total expenditures. Under contingency
fund, transactions connected with the contingency
fund established under Article 267 of the
Constitution of India are recorded; it accounts for
less than 1 per cent of the total outstanding
liabilities of the state governments.
Table VI.1: Comparison of Measurement of Outstanding Liabilities of States as at end of 2004-05 |
RBI |
FC (Narrow) |
FC (Broad) |
CAG |
Dholakia and Karan (2004) |
Loans from the Centre |
Loans from the Centre |
Loans from the Centre |
Loans from the Centre |
Loans from the Centre |
Internal Liabilities |
Internal Liabilities |
Internal Liabilities |
Internal Liabilities |
Internal Liabilities |
WMA and OD from RBI |
|
WMA & OD from RBI |
WMA & OD from RBI |
|
State Provident Funds |
State Provident Funds, Reserve Funds |
Reserve Funds |
Reserve Funds |
State Provident Funds, Reserve Funds |
|
Deposits |
Deposits |
Deposits |
Deposits |
|
|
|
|
Contingency Fund and Suspense & Miscellaneous. |
Source: Report of the Working Group on Compilation of State Government Liabilities, December 2005. |
6.9 Borrowing channels for states are multiple,
with most of these channels being controlled and
restricted by the centre. Market borrowings, the
most important of these channels, are controlled
by the centre and managed by the Reserve Bank.
States may not, without the consent of the central
government, raise any loan if they are indebted to
the central government (Article 293). The Reserve
Bank manages the domestic borrowings of 28
states through separate agreements with each of
them. Cost minimisation with minimum rollover
risk remains a key objective in the management of
states’ market borrowings. The state governments
issue dated securities, termed state development
loans (SDLs), of varying tenors. As a debt manager
of the states, the Reserve Bank initially underwrote
states’ borrowings, but with financial market
development, banks and financial institutions have
been subscribing directly to these securities
floated through a process managed by the
Reserve Bank. The method of issuance of
market loans has, however, migrated from the
administratively controlled system to an auctionbased
system for all the states since 2006-07. The share of market borrowings in the total liabilities of
the states has moved up from 12.2 per cent as at
end-March 1991 to 21.1 per cent as at end-March
2005 and further to 37.1 per cent as at end-March
2012.
6.10 State governments, unlike the centre, cannot
borrow externally. The centre plays the role of an
intermediary in the transfer of external borrowings
to the states. Previously, the centre would on-lend
the proceeds in rupees at harder terms, after
adjusting for exchange rate exposure and
elongation of maturities. With the change in lending
policy after 2007 in light of the Twelfth Finance
Commission’s (FC-XII) recommendation, the
entire loan proceeds are passed through directly
by the centre to the states under the same terms
as given by the creditor. The states bear the
currency and the refinancing risk, but most states
do not undertake an impact evaluation of the cost-risk
trade-offs of such borrowings on their total
debt portfolios.
3. Evolution of Debt of the State Governments
in India
6.11 The evolution of states’ debt since the 1980s
can broadly be divided into four phases, viz.,
(i) 1980-81 to 1997-98, (ii) 1998-99 to 2003-04,
(iii) 2004-05 to 2007-08 and (iv) 2008-09 to
2012-13 (BE). The first phase was characterised
by revenue balance and fiscal deficit with moderate
debt levels at around 21 per cent of GDP and a
tolerable interest burden covering close to 12 per
cent of revenue receipts3 (Table VI.2). The fiscal
deficits during this period were mainly financed
through loans from the centre; small savings
collections earmarked for the states were also
intermediated through these loans. Market
borrowings played a subordinate role and its share in states’ debt remained quite low. The states were
able to contain the bulging debt servicing
obligations, as the financial surpluses of the
household sector were tapped through mandated
investments made by financial intermediaries in
government securities (including that of states) at
lower than market clearing rates. The major
proportion of state government securities were
held by commercial banks, followed by the Life
Insurance Corporation of India and provident
funds. The Reserve Bank did not subscribe to
state government securities.
Table VI.2: Key Fiscal Indicators of States in
various phases |
(Per cent) |
Indicator |
Phase
I (1980-81 to 1997-98) |
Phase
II
(1998-99
to
2003-04) |
Phase
III
(2004-05
to
2007-08) |
Phase
IV
(2008-09
to
2012-13) |
1 |
2 |
3 |
4 |
5 |
|
Averages |
| Revenue Deficit/GDP |
0.3 |
2.5 |
-0.0 |
-0.1 |
Gross Fiscal Deficit/
GDP |
2.7 |
4.1 |
2.3 |
2.4 |
Primary Deficit/GDP |
1.3 |
1.7 |
-0.0 |
0.7 |
Interest Payments/
Revenue Receipts |
12.2 |
23.4 |
19.2 |
13.3 |
Outstanding Debt/
GDP
(as at end-March of
the ending year of
Phase) |
21.0 |
31.8 |
26.6 |
21.9 |
6.12 The second phase reflected significant
deterioration in all key deficit indicators of the state
governments following the implementation of the
Fifth Pay Commission Award; significant losses
incurred by state public sector undertakings
(SPSUs) also adversely impacted the non-tax
revenues of the states. As a result, the outstanding
debt-GDP ratio of the states at the consolidated
level grew from 21.0 per cent during 1997-98 to its
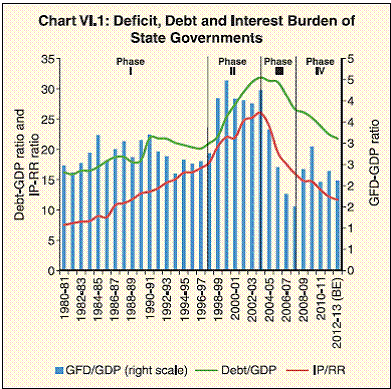
peak of 31.8 per cent during 2003-04 (Table VI.3).
Interest payments as a share of revenue receipts (repayment burden) rose in tandem, from 17.9 per
cent to 26.0 per cent over the same period. This
period, was generally characterised by higher
interest rates, with the gradual liberalisation of
interest rates; the average interest rate on states’
borrowings was over 10 per cent during this period
(Chart VI.1). Concomitantly, interest payments to revenue receipts ratio, at 23.4 per cent during this
phase was significantly higher than the 15 per
cent considered tolerable for a sustainable debt
level (Dholakia et al., 2004).
Table VI.3: Outstanding Liabilities of States
(As at end-March) |
(Per cent to GSDP) |
State |
Phase |
Phase |
Phase |
Phase |
I |
II |
III |
IV |
1998 |
2004 |
2008 |
2013 |
1 |
2 |
3 |
4 |
5 |
I. Non-Special Category States |
|
|
|
|
Andhra Pradesh |
24.3 |
34.3 |
27.4 |
22.4 |
Bihar |
38.4 |
60.4 |
44.5 |
28.4 |
Chhattisgarh |
- |
27.9 |
18.3 |
13.4 |
Goa |
31.9 |
41.8 |
33.9 |
21.8 |
Gujarat |
22.4 |
37.1 |
30.5 |
26.1 |
Haryana |
21.0 |
27.1 |
19.4 |
16.8 |
Jharkhand |
- |
23.6 |
25.4 |
27.5 |
Karnataka |
20.1 |
30.5 |
22.4 |
22.3 |
Kerala |
29.2 |
40.5 |
33.4 |
27.0 |
Madhya Pradesh |
22.0 |
36.9 |
34.0 |
26.9 |
Maharashtra |
19.0 |
31.4 |
23.9 |
21.0 |
Odisha |
42.3 |
55.5 |
33.8 |
19.5 |
Punjab |
36.8 |
47.5 |
36.6 |
32.0 |
Rajasthan |
30.0 |
47.6 |
39.6 |
28.7 |
Tamil Nadu |
18.8 |
29.5 |
21.1 |
21.7 |
Uttar Pradesh |
35.8 |
54.7 |
46.9 |
37.2 |
West Bengal |
25.7 |
47.3 |
45.6 |
36.3 |
II. Special Category States |
|
|
|
|
Arunachal Pradesh |
35.7 |
73.3 |
59.4 |
38.3 |
Assam |
28.4 |
33.2 |
28.4 |
22.6 |
Himachal Pradesh |
48.6 |
69.4 |
57.4 |
44.4 |
Jammu and Kashmir |
55.8 |
66.4 |
62.1 |
53.7 |
Manipur |
48.2 |
61.4 |
66.8 |
60.3 |
Meghalaya |
26.3 |
40.2 |
33.0 |
29.0 |
Mizoram |
68.6 |
112.1 |
103.5 |
65.9 |
Nagaland |
37.7 |
49.6 |
44.3 |
48.2 |
Sikkim |
38.2 |
70.6 |
68.0 |
40.4 |
Tripura |
35.3 |
53.7 |
38.5 |
30.0 |
Uttarakhand |
- |
40.5 |
31.9 |
29.0 |
All States (in terms of GDP) |
21.0 |
31.8 |
26.6 |
21.9 |
Memo Item: |
|
|
|
|
NCT Delhi |
7.5 |
17.8 |
16.0 |
7.6 |
Puducherry |
- |
24.1 |
31.6 |
40.5 |
 |
6.13 Historically, loans from the centre have been
the most important source of borrowings,
accounting for 57.4 per cent of the total borrowings
of the state governments as at end-March 1991.
Three important developments, viz., i) the
institution of a National Small Savings Fund
(NSSF) effective April 1, 1999, ii) implementation
of the DSS during the period 2002-2005 and
iii) disintermediation of Plan loans from April 1,
2005 in accordance with the FC-XII, along with
financial market developments and states’ ability
to borrow on their own behalf, significantly reduced
the importance of loans from the centre as a
financing item of the states’ fiscal deficit. With the
establishment of the NSSF and the associated
changes in accounting norms, small savings
collections were channelised through NSSF’s
investments in state government securities,
instead of being intermediated by the centre. This
reduced the contribution of fresh loans from the
centre to the accretion to states’ debt. Repayment of loans to the centre under the DSS further
reduced the share of these loans in total
outstanding loans of the states to 26.3 per cent at
end-March 2005.
6.14 NSSF borrowings are inherently inflexible
as they are based more on their availability and
collection within the geographical territory of the
state than the borrowing requirement of the state
(Rangarajan and Prasad, 2012). Thus, this
component of state borrowings is exogenously
determined, over which neither the state nor the
centre has any control. This source emerged as
an important source of borrowings by the state
governments during the second phase, with its
share in total debt rising sharply to 22.0 per cent
as at end-March 2004 from 5.0 per cent as at end-
March 2000. This characterised a shift from centre-controlled
borrowings to the autonomous NSSF
but at a higher cost. During this phase, states were
allowed to use the auction mode, albeit to a limited
extent, for accessing market borrowings. Market
borrowings, as a source of financing fiscal
deficit for the states, increased in importance by
2003-04.
6.15 The third phase (2004-05 to 2007-08) saw
the operationalisation of fiscal rules by most states
and the consequent improvement in their fiscal
deficit-GSDP ratios. The small savings collections
increased sharply during this phase and the states
had to absorb the predominant share of small
savings collections earmarked to them, regardless
of the cost of borrowings. As a result, the states’
recourse to market borrowings to finance fiscal
deficits declined during this phase. By 2006-07,
the states were allowed to raise market borrowings
entirely through the auction route to allow market
determination of yields on their SDLs.
6.16 Market borrowings further grew in
importance for financing fiscal deficits during the
fourth phase and enabled the states to meet the
enhanced financing requirements during 2008-09
to 2009-10 for implementing the Sixth Pay Commission Award and fiscal stimulus measures,
particularly in the wake of a shortfall in small
savings collections. Even after the states reverted
to fiscal correction from 2010-11, the importance
of market borrowings continued, as small savings
collections remained low. During this phase,
market borrowings have emerged as a dominant
source of financing and, on average, accounted
for around 65 per cent of the GFD of states.
6.17 The above phases of states’ debt reflected
only the direct liabilities of states. The state
governments also incur contingent liabilities in the
form of guarantees issued to SPSUs, which
devolve on them in case of default by these
undertakings. The above phases mirrored the
changing financing pattern of states’ debt during
the 1990s and 2000s, with a decline in the centre’s
loan intermediation and on-lending (since 1998-
99), an increase in the NSSF borrowings (from
1999-2000) and a move towards market-based
financing since the mid-2000s. The shift in the
sources and methods of states’ borrowing has had
a bearing on the interest payments and fiscal
deficits of the states (Chart VI.2).
6.18 In addition to the shift in the composition of
financing states’ fiscal deficits, the states have benefitted in terms of lower interest cost on market
borrowings, as the timing of the issuance of state
government securities was modulated in line with
market conditions to minimise interest costs. This
was facilitated by the moderation in fiscal
imbalances, following various institutional and
fiscal reforms including the enactment of the Fiscal
Responsibility and Budget Management (FRBM)
Acts by the state governments since the first half
of the 2000s.
4. Role of Finance Commissions in States’
Debt Sustainability
6.19 Various Finance Commissions (FCs) have
expressed concern over the growing debt of the
states and highlighted the need to consider the
cost of debt while ensuring efficient and productive
use of borrowed funds. It has been noted that
there is need to restrict the future growth of debt of
states through elimination of their revenue deficits.
In addition, the borrowed funds need to be used
efficiently and productively for financing capital
expenditure to improve growth prospects and, in
turn, the debt servicing capacity of states.
6.20 Debt sustainability and debt relief issues
have been considered since the time of the Second
Finance Commission (FC-II), although they have
gained more importance from the mid-1980s, with
successive FCs recommending debt relief
measures of varying magnitudes and bringing in
fiscal performance-linked debt relief measures to
help states achieve debt sustainability of a more
enduring nature. The debt relief granted by various
FCs took the form of (i) debt consolidation on
common terms and reduction of interest rates,
(ii) rescheduling of loans to elongate the repayment
period without changes in interest rates,
(iii) moratorium on interest payments and
repayment of principal for a certain period,
(iv) debt write-offs and (v) introduction of schemes
that linked debt relief to fiscal performance
(Table VI.4). Until the Eighth Finance Commission
(FC-VIII), FCs were mandated to suggest debt relief measures with regard to the overall non-Plan
capital gap of states and the purpose of utilisation
of central loans while also taking into account the
requirements of the centre. From the Ninth Finance
Commission (FC-IX) onwards, the commissions
were mandated to review the debt position of the
states as a whole and suggest corrective
measures. FC-IX recommended general debt
relief in relation to Plan loans and linked the extent of relief to performance in respect of investment
made in infrastructure projects and improvements
in financial and managerial efficiency. The Tenth
Finance Commission (FC-X) and Eleventh
Finance Commission (FC-XI) linked debt relief
with fiscal performance. However, it was not until
the Twelfth Finance Commission (FC-XII) that
debt relief was linked explicitly to rule-based
legislative reforms. In a path-breaking move, the FC-XII recommended debt relief for states
contingent upon the enactment of fiscal
responsibility laws and incorporation of a fiscal
correction path, with milestones for attaining fiscal
targets. In keeping with the diverse fiscal situation
in states, the Thirteenth Finance Commission
(FC-XIII) recommended a state-specific approach
for fiscal adjustment based on past fiscal
performance (with 2007-08 as the base year), and
prescribed differentiated adjustment paths for
different groups of states.
Table VI.4 : Debt Relief Measures Recommended by the Finance Commissions |
Finance Comm ission |
Year of Report |
Debt consolidation and rescheduling at lower interest rates |
Rescheduling of loans without lowering of interest rates |
Moratorium on interest payments and repayments |
Debt write-off |
Debt relief linked to fiscal performance |
Other recommendations |
1 |
2 |
3 |
4 |
5 |
6 |
7 |
8 |
Second |
1957 |
√ |
|
|
|
|
|
Sixth |
1974 |
|
√ |
|
|
|
Uniform relief in respect of certain categories of loans and discriminatory relief based on certain principles (relative burden of debt) in regard to other loans. |
Seventh |
1978 |
√ |
|
|
√ |
|
Categorised central loans into non-productive, semi-productive and productive purposes. Small savings loans may be treated as ‘loans in perpetuity’. |
Eighth |
1984 |
√ |
|
√ |
√ |
|
Grouped states into four categories for the purpose of formulation of debt relief proposals in respect of central loans. |
Ninth |
1989 |
√ |
|
√ |
√ |
|
General debt relief in relation to Plan loans and linked to performance in respect of investments in power and road transport sectors. Two-year moratorium on principal and interest payments in respect of special loans given to Punjab. |
Tenth |
1995 |
√ |
|
|
√ |
√ |
A scheme for general debt relief for all
states linked to fiscal performance; and
all special category states and states
with debt problem warranting special
attention. Also recommended setting
up sinking funds for amortisation of
debt and a scheme for encouraging
retirement of debt from disinvestment
proceeds of state governments. |
Eleventh |
2000 |
|
|
√ |
√ |
√ |
Recommended setting up an incentive
fund in the form of Fiscal Reform Facility
(FRF); placing limits on guarantees given
by the states through suitable legislation,
and to be part of overall limits to
borrowings under Articles 292 and 293.
This limit also should include borrowings
from public account and other sources.
Also emphasised the need to set up a
sinking fund for the amortisation of debt. |
Table VI.4 : Debt Relief Measures Recommended by the Finance Commissions (Concld.) |
Finance
Commi ssion |
Year of
Report |
Debt
consolidation
and
rescheduling
at lower
interest
rates |
Rescheduling
of loans
without
lowering of
interest rates |
Moratorium
on interest
payments
and
repayments |
Debt
Write-off |
Debt
relief linked
to fiscal
performance |
Other recommendations |
1 |
2 |
3 |
4 |
5 |
6 |
7 |
8 |
Twelfth |
2005 |
√ |
|
|
√ |
√ |
Two-pronged approach to debt relief, viz., (a) a general scheme of debt relief
applicable to all states that enact their Fiscal Responsibility Legislations and (b) a debt write-off scheme linked to fiscal performance as an incentive for achieving revenue balance by 2008-09.
Recommended a debt consolidation
and relief facility (DCRF) for its award period 2005-10. It also recommended
disintermediation of central loans
except in the case of fiscally weak states that are not able to raise loans. |
Thirteenth |
2009 |
√ |
|
|
√ |
√ |
Resetting of interest rate at 9 per cent on loans to states from the NSSF
contracted until 2006-07 and outstanding as at the end of 2009-10. Central loans
given to state governments for centrally
sponsored schemes/ central plan schemes through ministries other than the Ministry of Finance, outstanding as at the end of 2009-10 to be written off,
subject to states legislating/ amending their FRBM Acts. Benefit of the DCRF
(debt consolidation and interest rate reduction) to be extended to states that could not avail of the same earlier,
provided they enact the FRBM Act. |
Source: Reports of the various Finance Commissions, India. |
5. Central Government Measures to Restructure
States’ Debt
6.21 To alleviate the interest and debt burden of
states, measures were implemented by the centre
in the early 2000s. The Government of India
formulated a debt swap scheme (DSS) during
2002-03 to mitigate the burden of interest
payments on the states, and supplement their
efforts towards fiscal management. The Debt
Consolidation and Relief Facility (DCRF)
introduced during 2005-06, based on
recommendations of the FC-XII, provided debt
relief through debt consolidation.
Debt Swap Scheme
6.22 The DSS was in operation from 2002-03 to
2004-05 and capitalised on the prevailing low
interest regime, to enable states to prepay high
cost loans contracted from the central government,
through low cost market borrowings and proceeds
from small savings. Accordingly, these loans were
swapped with additional market borrowings of the
states (allocated under the DSS in addition to the
normal borrowing allocations) and their net small
savings proceeds (up to specified limits) at the
prevailing interest rates, over a period of three
years ending in 2004-05. The outstanding high
cost debt of the states as a proportion to total
outstanding debt as at end-March 2002 was 16.5
per cent, with non-special category (NSC) states accounting for around 94 per cent. Among the
NSC states, West Bengal had the highest
proportion of high-cost debt in its total debt (23.2
per cent) as at end-March 2002, followed by
Gujarat (20.0 per cent), Maharashtra (19.7 per
cent) and Haryana (17.8 per cent). Among the
special category (SC) states, Himachal Pradesh
had the highest share of high-cost debt to total
debt at 20.2 per cent, followed by Arunachal
Pradesh (18.6 per cent) (Table VI.5).
6.23 Of the total debt swapped between 2002-03
and 2004-05 amounting to `1020.3 billion, about
`535.7 billion (52.5 per cent) was financed through
additional market borrowings at interest rates
below 6.5 per cent, i.e., at less than half the earlier
cost, and the remaining `483.9 billion (47.4 per
cent) was financed through the issue of special
securities to the NSSF at interest rates fixed at 9.5
per cent, i.e., at less than three-fourths of the
earlier rate of 13 per cent (Table VI.5). The states
that relied on additional market borrowings for
swapping their high-cost debt included Punjab,
West Bengal, Bihar, Odisha and Kerala. The states
that financed their high-cost debt predominantly
through issuance of special securities to the NSSF
were Maharashtra, Goa, Tamil Nadu and Gujarat.
Among the states, Maharashtra had the largest
share (14.4 per cent) in the total debt swapped,
followed by Uttar Pradesh (11.0 per cent), Gujarat
(9.5 per cent) and West Bengal (9.0 per cent).
6.24 Clearly, this scheme reduced the interest
burden of states. The average interest on the debt
stock aggregated across states showed a decline
from 10.4 per cent in 2001-02 to 9.6 per cent by
2004-05. However, the DSS, ipso facto, had been
debt neutral as it involved the swapping of one
form of debt with another. While the repayment of
loans to the centre reduced the debt of the states,
the additional markets borrowings and small
savings transfers increased the debt by an equal
magnitude. Over the scheme period (2002-03 to 2004-05), interest savings on account of lower
interest payments helped reduce the pressure on the states’ revenue account and, thereby, on their
overall borrowing requirements.
Table VI.5: State-wise amounts adjusted under the Debt Swap Scheme (DSS)
during 2002-03 to 2004-05 |
(Amount in ` billion) |
States/Year |
Outstanding
high cost
loan as on
March 31,
2002 |
Outstanding
high cost
loans/
Outstanding
debt as at
end-March
2002
(Per cent) |
2002-03 |
2003-04 |
2004-05 |
Total Debt
swapped
till March,
2005. |
Debt swapped |
Debt Swapped |
Debt Swapped |
AOMB |
SSL |
Total |
AOMB |
SSL |
Total |
AOMB |
SSL |
Total |
1 |
2 |
3 |
4 |
5 |
6 |
7 |
8 |
9 |
10 |
11 |
12 |
13 |
I. Non-Special Category (NSC) States |
1 Andhra Pradesh |
68.93 |
14.2 |
8.27 |
3.34 |
11.61 |
16.62 |
10.73 |
27.35 |
14.76 |
19.49 |
34.25 |
73.21 |
2 Bihar |
49.83 |
14.6 |
5.97 |
1.91 |
7.88 |
12.18 |
6.21 |
18.39 |
9.10 |
9.20 |
18.30 |
44.58 |
3 Chhatisgarh |
12.45 |
15.3 |
1.49 |
0.61 |
2.10 |
2.93 |
2.03 |
4.96 |
1.07 |
3.58 |
4.65 |
11.72 |
4 Goa |
3.74 |
9.9 |
0.45 |
0.21 |
0.66 |
1.20 |
1.42 |
2.62 |
0.00 |
0.78 |
0.78 |
4.06 |
5 Gujarat |
95.64 |
19.9 |
11.47 |
5.98 |
17.45 |
21.73 |
19.43 |
41.16 |
12.49 |
25.50 |
37.99 |
96.60 |
6 Haryana |
31.63 |
17.8 |
3.79 |
1.51 |
5.30 |
7.51 |
5.12 |
12.63 |
5.69 |
8.51 |
14.20 |
32.13 |
7 Jharkhand |
16.87 |
16.9 |
2.05 |
1.16 |
3.21 |
2.66 |
4.13 |
6.79 |
2.28 |
2.47 |
4.75 |
14.75 |
8 Karnataka |
50.78 |
16.2 |
6.09 |
2.22 |
8.31 |
11.97 |
8.20 |
20.17 |
10.88 |
17.06 |
27.94 |
56.42 |
9 Kerala |
28.72 |
9.7 |
3.44 |
1.18 |
4.62 |
6.71 |
4.94 |
11.65 |
4.68 |
5.11 |
9.79 |
26.06 |
10 Madhya Pradesh |
34.32 |
13.2 |
4.11 |
1.77 |
5.88 |
7.86 |
7.22 |
15.08 |
3.98 |
8.29 |
12.27 |
33.22 |
11 Maharastra |
154.34 |
19.6 |
0.00 |
0.00 |
0.00 |
36.27 |
28.98 |
65.25 |
18.46 |
63.01 |
81.47 |
146.71 |
12 Odisha |
32.28 |
11.5 |
3.87 |
0.88 |
4.75 |
6.45 |
2.31 |
8.76 |
3.08 |
5.35 |
8.43 |
21.94 |
13 Punjab |
59.76 |
16.7 |
7.17 |
2.75 |
9.92 |
14.40 |
10.13 |
24.53 |
12.80 |
6.34 |
19.14 |
53.59 |
14 Rajasthan |
57.81 |
13.9 |
6.93 |
3.41 |
10.34 |
10.96 |
8.32 |
19.28 |
11.56 |
16.80 |
28.36 |
57.98 |
15 Tamil Nadu |
57.49 |
14.7 |
6.89 |
2.53 |
9.42 |
13.41 |
11.36 |
24.77 |
9.36 |
23.66 |
33.02 |
67.21 |
16 Uttar Pradesh |
160.98 |
16.8 |
14.48 |
5.73 |
20.21 |
30.88 |
17.98 |
48.86 |
15.86 |
26.91 |
42.77 |
111.82 |
17 West Bengal |
154.13 |
23.2 |
0.00 |
0.00 |
0.00 |
33.65 |
21.42 |
55.07 |
23.35 |
13.33 |
36.69 |
91.76 |
Total NSCS |
1069.67 |
16.6 |
86.47 |
35.18 |
121.65 |
237.40 |
169.92 |
407.32 |
159.39 |
255.40 |
414.79 |
943.76 |
II. Special Category (SC) States |
1 Arunachal Pradesh |
1.47 |
18.6 |
0.18 |
0.02 |
0.20 |
1.10 |
0.11 |
1.21 |
0.00 |
0.05 |
0.05 |
1.45 |
2 Assam |
19.26 |
16.1 |
2.31 |
0.62 |
2.93 |
4.57 |
3.59 |
8.16 |
2.43 |
3.33 |
5.76 |
16.85 |
3 Himachal Pradesh |
20.31 |
20.2 |
2.44 |
0.46 |
2.90 |
5.16 |
1.73 |
6.89 |
4.35 |
3.15 |
7.50 |
17.30 |
4 Jammu & Kashmir |
14.95 |
15.5 |
1.77 |
0.00 |
1.77 |
3.89 |
1.96 |
5.85 |
3.20 |
2.29 |
5.49 |
13.11 |
5 Manipur |
1.52 |
8.1 |
0.18 |
0.02 |
0.20 |
1.08 |
0.06 |
1.14 |
0.00 |
0.05 |
0.05 |
1.39 |
6 Meghalaya |
1.43 |
9.4 |
0.17 |
0.03 |
0.20 |
0.77 |
0.15 |
0.92 |
0.00 |
0.23 |
0.23 |
1.35 |
7 Mizoram |
1.08 |
6.3 |
0.13 |
0.02 |
0.15 |
0.66 |
0.08 |
0.74 |
0.00 |
0.08 |
0.08 |
0.96 |
8 Nagaland |
1.20 |
6.4 |
0.14 |
0.02 |
0.16 |
0.87 |
0.04 |
0.91 |
0.00 |
0.03 |
0.03 |
1.10 |
9 Sikkim |
0.66 |
7.1 |
0.00 |
0.01 |
0.01 |
0.45 |
0.07 |
0.52 |
0.06 |
0.09 |
0.15 |
0.67 |
10 Tripura |
3.09 |
10.9 |
0.37 |
0.16 |
0.53 |
1.28 |
0.44 |
1.72 |
0.00 |
0.80 |
0.80 |
3.05 |
11 Uttarakhand |
8.53 |
17.0 |
5.84 |
0.65 |
6.49 |
9.75 |
1.28 |
11.03 |
0.00 |
1.82 |
1.82 |
19.34 |
Total SCS |
73.50 |
15.2 |
13.53 |
2.01 |
15.54 |
29.57 |
9.51 |
39.08 |
10.04 |
11.92 |
21.96 |
76.57 |
Grand Total |
1143.17 |
16.5 |
100.00 |
37.19 |
137.19 |
266.97 |
179.43 |
446.40 |
169.43 |
267.32 |
436.75 |
1020.34 |
AOMB: Additional Open Market Borrowings. SSL: Small Savings Loans
Source : Ministry of Finance, GoI |
Debt Consolidation and Relief Facility (DCRF)
6.25 The DCRF, recommended by the FC-XII,
had two components of relief, viz., debt
consolidation and debt write-off. Debt consolidation
provided for consolidation of all central loans (from
the MoF) contracted by the states until March 31,
2004 and outstanding as on March 31, 2005 into
fresh loans for 20 years to be repaid in 20 equal
installments carrying a lower interest rate of 7.5
per cent, subject to the condition that the state
government concerned enacted its FRBM Act.
Repayments due from states during the period
2005-06 to 2009-10 on these loans were eligible
for write-off. The quantum of debt write-off was
linked to the absolute amount by which the revenue
deficit was reduced in each successive year during
the award period. The debt write-off scheme was
also linked to absolute reduction of the revenue
deficit with a set of conditionalities. For year t, the
yearly write-off was obtained by applying a given
ratio for each state to the absolute reduction in the
revenue deficit in year (t-1), relative to year (t-2).
There was also a minimum condition. The write-off
in year t was enabled only if the absolute fall in the
revenue deficit in year (t-1) relative to year (t-2)
exceeded the amount of the interest concession in
year t. Both these applied to the absolute revenue
deficit. There was also a requirement that the fiscal
deficit should be capped at the absolute amount in
2004-05. However, if a state was able to bring its
revenue deficit down to zero by the targeted year
i.e., 2008-09, the entire repayments due from the
state during the FC-XII award period were to be
written off.
6.26 The scope of the DCRF excluded two
categories of loans, viz., loans in the form of the
NSSF’s investment in state government special
securities and central loans given to state
governments for centrally-sponsored schemes/
central plan schemes through central ministries/
departments other than the Ministry of Finance.
NSSF investments were excluded from the scope
of debt relief on the ground that the NSSF is
maintained in the public account of the Government
of India, and central loans not administered by the
MoF were excluded on the ground that data for the
same were not available.
6.27 Twenty-six states availed of debt
consolidation during the period 2005-06 to 2009-
10; the details at the consolidated level are given
in Table VI.6. Sikkim and West Bengal failed to
receive the benefit of debt consolidation during
the period, not having met the condition of enacting
the FRL. Cumulatively, central loans amounting to
`1223.5 billion have been consolidated, which is
lower than the FC-XII estimate by `64.5 billion.
The difference is attributable to a disparity in the
actual base year stock of debt and delays in
enactment of FRLs by some states. The debt
consolidation resulted in interest relief amounting
to `186.9 billion to these states during the period
2005-06 to 2009-10 as against `212.8 billion
estimated by the FC-XII. As regards the debt relief
component, a total benefit of `197.3 billion accrued
to the states by the end of 2009-10.
6.28 The FC-XIII extended the DCRF to the two
states of Sikkim and West Bengal during 2010-15,
provided they put in place their FRBM Act. Effective
from 2010-11, the loans of West Bengal and
Sikkim too have been consolidated on the terms
and conditions of the FC-XII, as these two states
enacted their FRBM Acts in 2010.
Table VI.6: Summary of Performance
under the CRF |
(` billion) |
Item |
Estimated by
FC-XII for 2005-10 |
Availed of by States
under the DCRF |
1 |
2 |
3 |
Debt Consolidation |
1288.0 |
1223.5 |
Interest Relief |
212.8 |
186.9 |
Debt Relief (waiver) |
322.0 |
197.3 |
6.29 NSC states accounted for 94 per cent of the
total debt consolidated, while the share of SC
states amounted to 6 per cent. In absolute terms,
Uttar Pradesh, Andhra Pradesh and Gujarat,
among the NSC states, have benefitted the most
in terms of debt consolidation, while Assam and
Himachal Pradesh were the major beneficiaries
among the SC states (Table VI.7).
Table VI.7: State-wise Debt Relief and
Interest Relief
on account of the DCRF |
(` billion) |
State |
2005-06 to 2009-10 |
Debt
Consolidation |
Debt
Relief |
Interest
Relief |
1 |
2 |
3 |
4 |
I. Non-Special Category (NSC) States |
1 Andhra Pradesh |
140.6 |
25.9 |
25.2 |
2 Bihar |
77.0 |
7.7 |
12.7 |
3 Chhattisgarh |
18.7 |
4.7 |
3.1 |
4 Goa # |
4.0 |
0.4 |
0.6 |
5 Gujarat |
94.4 |
17.3 |
16.7 |
6 Haryana |
19.3 |
2.9 |
3.0 |
7 Jharkhand * |
21.0 |
3.1 |
2.1 |
8 Karnataka |
71.7 |
14.3 |
13.1 |
9 Kerala |
41.8 |
2.5 |
7.0 |
10 Madhya Pradesh |
72.6 |
18.2 |
13.2 |
11 Maharashtra |
68.0 |
13.6 |
9.9 |
12 Odisha |
76.4 |
19.1 |
9.6 |
13 Punjab |
30.7 |
3.7 |
6.0 |
14 Rajasthan |
61.7 |
9.3 |
8.9 |
15 Tamilnadu |
52.7 |
13.2 |
9.1 |
16 Uttar Pradesh |
212.8 |
31.9 |
39.1 |
17 West Bengal $ |
86.3 |
0.0 |
0.0 |
Total NSCS |
1149.6 |
187.8 |
179.3 |
II. Special Category (SC) States |
1 Arunachal Pradesh |
4.0 |
0.4 |
0.7 |
2 Assam |
21.1 |
4.2 |
1.6 |
3 Himachal Pradesh |
9.1 |
1.2 |
1.6 |
4 J&K |
15.2 |
0.0 |
1.0 |
5 Manipur |
7.5 |
1.5 |
0.3 |
6 Meghalaya # |
3.0 |
0.4 |
0.4 |
7 Mizoram # |
2.6 |
0.3 |
0.4 |
8 Nagaland |
3.2 |
0.3 |
0.6 |
9 Sikkim $ |
1.1 |
0.0 |
0.0 |
10 Tripura |
4.4 |
0.9 |
0.8 |
11 Uttarakhand |
2.6 |
0.3 |
0.3 |
Total SCS |
73.9 |
9.5 |
7.6 |
III. Grand Total |
1223.5 |
197.3 |
186.9 |
# Consolidation effective from 2006-07.
* Consolidation effective from 2007-08.
$ Consolidation effective from 2010-11, under recommendations of
13th Finance Commission.
Source: Indian Public Finance Statistics 2011-12, MoF, GoI. |
6.30 The consolidated debt of the states as a
proportion to total outstanding debt as at end-
March 2009 was 7.4 per cent. Odisha, Bihar and
Chhattisgarh, among the NSC states, had the
largest proportion of outstanding debt, which was
consolidated during the period 2005-10. Within
the SC states, the proportion of consolidated debt
to total debt was the highest for Manipur, followed
by Arunachal Pradesh. The resultant interest rate
relief to all the states in aggregate was, on average,
3.8 per cent of the interest payments during the
period 2005-06 to 2009-10. Uttar Pradesh, Bihar,
Andhra Pradesh and Madhya Pradesh have
benefitted the most among the NSC states, while
Arunachal Pradesh and Tripura benefitted the
most among the SC states. The debt waiver was
2.7 per cent of central loans for all the states
during the period 2005-2010. With regard to the
debt waiver component, Odisha, Chhattisgarh
and Madhya Pradesh have benefitted the most
among the NSC states while Tripura and Assam
benefitted the most among the SC states (Table
VI.7).
6.31 Reflecting the impact of the DCRF in terms
of debt write-off and interest relief on outstanding
central loans, there has been a significant
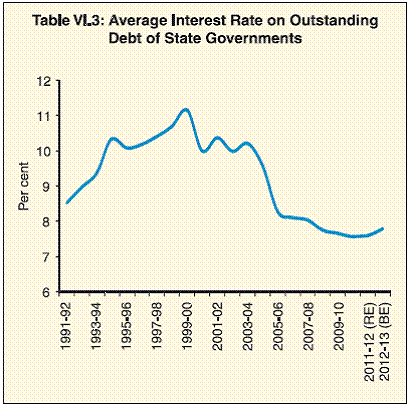
reduction in the average interest rate paid on
outstanding debt since 2004-05 (Chart VI.3).
6. Role of Fiscal Rules in Debt Sustainability
6.32 In order to ensure fiscal discipline, ex ante
fiscal and debt rules for sub-national governments
(SNGs) have been introduced in several countries.
These rules take the form of stipulations, such as setting limits on the stock of debt or the issuance
of new debt; restricting the use of long-term
borrowings to public capital investments only,
thereby entailing balanced budgets net of
investments; linking debt stock limits to key fiscal
variables such as the cost of debt service or the
ability to service the debt; and establishing medium-term fiscal responsibility frameworks,
indicating a desirable debt path and transparent
budgetary processes. Often stipulation of
appropriate limits for debt of SNGs is subject to
intensive debates, given the scope of bail-outs/
support available from the central government.
The debt ceilings are also supplemented by a
ceiling on public guarantees in fiscal rules to
minimise the circumvention of debt ceilings
through the issuance of guarantees (Minassian,
2010). In India, all the state governments have
enacted their FRBM Acts (Box VI.1). While only 18
states had specific debt ceilings in their original
FRBM Acts, all states except Goa have amended
their FRBM Acts and have adopted the annual
debt targets set by the FC-XIII. The design of fiscal
rules varied across states, although there has
been a move towards standardisation in the
process of enactment of amended FRLs. The debt
ceilings in the original FRBM Acts were linked to
three indicators, viz., GSDP, revenue receipts and
receipts in the consolidated fund of the states.
However, in pursuance of the FC-XIII’s
recommendations, all the states have fixed their
debt ceilings in terms of GSDP (Annex).
 |
Box VI.1
Fiscal Rules at the Sub-National Level
Vertical imbalances in revenue and expenditure assignments
pose challenges for the fiscal discipline of sub-national
governments (SNG). Increased obligations of SNGs without
a commensurate increase in revenues necessitate recourse
to debt. Both in developed and developing countries, free-spending
SNGs exhibit a tendency to build up unsustainable
deficits that may call upon central governments to provide
special bail-out transfers or otherwise assume their liabilities
(Rodden, 2001). Buiter and Patel (2010) have given four
reasons for unease when a country’s public sector debt
and deficit are high and/or rising. First, there is a possibility
of the government becoming insolvent. Second, financial
crowding out could take place. Third, unsustainable fiscal
policy could contribute to volatility and uncertainty, which,
in turn, may adversely affect investment and growth. Fourth,
monetisation of persistent deficit could have inflationary
consequences.
Over the past three decades, fiscal institutional
arrangements, such as fiscal rules and medium-term budget
frameworks, have been put in place around the world in
support of more prudent and more balanced fiscal policies
(Schaechter et al., 2012). There are four inter-related
objectives for fiscal rules: (a) long-term fiscal sustainability
(b) short-term economic stability; (c) aggregate efficiency,
in the form of balancing the marginal excess burden arising
from the taxes with the marginal benefits of public spending;
and (d) allocative efficiency of public spending, as reflected
in the matching of public services with local preferences
(Sutherland et al., 2005). Fiscal rules also help overcome coordination
problems between different levels of government
and strengthen fiscal discipline by correcting incentives,
enhancing accountability and anchoring economic agents’
expectations (Escolano et al., 2012).
Fiscal rules may be numerical or procedural. The first type
of rules sets intermediate objectives - budget balance
requirements, debt accumulation constraints and limits
on expenditure - that help achieve fiscal policy goals and
ensure fiscal sustainability. The second type of rules focuses
on the process of implementing objective-setting fiscal
rules, such as requirements for transparency in financial
accounting, reporting and monitoring; sanctions levied in
case of violation; and flexibility in fiscal rules under certain
circumstances.
The choice of an appropriate fiscal rule depends on the
wider budgetary setting and institutional arrangements
governing the relationship between the centre and SNGs,
and is influenced by the following factors: (1) Expenditure
assignments - If decentralised provisions involve politically-sensitive
public services to be provided by the SNGs,
it will become difficult for central governments to resist
bailing out deficit-prone SNGs; (ii) Revenue assignment -
The source of income assigned to SNGs affects the fiscal
rules needed, because disparity between income and
expenditure assignments often requires mitigation from a
fiscal rule and SNGs with more revenue autonomy tend to
run smaller deficits; (iii) Market discipline -Financial markets
can substitute for other monitoring mechanisms of SNGs
by imposing higher borrowing costs on SNGs pursuing
imprudent fiscal policies; (iv) Political setting - This can
influence the requirement of fiscal rules for SNGs.
Fiscal rules introduce some trade-offs and side effects. First,
budget balance requirements and borrowing constraints
make fiscal policy pro-cyclical. A rule that covers total
spending could be biased against investment, because it is
easier to alter capital expenditure than current expenditure
in the short term, leading to allocative inefficiencies.
Second, growth of taxation and spending could be
controlled by tax and expenditure limits, but this could lead
to allocative distortions. Limits on expenditure are related to
lower borrowing costs, while more stringent tax limits tend
to be associated with higher borrowing costs that are seen
by financial market participants as introducing a greater
risk of default. Expenditure limits applied across the board
may lead to rationing of key public services. Third, rules
having limited coverage could be easily evaded by SNGs;
for example, tax limitations may provoke a shift in revenue
raising through user charges and service fees.
Faced with different objectives and trade-offs, SNGs need
to adopt multiple rules. The conflicts are often resolved in
different ways. First, the design of the rule can factor in the
main source of bias in spending. Second, when politically-induced
spending is expected to cause expenditure drift,
expenditure limit may be better suited for restraining public sector growth. Third, in case cyclical variability in revenues
is important, multi-annual budgets may allow a degree
of flexibility over the cycle, and expenditures influenced
by cyclicality, such as unemployment benefits, can be
excluded from expenditure limits. Fourth, the requirement
to disseminate information on a standardised and regular
basis can work as a deterrent for SNGs to evade the
strictures of the rules.
In a world where information asymmetry exists between
SNGs and the authorities at higher levels of government,
an effective system of monitoring becomes important.
Monitoring could be ex ante, ex post, or both. An ex post
monitoring contributes more to rule adherence than ex ante
monitoring. Nonetheless, ex ante monitoring is important
from the viewpoint of a realistic assessment of the economic
assumptions included in budget forecasts. Such monitoring
could be done by independent bodies that monitor, audit,
and report the budgetary actions of SNGs. The availability
of sufficient standardised information can also serve the
purpose of monitoring.
Financial markets are expected to impose fiscal discipline
on SNGs. While this seems to be the case in the U.S. and
Canada where the interest rate spread gets linked to the
creditworthiness of each sub-national entity, the experience
of SNGs in Germany and Mexico indicates that financial
market discipline may not be sufficient to exert discipline
over sub-national government borrowings. This is attributed
to an implicit bail-out commitment by the central government
or a large share of central transfers in the total revenues
of the SNGs. Lemmen (1999) noted that yields across
Germany are similar irrespective of the financial state of the
lender. Sutherland et al. (2005) found, for a cross-section
of countries, a negative correlation between the strength of
SNG fiscal rules and the increase in SNG debt.
Compliance with rules is complemented by the sanctions
and enforcement mechanism. The credibility of rules is
established through the severity of sanctions (financial or
administrative). In the absence of effective sanctions, failure
to meet targets may only lead to a change in the baseline
target for the next budgetary period. There is also a need for
some flexibility in implementation of rules to ease some of
the problems in coping with unanticipated economic shocks.
A number of countries have adopted numerical fiscal
rules to promote fiscal discipline at the sub-national level.
The incorporation of debt targets in fiscal rules is typically
motivated by a desire to ensure inter-generational equity,
reduce crowding out, provide more room to manoeuvre
fiscal policy in situations of major shocks and absorb
contingent liabilities without threatening debt sustainability.
Brazil, Colombia, Peru, Mexico, Japan, Korea and Hungary
have fiscal rules restricting new borrowings or debt level
or the debt service of their sub-nationals. Considering the
scope for SNG’s borrowings through the ownership and
control of local enterprises and banks, several countries
impose special restrictions on borrowing from or by these
enterprises. While developed countries depend more on
a market-based approach for supervision over SNG’s
debt, emerging economies mostly apply an administrative
approach.
In India, central and state governments have adopted a
rule-based fiscal framework through the enactment of Fiscal
Responsibility Budget Management (FRBM) Acts to provide
impetus to the process of attaining fiscal sustainability. Many
state governments voluntarily introduced their own FRBM
Acts even before the enactment of the FRBM Act in 2003 by
the central government. Karnataka was the first among the
states to enact its FRBM Act in September 2002 followed
by Kerala (2003), Tamil Nadu (2003), and Punjab (2004). All other states were encouraged to adopt such legislations to
avail of the benefits under incentive schemes recommended
by the Twelfth Finance Commission. The report of the ‘Group
on Model Fiscal Responsibility Legislation at State Level
(2005)’ provided guidance to the states for enacting their
FRBM Acts. West Bengal (2010) and Sikkim (2010) were
the last to enact their FRBM Acts. All state governments,
with the exception of Goa, have amended their FRBM Acts
based on the roadmap provided by the Thirteenth Finance
Commission (FC-XIII) for fiscal correction and consolidation
in the medium term4. A study by Simone and Topalova
(2009) on the effect of fiscal rules on the fiscal performance
of states in India found that the contribution of fiscal rules
in the fiscal adjustment of the states was not statistically
significant. However, fiscal adjustment was observed to be
larger in states where the fiscal rules included a specific
debt target or expenditure rules. Available data shows that
states have, over the years, brought down their debt-GSDP
ratios in line with the stipulation in their FRBM Acts.
7. Fiscal Implications of Contingent Liabilities
of the States
6.33 To meet the growing infrastructure
requirements, states have been undertaking
investments under the public-private partnership
(PPP) route through special purpose vehicles
(SPVs), which have often formed partnerships
with private financiers and operators. In addition,
SPSUs in general, and electricity and road
transport sectors in particular, borrow directly from
banks/financial institutions, backed by explicit and
implicit guarantees extended by the state
governments. Thus, apart from the confirmed
liabilities, there are also contingent liabilities of the
state governments that arise on account of
guarantees issued to facilitate the borrowings of
SPSUs/SPVs. The fiscal risk of the state
government guarantees may turn out to be very
high in case these enterprises fail to generate adequate own revenues to meet their repayment
obligations.
6.34 In India, while the fiscal position of the states
in terms of key deficits and debt as ratios to GDP
has shown improvement in recent years, this may
not be as encouraging as it appears if the liabilities
of the SPSUs and contingent liabilities arising out
of guarantees issued to them are taken into
consideration. Contingent liabilities do not form
part of the states’ debt obligations, but in the event
of default by borrowing entities, the states are
required to meet the debt service obligations of
these defaulting entities. Therefore, contingent
liabilities assume importance in the analysis of the
public finances of state governments. In 2001, the
Reserve Bank constituted a working group to
assess the fiscal risk of state government
guarantees. Recognising that a major constraint in
analysing the true fiscal position of states was the absence of a consistent and standard pattern of
reporting data on guarantees in the state budgets,
the group recommended that a uniform format be
used to regularly publish data regarding
guarantees in the state budgets. An internal
working group on ‘Information on state government
guaranteed advances and bonds’ set up by the
Reserve Bank in 2003 emphasised that
transparency in information disclosure was crucial
to enhance market discipline, which also required
proper rating of projects guaranteed by the state
governments. With an increase in fiscal
transparency at the state government level,
particularly after the enactment of the respective
FRBM Acts, the states have started disseminating
information on outstanding guarantees in the
FRBM statements released along with their budget
documents. However, only 14 states publish it in
the prescribed format, of which 9 provide
information on outstanding risk-weighted
guarantees.
6.35 In view of the fiscal implications of
guarantees, many states have taken initiatives to
place ceilings (statutory or administrative) on
guarantees. To contain the fiscal risks associated
with the guarantees, Guarantee Redemption
Funds have been set up by 10 states. Although
there has been a decline in the total outstanding
guarantees extended by state governments, an
increase in the share of guarantees issued to
financially ailing SPSUs is an area of concern.
Moreover, the contingent liabilities of state
governments could be much higher than is evident
from their budget documents/finance accounts, if
the ‘letters of comfort’ extended to SPSUs,
including power utilities, are included.
6.36 As already mentioned, contingent liabilities
of state governments also arise on account of
PPP projects undertaken at the state government
level. The FC-XIII recognised explicit and implicit
obligations for the public entities involved in PPP projects. While explicit contingent liabilities are in
the form of stipulated annuity payments over a
multi-year horizon, implicit contingent liabilities
represent obligations to compensate private
sector partners for contingencies such as changes
in specifications, breach of obligations and early
termination of contracts, and are difficult to
quantify. States are expected to quantify
expenditure obligations relating to PPP projects in
their medium-term fiscal policy statements, with
an increasing number of them adopting the PPP
mode of project implementation.
8. Assessing Debt Sustainability at the SNGs
Level
6.37 The growing importance of sub-national
debt in recent decades reflects the interplay of
three structural factors (Canuto and Liu, 2010).
First, with the progressive drive towards
decentralisation, the expenditure responsibilities
of SNGs have grown in several countries along
with the SNGs being granted revenue-raising
authority and capacity to incur debt by gaining
market access that is available to sovereigns.
Second, unprecedented urbanisation with
concomitant growing infrastructure financing
requirements has prompted SNGs to undertake
borrowings. Following the principle of intergenerational
equity, debt service costs in the case
of such borrowings are spread across generations,
as they also derive benefit from using the
infrastructure over the long term. Third, private
capital has increasingly become a source of subnational
finances and SNG bonds often compete
with bank loans.
6.38 While the overall approach for assessment
of fiscal/debt sustainability of SNGs is similar to
that at the central government level, there are a
few notable differences in respect of sub-national
fiscal sustainability analysis. Unlike the central
government, state governments cannot benefit
from seigniorage revenues as they cannot issue their own currencies. Thus, a state government’s
sustainable level of debt based on its lifetime
budget constraint refers to the outstanding debt
stock level that does not exceed current and future
primary surpluses. By this approach, theoretically
investors would finance debt only if it is deemed
sustainable. De facto, however, credit risks on
SNG borrowings may get compromised in case
there is implicit backing from the central
government. Similarly, spreads of the yields on
sub-national debt over those of the central
government may not reflect fiscal performance, if
market participants factor in history or the
expectation of a bail-out by the centre. The subnational
borrowings may require the central
government’s concurrence. The existence of a
federal framework may also limit the taxation
autonomy of sub-national governments, with
transfers from the central government becoming
key sources of their revenues. In the Indian case,
the central government also influences state
government finances through the wage-setting
process of government employees, thereby
exogenously impacting the committed
expenditures of the states. With the monetary
policy being determined at the national level, state
governments generally tend to be takers of the
general interest rate environment.
6.39 With the adoption of fiscal rules by the Indian
states, there has been considerable progress
towards the re-orientation of government finances
to achieve medium-term fiscal sustainability.
Notwithstanding a deviation from the fiscal
consolidation path following the fiscal stimulus
measures undertaken during the post-global
financial crisis period, the amended fiscal rules
put in place by the state governments underscore
the need for a phased reduction in elevated deficits
and public debts to sustainable levels.
6.40 The issue relating to sustainability of state
government debt in India has been examined by several researchers. Using matrix classification of
states by debt accumulation, primary revenue
balance and own tax buoyancy, Rajaraman et al.
(2005) found that the more indebted states prior to
1997 saw a larger increase in their debt ratio by
2002-03. They also found that the interest rate on
state debt exceeded the nominal growth rate of
GSDP during the period 1997-2002, indicating the
need for overall primary surpluses to stabilise the
debt-GSDP ratio. Goyal et al. (2004) assessed the
inter-temporal budget constraint using cointegration
techniques and found that government
finances were unsustainable both at the central
and state government levels, though there
appeared to be some signs of weak sustainability
of combined finances.
6.41 Against the above backdrop, the
sustainability of state government debt has been
examined using indicator analysis for the
consolidated position of all states, taking the
period averages of various indicators during the
four different phases (Table VI.8). The analysis
shows that while the fiscal position during the
period 1998-99 to 2003-04 was unsustainable in
terms of most indicators, there has been a
substantial improvement in the indicators during
the fiscal consolidation period of 2004-05 to 2007-
08. Not only were the necessary conditions for
sustainability, such as higher growth of GDP than
debt growth and higher real output growth than
real interest rate, fulfilled, but also the primary
balances for the consolidated state governments
were in surplus during 2006-07 and 2007-08.
While the necessary conditions for sustainability
were met during the post-fiscal consolidation
phase (2008-09 to 2012-13), the sufficient
condition of primary surpluses was not met due to
an increase in the primary deficit in the post-crisis
years of 2008-09 and 2009-10. Debt is said to be
tolerable if its servicing does not impose an
intolerable burden on the fiscal position. Interest payments as one-fifth of revenue receipts is
considered a tolerable ratio of interest burden
(Dholakia et al., 2004). Interest payments have
been less than one-fifth of revenue receipts during
the third and fourth phases, contributing to reduced
debt servicing burden (Table VI.8).
6.42 Analysing the vulnerability of individual
states in terms of debt burden (measured in terms
of debt-GSDP ratio) and interest burden (measured
in terms of interest payments-revenue receipts
ratio) provides a useful indication of the
susceptibility that states face. Tables VI.9A and
VI.9B are matrices that classify NSC and SC
states, respectively, based on varying degrees of
vulnerability for the pre-debt consolidation period
(1992-93 to 2001-02) and post-debt consolidation
period (2002-03 to 2011-12 (RE)). In the post-debt
consolidation period, the states have benefitted from interest relief under the DSS scheme during
2002-03 to 2004-05 and debt relief and
consolidation under the DCRF from 2005-06
onwards. As West Bengal could not avail of the
DCRF scheme until its enactment of the FRBM
Act in 2010, it remained the only NSC state with a
high debt-GSDP ratio (over 30 per cent) and a
very high interest burden (over 25 per cent) in the
post-debt consolidation period. The other three
states that were similarly placed, viz., Odisha,
Punjab and Uttar Pradesh, were able to reduce
their interest burden from above 25 per cent to the
‘15-25 per cent’ bracket, but their debt levels
continued to remain over 30 per cent of GSDP.
Goa was the only state whose interest burden
increased in the post-debt consolidation period to
the ‘high’ vulnerability category compared to the
‘medium’ vulnerability category in the pre-debt consolidation period. (Table VI.9A). Among the SC
states, Jammu & Kashmir has benefitted from the
debt consolidation, as its interest burden moved to
the ‘medium’ vulnerability category in the postdebt
consolidation period. Although Sikkim could
avail of the DCRF scheme only in 2010 after it
enacted its FRBM Act, its debt-GSDP and IP-RR
ratios have been low in both the pre-debt
consolidation and post-debt consolidation periods.
Manipur was the only SC state that was worse off
in the post-debt consolidation period, with
deterioration in its debt-GSDP ratio from the ‘high’ vulnerability category to ‘very high’ vulnerability
category (Table VI.9B).
Table VI.8: Fiscal Sustainability of States: An Indicator Analysis |
(Per cent) |
S.
No. |
Indicators |
Symbolic
representation |
1993-94 to
1997-98 |
1998-99 to
2003-04 |
2004-05 to
2007-08 |
2008-09 to
2012-13 (BE) |
1 |
2 |
3 |
4 |
5 |
6 |
7 |
1 |
Rate of nominal growth of GDP (Y) should be
more than rate of growth of debt (D) |
Y |
15.54 |
10.44 |
14.98 |
15.56 |
D |
14.47 |
18.31 |
10.16 |
10.90 |
Y - D >0 |
1.07 |
-7.87 |
4.82 |
4.66 |
2 |
Real output growth (y) should be higher than
real interest rate(r) |
y |
6.33 |
6.02 |
8.83 |
7.44 |
r |
0.87 |
5.99 |
2.35 |
-0.45 |
y - r > 0 |
5.46 |
0.03 |
6.48 |
7.89 |
3 (a) |
Primary Balance should be in surplus |
PB/GDP >0 |
-0.73 |
-1.68 |
0.01 |
-0.71 |
3 (b) |
Primary Revenue Balance (PRB) should be in surplus and adequate to meet interest payments (IP) |
PRB / GDP > 0 |
1.00 |
-0.01 |
2.29 |
1.72 |
PRB/IP>100 |
52.27 |
1.98 |
105.95 |
105.55 |
4 |
Interest Burden defined by Interest Payments (IP) to GDP ratio should decline over time |
IP / GDP↓↓ |
1.82 |
2.45 |
2.28 |
1.66 |
5 |
Interest Payments as a proportion of Revenue Expenditure should decline overtime |
IP / RE ↓↓ |
15.37 |
19.26 |
18.86 |
13.13 |
6 |
Interest Payment as a proportion of Revenue Receipts should fall over time |
IP / RR↓↓ |
16.59 |
23.75 |
18.65 |
13.04 |
Note: 1. Real interest rate is measured as average interest rate (on outstanding debt) minus difference between nominal growth of GDP (Y)and real output growth (y).
2. Negative sign in 3(a) and 3(b) indicates deficit. |
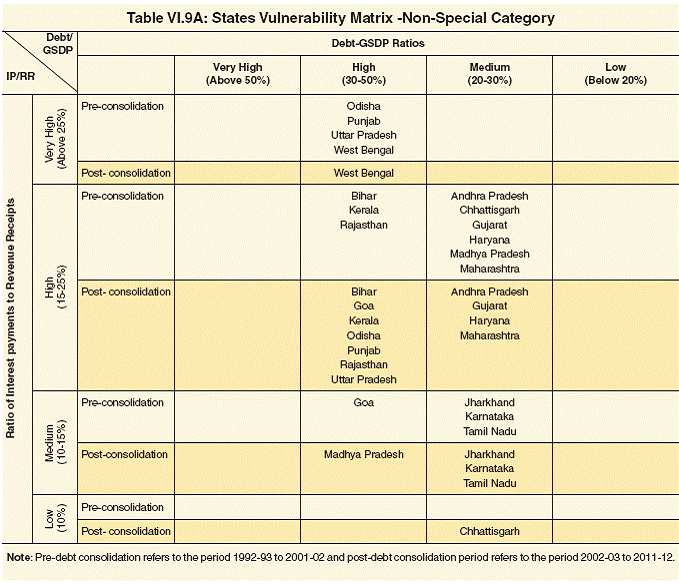 |
6.43 To study the relative importance of various
fiscal and policy variables in the determination of
debt, the indicator analysis for examination of debt
sustainability has been supplemented by a panel
regression analysis on 17 NSC states for the predebt
consolidation and post-debt consolidation
periods. This suggests that during the pre-debt
consolidation phase, fiscal variables, such as own
revenue, central transfers and the different components of expenditure had a significant
impact on the debt dynamics. The growth in
nominal GSDP did not play an important role. In
contrast, during the post-debt consolidation
phase, the growth in nominal GSDP assumed
significance in reducing the debt-GSDP ratio of
the states. Among the other identified explanatory
variables, while own revenue, central transfers
and revenue expenditure continued to remain
significant, capital outlay and net lending lost
some of their significance. The central government
policy initiatives had also contributed in reducing
the interest burden of the states, which was
reflected in the decline in the interest payments to
revenue expenditure ratio during this period. Given
the limited headroom in central government finances, substantial debt and interest relief from
the centre may not be forthcoming. Hence, states
would have to focus on revenue enhancing and
expenditure compression measures, with a greater
emphasis on the latter, to improve their debt
sustainability (Box VI.2).
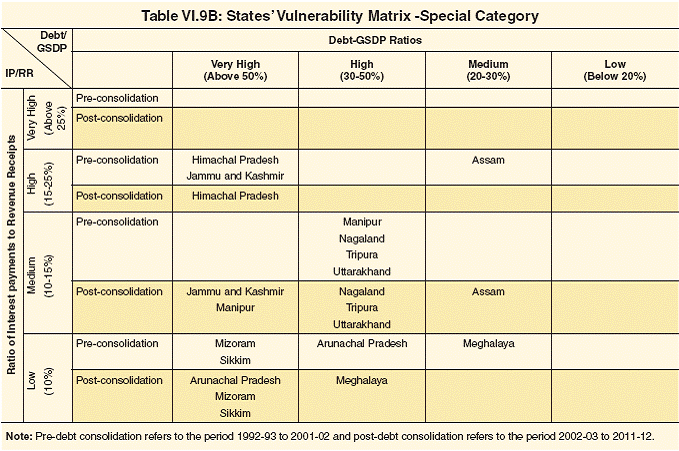 |
9. Concluding Observations and the Way
Forward
6.44 The reversal of the interest rate cycle in the
mid-2000s played a critical role in alleviating the
interest burden on debt and ensuring that the debt
did not grow along an explosive trajectory for the
states in India. This was complemented by efforts
at fiscal consolidation and institutional reforms to
get on the fiscal correction path. Constitutional arrangements and restrictions on borrowing
enabled the onset of fiscal correction in an
appropriate manner. Although states have faced
fiscal stress, systemic insolvency and defaults
have not occurred. The debt and interest relief
provided by the centre were linked with the
implementation of fiscal reforms and thereby
helped avoid moral hazard problems. However,
while the focus has been mainly on direct debt
obligations, contingent liabilities pose a risk to
state finances, unless monitored and adequately
controlled. Moreover, the aggregate picture masks
interstate disparities and vulnerabilities, which
require customised reforms and correction
packages rather than a one-size-fits-all approach.
Although the global financial crisis has had a
relatively insignificant impact on Indian states,
policymakers must take cognisance of the fact
that despite the absence of systemic insolvency
and defaults, high debt reduces the manoeuvrability
and flexibility of policy to respond to shocks.
Strengthened debt management capacity and
institutional arrangements at the state level, with a
more active risk management approach, will be
required to meet future challenges.
Box VI.2
Sustainability of Sub-National Government Debt
Debt sustainability is a term that has been used
with increasing frequency in the academic literature
and multilateral policy discussions, but with different
connotations under different circumstances (Balassone and
Franco, 2000; Chalk and Hemming, 2000). Domar (1944),
who was a pioneer in developing the debt sustainability
framework, postulated that the growth rate of income
exceeding the interest rate was a necessary condition for
debt sustainability. Subsequently, Buiter (1985) suggested
that sustainable policy is one that is capable of keeping the
public sector net worth to output ratio at its current level.
Blanchard (1990) provided two conditions for sustainability:
a) the ratio of debt to GNP should eventually converge back
to its initial level, even if there is excessive variation in the
short term, and b) the present discounted value of the ratio
of primary deficits to GNP should be equal to the negative
of the current level of debt to GNP. The debt sustainability
issue revolves around the SNG’s inter-temporal or the
present value budget constraint.
There is no internationally established threshold for
assessing the sustainability of SNG debt. Debt sustainability
is defined as a level of indebtedness that does not generate
payment difficulties (Quintanilla, 2009) and therefore is
linked to the ability of the government to service its debt.
It is monitored in terms of credit worthiness (solvency)
indicators (nominal debt stock/ own current revenue ratio,
present value of debt service/own current revenue ratio);
and liquidity indicators (debt service/current revenue
ratio and interest payment/current revenue ratio). These
indicators broadly enable an assessment of the ability of
SNGs to service interest payments and repay debt as and
when it becomes due through current and regular sources
of revenues.
Fiscal and debt sustainability are inter-related; the latter
has assumed significance with the adoption of debt rules
as part of a fiscal rules framework. Apart from examining
debt sustainability in a static framework, empirical studies
have also analysed this issue taking into account the
uncertainties about medium-term projections of economic
growth, primary balance, cost of public sector borrowings
and existence of implicit guarantees, and fiscal reaction
functions incorporating dynamic properties of fiscal policymaking.
Further, the evaluation of joint sustainability of the
separate fiscal policies of member countries in the euro
zone has been attempted in a panel framework.
In the Indian context, the debt situation of state governments
has transited from a phase of unsustainable debt levels and
increasing interest burden to a phase of fiscal consolidation
and moderation in debt levels. The improvement in terms
of sustainability indicators in the fiscal consolidation phase reflects the adherence to fiscal rules, including a phased
reduction in debt levels, even though it was also backed by
policy measures viz., debt restructuring/ consolidation and
relief measures. It is against this backdrop that a panel data
framework has been used to analyse the improvement in the
debt position of 17 non-special category states in terms of
state-level fiscal and macroeconomic variables. The panel
data analysis was conducted for the pre-debt consolidation
phase (1992-93 to 2001-02) and the post-debt consolidation
phase (2002-03 to 2011-12). The post-debt consolidation
period was identified based on the introduction of the debt
swap scheme (DSS) in 2002-03. While the dependent
variable was taken to be incremental debt-GSDP ratio,
the chosen explanatory variables were grouped into two
categories: (a) states fiscal indicators, viz., own revenue,
central government transfers to states, revenue expenditure,
capital outlay and net lending; and (b) growth in nominal
GSDP as the macroeconomic variable. All the explanatory
variables have been taken as a proportion to GSDP. The
analytical framework attempts to capture the cross-sectional
as well as the time series dimension of the state-level data.
The panel was estimated through a fixed effects model,
using the generalized least squares regression method
with cross section weights. The model has been adjusted
for heteroskedasticity with “White” cross-section standard
errors and covariance corrected for degrees of freedom.
The empirical results from the panel regression exercise are
presented in Table 1.
Table 1: Panel Regression Results |
Explanatory Variables |
Period I
(1992-93 to
2001-02) |
Period II
(2002-03 to
2011-12) |
Constant |
0.01 |
0.04 *** |
(0.70) |
(2.88) |
Own revenue receipts |
-0.91 *** |
-0.70 *** |
(-13.27) |
(-4.72) |
Central Transfers |
-0.93 *** |
-0.72 *** |
(-9.88) |
(-5.88) |
Revenue Expenditure |
0.94 *** |
0.62 *** |
(18.43) |
(10.46) |
Capital Outlay |
0.75 *** |
0.20 * |
(5.62) |
(1.88) |
Net lending |
0.96 *** |
0.19 * |
(8.08) |
(1.73) |
Growth in GSDP |
0.00 |
-0.02 ** |
(0.51) |
(-2.23) |
Total pool observations
Adjusted R-squared |
170 |
170 |
0.79 |
0.60 |
Note: Figures in parentheses represent the respective t values.
*, ** and *** denote significance at 10%, 5% and 1% levels, respectively. |
During the pre-debt consolidation phase, it was found that,
among the identified variables, states’ own revenue, central
transfers, revenue expenditure, capital outlay and net
lending had a significant impact on state government’s debt
in the expected directions. The impact of growth in GSDP
was, however, statistically insignificant. During the post-debt
consolidation phase, the growth in GSDP turned significant,
reflecting the positive impact of the high GSDP growth in
reducing the debt-GSDP ratio of the states. Among the fiscal
variables, states’ own revenue, central transfers and revenue
expenditure continued to remain significant in the post-debt
consolidation phase. It may be noted that the explanatory
power of the model came down during the second period as
reflected in a lower value of adjusted R squared indicating the
presence of other factors. An important factor at play during
this period was the central government policy initiatives that
helped reduce interest payments and the level of debt.
Interest payments constitute a significant proportion of
revenue expenditure of the state governments. The increase
in debt-GDP ratio during the first period was mainly on
account of an increase in the ratio of interest payments to
revenue expenditure from 13.7 per cent in 1992-93 to 19.9
per cent in 2001-02. In contrast, during the second period,
the interest payments to revenue expenditure ratio came
down considerably from 20.9 per cent in 2002-03 to 12.3 per
cent in 2011-12 (RE). This reflects the combined impact of
a reversal in the interest rate cycle and central government
policy initiatives viz., DSS and DCRF.
Although central government policy measures helped reduce
the debt level of the states in the post-debt consolidation
phase, given its ad hoc nature, states may have to focus
more on revenue-enhancing and expenditure compression
measures to improve their debt sustainability in the medium
term.
6.45 In the discussion on states’ debt sustainability,
debt is mostly taken to be on gross basis.
Alternatively, states’ debt sustainability may be
viewed from the perspective of debt net of surplus
cash balances, since in recent years most of the
states have been holding surplus cash balances
that add to their assets. While large cash balances
would help mitigate the debt burden of the states
to some extent, it should be noted that these
balances have been built through excess
borrowings by the states and hence add to their
interest burden.
6.46 An indicator analysis for the states shows
progress on most indicators of fiscal and debt
sustainability since the onset of fiscal consolidation.
Although the necessary and sufficient conditions
for sustainability were met during the phase of
fiscal consolidation, the sufficient condition of
primary surpluses has not been fulfilled in the
post-fiscal consolidation period, indicating the
need to limit non-interest expenditure. Empirical
evidence using panel regression analysis shows
that apart from policy measures in the form of the
DSS and the DCRF, the reversal of the interest
rate cycle and growth in nominal GSDP contributed to the debt reduction. It may be noted that in the
post-fiscal consolidation phase, states’ debt was
contracted at lower interest rates than in the past,
due to the prevalence of a low interest regime.
This factor, together with the deterioration in
central government finances in the post-crisis
period, limits the scope for debt forgiveness and
debt waiver of the magnitude seen earlier.
Moreover, off-budget contingent liabilities are
increasingly being taken over by state governments
as in the case of the financial restructuring scheme
for state discoms. This would add to the debt
burden of the states.
6.47 Hence, to address the issue of debt
sustainability, states should rely more on durable
and sustainable revenue-enhancing and
expenditure compression measures. Since the revenue-enhancing measures have limitations as
revenue cannot be augmented beyond a limit and
are prone to cyclicality, the focus has to be on
prudent expenditure management that limits the
non-interest expenditure in the medium term. This
would help arrest the build-up of state debt and
also provide counter-cyclical buffers in the event
of an economic slowdown. Given the similarities
of the sub-national FRBM Acts with that of the
centre, reforms in the state FRBM Acts should be
consistent with those of the centre, in terms of
ensuring well-defined targets and statistical
standards, enhancing fiscal transparency,
incorporating an expenditure-rule framework,
providing for an independent assessment of
compliance with the rules and strengthening of
automatic correction mechanisms for deviations
from the rules.
|