The state budgets for 2012-13 reflected a fiscal stance generally consistent with the roadmap laid down by the
Thirteenth Finance Commission. Although all states, barring one, have revised their FRBM Acts, most of them
do not include provisions for additional disclosures that enable transparent assessment of their finances. In the
context of the renewed efforts to return to the fiscal consolidation path in the post-crisis period, there is a need
to analyse the process of fiscal consolidation that involves, inter alia, efforts by the states to raise their revenues
by tapping the available resources. On the expenditure front, states need to ensure improvement in the quality
of expenditure, as it has a significant impact on the productivity and quality of life. The relationship between
states’ efforts to raise the quality of human capital through their social sector expenditure and the outcome in
terms of the Human Development Index (HDI), therefore, needs to be closely studied. The financial losses of the
state power distribution companies (discoms) and contingent claims arising out of this continue to be a drag on
the finances of states. The recently-announced scheme for financial restructuring of state discoms is a positive step
towards addressing the financial problems of state discoms provided it succeeds in its aim of nursing them back to
health. To address the problem of supply constraints fueling food inflation, state governments need to improve the
efficiency of the supply chain by encouraging greater public-private participation. There is also a need to improve
the management of the surplus cash balances of the states.
1. Introduction
2.1 With the states having embarked on the
second phase of rule-based fiscal consolidation
from 2011-12 in accordance with their FRBM
Acts, the emphasis has to shift towards
addressing key challenges to fiscal sustainability
by drawing lessons from the past and developing
new perspectives. While further improvement in
terms of tax efforts through increasing efficiency
and other initiatives is of utmost importance, the
states need to focus and reorient their expenditure
policies to achieve an improvement in the quality of
expenditure while also aiming at fiscal sustainability
in the medium term. This is imperative from the
perspective of improvement in the quality of life
as well as improvement of human capital. The
improvement in the human development index
(HDI) has implications for tapping the potential of
‘demographic dividend’, which would necessitate
higher social sector expenditure as well as
effective delivery of public goods. States also need
to continue with their efforts to enhance fiscal transparency so as to enable effective monitoring
of the quality, durability and effectiveness of the
fiscal correction process. From the perspective
of fiscal stability, the implications of the recentlyannounced
financial restructuring plan (FRP),
which is expected to bring about a turnaround
in the financial health of state power distribution
companies (discoms), on state finances demand a
careful analysis. This chapter raises key questions
about the fiscal challenges faced by the states
and attempts to provide an assessment on each
of them.
2. Fiscal Transparency at the State Government
level
Why is fiscal transparency important for the
states? What has been the progress in this
regard at the state level?
2.2 Fiscal transparency is at the core of
overall fiscal stability, as it enables an accurate
assessment of fiscal position, solvency parameters
and fiscal sustainability. It can provide signals of impending fiscal weaknesses that may help initiate
timely corrective measures. The importance of
fiscal transparency has been recognised, both
internationally as well as domestically, as is
evident from the number of committees1 that have
been constituted to look into this area. Although
fiscal transparency at sub-national tiers of the
government is desirable, given the difficulties
in enforceability, the committees favoured
identification of minimum standards in specific
areas for fiscal transparency at the state level.
These include compilation and dissemination of
information relating to major fiscal indicators,
outstanding liabilities, contingent liabilities
(dissemination and risk assessment), major
tax expenditures and quasi-fiscal activities. In
addition, disclosures in respect of components of
liabilities, consolidated sinking fund, risk-weighted
guarantees, guarantee redemption fund, assets,
claims/ commitments on revenue demands raised
but not realised and liabilities relating to major
works and contracts including committed liabilities
therein have been considered desirable to move
towards greater fiscal transparency. Under the
Fiscal Responsibility and Budget Management
(FRBM) Acts, states are required to bring out
statements relating to the macroeconomic
framework, medium-term fiscal policy and
fiscal policy strategy. The Thirteenth Finance
Commission (FC-XIII) further recommended the
disclosure of information relating to assistance
provided to all categories of urban local bodies.
2.3 The implementation status of the various
recommendations in the area of fiscal transparency
reveals that most of the states are now publishing
data on major fiscal indicators (26 states) and
many of them report outstanding liabilities (19
states) and guarantees (20 states). Subsequent to the enactment of the FRBM Acts, all states
are pursuing the targets for eventually achieving
revenue balance and a fiscal deficit-GSDP ratio
of 3 per cent. Further, they have started indicating
targets for guarantees and outstanding liabilities.
However, the majority of states do not report data
on liabilities and guarantees in the prescribed
formats. Only a few states provide information on
assets (3 states), claims and commitments (11
states) and liabilities in respect of major works
and contracts including some committed liabilities
therein (7 states). Some states still do not publish
‘Budget at a Glance’. Most states are yet to comply
with the requirements of a sensitivity analysis for
fiscal forecasts, and related quantification of fiscal
risks. Information on extra-budgetary activities,
quasi-fiscal activities and composition of debt and
financial assets are only partially reflected. State
budgets do not provide information on the financial
position of local bodies (except for compensation
and assignment to local bodies) and do not
publish reports on their long-term public finances.
State governments are yet to establish a formal
institutional mechanism to assess fiscal and
macroeconomic forecasts.
2.4 Despite the above lacunae, fiscal
transparency at the state government level has
increased, particularly after the enactments of
FRBM Acts. There is, of course, scope for further
improvement in terms of uniform accounting
practices and data consistency across the
budget documents. All the states should publish
documents such as ‘key to budget documents’,
‘Budget at a Glance’ and quarterly/half-yearly
reviews of their fiscal position, and also disclose
information on GSDP, financing of gross fiscal
deficit (GFD) and public capital outlays. States should also publish the economic and functional
classification of expenditure, based on the
budgetary data. Apart from publishing the data
on outstanding liabilities in the prescribed format,
they should also disseminate information relating
to interest rates and maturity profile in respect of
various components of outstanding liabilities. To
comply with the IMF code on fiscal transparency,
states need to initiate sensitivity analysis, ensure
public availability of the mid-year report and
improve reporting on contingent liabilities, major
tax expenditures and quasi-fiscal activities. The
progressive adoption of best practices will enable
the attainment of the goals of fiscal transparency
and signal any impending danger to the fiscal
position of the states.
3. Tax Efforts by the States
How have the states fared in terms of raising
revenues through their own efforts to aid the
process of fiscal consolidation at the state
level?
2.5 The issue of tax collection and tax effort is
crucial in the literature on fiscal federalism in India
where taxable capacity varies across states. It fits
well within the larger body of literature on fiscal
transfers from the centre to the states to address
the problem of horizontal and vertical imbalances2,
as it seeks to clarify whether larger amounts of
central transfers to a state leads to substitution
effects, where the state in question reduces its
own tax effort because of these transfers.
2.6 Studies have shown that there has been a
marginal increase in tax collections by the states after the implementation of the FRBM Acts, but
they do not explain how this corresponds to some
measurement of what should have been possible
to collect, i.e., measurement of tax effort. In order
to examine whether fiscal consolidation at the state
level was contributed by the efforts of the states in
resource mobilisation, an empirical exercise has
been undertaken, which shows that the states
have not made serious efforts towards increasing
their tax revenues in the fiscal consolidation
phase. A preliminary analysis of the own tax
revenue (OTR)-GSDP ratio of the non-special
category states reveals that the average OTRGSDP
ratio during the fiscal consolidation phase
(2004-2008) at 6.9 per cent was marginally higher
than the 6.7 per cent in the pre-consolidation
phase (2000-2004). Grouping these states into
three categories, viz., (i) those with OTR-GSDP
ratio above average (above the mean), (ii) those
with OTR-GSDP ratio lying between the mean
and one standard deviation below the mean and
(iii) those with OTR-GSDP ratio more than one
standard deviation below the mean, shows that
during the pre-consolidation period, eight states
were in the first group, six in the second group and
three in the last group3. In the fiscal consolidation
phase, while two states (Chhattisgarh and Madhya
Pradesh) moved up from the second group to the
first group, the others maintained their positions.
In recent years (2010-2013), the average OTRGSDP
ratio has increased to 7.2 per cent, with
one state (Jharkhand) moving from the third group
to the second group and the rest retaining their
positions of the fiscal consolidation phase.
2.7 The overall picture as given in the above
paragraph is in terms of what the states have achieved and not their actual taxable capacity
to tap into the available resources. Tax efforts
of states can be indirectly captured through
their own tax buoyancies. The results of the
empirical exercise undertaken in this regard are
presented in Box II.1. A state-wise analysis of
the buoyancies of the states was carried out to
see the tax efforts by individual states. The fact
that the OTR buoyancy was lower for 13 out of
17 states in the fiscal consolidation period than
for the period before fiscal consolidation suggests
that for most of the states, tax efforts during the
phase of consolidation were lower than in the pre preconsolidation
phase. This was further borne out by
the tax-wise buoyancies for major state taxes. As
the fiscal consolidation period witnessed steady
increase in the ratio of current transfers from the
centre to GSDP, there could have been some
substitution effects at play. OTR buoyancies for
the recent period, i.e., 2010-11 to 2012-13(BE),
show an improvement over the fiscal consolidation
phase in 14 out of 17 states. The proposed shift to
the goods and services tax (GST) regime would
reduce the states’ flexibility in determining the
rates for taxes that will get subsumed in the GST.
Raising tax revenues then would depend more on improving efficiency and compliance by tightening
vigilance and increasing the use of information
technology for tax collections.
Box II.1
Tax Efforts of the States
The states witnessed significant fiscal consolidation during
the period 2004-08. The assumption that fiscal consolidation
at the state level would have, inter alia, included the
contribution of states’ own tax efforts is along expected lines.
Thus, the relationship between states’ revenue generation
and their capacity to raise revenue reflecting the states’ tax
efforts necessitates empirical investigation.
State-wise OTR buoyancies were calculated as a ratio
of annual growth in own tax revenues with the nominal
GSDP growth rate of the states for the period before
fiscal consolidation (2000-04) as well as for the period of
fiscal consolidation (2004-08). Based on the calculated
buoyancies of the two periods, it is observed that the
average buoyancy for the fiscal consolidation period was
lower than in the pre-fiscal consolidation period in 13 out
of 17 states. However, buoyancy in an individual year, i.e.,
2005-06, was higher than unity in 11 states. Notably, that
was the year in which most states made the transition from
sales tax to value added tax (VAT). It may be mentioned that
Gujarat is the only state witnessing a gradual increase in its
tax buoyancy in the second period.
To ascertain the efforts of the states in the case of major
state-level taxes, the buoyancies of motor vehicle tax (MVT),
state sales tax (SST) and stamp and registration fees (SRF)
with respect to their respective tax bases were also worked
out. While the number of motor vehicles registered in the states was taken as the tax base for the MVT, the state’s
GSDP was taken as the tax base for SST and SRF. The
buoyancy of MVT was found to be lower in the period of
fiscal consolidation (2004-08) than in the period before fiscal
consolidation (2000-2004) in 7 out of 17 states. Similarly,
the buoyancies of SST and SRF were lower in 8 states and
7 states, respectively, during the fiscal consolidation period
than in the pre-consolidation period, implying that the tax
efforts in sub-categories of OTR, though appearing to be
better than overall OTR, still indicate the lack of sufficient tax
efforts on the part of the states.
A comparison of the own tax buoyancies for the recent
period, i.e., 2010-11 to 2012-13(BE), shows that the overall
buoyancy for the OTR for this period was higher than in the
2004-08 period in 14 out of 17 states4. A more nuanced
analysis of some of the components of OTR5, such as SST
and SRF, shows that while the buoyancy of the SST was
lower in the 2004-08 period in 12 out of 17 states, in the case
of the SRF the buoyancies were lower in all the states other
than Jharkhand. The above analysis about recent trends in
tax collections by states does not inspire confidence in the
tax-raising efforts of the states, although the data for the
past three years do have a positive element. Although the
improvement in the recent period is encouraging, the impact
of the impending GST regime on states’ efforts to raise OTR
has to be factored in when conducting future studies.
4. Quality of State Government Expenditure
Why do states need to focus on the quality
of expenditure? What is the institutional
framework available to states?
2.8 The quality of expenditure has always been
an important issue in state finances. At present,
revenue expenditure accounts for around 80
per cent of states’ aggregate expenditure. The
expenditure pattern of the state governments
suffers from inherent structural rigidities from
components such as subsidies, salaries and
wages, pensions and interest payments. As the
states play an important role in the development
of social and economic infrastructure, expenditure
compressions should focus on non-essential
components of aggregate expenditure. Getting the
right size and the right composition of government
expenditure to maximise growth rates while
also providing adequately for the government’s
obligations, such as provision of health and
education, are integral to re-sizing the public
expenditure of the states. Nevertheless, states
need to identify unwarranted items of revenue
expenditure that have low growth and welfare
implications. The states have done well during
2010-11 to 2012-13 (BE) in comparison with their
earlier performance during 2000-01 to 2009-10 in
terms of increasing development expenditure and
social sector expenditure as a ratio to aggregate
expenditure. The capital outlay has increased
while the non-development revenue expenditure
has come down in recent years, resulting in a
lower committed expenditure-revenue receipts
ratio. All these developments point to the fact
that the quality of expenditure is on the path of
improvement, but the scope for downsizing nonessential
expenditure and the quality of delivery
still remain.
2.9 Expenditure reforms were an important driver
of the FC-XIII’s approach to the fiscal roadmap
for the future. The major thrust of expenditure
reforms was to improve the supply of public goods
through a reduction in the existing untargeted
and regressive subsidies. The Commission
underlined the need to improve transparency
and accountability by putting in place stricter
audit procedures, in general, and operational
audit, in particular, for proper assessment of the
‘efficiency and effectiveness’ of various items of
expenditure. It also suggested that ‘institutional
deepening’ through the creation of local body
ombudspersons, fiscal councils and independent
evaluation organisations would help in better
expenditure management. The efficient allocation
of public expenditure is crucial not only for setting
the pace of fiscal consolidation at the state level
but also for raising their economic potential over
the medium term.
2.10 In this context, international experiences
indicate the use of a wide variety of measures,
including placing of limits on certain expenditures,
prioritisation of expenditures, greater decentralisation
of executive functions, improved cash
management and greater accountability in the
delivery of services against specified targets.
Many countries have embarked on a massive
effort at ‘government re-engineering’ to better
target dwindling budgetary resources towards
high priority uses. This relates to both the size
and sectoral allocations aimed at removing
inefficiencies arising from misallocation, design
and implementation of schemes and delivery
of services. This process seeks to deepen
reforms and strengthen capacity for an effective
and efficient delivery of basic public services.
The amendment of the FRBM Act, 2003 by the
centre and the introduction of a Medium-term
Expenditure Framework Statement in the Act,
which, inter alia, includes three-year rolling targets
in respect of expenditure indicators, is expected to bring about fiscal discipline and create the fiscal
space essential for the government to pursue its
objective of faster, sustainable and more inclusive
growth during the Twelfth Plan. The adoption
of some of these principles by the states could
facilitate the management of expenditure guided
by considerations of economy, efficiency and
effectiveness.
5. Social Sector Expenditure and Human
Development
Has the social sector expenditure of the states
helped human development? What are the
lessons for policy makers?
2.11 The concept of human development
signifies improvement in the quality of life of the
people in terms of various health and educational
indicators. Through betterment of health,
education and skills, human development creates
human capabilities that can lead to productivity
enhancement and acceleration in economic
growth. In a broader sense, human development
also implies improvements in terms of human
rights, participation and freedom of choice. The
Human Development Index (HDI) is a composite
index measuring the basic dimensions of human
development, viz., long and healthy life, education
and a decent standard of living as measured by
per capita consumption expenditure. Given that
social services are primarily state government
responsibilities, with more than 80 per cent of
combined government expenditure in these areas
being incurred by the states, the necessary public
interventions would largely have to be at the
state level. While it is natural to expect that better financial health should allow a state to spend more
on human development, the relationship between a state government’s social sector expenditure6
and HDI warrants closer examination.
2.12 Under the premise that the onus of
human development rests squarely on the
state governments, an empirical exercise was
undertaken for the period 1993-94 to 2006-07,
covering 15 states7 in 2000-01 and 18 states in
2007-08, including the three newly-formed states
of Chhattisgarh, Uttarakhand and Jharkhand
(Box II.2). Since the level of PCI (which impacts the
quality of life in general through an improvement in
economic conditions and enables people to spend
more on their health, education and nutrition) is
already captured in the HDI, the empirical exercise
is limited to measuring the impact of per capita
social sector expenditure on HDI. The exercise
shows that the lagging states have not attempted
to catch up with the better-performing states
by allocating a larger share of their aggregate
expenditure for human development, as their per
capita social sector expenditure has remained
significantly lower than that of the leading states,
resulting in the persistence of disparities in HDI
across states. To reap the benefits of demographic
dividend, the country’s human resources need
to be strengthened and this calls for higher per
capita social sector expenditure by the states. It
is important for populous states of India to make
a considerable improvement not only in terms of
the amount of social sector expenditure but also
in terms of the mechanism of delivery of social
services.
Box II.2
Social Sector Expenditure and Human Development - An Empirical Exercise
Social services are primarily the responsibility of state
governments. Since the level of the Human Development
Index (HDI) can be expected to be related to the state
governments’ social sector expenditure, it is helpful to
examine the relationship between a state government’s
social sector expenditure and HDI. An empirical exercise
was, therefore, undertaken to study the relationship between
the social sector expenditure of the major states in India and
their respective HDI. Since HDI brought out by the Planning
Commission is available with a gap of 7 years, the exercise
attempts to relate the HDI performance with the social
sector expenditure undertaken in the preceding 7 years.
The exercise covers 15 states in 2000-01 and 18 states in
2007-08, including the three newly-formed states bifurcated
from existing states, viz., Chhattisgarh, Uttarakhand and
Jharkhand. A look at the average ratios of social sector
expenditure to aggregate expenditure for both time points
reveals that during the first period the ratio of social sector
expenditure to total expenditure in 11 states was higher
than the average for 15 states; of these, three were among
the top five states and four among the bottom five states.
The scenario in the second period shows that only in seven
states (of the earlier 11 states) was the ratio of social sector
expenditure to total expenditure higher than the average for
15 states8, with three each from the top five and the bottom
five states. These results suggest that lagging states have
not made any discernible attempts at closing the gap with
the leading states in terms of higher outlay on social sector
expenditure.
Since the above exercise does not factor in an important
characteristic of the Indian economy i.e., the population size
of these states, an exercise based on per capita social sector
expenditure was conducted. The analysis involves examining
the relationship between average per capita SSE (pcSSE) in
the preceding seven years and HDI. The relationship turns
out to be positive, implying that higher pcSSE leads to better
outcome in terms of HDI. The co-efficient of correlation is
found to be highly significant with ‘r’ value more than 0.75
for both the periods. It is important to note that the HDIs for
the three bifurcated states, viz., Bihar, Madhya Pradesh and
Uttar Pradesh, are not strictly comparable, since the newlycreated
states performed better than the parent states in
2007-08, except in the case of Chhattisgarh, which lagged
behind Madhya Pradesh. The positive impact of pcSSE on
HDI is also borne out by regression analysis9. The disparities
in pcSSE, in terms of co-efficient of variation, are higher in the second period of analysis than in the first period,
increasing from 20.0 in 2000-01 to 23.5 in 2007-08. The
co-efficient of variation in HDI also increased from 16.3 to
23.0 during this period.
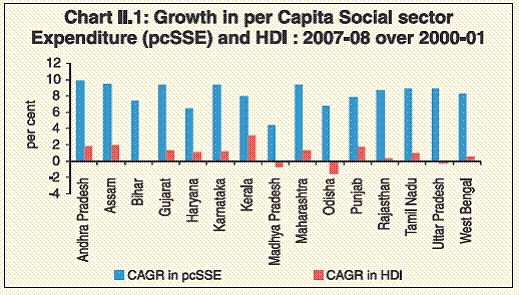
A comparison of state-wise growth in average per capita
social sector expenditure and HDI in 2007-08 over 2000-0110 shows that, by and large, states that increased their per capita
social sector expenditure have also seen an improvement
in their HDI. The exceptions are Odisha, Madhya Pradesh
and Uttar Pradesh which, despite an increase in per capita
social sector expenditure, have witnessed a decline in
HDI. Although Bihar increased its per capita social sector
expenditure, its HDI has remained unchanged between
2000-01 and 2007-08. Kerala registered the maximum
increase in HDI, although the growth in its per capita social
sector expenditure was not the highest, benefitting from
early start in expanding social sector expenditure (Chart 1).
 |
The rank correlation between HDI in 2000-01 and 2007-08
is extremely high (0.93, t=12.2), which suggests that almost
the same states have performed well in both time periods
and likewise for the worst-performing States. The gap
between the top five states and bottom five states in terms of
the pcSSE of 2000-01 has worsened in comparison with the
national average, as the divergence in terms of per capita
SSE for the same states has increased from 40.2 per cent
to 49.6 per cent.11 In recent times (2007-08 to 2012-13) the
gap in terms of per capita SSE has come down from 49.6
per cent to 42.8 per cent, which may contribute somewhat
to reducing the disparity among states in terms of expected
HDI.
6. Financial Viability of State Power Distribution
Companies: Impact on State Finances
What are the implications of the deteriorating
financial health of the state power distribution
companies (discoms) on the finances of state
governments? What are the recent policy
measures taken to address the problem
of mounting short-term liabilities of state
discoms?
2.13 While the revenue accounts of several state
governments continue to record surpluses, despite
recent moderation witnessed in some of them,
this needs to be seen in the light of the mounting
accumulated losses in state power distribution
companies (discoms), estimated at `1.9 trillion
as at end-March 2011. Non-revision of tariffs,
subsidy arrears, the high cost of buying short-term
power and high distribution losses are some key
reasons for the financial ill-health of the discoms.
As the discoms have largely availed of short-term
borrowings from banks and financial institutions to
cover cash losses, it has raised serious concern
not only for the discoms but also for the banks/
financial institutions that have lent to them. State
governments extend support to the discoms
through various direct and indirect channels. Budgetary support by the state governments is
in the nature of subsidies and grants in lieu of
subsidised power provided to certain categories
such as agricultural and domestic consumers,
and equity/bond investments and direct loans to
discoms. Off-budget support is in the form of state
government guarantees for the loans obtained
by discoms from banks/financial institutions. In
addition to these regular channels of direct and
indirect financial support, the state governments
had issued power bonds effective 2001 under a
one-time settlement scheme to clear the dues of
state electricity boards (SEBs) to central power
sector utilities. The debt servicing/repayment of
these bonds had an impact on state finances.
2.14 Growing concerns over the financial health
of discoms in recent years have led to several committees being set up at various levels to
examine the issues plaguing these utilities and to
suggest appropriate remedies so as to address
their commercial viability and prevent further
deterioration in their finances. The Expert Group
on ‘Financial Health of State Distribution Utilities’
was constituted by the Planning Commission to
assess the cumulative losses of the distribution
utilities in seven states and work out financial
restructuring and turnaround plans for the power
distribution companies in these states. Based on
the recommendations of this Group and its own
assessment, the centre has brought out a scheme
for the financial restructuring of state discoms
(Box II.3). The near-term impact of the scheme will
be on the interest outgo and, thereby, the revenue
expenditure of the states that opt for the financial
restructuring scheme. The portion of operating
losses and interest commitments of state discoms
in Rajasthan, Tamil Nadu, Haryana and Uttar
Pradesh (not covered by the banks/ financial
institutions) would also have to borne by the
state governments. Under the scheme, banks are
expected to support the restructuring of debt by
waiver of penal interest, moratorium on repayment
of principal and restructuring of existing loans.
2.15 Of the seven states identified by the Expert
Group, Madhya Pradesh government has opted
not to avail of the scheme, as a major portion of
the short-term liabilities of the state discoms are
with the state government. The state government
has restructured these loans so as to ease the
financial pressure on the discoms. The other states
are in the process of working out the modalities for
the scheme with the various stake holders.
2.16 The restructuring of the short-term liabilities
of state discoms to bring about a turnaround in
their financial position can be successful only
under the following conditions: (a) removal of
systemic deficiencies of the state discoms;
(b) elimination of the gap between average revenue
realised and average cost of supply as early as possible through periodic tariff revisions; and
(c) rationalisation and better targeting of subsidies.
While the proposed restructuring/rescheduling
of loans is to be accompanied by concrete and
measurable action by the discom/states to improve
the operational performance of the discoms, past
experience in the implementation of remedial
measures suggested by the Ahluwalia Committee
has not been encouraging. Hence, the strict
enforceability of the conditions associated with the
restructuring package has to be ensured so that
the overall financial stability in the economy is not
threatened by the restructured loans turning into
non-performing assets.
Box II.3
Scheme for Financial Restructuring of State Power Distribution Companies (Discoms)
In an attempt to enable the turnaround of state-owned power
distribution companies (discoms) and ensure their longterm
viability, the Ministry of Power announced a scheme,
formulated and approved by the central government, for the
financial restructuring of state discoms on October 5, 2012.
The scheme has been prepared keeping in view the fragile
health of the state discoms arising from serious systemic
deficiencies in their working.
The scheme contains various measures required to be
taken by state discoms and state governments to improve
the operational performance of the discoms. The salient
features of the scheme are set out below.
• 50 per cent of the outstanding short-term liabilities
(STL)12 as of March 31, 2012 to be taken over by state
governments. This shall be first converted into bonds
to be issued by discoms to participating lenders, duly
backed by state government guarantee.
• Takeover of the liability by state governments from
discoms in the next 2-5 years by way of issuance of
special securities in favour of participating lenders in a
phased manner, keeping in view the fiscal space available
until the entire loan (50 per cent of STL) is taken over. The
door-to-door maturity will not be more than 15 years, with
a moratorium of 3-5 years on the principal repayment.
• The state government would provide full support to the
discoms for payment of interest for this portion.
• The balance 50 per cent of the STL would be rescheduled
by lenders and serviced by the discoms with a moratorium
of 3 years on the principal. Repayment of the principal
and interest would be fully secured by state government
guarantee.
• The restructuring/rescheduling of the loan is to be
accompanied by concrete and measurable action by the
discoms/states to improve the operational performance
of the distribution utilities.
• The central government will provide a transitional finance
mechanism (TFM) in support of the restructuring effort,
subject to the fulfillment of mandatory conditions. The
TFM will have the following features:
-
Liquidity support for three years beginning 2012-13 in
the form of grants equal to the value of the additional
energy saved by way of accelerated AT&C loss
reduction beyond the loss trajectory specified under
the Restructured Accelerated Power Development
and Reform Programme (RAPDRP); eligibility for the grant from the centre would arise only if the
gap between average revenue realisation (ARR)
and average cost of supply (ACS) for the year has
been reduced by at least 25 per cent during the year
judged against the benchmark for the year 2010-11.
-
Capital reimbursement support of 25 per cent of
principal repayment by the state government on the
liability taken over by the state government under the
scheme; the amount is to be reimbursed only in case
the state government takes over the entire 50 per
cent of the short-term liabilities (corresponding to the
accumulated losses) outstanding as at end-March
2012.
• A separate arrangement would be worked out, after due
consultation with the Ministry of Power and the concerned
states, to finance the operational losses and interest for
the first three years on a diminishing scale; the remaining
portion of operating losses will have to be financed by the
respective state government.
• To monitor the progress of the turnaround plan, two
committees at the state and central government levels
are to be constituted.
The scheme has been made effective from the date of
notification, i.e., October 5, 2012, to remain open up
to December 31, 2012, unless extended by the central
government. The scheme would be applicable to all
state-owned discoms that have accumulated losses and
face difficulty in financing operational losses, subject to
the fulfilment of certain mandatory conditions stipulated
under the scheme. The central government’s support to
states under the scheme in the form of grants and capital
reimbursement would be contingent upon the states
meeting certain stringent mandatory conditions relating to
tariff setting and revenue realisation, subsidy payment, timebound
plan for metering all categories of consumers and
finalisation of audited accounts.
Implications for the State Governments
As per the announced scheme, 50 per cent of the
outstanding short-term liabilities (STL) of the state discoms
to lending institutions would be taken over by the state
governments through issuance of special securities in
favour of participating lenders in a phased manner, until
the entire bonds corresponding to 50 per cent of shortterm
liability are taken over by the state government. The
state government will provide full support to the discoms for
payment of interest until the entire bonds are taken over by the state government. Repayment of the special securities
will commence at the end of five years, with one-tenth of the
principal being repaid to the lending institutions every year.
The conversion of the debt of discoms into state government
bonds would have to take place within the FRBM space.
State governments would ensure that issuance of special
securities is within the targets prescribed in the FRBM Acts
and, even if fiscal space including the debt-GSDP ratio
under the FRBM targets is available, states would have to
remain within their net borrowing ceilings (for each of the
relevant fiscal) fixed annually as per the formula prescribed
by the Thirteenth Finance Commission. Phasing of special
securities for the seven states with debt-ridden discoms
based on provisional figures for short-term liabilities is set
out in Table 1. However, in case a state is able to find more
fiscal space during any year, it would ensure that liabilities
are taken over as soon as possible.
Table 1: Phasing of Special Securities by the State
Government to the Discoms
|
(Amount in ` billion) |
State |
50 per
cent of
short-
term
liabilities
(STL) |
2012-
13 |
2013-
14 |
2014-
15 |
2015-
16 |
2016-
17 |
Andhra Pradesh |
31.51 |
22.11 |
9.40 |
- |
- |
- |
Haryana |
78.59 |
25.18 |
24.96 |
28.45 |
- |
- |
Madhya Pradesh |
5.85 |
0.72 |
5.13 |
- |
- |
- |
Punjab |
58.23 |
8.81 |
10.04 |
11.45 |
13.05 |
14.88 |
Rajasthan |
198.55 |
26.49 |
34.96 |
39.86 |
45.44 |
51.80 |
Tamil Nadu |
95.73 |
8.84 |
25.26 |
28.80 |
32.83 |
- |
Uttar Pradesh |
129.67 |
19.19 |
22.45 |
25.59 |
29.18 |
33.26 |
Total |
598.13 |
111.34 |
132.20 |
134.15 |
120.50 |
99.94 |
‘ - ‘ nil.
Source: Ministry of Power. |
7. Supply Chain Management and Food inflation
What is the importance of supply chain
management in controlling food inflation?
How can state governments help strengthen
the supply chain?
2.17 Asymmetries in price transmission across
the supply chain for agricultural commodities are
one of the important reasons for food inflation
in India. While agricultural marketing is a state subject, inflation management is viewed largely
from the national perspective. As food price
inflation mostly arises from supply-side shocks,
efficient management of the supply chain can
play a major role in controlling price increase by
limiting the scope of leakages. An efficient supply
chain mechanism ensures reasonable prices for
producers as well as protects the interests of
the final consumer by minimising intermediation
costs/storage losses. It also reduces volatility in
product availability and prices, thereby improving
the overall efficiency of the system.
2.18 Supply chain can be strengthened by:
(i) enhancing the capabilities of farmers,
(ii) strengthening infrastructure and iii) legislative
interventions. By encouraging farmers to organise
themselves into groups - growers’ groups, cooperatives,
self-help groups and producer
companies - supply chains can be streamlined as
well as made more egalitarian. Also, investments
across the entire agri-value chain spectrum, such
as the creation of cold chains and rural godowns,
new agricultural marketing infrastructure, and
modernisation of existing markets, could be promoted by providing them with appropriate fiscal
incentives. As suggested by the Inter-Ministerial
Group on Inflation, perishables could be taken out
of the ambit of the Agricultural Produce Market
Committee (APMC) Act to encourage arbitrage
activity by small traders and farmers by allowing
them to freely trade perishables through buying
where it is cheap and selling where it is expensive.
Similarly, from the long-term perspective of
inflation management, it is crucial to improve
mandi governance by holding regular elections of
agricultural produce market committees as well as
to bring professionalism into the functioning of the
existing regulated markets through public-private
partnerships.
2.19 The Working Group of the Twelfth Five-Year
Plan on “Agriculture Marketing Infrastructure,
Secondary Agriculture and Policy Required for
Internal and External Trade” has identified areas of
agriculture marketing that should be emphasised
during the Plan period. These include: a) greater
responsibility to producer organisations; b) direct
linkage with retailers/ processors/ exporters;
c) price discovery through virtual market platforms;
d) direct marketing; e) organised retailing
and removing restrictions on FDI for greater
competition; f) market access for small producers;
g) reforms in the APMC Act; h) an integrated
value chain system that covers areas such as
partnership, information and communication
technologies, leveraging networks, value chain
financing, smallholder policy, and contracts;
i) promotion of innovative marketing models
for effective market participation and j) publicprivate
partnerships (PPP) for efficiency and
effectiveness. Measures in some of these areas
have already been taken, such as amendments
to the APMC Act by some state governments
to provide for the introduction of private market,
e-market, direct purchase market, farmerconsumer
market, contract farming and an intermarket
dispute settlement mechanism. Further measures are required, particularly in providing
a convergence platform at the national, state and
district levels, where private players join hands
with a large number of farmers through ongoing
schemes and programmes of the central and
state governments in a PPP mode.
8. Surplus Cash Balances of the States
How do the surplus cash balances of the
states affect their finances? Why do states
accumulate these balances?
2.25 State governments have been accumulating
large surplus cash balances since 2004-05. These
cash balances generally increase towards the
final quarter of the year to provide for delays in
the release of funds by the central government.
Apart from the improved revenue account position
of the states, the accumulation of large surplus
cash balances indicates that some states tended
to borrow more than their fiscal deficit.
2.26 Given that states have ample surplus cash
balances and the GFD-GSDP ratio is envisaged
to decline in the coming years, it is essential that
states adopt a need-based approach to their
market borrowings. Since states earn a lower rate
of return on these investments, instead of overborrowing,
they may consider using their surplus
cash balances to finance their GFD. The FC-XIII
has suggested that there should be a directed
effort by states with large balances towards utilising
their existing cash balances before resorting to
fresh borrowings. Alternatively, the cash surplus
may be used to pre-pay old high-cost debt, as has
been done by some states in the past. Further,
states may make efforts towards capacity building
for better cash management. Effective cash
management is possible only if state governments
develop the skills and capacity to record, monitor,
and project short-term inflows and outflows. States
should encourage co-ordination among state
entities that collect revenue and expend funds.
Conclusion
2.27 The budgeted fiscal stance of the state
governments during 2012-13 was generally in
line with the revised road map of the FC-XIII.
Measurement and reporting of implicit obligations
of the states will reflect the true fiscal positions of
the states. States need to exploit their revenueraising
potential, with special emphasis on
improved efficiency and compliance through the
use of information technology and vigilance in
preparation for the transition to the GST regime. The
quality of expenditure also needs to be improved by cutting down on non-productive expenditure while
increasing expenditure that would impart countercyclical
growth impulses to the economy. Public
expenditure on building human capital stock would
be the major determinant of inclusive growth in the
future and will be critical to reap the demographic
dividend. The financial losses of state power
discoms continue to act as a drag on the finances
of the states. The financial restructuring scheme, if
implemented in the right spirit, may get rid of one
of the most daunting problems of state finances by
turning state discoms into financially viable units.
|