This chapter analyses the financial performance and soundness of the cooperative sector, both
urban and rural, in the context of their role in furthering financial inclusion. The urban
cooperative sector reported overall net profits as at end-March 2010 with improved asset quality.
The overall financial performance of the rural cooperative sector witnessed some improvement
at end-March 2009 over the previous year, though the asset quality deteriorated. However,
the financial position of ground level institutions in the rural cooperative sector is a cause for
concern as they reported losses alongside a high NPA ratio. Further, the role of the cooperative
sector in the Kisan Credit Card Scheme, in terms of number of cards issued as well as amount
of credit sanctioned, exhibited a declining trend during the recent years.
1. Introduction
5.1 The wide network of cooperatives, both
urban and rural, supplements the commercial
bank network in its efforts to deepen financial
intermediation by bringing large number of small
depositors/borrowers under the formal financial
network. However, these two sets of banks are
not strictly comparable owing to reasons those
stem from their origins, objectives and regulatory
environment they are subjected to. Origins of the
cooperative movement in India can be traced back
to the Cooperative Credit Societies Act, 1904. The
wide geographical coverage of cooperatives
especially in rural areas was primarily
established to save small borrowers hailing from
rural areas from usurious interest rates charged
by money lenders. Since its inception, it has been
playing an important role in the socio-economic
development of the country by making available
institutional credit at affordable cost particularly
to the agricultural sector. In the process, the
cooperative movement in India has facilitated the
process of financial inclusion. Howsoever, the
weak financial position of majority of cooperative
credit institutions has been a cause for concern.
5.2 The cooperative sector in India is divided
into two major segments, viz., the Urban
Cooperative Banks (UCBs) and Rural
Cooperatives. As names indicate, UCBs concentrate on credit delivery in urban areas,
while Rural Cooperatives concentrate on rural
areas. The structure of the cooperative banking
sector in India is provided in Chart V.1.
5.3 The regulation of banking-related activities
of the UCB sector is under the purview of the
Reserve Bank, while the incorporation/registration
and management-related activities are regulated
by the Registrar of Cooperatives Societies or the
Central registrar of cooperative societies as the
case may be. In order to deal with the issue of
dual control in the regulatory framework of the
urban cooperative sector, MoUs have been entered
into with the Central Government and all 28
States. Task Forces for Cooperative Urban Banks
(TAFCUBs) have also been constituted in all these
States and a Central TAFCUB has been constituted
for the multi-State UCBs. The regulation and
supervision of the rural cooperative sector (State
Cooperative Banks (StCBs) and District Central
Cooperative Banks (DCCBs)) is much more
complex with a triangular structure, where the
Registrar of cooperatives, the Reserve Bank and
the NABARD are entrusted with separate
responsibilities. For the rural cooperative sector,
MoUs have been entered into by majority of State
Governments with the NABARD.
5.4 In this context, this chapter provides an
analysis of recent trends in operations and performance of urban and rural cooperative
credit institutions in India using the latest
available data. The chapter is organised into five
sections. Section 2 discusses business operations
and performance of UCBs during 2009-10, while
Section 3 focuses on performance of rural
cooperative credit institutions during 2008-09.
Section 4 documents initiatives taken by
NABARD followed by concluding observations in
Section 5.
2. Urban Cooperative Banks1
Profile of UCBs
5.5 The urban cooperative banking sector
comprises a number of institutions which vary
in terms of their size, nature of business and geographic spread while concentrating on credit
delivery in urban areas. As an outcome of the
on-going consolidation of the sector, there was
a decline in the number of UCBs at end-March
2010 to 1,674 from 1,721 in the previous year.2
The progress made so far in the consolidation
of the UCB sector is provided in Box V.1.
Grade-wise Profile of UCBs3
5.6 On account of the consolidation process
going on in the UCB sector, percentage of banks
in grades III and IV witnessed a declining trend
during recent years. Further, the absolute amount
of deposits as well as advances with UCBs in
grades III and IV also witnessed a decline as at
end-March 2010 as compared with the previous
year. Accordingly, the percentage of banks in grades I and II as also their share in total deposits
and advances of the sector exhibited a rising trend
during the recent years. This implies a shift in the
concentration of banking business in favour of
financially sound UCBs. The value of normalised
Herfindahl-Hirschman Index for the UCB sector
increased to 0.38 as at end-March 2010 from
0.30 in the previous year, indicating an increase
in the concentration of banking business with
grade I banks in the sector (Table V.1).4
Box V.1: Consolidation and Strengthening of the UCB Sector
Weak financial position of a number of UCBs has been the
major cause for concern in the UCB sector for decades.
The dual regulatory control over this sector contributed a
lot to the weak financial position of this sector. To address
this issue, the Reserve Bank in March 2005 prepared a
vision document and based on that a Medium-Term
Framework (MTF), which envisaged regulatory
coordination between the two main regulatory authorities
of the urban cooperative banking sector, viz., the Reserve
Bank and the respective State Governments (Central
Government for multi-State UCBs) through signing of a
Memorandum of Understanding (MoU) in each State within
the existing legal framework.
As on date, MoUs have been entered into with Central
Government and all 28 States having presence of UCBs,
thus covering the entire UCB sector. Task Force for
Cooperative Urban Banks (TAFCUBs) have been
constituted in all these States and a Central TAFCUB has
also been constituted for the multi-State UCBs. The
supervisory actions taken on the basis of
recommendations of the TAFCUBs include cancellation
of licenses or rejection of license applications of unviable
UCBs, supersession of errant Board of Directors, and
placing/modification of operational restrictions/directions
on the banks. Other important policy measures that were
implemented based on a consensus in the TAFCUBs, were
Guidelines on ‘Fair Practice Code for Lenders’ and issue
of Guidelines on ‘Fit & Proper Criteria’ for appointment
of CEOs of UCBs. Further, TAFCUBs identify the potentially
viable UCBs and suggest solutions for their revival while
formulating non-disruptive exit strategies for non-viable
banks. The exit of non-viable banks could be through
merger/amalgamation with stronger banks, conversion into
societies or liquidation, as the last option.
With a view to facilitating consolidation, and nondisruptive
and orderly resolution of weak/unviable
entities in the UCB sector, the Reserve Bank had framed
in February 2005, guidelines for merger/amalgamation
of UCBs. In terms of these guidelines, the acquirer bank has to protect deposits of the acquired bank on its own
or with upfront financial assistance from the State
Government. In order to give a fillip to the process of
mergers and consolidation of the sector and to address
the legacy cases of UCBs with negative net worth as on
March 31, 2007, the Reserve Bank issued in January
2009 additional guidelines for merger/amalgamation of
UCBs which provided for DICGC support to the extent
and in the manner prescribed under Section 16(2) of the
DICGC Act 1961, financial contribution by the acquirer
bank and sacrifice of a portion of their deposits by large
depositors.
Out of a total of 103 NOCs for merger issued by the Reserve
Bank, 91 were in respect of weak banks. Of these 91, 71
mergers have so far been notified by the RCS of the
respective States (Table).
As an additional option for resolution of weak UCBs, where
proposals for mergers were not forthcoming from within
the UCB sector, guidelines were issued by the Reserve Bank
in February 2010 for sanction of a scheme of transfer of
assets and liabilities (including branches) of UCBs to
commercial banks with DICGC support, in legacy cases
of banks with negative net worth. These guidelines provide
for 100 per cent protection to all depositors and DICGC
support is restricted to the amount provided under Section
16(2) of the DICGC Act, 1961. UCBs which had negative
net worth as on March 31, 2007 or earlier and continue
to have negative net worth as on the date of transfer would
be considered eligible under the scheme.
As an incentive, the Reserve Bank would permit the
transferee (commercial) bank to take over branches and
close down the loss incurring branches of the transferor
bank (UCB) with the prior approval of the Reserve Bank.
The shifting/relocation of branches of the transferor bank
may also be permitted by the Reserve Bank subject to
banking facilities being made available to customers
through the existing/relocated branches of the transferor/
transferee bank.
Table : Year wise Progress in Mergers/Acquisition of Weak Banks by Strong Banks (NOCs Issued) |
(As on June 30, 2010) |
Sr. No. |
Name of the State |
2004-05 |
2005-06 |
2006-07 |
2007-08 |
2008-09 |
2009-10 |
2010-11 |
Total |
1 |
Maharashtra |
- |
5 |
6 |
11 |
6 |
10 |
- |
38 |
2 |
Gujarat |
1 |
5 |
5 |
6 |
3 |
4 |
- |
24 |
3 |
Andhra Pradesh |
- |
2 |
1 |
3 |
1 |
3 |
- |
10 |
4 |
Karnataka |
- |
- |
3 |
2 |
1 |
1 |
- |
7 |
5 |
Goa |
- |
1 |
- |
- |
- |
- |
- |
1 |
6 |
Rajasthan |
- |
- |
- |
- |
- |
- |
- |
- |
7 |
Delhi |
- |
- |
- |
- |
- |
- |
- |
- |
8 |
Punjab |
- |
- |
1 |
- |
- |
- |
- |
1 |
9 |
Madhya Pradesh |
- |
- |
1 |
2 |
1 |
2 |
- |
6 |
10 |
Uttarakhand |
- |
- |
- |
2 |
- |
- |
- |
2 |
11 |
Chhattisgarh |
- |
- |
- |
- |
1 |
- |
- |
1 |
12 |
Multi-State |
- |
1 |
- |
- |
- |
- |
- |
1 |
Total (1 to 12) |
1 |
14 |
17 |
26 |
13 |
20 |
- |
91 |
‘-‘: Nil. |
Size of Assets-wise and Business-wise Profile
of UCBs
5.7 To further understand the extent of
concentration in the UCB sector, an analysis of
asset size-wise as well as size of deposit and
advances-wise profile of UCBs is attempted in
this section. The analysis shows that there was
an increase in the number of banks as also an
increase in the share of banking business in the
larger asset-size categories as well as in the
larger business-size categories of banks.
5.8 The size of asset-wise distribution of UCBs
shows that there was a decline in the number of
banks in the category ‘asset size below `100 crore’
with a corresponding increase in the ‘above `100 crore’ category as at end-March 2010 as
compared with the previous year. The share of
the former category in the total assets of the UCB
sector also witnessed a decline as compared with
the previous year. Consequently, as at end-March
2010 almost three-fourths of UCBs had assets
below `100 crore; however, their share in the total
assets of the sector was around one sixth of the
total assets of the entire sector (Chart V.2).
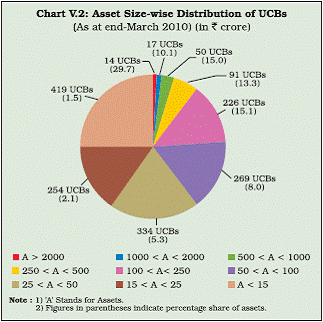 |
Table V.1 : Grade-wise Distribution of Deposits and Advances of Urban Cooperative Banks |
(As at end-March) |
(Amount in ` crore) |
Grade |
Number of UCBs
|
UCBs as percentage of total
|
Amount of Deposits
|
Deposits as percentage to total
|
Amount of Advances
|
Advances as percentage to total
|
2009 |
2010 |
2009 |
2010 |
2009 |
2010 |
2009 |
2010 |
2009 |
2010 |
2009 |
2010 |
1 |
2 |
3 |
4 |
5 |
6 |
7 |
8 |
9 |
10 |
11 |
12 |
13 |
I |
845 |
879 |
49.1 |
52.5 |
1,02,330 |
1,28,770 |
65.1 |
70.4 |
61,761 |
77,265 |
64.2 |
70.0 |
II |
484 |
465 |
28.1 |
27.8 |
30,626 |
34,756 |
19.5 |
19.0 |
18,920 |
21,245 |
19.7 |
19.3 |
III |
219 |
179 |
12.7 |
10.7 |
7,954 |
7,494 |
5.1 |
4.1 |
5,405 |
4,731 |
5.6 |
4.3 |
IV |
173 |
151 |
10.1 |
9.0 |
16,131 |
11,842 |
10.3 |
6.5 |
10,148 |
7,062 |
10.5 |
6.4 |
Total |
1,721 |
1,674 |
100.0 |
100.0 |
1,57,041 |
1,82,862 |
100.0 |
100.0 |
96,234 |
1,10,303 |
100.0 |
100.0 |
Memo Item |
I+II |
1,329 |
1,344 |
77.2 |
80.3 |
1,32,956 |
1,63,526 |
84.6 |
89.4 |
80,681 |
98,510 |
83.9 |
89.3 |
III+IV |
392 |
330 |
22.8 |
19.7 |
24,085 |
19,336 |
15.4 |
10.6 |
15,553 |
11,793 |
16.1 |
10.7 |
Note: Data for 2010 are provisional. |
5.9 The size of banking business-wise
classification of UCBs shows that less than one
fifth of total UCBs accounted for more than three
fourth of deposits as at end-March 2010.
Similarly, a little more than one tenth of total
UCBs accounted for almost 70 per cent of total
advances as at end-March 2010. Further, the
share of UCBs with deposits or advances less
than `100 crore in the total deposits and
advances declined as at end-March 2010 as
compared with the previous year (Table V.2).
Tier-wise and Scheduled Status-wise Profile
of UCBs
5.10 UCBs are also classified into scheduled
and non-scheduled as well as into tier I and tier
II categories.5 In terms of number of banks, the sector was dominated by non-scheduled tier I
banks, however, in terms of size of the banking
business the sector was dominated by
scheduled tier II banks. The banking business
per UCB was the highest in scheduled tier II
banks followed by non-scheduled tier II and
non-scheduled tier I. Thus, tier II banks, both
scheduled and non-scheduled together,
accounted for around 80 per cent of the total
banking business of the sector as at end-March
2010 (Table V.3).
5.11 There was a decrease in the number of
non-scheduled UCBs at end-March 2010 over
the previous year, while the number of
scheduled UCBs remained unchanged during
the same period. However, the number of tier II
UCBs in the non-scheduled sector increased as at end-March 2010 over the previous year. Thus,
the decline in the total number of UCBs was on
account of a decline in the non-scheduled Tier
I UCBs in Grades III and IV. Since these banks
are classified as financially weak, a reduction
in the number of these banks implies, ceteris
paribus, an overall improvement in the financial
strength of the sector. This may be attributed
to the consolidation process initiated by the
Reserve Bank as mentioned in Box V.1.
Table V.2 : Distribution of Urban Cooperative Banks by Size of Deposits and Advances |
(As at end-March 2010) |
(Amount in ` crore) |
Deposit base |
Distribution of UCBs by Size of Deposits |
Advances base |
Distribution of UCBs by Size of Advances |
Number of UCBs |
Deposits |
Number of UCBs |
Advances |
Number |
Percen
tage share in total |
Amount |
Percentage share in total |
Number |
Percen
tage share in total |
Amount |
Percentage share in total |
1 |
2 |
3 |
4 |
5 |
6 |
7 |
8 |
9 |
10 |
D ≥ 1000 |
25 |
1.5 |
66,401 |
36.3 |
Ad ≥ 1000 |
13 |
0.8 |
31,875 |
28.9 |
500 ≤ D < 1000 |
37 |
2.2 |
24,825 |
13.6 |
500 ≤ Ad < 1000 |
18 |
1.1 |
12,768 |
11.6 |
250 ≤ D < 500 |
67 |
4.0 |
23,178 |
12.7 |
250 ≤ Ad < 500 |
44 |
2.6 |
15,281 |
13.9 |
100 ≤ D < 250 |
196 |
11.7 |
31,108 |
17.0 |
100 ≤ Ad < 250 |
136 |
8.1 |
20,501 |
18.6 |
50 ≤ D < 100 |
244 |
14.6 |
17,023 |
9.3 |
50 ≤ Ad < 100 |
149 |
8.9 |
10,439 |
9.5 |
25 ≤ D < 50 |
301 |
18.0 |
11,037 |
6.0 |
25 ≤ Ad < 50 |
251 |
15.0 |
9,092 |
8.2 |
10 ≤ D < 25 |
435 |
26.0 |
7,247 |
4.0 |
10 ≤ Ad < 25 |
446 |
26.6 |
7,264 |
6.6 |
D < 10 |
369 |
22.0 |
2,043 |
1.1 |
Ad < 10 |
617 |
36.9 |
3,083 |
2.8 |
Total |
1,674 |
100.0 |
1,82,862 |
100.0 |
Total |
1,674 |
100.0 |
1,10,303 |
100.0 |
Memo Item |
100 ≤ D |
325 |
19.4 |
1,45,512 |
79.6 |
100 ≤ Ad |
211 |
12.6 |
80,425 |
72.9 |
100 > D |
1,349 |
80.6 |
37,350 |
20.4 |
100 > Ad |
1,463 |
87.4 |
29,878 |
27.1 |
D: Deposits, Ad: Advances
Note: Data are provisional. |
Table V.3: Profile of Urban Cooperative Banks |
(As at end-March 2010) |
(Amount in ` crore) |
Category |
No. of UCBs |
Deposits |
Loans and Advances |
Assets |
Tier I |
Tier II |
Total |
Tier I |
Tier II |
Total |
Tier I |
Tier II |
Total |
Tier I |
Tier II |
Total |
1 |
2 |
3 |
4 |
5 |
6 |
7 |
8 |
9 |
10 |
11 |
12 |
13 |
Scheduled |
- |
53 |
53 |
- |
80,207 |
80,207 |
- |
48,951 |
48,951 |
- |
1,04,228 |
1,04,228 |
Non-Scheduled |
1,353 |
268 |
1,621 |
37,350 |
65,305 |
1,02,655 |
22,630 |
38,722 |
61,352 |
50,674 |
81,156 |
1,31,830 |
Total |
1,353 |
321 |
1,674 |
37,350 |
1,45,512 |
1,82,862 |
22,630 |
87,673 |
1,10,303 |
50,674 |
1,85,384 |
2,36,058 |
| As percentage to all UCBs |
Scheduled |
- |
3.2 |
3.2 |
- |
43.9 |
43.9 |
- |
44.4 |
44.4 |
- |
44.2 |
44.2 |
Non-Scheduled |
80.8 |
16.0 |
96.8 |
20.4 |
35.7 |
56.1 |
20.5 |
35.1 |
55.6 |
21.5 |
34.4 |
55.8 |
| Total |
80.8 |
19.2 |
100.0 |
20.4 |
79.6 |
100.0 |
20.5 |
79.5 |
100.0 |
21.5 |
78.5 |
100.0 |
‘-‘: Nil.
Note : Data are provisional. |
Balance Sheet Operations of UCBs
5.12 Balance sheets of UCBs expanded at a
higher rate at end-March 2010 over the previous
year, which can be attributed to deposits on the
liability side, and investments and disbursement
of loans and advances on the asset side. While
the growth of capital accelerated at end-March
2010, reserves also grew at a high rate of around
20 per cent, though at a decelerated pace during
the same period. Deposits were the major liability
of the UCB sector, implying that the sector is
heavily dependent on deposits for resources. On
the assets side, while loans and advances
constituted almost half of total assets,
investments grew at the highest rate constituting
a little more than one third of the total assets
(Table V.4).
5.13 Balance sheets of scheduled UCBs
witnessed higher expansion than the balance sheets of non-scheduled UCBs as at end-March
2010 over the previous year. In both the
scheduled and non-scheduled segments,
expansion in the balance sheets was contributed
by deposits on the liability side. On the asset
side, while scheduled UCBs used their funds
for disbursements of loans and advances as well
as for investments, non-scheduled UCBs used
their funds primarily for investments.
Investments of Urban Cooperative Banks
5.14 The investment profile of UCBs shows
that majority of investments of UCBs were in
SLR instruments, constituting more than 80 per
cent of the total investments of UCBs as at end-
March 2010. Investments in Central
Government securities constituted around half
of the total SLR investments as at end-March
2010. Notably, the second major investment of
UCBs was term deposits with DCCBs. UCBs
were also having considerable amount of term
deposits with StCBs. This highlights the
interconnectedness of the urban and rural
cooperative sectors (Table V.5).
5.15 The non-SLR investments of scheduled
UCBs grew at a higher rate than that of nonscheduled
UCBs at end-March 2010 over the
previous year. On the contrary, SLR investments
grew at a higher rate for non-scheduled UCBs
as compared to scheduled UCBs (Table V.6).
Table V.4: Liabilities and Assets of Urban Cooperative Banks |
(As at end-March) |
(Amount in ` crore) |
Item |
Scheduled UCBs |
Non-Scheduled UCBs |
All UCBs |
2009 |
2010 |
2009 |
2010 |
2009 |
2010 |
1 |
2 |
3 |
4 |
5 |
6 |
7 |
Liabilities |
|
|
|
|
|
|
1. Capital |
1,417 |
1,672 |
3,720 |
3,975 |
5,137 |
5,647 |
|
(1.6) |
(1.6) |
(3.3) |
(3.0) |
(2.6) |
(2.4) |
2. Reserves |
9,286 |
10,576 |
11,706 |
14,520 |
20,992 |
25,096 |
|
(10.7) |
(10.1) |
(10.3) |
(11.0) |
(10.4) |
(10.6) |
3. Deposits |
66,713 |
80,207 |
90,329 |
1,02,655 |
1,57,042 |
1,82,862 |
|
(76.9) |
(77.0) |
(79.1) |
(77.9) |
(78.2) |
(77.5) |
4. Borrowings |
1,141 |
1,093 |
566 |
454 |
1,707 |
1,547 |
|
(1.3) |
(1.0) |
(0.5) |
(0.3) |
(0.8) |
(0.7) |
5. Other Liabilities |
8,205 |
10,680 |
7,861 |
10,225 |
16,066 |
20,905 |
|
(9.5) |
(10.2) |
(6.9) |
(7.8) |
(8.0) |
(8.9) |
Assets |
|
|
|
|
|
|
1. Cash in Hand |
543 |
586 |
1,529 |
1,632 |
2,072 |
2,218 |
|
(0.6) |
(0.6) |
(1.3) |
(1.2) |
(1.0) |
(0.9) |
2. Balances with Banks |
5,953 |
6,278 |
10,267 |
6,287 |
16,220 |
12,565 |
|
(6.9) |
(6.0) |
(9.0) |
(4.8) |
(8.1) |
(5.3) |
3. Money at Call and Short Notice |
1,203 |
406 |
727 |
1,060 |
1,930 |
1,466 |
|
(1.4) |
(0.4) |
(0.6) |
(0.8) |
(1.0) |
(0.6) |
4. Investments |
26,629 |
33,427 |
38,475 |
51,920 |
65,104 |
85,347 |
|
(30.7) |
(32.1) |
(33.7) |
(39.4) |
(32.4) |
(36.2) |
5. Loans and Advances |
40,504 |
48,951 |
55,730 |
61,353 |
96,234 |
1,10,304 |
|
(46.7) |
(47.0) |
(48.8) |
(46.5) |
(47.9) |
(46.7) |
6. Other Assets |
11,930 |
14,580 |
7,454 |
9,577 |
19,384 |
24,157 |
|
(13.8) |
(14.0) |
(6.5) |
(7.3) |
(9.6) |
(10.2) |
Total Liabilities/Assets |
86,762 |
1,04,228 |
1,14,182 |
1,31,829 |
2,00,944 |
2,36,057 |
|
(100.0) |
(100.0) |
(100.0) |
(100.0) |
(100.0) |
(100.0) |
Note: 1) Data for end-March 2010 are provisional.
2) Figures in parentheses are percentages to total liabilities/assets. |
Financial Performance of UCBs
5.16 In response to measures undertaken in
the sector, the financial performance of UCBs
witnessed considerable improvement over the
last one decade. The scheduled UCB sector started
reporting overall net profits since 2003-04 as
compared with net losses prior to it.
Accordingly, the return on assets (RoA) of the
scheduled UCB sector witnessed a rising trend
during the last one decade. However, owing to the spillover effects of the global financial
turmoil, net profits declined during 2008-09
and 2009-10. Consequently, the sector reported
lower RoA during the last two years as
compared with 2007-08. The decline in RoA was
mainly due to a decline in net interest margin
(NIM) and non interest margin (Non-IM) during
the last two years. An analysis of return on
assets (RoA) of the scheduled UCB sector for
the last one decade is provided in Box V.2.6
Table V.5 : Investments by Urban Cooperative Banks |
(As at end-March) |
(Amount in ` crore) |
Item |
As at end-March |
Percentage
variation |
2009 |
2010P |
2010P |
1 |
2 |
3 |
4 |
Total Investments (A+B) |
65,104 |
85,347 |
31.1 |
|
(100.0) |
(100.0) |
|
A. SLR Investments (i to vi) |
54,871 |
69,338 |
26.4 |
|
(84.3) |
(81.2) |
|
i) Central Government Securities |
34,187 |
40,656 |
18.9 |
|
(52.5) |
(47.6) |
|
ii) State Government Securities |
4,342 |
6,833 |
57.4 |
|
(6.7) |
(8.0) |
|
iii) Other Approved Securities |
410 |
393 |
-4.1 |
|
(0.6) |
(0.5) |
|
iv) Term Deposits with StCBs |
5,281 |
6,189 |
17.2 |
|
(8.1) |
(7.3) |
|
v) Term Deposits with DCCBs |
9,116 |
13,850 |
51.9 |
|
(14.0) |
(16.2) |
|
vi) Others, if any |
1,535 |
1,417 |
-7.7 |
|
(2.4) |
(1.7) |
|
B. Non-SLR Investments |
10,233 |
16,009 |
56.4 |
|
(15.7) |
(18.8) |
|
P: Provisional.
Note: 1) Non-SLR investments include commercial papers,
debentures,
bonds and units of debt and money market
mutual funds.
2) Figures in parentheses are percentages to total. |
5.17 All major items of the profit and loss
account of the UCB sector witnessed
deceleration as at end-March 2010 over the previous year. However, the deceleration was
more on the income side than on the
expenditure side leading to lower overall
operating profits as compared with the previous
year. Though there was a decline in provisions
and contingencies, it could not compensate for
the decline in operating profits. Net profits,
therefore, witnessed a decline at end-March
2010 as compared with the previous year.
Accordingly, there was a decline in the return
on assets (RoA) as well as net interest margin
(NIM) of the sector as at end-March 2010 over
end-March 2009. The non-interest margin
continued to be negative at end-March 2010 as
in the previous year. The non-interest income
registered an absolute decline at end-March
2010 over the previous year.
5.18 The interest income of scheduled UCBs
grew at a higher rate than that of non-scheduled
UCBs at end-March 2010 over the previous year.
Despite this, the non-scheduled UCBs were able
to post higher net profits because of the
deceleration in operating expenses, especially the
staff expenses during the same period. The noninterest
income of both the scheduled and nonscheduled
sectors posted a decline as at end-
March 2010 over the previous year (Table V.7).
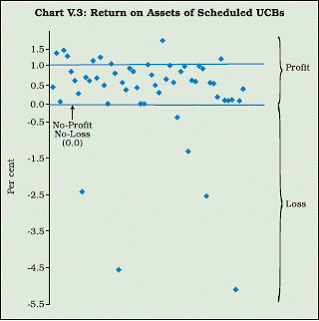
5.19 Accordingly, while the RoA of scheduled
UCB sector witnessed a decline, the RoA of the non-scheduled sector increased. Bank-wise
RoAs of the scheduled UCB sector revealed
that a few banks are incurring heavy losses,
while some others are at the margin, i.e.,
almost no profit no loss position, and majority
of banks are placed within the band 0 to 1 per
cent. The presence of loss making banks,
especially in the scheduled UCB sector is a
cause for concern as banks in the scheduled
UCB sector are large sized banks handling
considerable banking business (Chart V.3,
and Appendix Tables V.1 and V.2).
Table V.6: Composition of Investments of Scheduled and Non-Scheduled Urban Cooperative Banks |
(As at end-March) |
(Amount in ` crore) |
Item |
Non-Scheduled UCBs |
Scheduled UCBs |
All UCBs |
2008-09 |
2009-10P |
2008-09 |
2009-10P |
2008-09 |
2009-10P |
1 |
2 |
3 |
4 |
5 |
6 |
7 |
SLR investments |
31,587 |
41,293 |
23,284 |
28,045 |
54,871 |
69,338 |
|
(82.1) |
(79.5) |
(87.4) |
(83.9) |
(84.3) |
(81.2) |
Non-SLR investments |
6,888 |
10,627 |
3,345 |
5,382 |
10,233 |
16,009 |
|
(17.9) |
(20.5) |
(12.6) |
(16.1) |
(15.7) |
(18.8) |
Total Investments |
38,475 |
51,920 |
26,629 |
33,427 |
65,104 |
85,347 |
|
(100.0) |
(100.0) |
(100.0) |
(100.0) |
(100.0) |
(100.0) |
P : Provisional.
Note: Figures in parentheses are percentages to total. |
Box V.2: Actual RoA vis-à-vis Potential RoA – An Analysis of Scheduled Urban Cooperative Banks
The return on assets of scheduled UCBs witnessed a
rising trend over the last one decade. The ROA which
was negative up to the year 2002-03, turned out to be
positive in the year 2003-04 and remained positive
thereafter. However, during the last two years, RoA
exhibited a declining trend.
An attempt has been made to understand the deviation
of actual RoA from its potential during the last one
decade. The potential RoA is arrived at by taking the
highest net interest margin (NIM) and non-interest margin
(Non-IM), and the lowest provisioning requirements
achieved during the last one decade (Table).
It is visible from the chart that actual RoA deviated from
its potential throughout the decade. The analysis shows
that the deviation of actual RoA from its potential was
mainly due to higher provisioning requirements during
the first half of the decade. However, during the later years
there was an improvement in the asset quality of the
sector and as such the provisioning requirements
declined. Thus, in the latter half of the decade, the RoA
did not reach its potential level mainly because of a lower NIM and Non-IM. However, the unrealised portion of RoA
due to lower Non-IM was higher than that due to lower
NIM during the second half of the decade. Thus, it is
clear that the negative and declining Non-IM is the major
factor which is putting a downward pressure on the actual
RoA of the scheduled UCB sector followed by NIM. During
the last two years NIM as well as non-IM of UCBs
witnessed a declining trend.
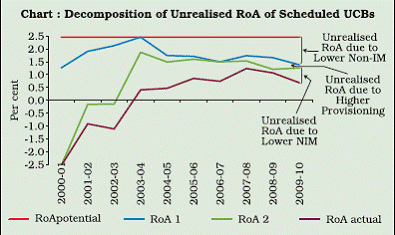 |
Table : Return on Assets of Scheduled UCBs |
Item |
2000-01 |
2001-02 |
2002-03 |
2003-04 |
2004-05 |
2005-06 |
2006-07 |
2007-08 |
2008-09 |
2009-10 |
1. NIM |
3.1 |
2.3 |
2.1 |
1.6 |
2.0 |
2.3 |
2.3 |
2.8 |
2.9 |
2.5 |
2. Non-IM |
-1.4 |
-0.7 |
-0.5 |
-0.2 |
-0.9 |
-0.9 |
-1.1 |
-0.9 |
-1.0 |
-1.2 |
3. Prov/Assets |
4.2 |
2.5 |
2.7 |
1.0 |
0.7 |
0.5 |
0.4 |
0.6 |
0.9 |
0.6 |
4. RoApotential |
2.5 |
2.5 |
2.5 |
2.5 |
2.5 |
2.5 |
2.5 |
2.5 |
2.5 |
2.5 |
5. RoA 1 |
1.3 |
1.9 |
2.1 |
2.5 |
1.7 |
1.7 |
1.5 |
1.7 |
1.7 |
1.4 |
6. RoA 2 |
-2.5 |
-0.2 |
-0.1 |
1.9 |
1.5 |
1.6 |
1.5 |
1.5 |
1.2 |
1.3 |
7. RoAactual |
-2.5 |
-0.9 |
-1.1 |
0.4 |
0.5 |
0.9 |
0.7 |
1.2 |
1.1 |
0.7 |
RoApotential : Arrived at using highest NIM and Non-IM, and lowest provisioning.
RoA 1 : Arrived at using highest NIM and lowest provisioning along with the actual Non-IM.
RoA 2 : Arrived at using highest NIM along with the actual provisioning and Non-IM.
Note : 1) Figures given in bold are maximum NIM and Non-IM, and minimum Provisioning to assets achieved by scheduled UCBs during
the last one decade.
2) Data for 2009-10 are provisional. |
Financial Soundness of UCBs
Asset Quality
5.20 There was an improvement in the asset
quality of the entire UCB sector both in absolute
and percentage terms as at end-March 2010 over
the previous year. However, both gross as well as
net non-performing loans of the UCB sector
continued to be on the higher side (Chart V.4).
5.21 Along with a decline in the nonperforming
loans, there was also an increase in the coverage ratio of UCBs at end-March 2010
over the previous year, indicating improvement
in the financial soundness of the sector
(Table V.8).
Table V.7: Financial Performance of Urban Cooperative Banks |
(As at end-March) |
(Amount in ` crore) |
Item |
Scheduled |
Non-Scheduled |
All UCBs |
2008-09 |
2009-10P |
2008-09 |
2009-10P |
2008-09 |
2009-10P |
1 |
2 |
3 |
4 |
5 |
6 |
7 |
A. |
Total Income (i+ii) |
7,714 |
8,341 |
10,695 |
11,688 |
18,409 |
20,029 |
|
|
(100.0) |
(100.0) |
(100.0) |
(100.0) |
(100.0) |
(100.0) |
|
i. Interest Income |
6,803 |
7,593 |
9,828 |
10,865 |
16,631 |
18,458 |
|
|
(88.2) |
(91.0) |
(91.9) |
(93.0) |
(90.3) |
(92.2) |
|
ii Non-Interest Income |
911 |
748 |
867 |
823 |
1,778 |
1,571 |
|
|
(11.8) |
(9.0) |
(8.1) |
(7.0) |
(9.7) |
(7.8) |
B. |
Total Expenditure (i+ii) |
6,133 |
7,156 |
8,814 |
9,756 |
14,947 |
16,912 |
|
|
(100.0) |
(100.0) |
(100.0) |
(100.0) |
(100.0) |
(100.0) |
|
i. Interest Expenditure |
4,444 |
5,226 |
6,241 |
7,013 |
10,685 |
12,239 |
|
|
(72.5) |
(73.0) |
(70.8) |
(71.9) |
(71.5) |
(72.4) |
|
ii. Non-Interest Expenditure |
1,689 |
1,930 |
2,573 |
2,743 |
4,262 |
4,673 |
|
|
(27.5) |
(27.0) |
(29.2) |
(28.1) |
(28.5) |
(27.6) |
|
of which: Staff Expenses |
815 |
1,192 |
1,548 |
1,670 |
2,363 |
2,862 |
C. |
Profit |
|
|
|
|
|
|
|
i. Amount of operating profit |
1,581 |
1,185 |
1,881 |
1,931 |
3,461 |
3,116 |
|
ii. Provisions, contingencies, taxes |
719 |
533 |
1,180 |
1,099 |
1,899 |
1,632 |
|
iii. Amount of net profit |
862 |
652 |
701 |
832 |
1,562 |
1,484 |
Memo Item |
|
|
|
|
|
|
i. Return on Assets |
1.1 |
0.7 |
0.6 |
0.7 |
0.8 |
0.7 |
ii. Return on Equity |
9.2 |
5.7 |
5.1 |
4.9 |
6.8 |
5.2 |
iii. Net Interest Margin |
2.9 |
2.5 |
3.3 |
3.1 |
3.1 |
2.8 |
iv. Non-Interest Margin |
-1.0 |
-1.2 |
-1.6 |
-1.6 |
-1.3 |
-1.4 |
P: Provisional.
Note:1) Figures in parentheses are percentages to total.
2) Ratios given as memo items are derived using average assets or equity as the denominator. |
 |
Capital Adequacy
5.22 As at end-March 2010, dominant portion
of UCBs were complying with the minimum
CRAR norm of 9 per cent. Nonetheless, about
13.7 per cent of total UCBs fell short of meeting
the regulatory norm with regard to capital
adequacy. Leverage was higher in the case of
scheduled UCBs as compared with the nonscheduled
category (Table V.9).
5.23 Bank-wise data on CRAR of scheduled
UCBs indicated that though majority of them were maintaining CRAR above the regulatory
minimum of 9 per cent, some of the
scheduled UCBs fell short of minimum level,
and more alarmingly, nine UCBs within them
reported negative CRAR as at end-March 2010
(Chart V.5 and Appendix Table V.1).
Table V.8: Non-Performing Assets of UCBs |
(As at end-March) |
(Amount in ` crore) |
Item |
Gross NPA |
Net NPA |
Provisioning |
Coverage Ratio |
1 |
2 |
3 |
4 |
5 |
2009 |
12,862 |
5,161 |
7,701 |
59.9 |
2010P |
12,727 |
4,724 |
8,003 |
62.9 |
P: Provisional.
Note: Coverage ratio is calculated as provisioning to gross NPAs. |
Table V.9: Leverage Ratio (LR) and
Distribution of UCBs According to CRAR |
(As at end-March 2010) |
Range of CRAR (Per cent) |
LR |
CRAR<3
|
3≤CRAR<6 |
6≤CRAR<9 |
CRAR≥9
|
1 |
2 |
3 |
4 |
5 |
6 |
Non-Scheduled |
14.0 |
135 |
25 |
58 |
1,403 |
|
|
(8.3) |
(1.5) |
(3.6) |
(86.6) |
Scheduled |
11.8 |
9 |
2 |
1 |
41 |
|
|
(17.0) |
(3.8) |
(1.9) |
(77.4) |
| All UCBs |
13.0 |
144 |
27 |
59 |
1,444 |
| |
|
(8.6) |
(1.6) |
(3.5) |
(86.3) |
Note : 1) Consolidated CRAR and leverage ratio for the UCB sector as a whole
may not be representative of the sector because of the large variation
across individual banks.
2) Figures in parentheses are percentages to respective totals.
3) Leverage ratio is calculated as ‘capital and reserves’ to total assets.
4) Data are provisional. |
Liquidity
5.24 A rough analysis based on balance sheets
of UCBs revealed that even if UCBs keep 100
per cent of their investments in liquid assets,
i.e., saleable within one to five days, these banks
would be able to manage only a deposit run of
50.9 per cent without any external help. The
detailed methodology and assumptions made
for this analysis is provided in Box V.3.
Financial Inclusion and UCBs
5.25 Along with commercial banks, UCBs are
also taking efforts to bring in more depositors and
borrowers to the formal network of banking.
Box V.3: Liquidity Analysis of Urban Cooperative Banks
UCBs are heavily dependent on deposits for resources.
In this context, it is important to undertake liquidity
stress tests to understand the strength of the sector in
the event of a deposit run caused by external factors such
as loss of confidence in these banks. However, conducting
a stress test, i.e., analysing the liquidity position of UCBs
after giving a shock of certain percentage of deposit run,
was not possible owing to the unavailability of detailed
maturity profile of investments of UCBs. A bank-wise
analysis was also not possible due to unavailability of
data. Thus, a rough analysis based on the consolidated
balance sheets of the UCB sector has been conducted by
making certain assumptions about the asset profile of
UCBs. Assumptions made are broadly based on those
made by the Financial Stability Report for the liquidity
stress test of scheduled commercial banks (SCBs).
Assumptions
1. A stressed withdrawal of deposits is assumed to take
place within a span of five days.
2. UCBs are assumed to meet the deposit run primarily
by using liquid resources available with them before
resorting to any external help.
3. Among assets of UCBs, loans and advances, and other
assets which, inter alia, includes overdue interest
receivable, premises, furniture, fixtures, bills and
purchased and discounted, are treated as illiquid assets.
4. Further, cash, balances with banks, and money at
call and short notice are treated as liquid assets.
5. Apart from these liquid assets, liquid investments,
i.e., investments saleable within one to five days,
would also be available for meeting the deposit run.
6. Sale of liquid investments is assumed to take place
at a haircut of 10 per cent.
7. Seven scenarios have been created by assuming
different percentages of total investments to be liquid.
Scenarios developed are based on very stringent
assumptions, which are extreme.The detailed calculation
of manageable level of deposit run at different percentages
of liquid investments for the year 2009-10 is presented
in the Table. Data used for the analysis are provisional.
The manageable level of deposit run calculated as total
liquid funds to total deposits for different levels of liquid
investments is depicted in the Chart. It clearly shows that
even if UCBs maintain 100 per cent of their investment
in liquid assets, they will be able to manage only a deposit
run of 50.9 per cent without any external help. It may be
noted that 80 per cent of total investments of UCBs are
SLR investments. If we assume that all SLR investments
are saleable within 5 days, UCBs would be able to manage
a deposit run of 42.5 per cent.
Table : Liquidity Analysis of UCBs |
(Amount in ` crore) |
Item |
Scenarios |
I |
II |
III |
IV |
V |
VI |
VII |
1 |
2 |
3 |
4 |
5 |
6 |
7 |
8 |
1. |
Cash |
2,218 |
2,218 |
2,218 |
2,218 |
2,218 |
2,218 |
2,218 |
2. |
Balances with banks |
12,565 |
12,565 |
12,565 |
12,565 |
12,565 |
12,565 |
12,565 |
3. |
Money at Call and Short Notice |
1,466 |
1,466 |
1,466 |
1,466 |
1,466 |
1,466 |
1,466 |
4. |
Total Investments |
85,347 |
85,347 |
85,347 |
85,347 |
85,347 |
85,347 |
85,347 |
5. |
Percentage of Liquid Investments |
10 |
25 |
40 |
50 |
60 |
80 |
100 |
6. |
Actual Liquid Investments |
8,535 |
21,337 |
34,139 |
42,674 |
51,208 |
68,278 |
85,347 |
7. |
Ten per cent haircut on sale |
853 |
2,134 |
3,414 |
4,267 |
5,121 |
6,828 |
8,535 |
8. |
Sale of liquid investments (6-7) |
7,681 |
19,203 |
30,725 |
38,406 |
46,087 |
61,450 |
76,812 |
9. |
Total liquid funds (1+2+3+8) |
23,930 |
35,452 |
46,974 |
54,655 |
62,336 |
77,699 |
93,061 |
Manageable Level of Deposits Run |
13.1 |
19.4 |
25.7 |
29.9 |
34.1 |
42.5 |
50.9 |
No-frills Accounts
5.26 Among initiatives taken so far,
introduction of ‘no-frills accounts’ was one of
the most important steps to expand the banking network. Notably, UCBs also opened a
considerable number of ‘no-frills accounts’ so
far. As the non-scheduled UCB sector handles
more banking business than the scheduled UCB sector, the number of deposits accounts, ‘nofrills’
accounts as also loan accounts were
higher in the non-scheduled sector as compared
with the scheduled sector. However, the share
of loan accounts of the non-scheduled sector
vis-à-vis scheduled sector was particularly
striking as the scheduled sector was having
only eight per cent of the total loan accounts
of the entire UCB sector (Table V.10).
Table V.10 : Details of Deposits and Loans
Accounts of UCBs |
(As at end-March 2010) |
Item |
Scheduled |
Non-Scheduled |
All UCBs |
1 |
2 |
3 |
4 |
Number of Deposit Accounts |
2,19,15,317 |
3,98,45,850 |
6,17,61,167 |
|
(35.5) |
(64.5) |
|
Of which: No-frills Accounts |
3,41,434 |
8,98,007 |
12,39,441 |
|
(27.5) |
(72.5) |
|
Number of Loan Accounts |
12,51,546 |
1,43,03,228 |
1,55,54,774 |
|
(8.0) |
(92.0) |
|
Memo Item |
Credit-Deposit Ratio |
61.0 |
59.8 |
60.3 |
Average Deposit per Account (in Rupees) |
36,599 |
25,763 |
29,608 |
Average Loan per Account (in Rupees) |
3,91,124 |
42,895 |
70,913 |
Note: 1) Figures in parentheses are percentages to respective totals.
2) The interpretation of average deposit per account as well as
average loan per account may take into account the fact that there
can be multiple deposit and loan accounts in the name of the
same individual.
3) Data are provisional. |
Priority Sector Advances
5.27 Priority sector lending targets
introduced in 1983 were mainly aimed at
directing a portion of total credit to some
specific sectors of the economy which, inter
alia, includes weaker sections, small
enterprises, and housing.7 As at end-March
2010, about 65 per cent of total advances of
UCBs went to priority sectors of which more
than 16 per cent of the total advances went to
weaker sections (Table V.11).
Table V.11: Advances to Priority Sectors and
Weaker Sections by Urban Cooperative Banks |
(As at end-March 2010) |
(Amount in ` crore) |
Sector |
Priority Sector |
Of which:
Weaker Sections |
Amount |
Percentage share in total advances |
Amount |
Percentage share in total advances |
1 |
2 |
3 |
4 |
5 |
Agriculture and Allied Activities |
6,383 |
5.8 |
2,225 |
2.0 |
1. Direct Finance |
1,882 |
1.7 |
611 |
0.6 |
2. Indirect Finance |
4,501 |
4.1 |
1,614 |
1.5 |
Retail Trade |
10,429 |
9.5 |
3,005 |
2.7 |
Small Enterprises |
29,279 |
26.5 |
4,400 |
4.0 |
1. Direct Finance |
20,622 |
18.7 |
3,207 |
2.9 |
2. Indirect Finance |
8,657 |
7.8 |
1,193 |
1.1 |
Educational Loans |
1,838 |
1.7 |
591 |
0.5 |
Housing Loans |
17,923 |
16.2 |
5,213 |
4.7 |
Micro Credit |
4,779 |
4.3 |
2,077 |
1.9 |
State Sponsored Organisations for SC/ST |
754 |
0.7 |
387 |
0.4 |
Total |
71,385 |
64.7 |
17,898 |
16.2 |
Note: Data are provisional. |
5.28 The composition of the priority sector
lending of UCBs as at end-March 2010 showed
that maximum loans under priority sectors went
to small enterprises sector followed by housing
and retail trade. Further, the composition of
lending to weaker sections showed that almost
one third of it went to the housing sector and
another one fourth went to small enterprises
(Chart V.6).
Outreach of UCBs across States in India
5.29 The distribution of UCBs across States
showed that as at end-March 2010 one third of
all UCBs, almost half of all branches of UCBs,
around 60 per cent of total extension counters
of UCBs and more than 85 per cent of ATMs of
UCBs were located in Maharashtra. Accordingly,
more than 60 per cent of the total banking
business of the UCB sector was concentrated in Maharashtra leaving very low volume of
operations in rest of the States (Chart V.7).
5.30 The normalised Herfindahl-Hirschman
Index showed that the State-wise concentration
of UCBs went up as at end-March 2010 over
the previous year. Further, it also showed that
State-wise concentration was more in the case
of ATMs followed by extension counters,
branches and number of UCBs. Similarly, the
normalised Herfindahl-Hirschman Index for the grade-wise distribution of UCBs across
banking centres showed that concentration was
more in grades III and IV UCBs across banking
centres as compared with UCBs in grades I and II
(Table V.12).
3. Rural Cooperatives
5.31 This section presents an analysis of the
financial performance, soundness and balance
sheet indicators of rural cooperatives, both
short-term and long-term, using the latest
available data.8
Financial Position of Rural Cooperatives
5.32 The overall financial position of rural
cooperative credit institutions improved as at
end-March 2009 over the previous year. As at
end-March 2009, half of the total rural
cooperative credit institutions reported profits.
Profits reported by the sector mainly emanated
from DCCBs. While StCBs, DCCBs and State
Cooperative Agriculture and Rural
Development Banks (SCARDBs) reported
overall net profits at end-March 2009, ground
level institutions, viz., Primary Agricultural
Credit Societies (PACS), and Primary
Cooperative Agriculture and Rural
Development Banks (PCARDBs) reported overall net losses. Despite the improved
financial performance, the asset quality of the
sector witnessed deterioration during the same
period. The short-term rural cooperative credit
institutions had the major share of nonperforming
loans of the entire rural cooperative
credit institutions as at end-March 2009.
Notably, ground level institutions, viz., PACS
and PCARDBs reported higher NPA ratios as
compared with institutions in upper tiers.
Another notable trend in the rural cooperative
sector is that while the dependence of shortterm
cooperative credit institutions on
borrowings continued to be low (except PACS),
that of long-term cooperative credit institutions
were quite high (Table V.13).
Table V.12: State-wise and Centre-wise Details of UCBs |
(As at end-March 2010) |
State |
Centre/s |
Grades |
Number of |
I |
II |
III |
IV |
All UCBs |
Branches |
Extension Counters |
ATMs |
1 |
2 |
3 |
4 |
5 |
6 |
7 |
8 |
9 |
10 |
Gujarat |
Ahmedabad |
118 |
98 |
12 |
21 |
249 |
874 |
10 |
69 |
Karnataka |
Bangalore |
126 |
90 |
38 |
16 |
270 |
848 |
9 |
19 |
Madhya Pradesh |
Bhopal |
13 |
24 |
11 |
5 |
53 |
91 |
1 |
- |
Orissa |
Bhubaneswar |
2 |
5 |
2 |
3 |
12 |
45 |
4 |
- |
PB/HR/HP |
Chandigarh |
7 |
5 |
1 |
3 |
16 |
40 |
3 |
2 |
Tamil Nadu |
Chennai |
98 |
27 |
1 |
4 |
130 |
313 |
- |
4 |
Uttarakhand |
Dehradun |
4 |
1 |
- |
- |
5 |
54 |
2 |
3 |
Assam/North East |
Guwahati |
9 |
6 |
1 |
1 |
17 |
40 |
1 |
- |
Andhra Pradesh |
Hyderabad |
65 |
34 |
4 |
8 |
111 |
245 |
5 |
2 |
Rajasthan |
Jaipur |
26 |
10 |
1 |
2 |
39 |
189 |
3 |
- |
Jammu and Kashmir |
Jammu |
3 |
- |
- |
1 |
4 |
16 |
4 |
- |
West Bengal/Sikkim |
Kolkata |
30 |
4 |
3 |
11 |
48 |
101 |
2 |
1 |
Uttar Pradesh |
Lucknow |
48 |
6 |
9 |
7 |
70 |
190 |
28 |
8 |
Maharashtra |
Mumbai |
216 |
91 |
51 |
45 |
557 |
3,407 |
122 |
731 |
|
Nagpur |
59 |
38 |
37 |
20 |
|
|
|
|
New Delhi |
New Delhi |
11 |
2 |
1 |
1 |
15 |
65 |
1 |
- |
Bihar/Jharkhand |
Patna |
5 |
- |
- |
- |
5 |
6 |
1 |
- |
Chhattisgarh |
Raipur |
7 |
3 |
2 |
1 |
13 |
21 |
2 |
1 |
Kerala |
TVM |
32 |
21 |
5 |
2 |
60 |
339 |
2 |
- |
Total |
879 |
465 |
179 |
151 |
1,674 |
6,884 |
200 |
840 |
TVM: Thiruvananthapuram. PB: Punjab. HR: Haryana. HP: Himachal Pradesh. ‘-’ : Nil.
Note: 1) Data are provisional.
2) Branches include head office cum branch.
3) Out of 840 ATMs, 26 were off-site ATMs and rest were onsite ATMs. Offsite ATMs are located in four States, i.e., 16 in
Maharashtra, 6 in Uttar Pradesh, 3 in Gujarat and one in Karnataka. |
Management of Cooperatives
5.33 As at end-March 2009, boards of around
one third of rural cooperative credit institutions
(excluding PACS) were under supersession.
However, the number of institutions with
supersession of boards declined at end-March
2009 over the previous year. Supersession of
boards was the highest among SCARDBs at end-
March 2009 (Table V.14).
Short-term Structure of Rural Cooperatives
5.34 The short-term rural cooperative credit
institutions reported overall profits as at end-
March 2009 as against overall losses in the previous year. The turnaround in the overall
financial position of these institutions was
mainly due to profits reported by DCCBs and
lower losses reported by PACS as compared
with the previous year. Apart from improving
the financial position, the balance sheet of these
institutions also witnessed an expansion at end-
March 2009 over the previous year. StCBs registered the highest expansion of balance
sheets followed by DCCBs and PACS. While the
asset quality of StCBs and DCCBs improved at
end-March 2009 over the previous year that of
PACS deteriorated during the same period.
Notably, PACS reported the highest nonperforming
loans to outstanding loans ratio
among rural cooperative credit institutions.
Table V.13 : A Profile of Rural Cooperative Banks |
(At end-March 2009) |
(Amount in ` crore) |
Item |
Short-Term |
Long-Term |
Total |
StCBs |
DCCBs |
PACS |
SCARDBs |
PCARDBs |
1 |
2 |
3 |
4 |
5 |
6 |
7 |
A. |
No. of Cooperative Banks |
31 |
370 |
95,633 |
20 |
697 |
96,751 |
B. |
Balance Sheet Indicators |
|
|
|
|
|
|
|
i) Owned Funds (Capital + Reserves) |
11,726 |
29,792 |
11,806 |
4,003 |
5,007 |
62,334 |
|
ii) Deposits |
68,659 |
1,27,623 |
26,245 |
711 |
400 |
2,23,638 |
|
iii) Borrowings |
20,874 |
27,664 |
48,938 |
15,849 |
12,365 |
1,25,690 |
|
iv) Loans and Advances Issued* |
93,883 |
90,105 |
58,787 |
2,585 |
1,195 |
2,46,555 |
|
v) Loans and Advances Outstanding |
48,079 |
99,429 |
64,044 |
16,421 |
11,268 |
2,39,241 |
|
vi) Investments |
45,230 |
64,709 |
- |
2,941 |
1,122 |
1,14,002 |
|
vii) Total Liabilities/Assets |
1,06,321 |
1,95,684 |
94,585+ |
25,386 |
24,846 |
4,46,822 |
C. |
Financial Performance |
|
|
|
|
|
|
|
i) Institutions in Profit |
|
|
|
|
|
|
|
a) No. |
26 |
320 |
37,291 |
11 |
303 |
37,951 |
|
b) Amount of Profit |
385 |
1,603 |
843 |
398 |
177 |
3,406 |
|
ii) Institutions in Loss |
|
|
|
|
|
|
|
a) No. |
5 |
50 |
45,869 |
8 |
309 |
46,241 |
|
b) Amount of Loss |
-71 |
-287 |
-1,915 |
-349 |
-375 |
-2,997 |
|
iii) Overall Profit (+)/Loss (-) |
314 |
1,316 |
-1,072 |
49 |
-198 |
408 |
|
iv) Accumulated Loss |
459 |
5,213 |
- |
1,108 |
3,678 |
10,458 |
D. |
Non-performing Assets |
|
|
|
|
|
|
|
i) Amount |
5,764 |
17,929 |
37,937++ |
4,938 |
4,393 |
70,961 |
|
ii) As Percentage of Loans Outstanding |
12.0 |
18.0 |
59.2 |
30.1 |
39.0 |
29.7 |
|
iii) Recovery of Loans to Demand (Per cent) |
92 |
72 |
- |
49 |
39 |
- |
StCBs: State Cooperative Banks, DCCBs: District Central Cooperative Banks, PACS: Primary Agricultural Credit Societies, SCARDBs:
State Cooperative Agriculture and Rural Development Banks, PCARDBs: Primary Cooperative Agriculture and Rural Development
Banks.
*: April- March, ‘-‘ : Not available. +: Working capital. ++ : Total overdues.
Note: 1) Data are provisional.
2) Data for StCBs in Bihar, West Bengal and Tripura are repeated for the year 2008-09.
3) Data for DCCBs of Bihar, Jharkhand, West Bengal and Kerala are repeated for the year 2008-09.
4) During 2008-09, 12,473 PACS were in no-profit no-loss position.
5) Data for SCARDBs in Maharashtra are repeated for 2008-09 from the year 2007-08.
6) SCARDB in Manipur is defunct.
Source: NABARD and NAFSCOB. |
Table V.14 : Elected Boards under Supersession |
(Position as on March 31, 2009) |
Item |
StCBs |
DCCBs |
SCARDBs |
PCARDBs |
Total |
1 |
2 |
3 |
4 |
5 |
6 |
(i) Total number of institutions |
31 |
370 |
20 |
697 |
1,118 |
| (ii) Number of institutions where Boards were under Supersession |
9 |
127 |
9 |
265 |
410 |
Percentage of reporting Boards under supersession [(ii) as per cent of (i)] |
29.0 |
34.3 |
45.0 |
38.0 |
36.7 |
StCBs : State Cooperative Banks, DCCBs: District Central Cooperative Banks, SCARDBs: State Cooperative Agriculture and
Rural
Development Banks, PCARDBs: Primary Cooperative Agriculture and Rural Development Banks.
Note : 1) Data related to SCARDBs in Bihar and DCCBs in Bihar and Jharkhand are repeated for 2008-09.
2) SCARDB in Manipur is defunct.
3) Data are provisional.
Source: NABARD. |
State Cooperative Banks
Balance Sheet Operations of State Cooperative
Banks
5.35 During 2008-09, balance sheets of StCBs
witnessed a higher growth as compared with the
previous year, which can be attributed to deposits
on the liabilities side and investments on the
assets side. However, loans and advances
declined at end-March 2009 over the previous
year. While the share of deposits in liabilities
moved up at end-March 2009 compared to the
previous year, the share of borrowings declined.
However, the increase in deposits was used for
building up investments rather than providing
loans, may be because of the increased risk
averseness of these banks in wake of the general
economic meltdown during the year on the one
hand and for reaping treasury gains on the other
(Table V.15).
5.36 Updated information on major balance
sheet indicators of 16 scheduled StCBs
available from Section 42(2) returns shows
further improvement in major indicators as at
last reporting Friday of 2009-10 over the
previous year. The growth in SLR investments
witnessed acceleration during 2009-10 over
2008-09. Notably, there was also a revival in
bank credit disbursed by scheduled StCBs,
which reported a positive growth during 2009-10 as against a contraction during the previous year
(Table V.16).
Table V.15 : Liabilities and Assets of State
Cooperative Banks |
(Amount in ` crore) |
Item |
As at end-March |
Percentage variation |
2007-08 |
2008-09P |
2007-08 |
2008-09P |
1 |
2 |
3 |
4 |
5 |
Liabilities |
|
|
|
|
1. Capital |
1,534 |
1,569 |
23.2 |
2.3 |
|
(1.6) |
(1.5) |
|
|
2. Reserves |
9,905 |
10,157 |
6.5 |
2.5 |
|
(10.4) |
(9.6) |
|
|
3. Deposits |
56,325 |
68,659 |
16.0 |
21.9 |
|
(59.3) |
(64.6) |
|
|
4. Borrowings |
22,577 |
20,874 |
1.4 |
-7.5 |
|
(23.8) |
(19.6) |
|
|
5. Other Liabilities |
4,637 |
5,062 |
5.6 |
9.2 |
|
(4.9) |
(4.8) |
|
|
Assets |
|
|
|
|
1. Cash and Bank balance |
8,312 |
7,921 |
-10.5 |
-4.7 |
|
(8.8) |
(7.4) |
|
|
2. Investments |
31,541 |
45,230 |
30.7 |
43.4 |
|
(33.2) |
(42.5) |
|
|
3. Loans and Advances |
50,028 |
48,079 |
5.6 |
-3.9 |
|
(52.7) |
(45.2) |
|
|
4. Other Assets |
5,095 |
5,092 |
2.5 |
-0.1 |
|
(5.4) |
(4.8) |
|
|
Total Liabilities/Assets |
94,977 |
1,06,321 |
10.8 |
11.9 |
|
(100.0) |
(100.0) |
|
|
P: Provisional
Note : 1) Figures in parentheses are percentages to total liabilities/assets.
2) Data for StCBs in Bihar, West Bengal and Tripura are repeated
for the year 2008-09.
3) 'Reserves' include credit balance in profit and loss account shown
separately by some of the banks.
Source : NABARD. |
Table V.16: Salient Balance Sheet Indicators
of Scheduled StCBs |
(Amount in ` crore) |
Item |
As on Last Reporting
Friday of March |
2008 |
2009 |
2010 |
1 |
2 |
3 |
4 |
Aggregate Deposits |
42,396 |
52,568 |
65,175 |
|
(16.0) |
(24.0) |
(24.0) |
Bank Credit |
46,886 |
42,372 |
43,350 |
|
(5.0) |
-(9.6) |
(2.3) |
SLR Investments |
15,773 |
17,179 |
23,905 |
|
(17.6) |
(8.9) |
(39.2) |
Note : Figures in parentheses indicate percentage change
over the previous year.
Source : Form B returns of Section 42(2) data. |
Financial Performance of StCBs
5.37 The financial performance of StCBs
improved as at end-March 2009 over the
previous year in terms of higher net profits,
higher ROA, and higher ROE. Not only
profitability indicators improved for StCBs, but
the number of institutions in profit also
increased as compared with the previous year.
However, operating profits of StCBs declined as
at end-March 2009 over the previous year
mainly on account of higher growth in interest
expenses and operating expenses as compared
with growth in income. StCBs, however,
reported higher net profits owing to a decline
in provisions and contingencies (Table V.17).
Financial Soundness of StCBs
Asset Quality
5.38 The asset quality of StCBs improved as
at end-March 2009 over the previous year both
in absolute and percentage terms. Category-wise
details of non-performing loans showed that
highest decline was in the loss category. Thus,
the share of loss assets in the total nonperforming
loans declined in 2008-09 over
2007-08. Similarly, sub-standard assets also
witnessed a decline during 2008-09 over the
previous year bringing down its share in total non-performing loans in 2008-09 as compared
with the previous year. The decline in substandard
assets indicates that fresh additions
to non-performing loans were comparatively
less in 2008-09 as compared with the previous
year (Chart 8 and Table V.18).
Table V.17: Financial Performance of State
Cooperative Banks |
(Amount in ` crore) |
Item |
As at end-March |
Percentage variation |
2007-08 |
2008-09P |
2007-08 |
2008-09P |
1 |
2 |
3 |
4 |
5 |
A. Income (i+ii) |
6,194 |
7,372 |
18.1 |
19.0 |
|
(100.0) |
(100.0) |
|
|
i. Interest Income |
5,980 |
7,065 |
20.2 |
18.1 |
|
(96.5) |
(95.8) |
|
|
ii. Other Income |
214 |
307 |
-20.2 |
43.3 |
|
(3.5) |
(4.2) |
|
|
B. Expenditure (i+ii+iii) |
5,973 |
7,058 |
20.2 |
18.2 |
|
(100.0) |
(100.0) |
|
|
i. Interest Expended |
4,586 |
5,563 |
23.7 |
21.3 |
|
(76.8) |
(78.8) |
|
|
ii. Provisions and Contingencies |
543 |
419 |
|
|
|
(9.1) |
(5.9) |
8.1 |
-22.8 |
iii. Operating expenses |
844 |
1,076 |
11.5 |
27.4 |
|
(14.1) |
(15.2) |
|
|
of which, Wage Bill |
458 |
498 |
15.1 |
8.7 |
|
(7.7) |
(7.1) |
|
|
C. Profit |
|
|
|
|
i. Operating Profit |
764 |
733 |
-1.8 |
-4.0 |
ii. Net Profit |
221 |
314 |
-19.7 |
42.0 |
iii. Return on Assets |
0.2 |
0.3 |
|
|
iv. Return on Equity |
2.0 |
2.7 |
|
|
v. Net Interest Margin |
1.5 |
1.5 |
|
|
P: Provisional
Note: 1) Figures in parentheses are percentages to the respective totals.
2) Data for StCBs in Bihar, West Bengal and Tripura are repeated
for the year 2008-09.
Source: NABARD. |
Capital Adequacy
5.39 The capital adequacy of StCBs declined
as at end-March 2009 over the previous year.
As data on risk weighted assets were not
available for StCBs, the ratio of ‘capital and
reserves’ to ‘investments and advances’ was
taken as a rough indicator of capital adequacy.
This ratio declined at end-March 2009 as compared with the previous year. The decline
in capital adequacy was mainly on account of a
higher increase in investments as compared
with marginal increase in capital and reserves
(Table V.18).
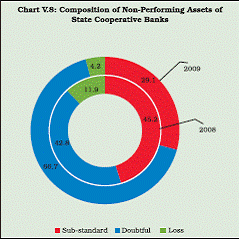 |
Table V.18 : Soundness Indicators of State
Cooperative Banks |
(Amount in ` crore) |
Item |
As at end-March |
Percentage variation |
2008 |
2009P |
2008 |
2009P |
1 |
2 |
3 |
4 |
5 |
A. Total NPAs (i+ii+iii) |
6,191 |
5,764 |
-7.7 |
-6.9 |
i) Sub-standard |
2,801 |
1,678 |
-5.3 |
-40.1 |
ii) Doubtful |
2,653 |
3,843 |
1.1 |
44.9 |
iii) Loss |
737 |
242 |
-34.3 |
-67.2 |
B. NPAs to Loans Ratio |
12.4 |
12.0 |
|
|
i) Recovery to Demand (%) |
84.6 |
91.8 |
|
|
ii) Provisions Required |
2,657 |
2,883 |
-5.8 |
8.5 |
iii) Provision Made |
3,000 |
3,309 |
-6.2 |
10.3 |
C. CRAR* |
14.0 |
12.6 |
|
|
D. Leverage Ratio |
12.0 |
11.0 |
|
|
P: Provisional
* : Calculated as ratio of 'capital and reserves' to 'investments and advances'.
Source: NABARD. |
District Central Cooperative Banks
Balance Sheet Operations of District Central
Cooperative Banks
5.40 DCCBs form the second tier of the rural
short-term cooperative credit structure.9 During
2008-09, balance sheets of DCCBs witnessed a
lower growth as compared with the previous
year. The growth in balance sheets of DCCBs
can be attributed to deposits on the liabilities
side and investments on the assets side. On the
liabilities side, borrowings of DCCBs witnessed
a decline as at end-March 2009 over the
previous year indicating a lower dependence on
borrowings for resources by DCCBs. In
contrast, deposit mobilisation picked up during
the year increasing its share in total liabilities
of DCCBs. However, as in the case of StCBs,
the increased deposit mobilisation was
reflected in increased investments rather than
an increase in loans and advances. This may
either be due to the risk averseness of these
banks or may be intended to reap treasury gains
(Table V.19).
Financial Performance of DCCBs
5.41 There was an overall improvement in the
financial performance of DCCBs as at end-
March 2009 over the previous year. Importantly,
DCCBs reported overall net profits as at end-
March 2009 as compared with the reported net
losses during the previous year, thus, witnessing
a turnaround in their financial position. The
number of profit making DCCBs also increased
during the same period. Accordingly,
profitability indicators such as ROA and ROE
also witnessed improvement during the year as
compared with the previous year. In contrast
with the trend observed in case of StCBs,
DCCBs reported higher operating profits as at
end-March 2009 mainly on account of higher
net interest income. However, the increase in net profits was more than that in operating
profits owing to a decline in provisions and
contingencies (Table V.20).
Table V.19 : Liabilities and Assets of District Central Cooperative Banks |
(Amount in ` crore) |
Item |
As at end-March |
Percentage variation |
2008 |
2009P |
2008 |
2009P |
1 |
2 |
3 |
4 |
5 |
Liabilities |
|
|
|
|
1. Capital |
5,939 |
6,578 |
8.8 |
10.8 |
|
(3.3) |
(3.4) |
|
|
2. Reserves |
22,467 |
23,214 |
8.4 |
3.3 |
|
(12.6) |
(11.9) |
|
|
3. Deposits |
1,09,597 |
1,27,623 |
15.9 |
16.4 |
|
(61.3) |
(65.2) |
|
|
4. Borrowings |
32,130 |
27,664 |
7.4 |
-13.9 |
|
(18.0) |
(14.1) |
|
|
5. Other Liabilities |
8,749 |
10,605 |
5.8 |
21.2 |
|
(4.9) |
(5.4) |
|
|
Assets |
|
|
|
|
1. Cash and Bank balance |
10,609 |
12,918 |
-5.9 |
21.8 |
|
(5.9) |
(6.6) |
|
|
2. Investments |
48,228 |
64,709 |
17.6 |
34.2 |
|
(27.0) |
(33.1) |
|
|
3. Loans and Advances |
1,01,221 |
99,429 |
13.7 |
-1.8 |
|
(56.6) |
(50.8) |
|
|
4. Other Assets |
18,823 |
18,629 |
7.1 |
-1.0 |
|
(10.5) |
(9.5) |
|
|
Total Liabilities/Assets |
1,78,881 |
1,95,684 |
12.6 |
9.4 |
|
(100.0) |
(100.0) |
|
|
P: Provisional
Note: 1) Figures in parentheses are percentages to total.
2) 'Reserves' include credit balance in profit and loss account shown
separately by some of the banks.
3) Data for DCCBs of Bihar, Jharkhand, West Bengal and Kerala
are repeated for the year 2008-09, as the latest data were not
available.
Source: NABARD. |
Financial Soundness of DCCBs
Asset Quality
5.42 The asset quality of DCCBs improved as
at end-March 2009 over the previous year both
in absolute and percentage terms. The absolute
decline in total non-performing loans was due
to an absolute decline in doubtful loans during
2008-09 over the previous year. However, substandard
loans and loss loans increased during 2008-09 over the previous year. During 2008-09,
sub-standard loans were the major category in
the total non-performing loans followed by
doubtful loans and loss loans (Chart 9 and
Table V.21).
Table V.20: Financial Performance of District Central Cooperative Banks |
(Amount in ` crore) |
Item |
As at end-March |
Percentage variation |
2007-08 |
2008-09P |
2007-08 |
2008-09P |
1 |
2 |
3 |
4 |
5 |
A. Income (i+ii) |
13,135 |
16,107 |
12.7 |
22.6 |
|
(100.0) |
(100.0) |
|
|
i. Interest Income |
11,980 |
14,619 |
13.0 |
22.0 |
|
(91.2) |
(90.8) |
|
|
ii. Other Income |
1,155 |
1,488 |
9.5 |
28.9 |
|
(8.8) |
(9.2) |
|
|
B. Expenditure (i+ii+iii) |
13,274 |
14,792 |
14.2 |
11.4 |
|
(100.0) |
(100.0) |
|
|
i. Interest Expended |
7,872 |
9,239 |
18.0 |
17.4 |
|
(59.3) |
(62.5) |
|
|
ii. Provisions and Contingencies |
2,423 |
2,140 |
6.1 |
-11.7 |
|
(18.3) |
(14.5) |
|
|
iii. Operating expenses |
2,980 |
3,413 |
11.6 |
14.5 |
|
(22.4) |
(23.1) |
|
|
of which, Wage Bill |
1,980 |
2,243 |
7.8 |
13.3 |
|
(14.9) |
(15.2) |
|
|
C. Profit |
|
|
|
|
i. Operating Profit |
2,284 |
3,456 |
-1.3 |
51.3 |
ii. Net Profit |
-139 |
1,315 |
- |
- |
iii. Return on Assets |
-0.1 |
0.7 |
|
|
iv. Return on Equity |
-0.5 |
4.5 |
|
|
v. Net Interest Margin |
2.4 |
2.9 |
|
|
P: Provisional
Note: 1) Figures in parentheses are percentages to total.
2) Data for DCCBs of Bihar, Jharkhand, West Bengal and Kerala
are repeated for the year 2008-09, as the latest data were not
available.
Source: NABARD. |
Capital Adequacy
5.43 The capital adequacy of DCCBs
witnessed a decline as at end-March 2009 over
the previous year. As data on risk weighted
assets were not available for DCCBs, the ratio
of capital and reserves to investments and
advances was taken as the rough indicator of capital adequacy. This ratio declined at end-
March 2009 as compared with the previous
year. The decline in capital adequacy was mainly
on account of a higher increase in investments
of DCCBs as against a marginal increase in
capital and reserves. As alluded to earlier, loans
and advances of DCCBs declined over the same
period (Table V.21).
Primary Agricultural Credit Societies
5.44 The PACS function as grass root level
short-term rural credit segment of the
cooperative sector.
Select Balance Sheet Indicators of PACS
5.45 The balance sheet operations of PACS
expanded as at end-March 2009 over the
previous year. Total resources of PACS increased
as at end-March 2009 mainly on account of
increase in borrowings followed by increase in
owned funds. Needless to mention, PACS were
heavily dependent on borrowings for resources.
Total loans issued by PACS also increased
during the year 2008-09. Medium term loans
witnessed a higher growth than short-term loans
during the same year. However, out of total loans issued, short-term loans constituted a major
portion as at end-March 2009 (Table V.22).
Table V.21: Soundness Indicators of District Central Cooperative Banks |
(Amount in ` crore) |
Item |
As at end-March |
Percentage variation |
2008 |
2009P |
2008 |
2009P |
1 |
2 |
3 |
4 |
5 |
A. Total NPAs (i+ ii + iii) |
18,754 |
17,929 |
14.5 |
-4.4 |
i) Sub-standard |
7,880 |
8,030 |
14.6 |
1.9 |
ii) Doubtful |
8,214 |
7,221 |
16.1 |
-12.1 |
iii) Loss |
2,660 |
2,678 |
9.7 |
0.7 |
B. NPAs to Loans ratio |
18.5 |
17.9 |
|
|
i) Recovery to Demand(%) |
55.6 |
72.2 |
|
|
ii) Provisions Required |
10,394 |
10,225 |
1.7 |
-1.6 |
iii) Provision Made |
12,079 |
11,463 |
-0.7 |
-5.1 |
C. CRAR* |
19.0 |
18.2 |
|
|
D. Leverage Ratio |
15.9 |
15.2 |
|
|
P: Provisional
* : Calculated as ratio of 'capital and reserves' to 'investments and advances'.
Source: NABARD. |
Table V.22: Primary Agricultural Credit Societies - Select Balance Sheet Indicators |
(Amount in ` crore) |
Item |
As at end-March |
Percentage variation |
2008 |
2009 P |
2009 |
1 |
2 |
3 |
4 |
A. |
Liabilities |
|
|
|
|
1. Total Resources (2+3+4) |
84,281 |
86,990 |
3.2 |
|
2. Owned Funds (a+b) |
10,984 |
11,806 |
7.5 |
|
a. Paid-up Capital |
6,597 |
7,007 |
6.2 |
|
of which, |
|
|
|
|
Government Contribution |
629 |
603 |
-4.1 |
|
b. Total Reserves |
4,387 |
4,889 |
11.4 |
|
3. Deposits |
25,449 |
26,245 |
3.1 |
|
4. Borrowings |
47,848 |
48,938 |
2.3 |
|
5. Working Capital |
88,107 |
94,585 |
7.4 |
B. |
Assets |
|
|
|
|
1. Total Loans Issued (a+b)* |
57,643 |
58,787 |
2.0 |
|
a) Short-Term |
47,390 |
48,022 |
1.3 |
|
b) Medium-Term |
10,253 |
10,765 |
5.0 |
|
2. Total Loans Outstanding (a+b) |
65,666 |
64,044 |
-2.5 |
|
a) Short-Term |
43,696 |
45,686 |
4.6 |
|
b) Medium-Term |
21,970 |
18,359 |
-16.4 |
Memo Item |
CRAR** |
16.7 |
18.6 |
|
Total Over dues to total loans outstanding |
36.6 |
59.2 |
|
P : Provisional.
* : During the year.
** : Calculated as ratio of 'capital and reserves' to total loans outstanding.
Source : NAFSCOB. |
Profitability
5.46 The analysis of financial performance of
PACS showed that majority of PACS were loss
making institutions. As at end-March 2009, a
little less than half of total PACS functioning in
the country reported losses. However, it may be
mentioned that around two third of total PACS
were classified as viable and another one fourth
were classified as potentially viable as at end-
March 2009.
Capital Adequacy
5.47 Capital adequacy of PACS witnessed an
improvement as at end-March 2009 as
compared with the previous year. As data on
risk weighted assets for PACS were not
available, the ratio of total capital and reserves
to total loans outstanding was taken as a rough
indicator of capital adequacy. This ratio
improved at end-March 2009 as compared with
the previous year mainly on account of a decline
in the total loans outstanding (Table V.22).
Asset Quality
5.48 Asset quality of PACS deteriorated as at
end-March 2009 over the previous year. As in the
case of capital adequacy, data on non-performing
loans were also not available for PACS. Hence, the
ratio of total over dues to total loans outstanding
was taken as the rough indicator of asset quality.
This ratio increased at end-March 2009 as
compared with the previous year (Table V.22).
Long-Term Structure of Rural Cooperatives
5.49 As in the case of short term rural
cooperative credit institutions, the balance sheet
of the long-term rural cooperative credit
institutions also expanded at end-March 2009 as compared with the previous year. Further,
there was an overall improvement in the financial
performance of long-term rural cooperative credit
institutions as at end-March 2009 as compared
with the previous year. While the SCARDBs
reported overall net profits as at end-March 2009,
PCARDBs reported lower overall net losses at
end-March 2009 as compared with the previous
year.
State Cooperative Agriculture and Rural
Development Banks
Balance Sheet Operations of SCARDBs
5.50 Balance sheets of SCARDBs witnessed a
higher expansion during 2008-09 as compared
with the previous year. The expansion in the
balance sheets can be attributed to ‘other’
liabilities on the liability side and ‘other’ assets
on the asset side.10 Deposits constituted only a
small per cent of total liabilities of SCARDBs at
end-March 2009. Another striking development
in balance sheets of SCARDBs is the decline in
capital in 2008-09. However, reserves witnessed
a growth over the previous year. Loans and
advances declined while investments witnessed
a growth as at end-March 2009 over the
previous year. This may be due to the increased
risk averseness of these banks caused by the
general economic meltdown (Table V.23).
Financial Performance of SCARDBs
5.51 The financial performance of SCARDBs
witnessed improvement as at end-March 2009
over the previous year. SCARDBs reported
overall net profits as at end-March 2009 as
compared with overall net losses in the previous
year. The number of profit making SCARDBs also
increased at end-March 2009 over the previous
year. Accordingly, they reported higher ROA and ROE during the same period. The interest
income of SCARDBs grew at a higher rate during
2008-09, resulting in an increase in the net
interest margin. Owing to the higher net interest
margin, SCARDBs reported high operating
profits as at end-March 2009 as compared with
the previous year. However, the increase in net
profits was less as compared with the increase
in operating profits owing to an increase in
provisions and contingencies (Table V.24).
Table V.23: Liabilities and Assets of State Cooperative Agriculture and Rural Development Banks |
(Amount in ` crore) |
Item |
As at end-March |
Percentage variation |
2008 |
2009P |
2008 |
2009P |
1 |
2 |
3 |
4 |
5 |
Liabilities |
|
|
|
|
1. Capital |
1,223 |
812 |
54.0 |
-33.5 |
|
(4.9) |
(3.2) |
|
|
2. Reserves |
2,764 |
3,191 |
29.4 |
15.4 |
|
(11.2) |
(12.6) |
|
|
3. Deposits |
655 |
711 |
8.2 |
8.6 |
|
(2.6) |
(2.8) |
|
|
4. Borrowings |
16,114 |
15,849 |
-3.3 |
-1.6 |
|
(65.1) |
(62.4) |
|
|
5. Other Liabilities |
4,013 |
4,823 |
-3.0 |
20.2 |
|
(16.2) |
(19.0) |
|
|
Assets |
|
|
|
|
1. Cash and Bank Balance |
244 |
189 |
-12.6 |
-22.5 |
|
(1.0) |
(0.7) |
|
|
2. Investments |
2,545 |
2,941 |
32.8 |
15.6 |
|
(10.3) |
(11.6) |
|
|
3. Loans and Advances |
18,492 |
16,421 |
-0.8 |
-11.2 |
|
(74.7) |
(64.7) |
|
|
4. Other Assets |
3,487 |
5,836 |
-0.3 |
67.3 |
|
(14.1) |
(23.0) |
|
|
Total Liabilities/Assets |
24,768 |
25,386 |
1.8 |
2.5 |
|
(100.0) |
(100.0) |
|
|
P: Provisional
Note: 1) Figures in parentheses are percentages to total.
2) Data for SCARDBs in the States of Maharashtra repeated for
2008-09 from the year 2007-08.
3) SCARDB in Manipur is defunct.
Source : NABARD. |
Financial Soundness of SCARDBs
Asset Quality
5.52 The asset quality of SCARDBs improved
at end-March 2009 over the previous year. They reported smaller amount of non-performing
loans as at end-March 2009 as compared with
the previous year. Non-performing loans to total
loans ratio of SCARDBs also declined over the
same period. The declining trend in the total
non-performing loans was observed across all
categories of non-performing loans, viz., substandard
assets, doubtful assets and loss
assets. Among non-performing loans, loss
assets recorded the highest decline followed by
doubtful assets and sub-standard assets during
2008-09 over the previous year (Table V.25).
Table V.24: Financial Performance of State Cooperative Agriculture and Rural Development Banks |
(Amount in ` crore) |
Item |
As at end-March |
Percentage variation |
2007-08 |
2008-09P |
2007-08 |
2008-09P |
1 |
2 |
3 |
4 |
5 |
A. Income (i+ii) |
1,824 |
3,009 |
-20.4 |
65.0 |
|
(100.0) |
(100.0) |
|
|
i. Interest Income |
1,685 |
2,774 |
-6.9 |
64.6 |
|
(92.4) |
(92.2) |
|
|
ii. Other Income |
139 |
235 |
-71.3 |
69.1 |
|
(7.6) |
(7.8) |
|
|
B. Expenditure (i+ii+iii) |
2,067 |
2,961 |
-6.2 |
43.3 |
|
(100.0) |
(100.0) |
|
|
i. Interest Expended |
1,283 |
1,330 |
0.2 |
3.7 |
|
(62.1) |
(44.9) |
|
|
ii. Provisions and Contingencies |
561 |
1,391 |
-15.9 |
148.0 |
|
(27.1) |
(47.0) |
|
|
iii. Operating expenses |
223 |
240 |
-12.8 |
7.6 |
|
(10.8) |
(8.1) |
|
|
of which, Wage Bill |
164 |
194 |
-11.5 |
18.3 |
|
(7.9) |
(6.6) |
|
|
C. Profit |
|
|
|
|
i. Operating Profit |
318 |
1,439 |
-58.9 |
362.7 |
ii. Net Profit |
-243 |
48 |
- |
- |
iii. Return on Assets |
-1.0 |
0.2 |
|
|
|
|
|
|
|
iv. Return on Equity |
-7.0 |
1.2 |
|
|
v. Net Interest Margin |
1.6 |
5.8 |
|
|
P: Provisional.
Note : 1) Figures in parentheses are percentages to total.
2) Data for SCARDBs in the States of Maharashtra repeated.
3) SCARDB in Manipur is defunct.
Source : NABARD. |
Capital Adequacy
5.53 There was an improvement in the capital
adequacy of SCARDBs at end-March 2009 over the previous year. The ratio of capital and
reserves to investments and advances was taken
as the rough indicator of capital adequacy owing
to the unavailability of data on risk weighted
assets. This ratio increased at end-March 2009
as compared with the previous year. The
improvement was mainly because of a decline
in the loans and advances (Table V.25).
Table V.25 : Soundness Indicators of State Cooperative Agriculture and Rural Development Banks |
(Amount in ` crore) |
Item |
As at end-March |
Percentage variation |
2008 |
2009P |
2008 |
2009P |
1 |
2 |
3 |
4 |
5 |
A. Total NPAs (i+ii+iii) |
6,435 |
4,938 |
14.0 |
-23.3 |
i) Sub-standard |
3,465 |
2,938 |
-19.7 |
-15.2 |
|
(53.8) |
(59.5) |
|
|
ii) Doubtful |
2,761 |
1,965 |
110.8 |
-28.8 |
|
(42.9) |
(39.8) |
|
|
iii) Loss |
209 |
35 |
1,093.7 |
-83.2 |
|
(3.2) |
(0.7) |
|
|
B. NPAs to Loans Ratio |
34.8 |
30.1 |
|
|
i) Recovery to Demand(%) |
49.9 |
40.0 |
|
|
ii) Provisions Required |
1,465 |
1,217 |
13.9 |
-16.9 |
iii) Provision Made |
1,493 |
1,536 |
16.0 |
2.9 |
C. CRAR* |
19.0 |
20.7 |
|
|
D. Leverage Ratio |
16.1 |
15.8 |
|
|
P: Provisional
* : Calculated as ratio of 'capital and reserves' to 'investments and advances'.
Note: Figures in parentheses are percentages to total.
Source: NABARD. |
Primary Cooperative Agriculture and Rural
Development Banks
Balance Sheet Operations of PCARDBs
5.54 Balance sheets of PCARDBs expanded
during 2008-09 as compared with a contraction
during 2007-08. On the liabilities side, the
growth in balance sheets was mainly due to
increase in borrowings and ‘other’ liabilities,
while on the assets side it was due to increase
in ‘other’ assets, and loans and advances.11
Like SCARDBs, PCARDBs depend heavily on
borrowings for their resources as deposit
mobilisation by these banks are quite low.
Accordingly, deposits constituted only a small
percentage of total liabilities of PCARDBs, while
borrowings constituted almost half of the total
liabilities at end-March 2009 (Table V.26).
Financial Performance of PCARDBs
5.55 As in the previous year, during 2008-09
PCARDBs reported overall net losses. However,
net losses came down at end-March 2009 as compared with the previous year. It is
interesting to note that PCARDBs reported
overall operating profits at end-March 2009,
however, due to the provisioning requirement,
they reported overall net losses (Table V.27).
Table V.26 : Liabilities and Assets of Primary Cooperative Agriculture and Rural Development Banks |
(Amount in ` crore) |
Item |
As at end-March |
Percentage variation |
2008 |
2009P |
2008 |
2009P |
1 |
2 |
3 |
4 |
5 |
Liabilities |
|
|
|
|
1. Capital |
894 |
1,515 |
-2.6 |
69.4 |
|
(4.4) |
(6.1) |
|
|
2. Reserves |
3,036 |
3,493 |
|
|
|
(15.0) |
(14.1) |
13.4 |
15.0 |
3. Deposits |
340 |
400 |
|
|
|
(1.7) |
(1.6) |
-0.4 |
17.8 |
4. Borrowings |
10,626 |
12,365 |
|
|
|
(52.5) |
(49.8) |
-16.7 |
16.4 |
5. Other Liabilities |
5,327 |
7,073 |
|
|
|
(26.3) |
(28.5) |
4.8 |
32.8 |
Assets |
|
|
|
|
1. Cash and Bank Balances |
127 |
236 |
-43.4 |
86.2 |
|
(0.6) |
(0.9) |
|
|
2. Investments |
879 |
1,122 |
6.8 |
27.6 |
|
(4.3) |
(4.5) |
|
|
3. Loans and Advances |
9,914 |
11,269 |
18.2 |
13.7 |
|
(49.0) |
(45.4) |
|
|
4. Other Assets |
9,304 |
12,219 |
8.0 |
31.3 |
|
(46.0) |
(49.2) |
|
|
Total Liabilities / Assets |
20,224 |
24,846 |
-7.1 |
22.9 |
|
(100.0) |
(100.0) |
|
|
P: Provisional.
Note: 1) Figures in parentheses are percentages to total.
2) For the year 2007-08, data for Bihar and Himachal Pradesh is
not available.
Source: NABARD. |
Table V.27 : Financial Performance of Primary Cooperative Agriculture and Rural Development Banks |
(Amount in ` crore) |
Item |
As at end-March |
Percentage variation |
2008 |
2009P |
2008 |
2009P |
1 |
2 |
3 |
4 |
5 |
A. Income (i+ii) |
1,566 |
2,022 |
-36.0 |
29.2 |
|
(100.0) |
(100.0) |
|
|
i. Interest Income |
1,366 |
1,431 |
-29.0 |
4.8 |
|
(87.2) |
(70.8) |
|
|
ii. Other Income |
200 |
591 |
-61.8 |
195.8 |
|
(12.8) |
(29.2) |
|
|
B. Expenditure (i+ii+iii) |
1,926 |
2,221 |
-25.8 |
15.3 |
|
(100.0) |
(100.0) |
|
|
i. Interest Expended |
990 |
1,217 |
-21.3 |
22.9 |
|
(51.4) |
(54.8) |
|
|
ii. Provisions and Contingencies |
622 |
545 |
-38.7 |
-12.3 |
|
(32.3) |
(24.6) |
|
|
iii. Operating expenses |
314 |
458 |
-2.2 |
46.0 |
|
(16.3) |
(20.6) |
|
|
of which, Wage Bill |
211 |
191 |
-4.7 |
-9.4 |
|
(10.9) |
(8.6) |
|
|
C. Profit |
|
|
|
|
i) Operating Profit |
262 |
347 |
-69.8 |
32.5 |
ii) Net Profit |
-360 |
-199 |
144.2 |
-44.8 |
P: Provisional.
Note : 1) For the year 2007-08, data for Bihar, Himachal Pradesh, Kerala
and Tamil Nadu was not available.
2) Data for PCARDBs in West Bengal and Orissa are repeated.
Source: NABARD. |
Financial Soundness of PCARDBs
Asset Quality
5.56 There was improvement in the asset
quality of PCARDBs as at end-March 2009 over
the previous year, both in absolute and
percentage terms. Declining trend was observed
across all categories of non-performing loans.
Notably, in absolute terms, the highest decline
was observed in the case of sub-standard loans
(Table V.28).
Table V.28: Soundness Indicators of Primary Cooperative Agriculture and Rural Development Banks |
(Amount in ` crore) |
Item |
As at end-March |
Percentage variation |
2008 |
2009 P |
2007-08 |
2008-09 P |
1 |
2 |
3 |
4 |
5 |
A. Total NPAs (i+ ii + iii) |
5,117 |
4,393 |
18.5 |
-14.1 |
i) Sub- standard |
2,983 |
2,574 |
18.8 |
-13.7 |
|
(58.3) |
(58.6) |
|
|
ii) Doubtful |
2,106 |
1,793 |
18.1 |
-14.8 |
|
(41.2) |
(40.8) |
|
|
iii) Loss |
28 |
26 |
30.0 |
-7.8 |
|
(0.5) |
(0.6) |
|
|
B. NPAs to Loans Ratio |
51.6 |
39.0 |
|
|
i) Recovery to Demand (%) |
42.2 |
40.3 |
|
|
ii) Provisions Required |
902 |
790 |
12.9 |
-12.4 |
iii) Provision Made |
948 |
892 |
18.6 |
-5.9 |
C. CRAR* |
36.4 |
40.4 |
|
|
D. Leverage Ratio |
19.4 |
20.2 |
|
|
P: Provisional
*: Calculated as ratio of 'capital and reserves' to 'investments and advances'.
Note: Figures in parentheses are percentages to total.
Source: NABARD. |
Capital Adequacy
5.57 There was an improvement in the capital
adequacy of PCARDBs at end-March 2009 over
the previous year. The rough indicator of capital
adequacy, viz., ratio of capital and reserves to
investments and advances increased at end-
March 2009 over end-March 2008 (Table V.28).
Financial Inclusion by Rural Cooperatives
5.58 The most justifiable reason to speed up
the ongoing revival plan of the rural cooperative
sector emanates from the potential of this sector
in enlarging the formal financial network
especially in rural areas with the existing
infrastructure, especially with the wide
geographical outreach of PACS. As at end-March
2009, PACS functioning in the country covered
around six lakhs villages with a total
membership of around 13.2 million. This wide
penetration of PACS across villages as well as
across small depositors/borrowers would act
like a catalyst while pursuing the objective of
100 per cent financial inclusion.
Credit- Deposit Ratio of Rural Cooperatives
5.59 The credit-deposit ratio of StCBs and
DCCBs was very high as compared with UCBs
and SCBs though it came down in 2009 as
compared with the previous year. The higher
credit-deposit ratio of these upper tier
institutions implies a larger availability of funds
for PACS (Table V.29).12
5.60 Deposits of long-term cooperative credit
institutions such as SCARDBs and PCARDBs
were very low as compared with their borrowings.
This indicates that long-term cooperative credit
institutions need to improve their deposit
mobilisation efforts. This would on the one hand
help these institutions to diversify their resource
base and on the other would bring more
depositors under the formal financial network.
Outreach of Rural Cooperatives
5.61 In the short-term structure of rural
cooperatives, the apex organisation, viz., StCBs
play a crucial role in financial inclusion by
providing funds to lower tiers of the rural
cooperative sector. Every State has one StCB
in place to provide funds to the lower tiers of
the rural cooperative sector. Though StCBs
reported overall profits in majority of States,
the poor asset quality of StCBs in the north
eastern region is a cause for concern which can
impact on the entire rural cooperative sector’s
effort to further financial inclusion (Appendix
Table V.3).
Table V.29: Credit-Deposit Ratio of StCBs and DCCBs |
(Per cent) |
|
StCBs |
DCCBs |
1 |
2 |
3 |
2008 |
88.8 |
92.4 |
2009 P |
70.0 |
77.9 |
P : Provisional. |
5.62 The second tier of the rural cooperative
sector, namely, DCCBs is present in all regions
of the country, except the north eastern region.
These banks are concentrated in the central
region of the country as at end-March 2009.
Notably, majority of them reported overall
profits as at end-March 2009. In contrast,
ground level institutions, viz., PACS were
concentrated in the western region. As at end-
March 2009, the average number of villages per
PACS was 6 at the all-India level. However, this
was very high in some of the regions, viz.,
central, eastern, north-eastern and northern. In
the central region the average number of villages
per PACS was 12, which is double of the national
average (Appendix Tables V.4 and V.5).
5.63 Branches of SCARDBs were also
concentrated in the central region. Though at
the All-India level they reported overall net
profits, in many States these banks were
incurring losses. In contrast, the lower tier of
the long-term structure, viz., PCARDBs were
concentrated in the southern region followed by
the northern region (Appendix Table V.6 and V.7).
Business per Branch of Rural Cooperative
Credit Institutions
5.64 Among the rural cooperative credit
institutions (except PACS), DCCBs were having
the maximum number of branches across the
country. However, the business per branch was
the highest in StCBs. The business undertaken
by PCARDBs per branch was very low as
compared with other rural cooperative credit
institutions. Thus, in terms of number of
branches as well as amount of banking business
per branch, the short term cooperative credit
institutions were far ahead of their long-term
counterparts indicating the higher role played
by short term rural cooperative credit
institutions in financial inclusion (Table V.30).
Table V.30: Business per Branch of Rural Cooperatives |
(As at end-March 2009) |
(Amount in ` crore) |
Category |
Number of Banks |
Number of Branches |
Number of Branch |
1 |
2 |
3 |
4 |
StCBs |
31 |
943 |
123.8 |
DCCBs |
370 |
12,939 |
17.5 |
SCARDBs |
20 |
844 |
20.3 |
PCARDBs |
697 |
1,227 |
9.5 |
Note : Data are provisional.
Source : NABARD |
Role of PACS in Financial Inclusion – Some
Emerging Issues
5.65 Over the years, though the network of
PACS widened throughout the geographical
space of the country, some persisting
weaknesses have been making the sector less
effective in financial intermediation in rural
areas (Box V.4).
4. Role of NABARD in Rural Credit
5.66 In the area of rural credit, NABARD is
the apex organisation and as such it has been
playing a very important role in enhancing the
credit flow to the rural economy since its
inception in 1982. It is actively involved in
refinancing of rural lending institutions such
as RRBs and cooperative credit institutions as
also in the recapitalisation of these institutions.
Further, NABARD is also entrusted with the
responsibility of supervision of rural
cooperative credit institutions. Special schemes
to improve credit flow to the rural economy, viz.,
Rural Infrastructure Development Fund (RIDF)
and Kisan Credit Card (KCC), are also entrusted
with NABARD.
Short-term Credit Extended by NABARD
5.67 NABARD provides short, medium and
long-term credit facilities to different
organisations, viz., StCBs, RRBs and State
Governments.13 As at end-March 2010, the total
credit extended by NABARD to various
organisations witnessed considerable increase
over end-March 2009. While, there was an
absolute increase in the credit extended by
NABARD to StCBs and RRBs in 2009-10 over
the previous year, credit extended to State
Governments witnessed an absolute decline
over the same period. Out of the total
outstanding credit from NABARD as at end-
March 2010, StCBs accounted for the maximum
share followed by RRBs and State Governments
(Table V.31).
Role of NABARD in Reviving Rural
Cooperative Credit Institutions
Revival of Short-term Structure - Status
5.68 The approved revival package for rural
cooperative credit institutions prepared based
on the Vaidyanathan Committee (Task Force on
Revival of Rural Cooperative Credit Institutions)
Report is under implementation. Government
of India has entered into agreements with
multilateral agencies such as World Bank, Asian
Development Bank and KfW (Kreditanstalt für
Wiederaufbau) for financial assistance to
implement the revival package at the State level.
The National Implementation and Monitoring
Committee (NIMC) has been constituted for
guiding and monitoring the implementation of
the package at national level. At State level, the
progress is being monitored by State Level
Implementing and Monitoring Committee and
at district level by DCCB Level Implementing and Monitoring Committees. At NABARD level,
review meetings of Regional Offices of
Implementing States are held periodically for
the same.
Table V.31: NABARD's Credit to StCBs, State Governments and RRBs |
(` crore) |
Item |
2008-09 |
2009-10 |
Limits |
Drawals |
Repayments |
Outstanding |
Limits |
Drawals |
Repayments |
Outstanding |
1 |
2 |
3 |
4 |
5 |
6 |
7 |
8 |
9 |
1. |
StCBs (a+b) |
20,133 |
17,778 |
17,858 |
15,704 |
18,287 |
18,680 |
17,215 |
17,169 |
|
a. Short-term |
20,053 |
17,778 |
16,636 |
15,638 |
18,287 |
18,680 |
17,149 |
17,169 |
|
b. Medium-term |
80 |
- |
1,222 |
66 |
66* |
- |
66 |
- |
2. |
State Governments |
|
|
|
|
|
|
|
|
|
a. Long-term |
- |
18 |
56 |
252 |
- |
- |
53 |
199 |
3. |
RRBs (a+b) |
4,829 |
4,061 |
3,914 |
3,803 |
7,374 |
7,091 |
3,969 |
6,924 |
|
a. Short-term |
4,829 |
4,061 |
3,291 |
3,656 |
7,374 |
7,091 |
3,842 |
6,904 |
|
b. Medium-term |
- |
- |
623 |
147 |
- |
- |
127 |
20 |
Grand Total (1+2+3) |
24,962 |
21,858 |
21,828 |
19,759 |
25,661 |
25,771 |
21,238 |
24,292 |
* This sanction was withdrawn later on. '-': Nil. StCBs: State Cooperative Banks. RRBs: Regional Rural Banks.
Note: 1) Short-term includes Seasonal Agricultural Operations (SAO) and Other than Seasonal Agricultural Operations (OSAO). For 2008-09,
short-term also includes liquidity support scheme for Kharif and Rabi.
2) For StCBs and State Governments, the period is from April to March. For RRBs, it is from July to June.
3) Medium-term includes MT Conversion, MT (NS) and MT liquidity support scheme.
4) Repayments under Short-term during 2009-10 includes repayment under ST(SAO)A/C IV, A/C III and Liquidity support for Rabi.
Source: NABARD. |
Box V. 4 Operations of PACS in India – Some Weak Spots
Though PACS have a wide network in the country, there
are some inherent weaknesses in the sector which is
making this sector less effective in becoming formal
financial channels in rural areas. Prima facie, there is a
need to increase the number of members in PACS as only
members can borrow from PACS. As at end-March 2009,
the number of members per PACS at the national level
was 1,384. Further, number of members was low in the
northern, western, eastern, north-eastern and central
regions as compared with that in the southern region.
Similarly, only 34.9 per cent of members were borrowers
from PACS. As compared with the southern region, the
number of borrowers was also comparatively less in other
regions of the country. Furthermore, only 19.1 per cent
of borrowers of PACS were belonging to SC, ST, small
farmers and rural artisans.
The banking business undertaken by PACS was
concentrated in the southern region. PACS in the southern
region mobilised the highest share of total deposits at
all-India level. Similarly, PACS in the southern region also
had the highest share of loans and advances issued as at
end-March 2009. Thus, it is clear that though the western
region had the maximum number of PACS as well as
lowest number of villages per PACS, PACS in the southern
region were engaged in largest amount of banking
business. In contrast, at end-March 2009, the banking
business undertaken by each PACS was dismally low in
the north-eastern region. In this region, the average
deposits mobilised by one PACS were `2 lakhs and
average loans issued by one PACS were ` one lakh (chart).
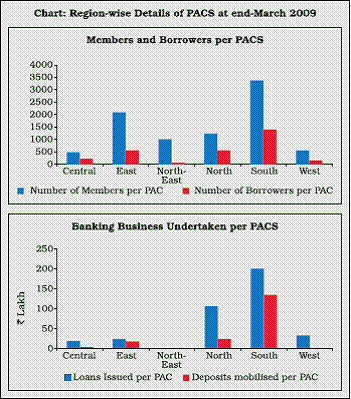 |
Table: Regional Penetration of PACS |
(As at end-March 2009) |
Region |
Total number of PACS |
Number of Villages per PACS |
Number of Profit Making PACS |
Number of Loss Making PACS |
1 |
2 |
3 |
4 |
5 |
Central |
15,938 |
12 |
7,412 |
5,338 |
Eastern |
20,308 |
9 |
4,933 |
10,749 |
North-Eastern |
3,579 |
9 |
564 |
1,075 |
Northern |
12,738 |
8 |
8,267 |
3,515 |
Southern |
13,744 |
6 |
4,989 |
8,040 |
Western |
29,326 |
1 |
11,126 |
17,152 |
Total |
95,633 |
6 |
37,291 |
45,869 |
Note: 1) 12,473 PACS are classified as no-profit no-loss making PACS.
2) Data are provisional.
Source : NAFSCOB. |
Further, it is observed that, out of the loss making PACS,
37.4 per cent belonged to the western region followed by
the eastern region (23.4 per cent). On the other hand,
profit making PACS were distributed across regions, i.e.,
29.8 per cent in the western region followed by 22.2 per
cent in the northern region and 19.9 per cent in the
central region. Further, out of the total overdues of PACS,
61.2 per cent belong to the western region. However, 68.0
per cent of PACS in the western region and 76.3 per cent
of PACS in the eastern region were classified as viable as
at end-March 2009. (Table).
Undoubtedly, PACS can be utilised to further financial
inclusion given its wide geographical coverage. However,
efforts need to be made to improve the performance of
this sector as well as to ensure adequate presence of these
institutions across different regions of the country. In this
context, it is important to expand the PACS network in
the north-eastern region. Along with expanding the
number of PACS in the north-eastern region, measures
may also be taken to increase the banking business per
PACS in this region. PACS in the western region may be
given special attention for improving the financial
condition of the large number of loss-making PACS in
the region. Further, deposit mobilisation by PACS in the
western as well as in the central region was abysmally
low, which requires immediate attention. Moreover, the
membership in PACS may have to be increased
considerably. However, the most important issue would
be reduction of over dues of PACS, which is endangering
the financial health of these institutions. Thus, with
adequate reforms to improve the financial health of PACS
along with correcting the existing regional imbalances
would bring large number of small depositors/borrowers
hailing from rural areas into the formal banking system
and facilitate the process of financial inclusion.
5.69 So far, 25 State Governments (except
Goa, Himachal Pradesh and Kerala) have signed
the MoU with Government of India and
NABARD, which covers 96 per cent of short term
rural cooperative credit units in the country.
Further, an amount of `7,972 crore has been
released by NABARD as Government of India
share for recapitalisation of 49,764 PACS in 14
States, while State Governments have released
`756 crore as their share. The State Cooperative
Societies Act has been amended in 15 States
through legislative process.
5.70 Further, for conducting the statutory
audit of StCBs and DCCBs, NABARD provided
a panel of chartered accountants to 13 States
during the recent years. The audit process as
on March 31, 2009 is completed in 12 States.
The audit process in rest of the States is under
different stages. Further, professional directors
as well as CEOs as per fit and proper criteria
were put in place in many of the banks across States. The common accounting system (CAS)
was introduced from April 1, 2009 in almost
all PACS in 11 States. Guidelines on
computerisation of CAS and Management
Information System (MIS) for PACS were issued
in two separate modules, and it is in progress in
3 States. As per decision of NIMC, it has been
decided to develop core software for PACS at the
National level.
HRD-Training
5.71 Eight modules for training of different
levels of Short-term Cooperative Credit
Institutions (STCCs) functionaries and Board
of directors of PACS/CCBs/StCBs have been
developed by NABARD. Nodal training partners
have been appointed for implementation of the
programmes and Master Trainers have been
identified and trained in the Training
Establishments of NABARD. As on March 31,
2010, 72,127 PACS Secretaries from 14 states
and 99,219 Elected Members of PACS from 11
states have been trained by 1,896 District Level
Trainers. Further, 3,471 departmental auditors
and supervisors from 17 States have been trained to provide hand-holding support in
order to facilitate stabilisation of CAS/MIS at
the ground level. Further 61,619 PACS
functionaries from 15 States have been trained
in CAS/MIS.
Revival of the Long-term Structure – Status
5.72 The Government of India constituted a
Task Force (TF) on Long Term Cooperative
Credit Institutions (LTCCs) to review the need
for the Revival Package (RP) for LTCCs. The TF
has discussed the need for RP for LTCCs with
some State Governments. The TF submitted
its report on Februrary 25, 2010, which is under
consideration.
Schemes Entrusted with NABARD to
Improve Credit Flow to the Rural Economy
Rural Infrastructure Development Fund (RIDF)
5.73 RIDF is one of the most important
schemes entrusted with NABARD by the
Government of India to increase flow of credit
for the development of rural infrastructure. The
fund was set up in 1995 with an initial corpus
of `2,000 crore. Apart from contributions of the
Government of India, RIDF also receives
deposits from commercial banks to the extent
of shortfall in their lending to agriculture. As at
end-March 2010, out of the total funds received
by RIDF since its inception both from the
Government of India as well as via deposits,
more than half was from contributions by the
Government of India. Out of the total funds
received so far, RIDF sanctioned loans worth
two third of the total amount so far. However,
the percentage of disbursed loans to sanctioned
loans exhibited a declining trend since tranche
XI. The decline in the disbursal of funds from
RIDF was mainly caused by procedural delays
in administrative and technical approvals by
State Governments in land acquisitions,
statutory clearances and tendering process.
Efforts to rationalise these procedures have
already been initiated by State Governments
(Table V.32 and Chart V.10).
5.74 The Government of India opened a
separate window under RIDF in 2006 for the
Bharat Nirman Programme with a corpus of
`4,000 crore. Of the total funds received so far,
this window of RIDF sanctioned and disbursed
more than half of the amount. Notably, there is
no delay observed under this window in
disbursing the sanctioned amount of loan
(Table V.32).
5.75 Out of total loans sanctioned so far under
RIDF, the major share went towards building
roads and bridges, followed by rural irrigation
programmes. Notably, more than 10 per cent of
loans went to the development of social
infrastructure such as drinking water, primary
school, public health centres and aganwadi
centres.
5.76 Out of total loans sanctioned and
disbursed under RIDF so far, northern region
and southern region accounted for more than
half. North-eastern region accounted for only
5.1 per cent of total sanctioned loans and 4.0
per cent of total disbursed loans. The northeastern
region also reported the lowest
disbursed loans to sanctioned loans ratio
amongst the regions. The State-wise profile
shows that Andhra Pradesh accounted for the
maximum share of loans sanctioned and
disbursed, followed by Gujarat and Madhya
Pradesh (Appendix Table V.8).
Kisan Credit Card Scheme (KCC)
5.77 KCC scheme was implemented in the late
nineties to further financial inclusion by
improving the accessibility of credit by farmers.
At end-March 2010, the total number of cards
issued and sanctioned amount of loans under
the scheme witnessed an increase over the
previous year. The average amount of sanctioned loan per card holder exhibited a steady rising
trend since its inception except for the last two
years (Table V.33).
Table V.32: Tranche-wise Details of RIDF |
(As at end-March 2010) |
(Amount in ` crore) |
Tranche |
Beginning of the Tranche |
No. of Projects |
Corpus* |
Deposits Received |
Loans Sanctioned |
Loans Disbursed |
Ratio of Loans Disbursed to Loans Sanctioned (per cent) |
1 |
2 |
3 |
4 |
5 |
7 |
8 |
9 |
I |
1995 |
4,168 |
2,000 |
1,587 |
1,906 |
1,761 |
92.4 |
II |
1996 |
8,193 |
2,500 |
2,225 |
2,636 |
2,398 |
91.0 |
III |
1997 |
14,345 |
2,500 |
2,308 |
2,733 |
2,454 |
89.8 |
IV |
1998 |
6,171 |
3,000 |
1,413 |
2,903 |
2,482 |
85.5 |
V |
1999 |
12,106 |
3,500 |
3,052 |
3,435 |
3,055 |
88.9 |
VI |
2000 |
43,168 |
4,500 |
4,081 |
4,489 |
4,071 |
90.7 |
VII |
2001 |
24,598 |
5,000 |
4,074 |
4,582 |
4,053 |
88.5 |
VIII |
2002 |
20,887 |
5,500 |
5,188 |
5,950 |
5,149 |
86.5 |
IX |
2003 |
19,548 |
5,500 |
4,873 |
5,638 |
4,916 |
87.2 |
X |
2004 |
16,530 |
8,000 |
6,420 |
7,672 |
6,489 |
84.6 |
XI |
2005 |
29,771 |
8,000 |
6,421 |
8,320 |
6,605 |
79.4 |
XII |
2006 |
41,955 |
10,000 |
7,775 |
10,411 |
7,280 |
69.9 |
XIII |
2007 |
36,890 |
12,000 |
7,835 |
12,706 |
7,601 |
59.8 |
XIV |
2008 |
85,465 |
14,000 |
6,442 |
14,708 |
6,653 |
45.2 |
XV |
2009 |
39,015 |
14,000 |
4,228 |
15,630 |
3,474 |
22.2 |
Total |
|
4,02,810 |
1,00,000 |
67,921 |
1,03,718 |
68,440 |
66.0 |
Separate Window of Bharat Nirman Programme |
XII |
2006 |
- |
4,000 |
3,946 |
4,000 |
4,000 |
100.0 |
XIII |
2007 |
- |
4,000 |
3,416 |
4,000 |
4,000 |
100.0 |
XIV |
2008 |
- |
4,000 |
3,817 |
4,000 |
4,000 |
100.0 |
XV |
2009 |
- |
6,500 |
3,626 |
6,500 |
6,500 |
100.0 |
Total |
|
- |
18,500 |
14,805 |
18,500 |
18,500 |
100.0 |
Grand Total |
|
4,02,810 |
1,18,500 |
82,725 |
1,22,218 |
86,940 |
71.1 |
'-': Nil/Not Available.
*: Provided by the Government of India.
Source: NABARD. |
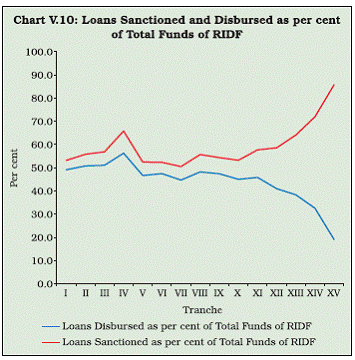 |
5.78 Out of total KCCs issued and total amount
sanctioned under the scheme since its inception,
commercial banks accounted for the maximum
share followed by cooperative banks. However,
the number of cards issued by cooperative banks
witnessed a declining trend since 2001-02, while
the commercial banks more or less had a rising
trend in the number of KCCs issued.
Consequently, the share of cooperative banks in
total amount sanctioned under KCC scheme also
exhibited a declining trend (Chart V.11).
5.79 As at end-March 2010, Uttar Pradesh
accounted for the maximum number of KCCs issued so far followed by Andhra Pradesh. Thus,
these two States together accounted for onethird
of the total KCCs issued so far. Similarly,
at end-March 2010, Uttar Pradesh had the
maximum share of loans sanctioned under the
KCC scheme followed by Maharashtra. However,
as at end-March 2010, average amount of loan sanctioned per KCC was the highest in Gujarat
followed by Punjab. In the north-eastern
States as well as in other hilly States, the
number of KCCs issued as well as amount of
loans sanctioned was very low as compared
with rest of the States at end-March 2010
(Appendix Table V.9).
Table V.33: Number of Kisan Credit Cards Issued: Agency-wise and Year-wise |
(As at end-March 2010) |
(Amount in ` crore) |
Year |
Cooperative Banks |
Regional Rural Banks |
Commercial Banks |
Total |
Number of Cards |
Amount |
Number of Cards |
Amount |
Number of Cards |
Amount |
Number of Cards |
Amount |
1 |
2 |
3 |
4 |
5 |
6 |
7 |
8 |
9 |
1998-99 |
1,55,353 |
826 |
6,421 |
11 |
6,22,391 |
1,473 |
7,84,165 |
2,310 |
1999-00 |
35,94,869 |
3,606 |
1,73,301 |
405 |
13,65,911 |
3,537 |
51,34,081 |
7,548 |
2000-01 |
56,14,445 |
9,412 |
6,48,324 |
1,400 |
23,89,588 |
5,615 |
86,52,357 |
16,427 |
2001-02 |
54,35,859 |
15,952 |
8,33,629 |
2,382 |
30,71,046 |
7,524 |
93,40,534 |
25,858 |
2002-03 |
45,78,923 |
15,841 |
9,63,950 |
2,955 |
26,99,883 |
7,481 |
82,42,756 |
26,277 |
2003-04 |
48,78,236 |
9,855 |
12,74,289 |
2,599 |
30,94,108 |
9,331 |
92,46,633 |
21,785 |
2004-05 |
35,55,783 |
15,597 |
17,29,027 |
3,833 |
43,95,564 |
14,756 |
96,80,374 |
34,186 |
2005-06 |
25,98,226 |
20,339 |
12,49,474 |
8,483 |
41,64,551 |
18,779 |
80,12,251 |
47,601 |
2006-07 |
22,97,640 |
13,141 |
14,05,874 |
7,373 |
48,07,964 |
26,215 |
85,11,478 |
46,729 |
2007-08 |
20,91,329 |
19,991 |
17,72,498 |
8,743 |
46,05,775 |
59,530 |
84,69,602 |
88,264 |
2008-09 |
13,43,845 |
8,428 |
14,14,647 |
5,648 |
58,33,981 |
39,009 |
85,92,473 |
53,085 |
2009-10 |
17,43,253 |
7,606 |
19,49,785 |
10,132 |
53,13,085 |
39,940 |
90,06,123 |
57,678 |
Total |
37,887,761 |
1,40,594 |
13,421,219 |
53,964 |
42,363,847 |
2,33,190 |
93,672,827 |
4,27,748 |
Percentage share in Total |
40.4 |
32.9 |
14.4 |
12.6 |
45.3 |
54.5 |
100.0 |
100.0 |
Source : NABARD |
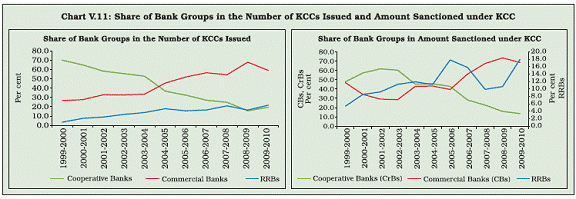 |
5. Conclusions
5.80 Cooperative banks, though account for
a small proportion of the total business
undertaken by the banking system in India, have
a prominent place in the Indian financial
landscape owing to their potential role in
furthering financial inclusion as also because
of financial inter linkages that these institutions
have with the rest of the financial system.
5.81 As a result of the on-going consolidation
initiatives in the UCB sector, the profile of UCBs
witnessed a shift in favour of financially sound
banks. The UCB sector reported overall net
profits as at end-March 2010. However, the
spillover effects of the global financial turmoil
caused a decline in the profitability during the
last two years. Some of the emerging issues
which deserve attention in the UCB sector are
negative non-interest margin, high level of nonperforming
loans, presence of loss-making banks, banks with negative CRAR and skewed
concentration of banking business.
5.82 There was an overall improvement in the
financial performance of rural cooperatives at end-
March 2009 over the previous year. However, the
asset quality deteriorated during the same period.
Improving the financial soundness of these
institutions is extremely important as the existing
infrastructure of these institutions especially that
of PACS, can be leveraged upon for furthering
financial inclusion. Addressing the lopsided
geographical spread and the lopsided distribution
of banking business of PACS across regions is
important in this context. Further, there is also
an urgent need to improve deposit mobilisation
by the long-term cooperative credit institutions
both from the point of view of diversification of
resources and financial inclusion. The declining
trend in the disbursal of loans from RIDF and the
number of KCCs issued by cooperatives is a source
of concern that requires urgent attention.
1The analysis presented in this section is based on the data collected from supervisory returns of UCBs by the Urban Banks Department of the Reserve Bank.
2As the number of UCBs varies from year to year, time series data on all indicators of UCBs are not strictly comparable over the years.
3For regulatory purposes, UCBs are classified into Grades I, II, III and IV based on CRAR, net NPA, and profitability during previous years and compliance with CRR/SLR in the previous financial year. Banks with no supervisory concerns are classified as grade I banks. Banks classified in grade II are also relatively sound while those in grades III and IV are financially weak banks. From the inspection cycle of March 31, 2009, a revised CAMEL rating model has been made applicable to UCBs but rating in respect of all UCBs is yet to be completed.
 |
5Tier I banks: i) Banks having deposits below `100 crore operating in a single district, ii) Banks with deposits below `100 crore operating in more than one district will be treated as Tier I provided the branches are in contiguous districts and, deposits and advances of branches in one district separately constitute at least 95 per cent of the total deposits and advances, respectively of the bank, and iii) Banks with deposits below `100 crore, whose branches were originally in a single district but subsequently became multi-district due to reorganisation of the district are also treated as Tier I.
Tier II banks: All other banks, which are not Tier I, are treated as Tier II banks.
6The analysis provided in Box V.2 is confined to scheduled UCBs as the time series data on non-scheduled UCBs were not available.
7The norm of 40 per cent of their Adjusted Net Bank Credit (ANBC) or credit equivalent amount of Off-Balance Sheet Exposure (OBE), whichever is higher, as on March 31 of the previous year applicable to domestic SCBs is also applicable to UCBs.
8Data for rural cooperative credit institutions (comprising StCBs, DCCBs, PACS, SCARDBs and PCARDBs) are available with a lag of one year and hence, the analysis in the present section relates to 2008-09.
9States from the north-eastern region have a unitary short-term cooperative credit structure, thus, there are no DCCBs in these States.
10‘Other liabilities’ of SCARDBs include ‘patta funds’, share redemption fund, audit fees payable, unclaimed amount of Agricultural and Rural Debt Relief Scheme, 1991, and advance against sale of buildings. ‘Other assets’ include debentures subscription receivable, income tax refund claimed, organisation account and term deposits receivable from PCARDBs.
11‘Other liabilities’ of PCARDBs include ‘patta funds’, share redemption fund, audit fees payable, unclaimed amount of Agricultural and Rural Debt Relief Scheme, 1991, and advance against sale of buildings. ‘Other assets’ include debentures subscription receivable, income tax refund claimed and organisation account.
12PACs were more dependent on borrowings than on deposits for their resources.
13Short-term credit is supplied mainly for financing seasonal agricultural operations, marketing of crops, production, procurement and marketing activities of cooperative weavers’ societies, among others. While medium term credit is extended for financing other approved agriculture purposes as also for converting short-term loans to medium-term loans, long-term credit is extended to State Governments to enable them to contribute to the share capital of cooperative credit institutions. |