The liquidity conditions, which transited from surplus to deficit in the wake of 3G/BWA
auctions in May 2010, have generally remained in the deficit mode since then, reflecting
the stance of monetary policy. Normalisation of policy rates, along with narrowing of
the LAF corridor, and the shift from surplus to deficit liquidity conditions have resulted
in an effective increase in the policy rate by 275 basis points since March 2010. Even as
reserve money has grown at a fairly rapid pace, broad money (M3) growth continues to
remain relatively subdued, reflecting the decelerated growth in aggregate deposits. With
persistent deficit liquidity conditions, banks have started to scale up their deposit
mobilisation efforts, as reflected in the higher deposit interest rates being offered since
July 2010.
IV.1 The non-disruptive normalisation
of the monetary policy has significantly
altered the liquidity and interest rate
conditions over a few months. With repo
emerging as the normal mode under the
liquidity adjustment facility (LAF), and the
consequent effective increase in the policy
rate by 275 basis points, the transmission
of monetary policy has also witnessed signs
of strengthening. Since March 2010, the
Reserve Bank has raised repo and reverse
repo rates by 125 basis points and 175 basis
points, respectively, which narrowed the
LAF corridor from 150 basis points to 100
basis points. With continued build-up of
government cash balances and increase in
currency with the public, the LAF
operations have remained mostly in deficit
(injection) mode since June 2010.
IV.2 During the first quarter of the year,
non-food credit growth of scheduled
commercial banks (SCBs) exceeded the
indicative trajectory set out in the Monetary
Policy Statement for 2010-11.
Notwithstanding the one-off increase in
credit demand associated with payment for
telecom spectrums, the growth of non-food
credit during the second quarter remained close to the Reserve Bank’s indicative
projection. Money supply (M3) growth,
which had started picking up from July
2010 registered deceleration towards the
end of the quarter and showed acceleration
for the latest fortnight for which data are
available. The subdued growth in M3 has
been largely conditioned by the decelerated
growth in deposits, which account for over
85 per cent of money supply. On the sources
side, there has been a considerable dip in
the rate of growth of banking system’s
credit to the government (Table IV.1).
Liquidity Management
IV.3 During 2010-11 so far, the centre’s
surplus balance with the Reserve Bank has
been a key driver of autonomous liquidity.
Currency with the public, which registered
high growth during the year so far, has
been another key determinant of
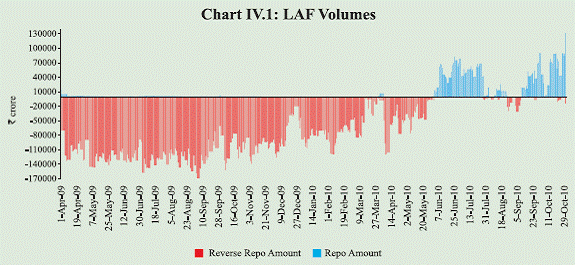
autonomous liquidity. The LAF window
of the Reserve Bank, which remained in
surplus mode for nearly 18 months,
switched into deficit mode towards end-
May 2010 and largely maintained the trend
subsequently (Chart IV.1).
Table IV.1 : Monetary Indicators |
(Amount in ` crore) |
Item |
Outstanding as on October 8, 2010 |
Variation (year-on-year) |
October 9, 2009 |
October 8, 2010 |
Amount |
Per cent |
Amount |
Per cent |
1 |
2 |
3 |
4 |
5 |
6 |
I. |
Reserve Money* |
11,73,195 |
1,02,793 |
11.8 |
2,02,615 |
20.9 |
|
(Reserve Money adjusted for CRR changes) |
|
|
(19.5) |
|
(15.4) |
II. |
Broad Money (M3) |
59,62,123 |
8,45,490 |
19.5 |
7,88,278 |
15.2 |
III. |
Components of M3 (a + b + c) |
|
|
|
|
|
|
a) Currency with the Public |
8,33,513 |
97,734 |
16.2 |
1,32,208 |
18.9 |
|
b) Aggregate Deposits |
51,24,022 |
7,48,202 |
20.1 |
6,55,915 |
14.7 |
|
i) Demand Deposits |
6,83,117 |
55,664 |
10.4 |
91,885 |
15.5 |
|
ii) Time Deposits |
44,40,905 |
6,92,538 |
21.7 |
5,64,029 |
14.5 |
|
c) Other Deposits with RBI |
4,588 |
-446 |
-9.1 |
155 |
3.5 |
IV. |
Sources of M3 (a + b + c + d - e) |
|
|
|
|
|
|
a) Net Bank Credit to the Government (i+ii) |
17,41,985 |
4,43,256 |
44.7 |
3,08,028 |
21.5 |
|
i) Net Reserve Bank Credit to the Government |
1,94,702 |
36,641 |
– |
1,89,336 |
– |
|
of which: to the Centre |
1,93,452 |
37,037 |
– |
1,88,046 |
– |
|
ii) Other Banks’ Credit to the Government |
15,47,284 |
4,06,615 |
39.8 |
1,18,692 |
8.3 |
|
b) Bank Credit to the Commercial Sector |
37,20,942 |
2,95,084 |
10.4 |
5,94,353 |
19.0 |
|
c) Net Foreign Assets of the Banking Sector |
13,24,951 |
-18,657 |
-1.4 |
-6,412 |
-0.5 |
|
d) Government’s Currency Liabilities to the Public |
11,761 |
955 |
9.9 |
1,151 |
10.9 |
|
e) Net Non-Monetary Liabilities of the Banking Sector |
8,37,517 |
-1,24,852 |
-14.6 |
1,08,843 |
14.9 |
*: Data pertain to October 22, 2010.
Note : Data are provisional. |
IV.4 With the persistence of deficit
liquidity conditions, the Reserve Bank
extended the liquidity-easing measures
introduced in May 2010, i.e., allowing
SCBs to avail additional liquidity support under the LAF to the extent of up to 0.5 per
cent of their NDTL till mid-July and
operation of second LAF (SLAF) on a daily
basis till end-July 2010. The average daily
liquidity injection under the LAF was around `47,000 crore during July 2010. In
view of the evolving inflationary scenario,
the repo and the reverse repo rates were
raised by 50 basis points and 75 basis
points, respectively, in two stages in July
2010 (Table IV.2).
 |
IV.5 The liquidity conditions improved
in August 2010, mainly on account of large
pre-scheduled public debt redemptions
towards end-July 2010, and the average
daily net injection of liquidity declined to
around `1,000 crore during the month. After
a brief period of surplus liquidity (from end-
August to early-September 2010), the
liquidity conditions again switched to
deficit mode as liquidity migrated to
government balances with the Reserve
Bank on account of quarterly advance tax
payments.
IV.6 On the basis of the assessment of
the macroeconomic situation, the Reserve
Bank increased the repo rate and reverse
repo rate by 25 basis points and 50 basis
points, respectively, in the mid-quarter
monetary policy review in September. The
liquidity conditions remained in deficit
mode in the second half of September 2010
as the cash balances of the centre started
building-up, and the average daily net
liquidity injection was around `24,000
crore during the month.The liquidity
conditions tightened further in October
2010. In order to ease the frictional liquidity
pressure, the Reserve Bank announced
certain temporary measures,viz., conduct of
SLAF on October 29 and November 1,
2010, conduct of a special two-day repo
auction under LAF on October 30, 2010 and
waiver of penal interest on shortfall in
maintainance of SLR on October 30-31,
2010, to the extent of 1 per cent of NDTL for availing additional liquidity support
under LAF.
Table IV.2 : Movements in Key Policy Rates in India |
(Per cent) |
Effective since |
Reverse Repo
Rate |
Repo Rate |
Cash Reserve
Ratio |
1 |
2 |
3 |
4 |
April 26, 2008 |
6.00 |
7.75 |
7.75 (+0.25) |
May 10, 2008 |
6.00 |
7.75 |
8.00 (+0.25) |
May 24, 2008 |
6.00 |
7.75 |
8.25 (+0.25) |
June 12, 2008 |
6.00 |
8.00 (+0.25) |
8.25 |
June 25, 2008 |
6.00 |
8.50 (+0.50) |
8.25 |
July 5, 2008 |
6.00 |
8.50 |
8.50 (+0.25) |
July 19, 2008 |
6.00 |
8.50 |
8.75 (+0.25) |
July 30, 2008 |
6.00 |
9.00 (+0.50) |
8.75 |
August 30, 2008 |
6.00 |
9.00 |
9.00 (+0.25) |
October 11, 2008 |
6.00 |
9.00 |
6.50 (–2.50) |
October 20, 2008 |
6.00 |
8.00 (–1.00) |
6.50 |
October 25, 2008 |
6.00 |
8.00 |
6.00 (–0.50) |
November 3, 2008 |
6.00 |
7.50 (–0.50) |
6.00 |
November 8, 2008 |
6.00 |
7.50 |
5.50 (–0.50) |
December 8, 2008 |
5.00 (-1.00) |
6.50 (–1.00) |
5.50 |
January 5, 2009 |
4.00 (-1.00) |
5.50 (–1.00) |
5.50 |
January 17, 2009 |
4.00 |
5.50 |
5.00 (–0.50) |
March 4, 2009 |
3.50 (-0.50) |
5.00 (-0.50) |
5.00 |
April 21, 2009 |
3.25 (-0.25) |
4.75 (-0.25) |
5.00 |
February 13, 2010 |
3.25 |
4.75 |
5.50 (+0.50) |
February 27, 2010 |
3.25 |
4.75 |
5.75 (+0.25) |
March 19, 2010 |
3.50 (+0.25) |
5.00 (+0.25) |
5.75 |
April 20, 2010 |
3.75 (+0.25) |
5.25 (+0.25) |
5.75 |
April 24, 2010 |
3.75 |
5.25 |
6.00 (+0.25) |
July 2, 2010 |
4.00 (+0.25) |
5.50 (+0.25) |
6.00 |
July 27, 2010 |
4.50 (+0.50) |
5.75 (+0.25) |
6.00 |
September 16, 2010 |
5.00 (+0.50) |
6.00 (+0.25) |
6.00 |
Note: 1. Reverse repo indicates absorption of liquidity and repo
indicates injection of liquidity.
2. Figures in parentheses indicate change in policy rates in per cent. |
IV.7 Despite surplus government
balance and currency with the public
operating as the major drains on liquidity
during the second quarter of 2010-11, when
compared with the situation prevailing at
the end of the first quarter, variations in
both currency and government surplus had
a positive contribution to autonomous
liquidity in the system (Table IV.3). The
liquidity situation was managed primarily
through LAF (Table IV.4).
Table IV.3 : Reserve Bank’s Liquidity Management Operations |
(` crore) |
Item |
2009-10 |
2010-11 |
Q1 |
Q2 |
Q3 |
Q4 |
Q1 |
Q2 |
1 |
2 |
3 |
4 |
5 |
6 |
7 |
A. |
Drivers of Liquidity (1+2+3+4) |
-45,110 |
-44,514 |
-66,785 |
55,055 |
-1,05,124 |
26,981 |
|
1. RBI’s net Purchase from Authorised Dealers |
-15,874 |
2,523 |
436 |
910 |
816 |
751 |
|
2. Currency with the Public |
-18,690 |
-9,020 |
-43,224 |
-31,650 |
-58,420 |
241 |
|
3.a. Centre’s surplus balances with RBI |
3,382 |
-67,938 |
-22,663 |
85,257 |
-58,249 |
10,953 |
|
3.b. WMA and OD |
0 |
0 |
0 |
0 |
0 |
0 |
|
4. Others (residual) |
-13,928 |
29,921 |
-1,334 |
538 |
10,729 |
15,036 |
B. |
Management of Liquidity (5+6+7+8) |
-21,674 |
62,376 |
89,870 |
1,618 |
67,255 |
-41,456 |
|
5. Liquidity impact of LAF |
-1,30,020 |
25,390 |
86,330 |
18,795 |
75,785 |
-44,545 |
|
6. Liquidity impact of OMO* (net) |
43,159 |
32,869 |
3,540 |
2,787 |
1,550 |
2,772 |
|
7. Liquidity impact of MSS |
65,187 |
4,117 |
0 |
16,036 |
2,420 |
317 |
|
8. First round impact of CRR change |
0 |
0 |
0 |
-36,000 |
-12,500 |
0 |
C. |
Bank Reserves # (A+B) |
-66,784 |
17,863 |
23,085 |
56,673 |
-37,869 |
-14,475 |
(+) : Injection of liquidity into the banking system. (-) : Absorption of liquidity from the banking system.
* : Includes oil bonds but excludes purchases of government securities on behalf of State Governments.
# : Includes vault cash with banks and adjusted for first round liquidity impact due to CRR change.
Note: Data pertain to March 31 for Q4 and last Friday for all other quarters. |
Table IV.4 : Liquidity Position |
(` crore) |
Outstanding
as on Last Friday |
LAF |
MSS |
Centre’s
Surplus@ |
Total |
1 |
2 |
3 |
4 |
5 = (2+3+4) |
2009 |
|
|
|
|
April |
1,08,430 |
70,216 |
-40,412 |
1,38,234 |
May |
1,10,685 |
39,890 |
-6,114 |
1,44,461 |
June |
1,31,505 |
22,890 |
12,837 |
1,67,232 |
July |
1,39,690 |
21,063 |
26,440 |
1,87,193 |
August |
1,53,795 |
18,773 |
45,127 |
2,17,695 |
September |
1,06,115 |
18,773 |
80,775 |
2,05,663 |
October |
84,450 |
18,773 |
69,391 |
1,72,614 |
November |
94,070 |
18,773 |
58,460 |
1,71,303 |
December |
19,785 |
18,773 |
1,03,438 |
1,41,996 |
2010 |
|
|
|
|
January |
88,290 |
7,737 |
54,111 |
1,50,138 |
February |
47,430 |
7,737 |
33,834 |
89,001 |
March* |
990 |
2,737 |
18,182 |
21,909 |
April |
35,720 |
2,737 |
-28,868 |
9,589 |
May |
6,215 |
317 |
-7,531 |
-999 |
June |
-74,795 |
317 |
76,431 |
1,953 |
July |
1,775 |
0 |
16,688 |
18,463 |
August |
11,815 |
0 |
20,054 |
31,869 |
September |
-30,250 |
0 |
65,477 |
35,227 |
October** |
-36,800 |
0 |
75,562 |
38,762 |
@ : Excludes minimum cash balances with the Reserve Bank
in case of surplus.
* : Data pertain to March 31.
** : Data pertain to October 22.
Note: 1. Negative sign in column 2 indicates injection of liquidity through LAF.
2. Negative sign in column
4 indicates WMA /OD availed
by the central government. |
IV.8 There has been a significant
reduction in the holdings of government
securities by SCBs not only because of the
higher growth of non-food credit, but also
because banks tapped the repo window
under the LAF for their liquidity needs,
leading to gradual decline in SLR
maintenance (Chart IV.2). The excess SLR
investments of SCBs amounted to
`1,86,097 crore in early October 2010 compared with `2,80,645 crore a year ago.
With moderation in excess SLR, banks are
making efforts to increase their deposit base
as well as modulating the excess reserves
maintained by them with the Reserve Bank.
Reserve Money
IV.9 Unlike the first quarter when the
main component of increase in reserve
money was currency in circulation, the
reserve money growth in the second
quarter was led by increase in banks’
deposits with Reserve Bank (Table IV.5).
Banks’ deposits with the Reserve Bank increased in line with the increase in their
net demand and time liabilities. On
average, banks maintained excess reserves
of `5,200 crore with the Reserve Bank
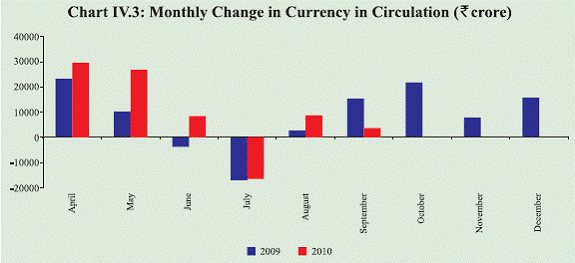
during the quarter. Even though currency
has shown strong y-o-y growth so far, the
contraction during the quarter under
review is consonant with the trend of
subdued currency demand during the
second quarter of the year (Chart IV.3).
Table IV.5 : Reserve Money - Variations |
(` crore) |
Item |
2009-10 |
2010-11 |
Q1 |
Q2 |
Q3 |
Q4 |
Q1 |
Q2 |
1 |
2 |
3 |
4 |
5 |
6 |
7 |
Reserve Money |
-38,926 |
16,216 |
51,816 |
1,38,583 |
15,125 |
3,370 |
Components (1+2+3) |
|
|
|
|
|
|
1. Currency in Circulation |
29,692 |
1,081 |
45,442 |
32,181 |
64,902 |
-4,005 |
2. Bankers’ Deposits with RBI |
-72,664 |
20,680 |
5,456 |
1,07,552 |
-49,042 |
6,481 |
3. ‘Other’ Deposits with the RBI |
4,046 |
-5,545 |
918 |
-1,150 |
-735 |
894 |
Sources (1+2+3+4-5) |
|
|
|
|
|
|
1. RBI’s Net Credit to Government |
-11,145 |
-14,953 |
51,428 |
1,24,676 |
15,796 |
-20,621 |
of which: to Centre |
-11,497 |
-14,968 |
51,597 |
1,24,688 |
15,807 |
-20,586 |
2. RBI’s Credit to Banks and Commercial Sector |
-9,623 |
-3,747 |
-5,926 |
-2,384 |
851 |
323 |
3. Net Foreign Assets of RBI |
-16,750 |
50,120 |
-15,108 |
-66,428 |
14,613 |
53,422 |
4. Governments’ Currency Liabilities to the Public |
254 |
302 |
309 |
351 |
355 |
137 |
5. Net Non-monetary Liabilities of RBI |
1,662 |
15,506 |
-21,113 |
-82,369 |
16,491 |
29,890 |
Memo: |
|
|
|
|
|
|
LAF - Repo (+) / Reverse Repo (-) |
-1,32,800 |
28,170 |
67,765 |
37,360 |
39,375 |
-8,135 |
Net Open Market Sales * |
-42,001 |
-31,591 |
-1,894 |
17 |
-8 |
20 |
Centre’s Surplus |
-13,156 |
77,713 |
17,519 |
-80,112 |
37,405 |
9,890 |
MSS Balances |
-65,187 |
-4,117 |
0 |
-16,036 |
-2,420 |
-317 |
*: Excludes Treasury Bills.
Note: 1. The sum of the memo items will not add up to the net Reserve Bank credit to the Centre as LAF and OMO transactions
are at face value and also due to margin adjustment for LAF operations.
2. Data based on March 31 for Q4 and last reporting Friday for all other quarters.
3. Data are provisional.
4. Centre’s surplus includes government’s investment balance and cash balance with the Reserve Bank. |
 |
IV.10 On the sources side, the Reserve
Bank’s credit to the Centre declined during
the quarter, due to the combined effect of
decline in the quantum of repo operations under the LAF1 as compared to the previous
quarter and build up of government
balances.
IV.11 The adjusted reserve money (base
money adjusted for the first round impact of
monetary policy actions of the Reserve Bank
in the form of CRR changes) increased by
15.9 per cent (y-o-y) as on October 22, 2010
reflecting the impact of increase in currency in circulation (on the components side) and
Reserve Bank credit to the government (on
the sources side) (Chart IV.4).
Money Supply
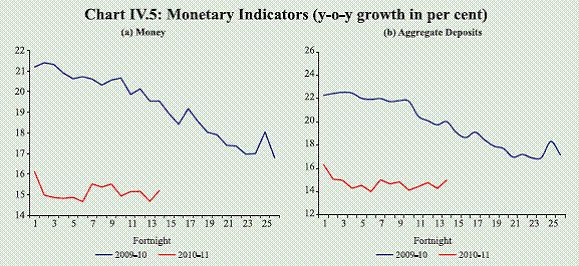
IV.12 The deceleration in the growth of
broad money (M3), that started in 2009-10,
continued in the first quarter of 2010-11.
Even though there was some revival in the growth rate of M3 during the second quarter,
it still remained below the trajectory of 17
per cent indicated in the Monetary Policy
Statement 2010-11 (Chart IV.5 a). The
pattern of growth in M3 mainly tracked the
behaviour of the major component of money
stock, i.e., aggregate deposits (Chart IV.5 b).
 |
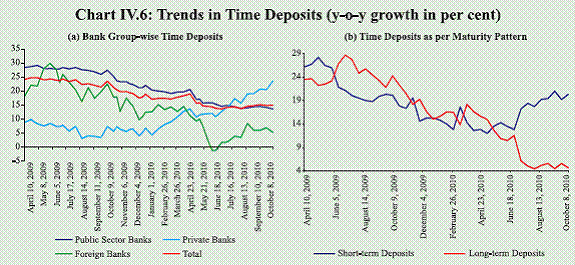
IV.13 Since time deposits are the major
constituent of aggregate deposits (around
87 per cent), a deceleration in these deposits
is reflected in the aggregate deposits as
well. A disaggregated analysis of the bank group-wise data suggests that the behaviour
of time deposits replicates the deposit
pattern of public sector banks, as they
account for a predominant share of time
deposits. Foreign banks witnessed a sharp
deceleration in time deposit growth rate in
the recent period, while the private sector
banks have bucked the overall trend, with
a sharp acceleration in their time deposits
(Chart IV.6 a). Further analysis suggests
that long-term time deposits (maturity more
than one year) witnessed a sharper
deceleration (Chart IV.6 b).
 |
| |
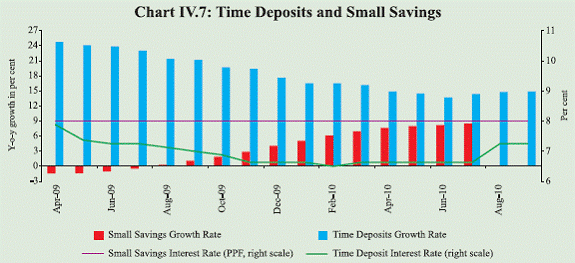 |
IV.14 The growth rate of time deposits
has, however, shown a moderate pick-up
since July 2010 in the wake of efforts made
by banks for mobilisation of deposits. Also,
there has been an increased inflow into
small savings schemes since August 2009
as small savings have yielded higher returns
than time deposits with banks since the
beginning of 2009-10 (Chart IV.7). Total
incremental inflows into small savings are,
however, only a small fraction of monthly
increases in time deposits.
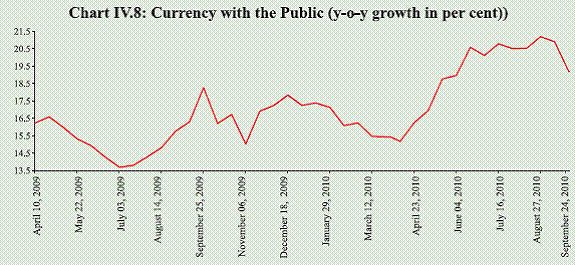
IV.15 Given the low opportunity cost of
holding money in an environment of high
inflation and depressed deposit interest
rates, the demand for currency exhibited
acceleration in growth during recent period
(Chart IV.8). The increase in currency with
the public is also reflective of increased
asset prices and payment under schemes
such as the MGNREGA. The increase in
the cash component of economic
transactions indicates the need for
furthering financial inclusion. The increased currency demand and hence the
currency deposit ratio as well as the 100
basis points increase in the CRR since
February 2010, led to some decline in the
money multiplier during the first half of the
year. Money growth, thus, remains subdued
relative to the higher rate of increase seen
in reserve money.
 |
IV.16 On a quarterly basis, the bulk of the
increase in money stock during the second
quarter of 2010-11 was owing to an increase
in time deposits. (Table IV.6). Given the
excess liquidity that prevailed in the system
till end-May 2010, banks were not actively
mobilising deposits. The transmission of the
monetary tightening measures initiated by
the Reserve Bank since February 2010 to
the deposit interest rates has started to
become visible only since July 2010
(Chapter V, Table V.7).
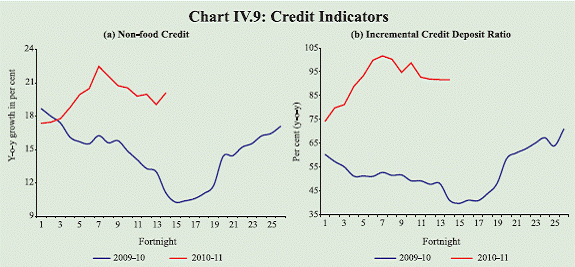
IV.17 As regards sources of M3, the
increase in money supply during the
second quarter came mainly from banking
system’s credit to the commercial sector.
There was a major pick-up in the growth
of non-food credit extended by SCBs
during the first quarter of 2010-11 as
telecom companies raised credit to pay for
the 3G and wireless access spectrums
(Chart IV.9 a). Credit flow during the
second quarter has shown a slight
moderation but largely remained above or
close to the indicative trajectory of 20 per
cent growth set out in the First Quarter
Review of Monetary Policy (July 2010).
Reflecting this moderation, as well as the
improved deposit mobilisation since July
2010, the incremental non-food credit
deposit ratio of SCBs fell below the peak
of over 100 per cent attained towards the end of the first quarter and the beginning
of the second quarter (Chart IV.9 b).
Table IV.6 : Monetary Aggregates - Variations |
(` crore) |
Item |
2009-10 |
2010-11 |
Q1 |
Q2 |
Q3 |
Q4 |
Q1 |
Q2 |
1 |
2 |
3 |
4 |
5 |
6 |
7 |
M3 |
(1+2+3 = 4+5+6+7-8) |
1,63,787 |
1,61,970 |
1,24,777 |
3,54,416 |
86,103 |
1,86,330 |
|
Components |
|
|
|
|
|
|
1. |
Currency with the Public |
24,913 |
2,797 |
45,086 |
29,787 |
64,416 |
-6,237 |
2. |
Aggregate Deposits with Banks |
1,34,829 |
1,64,717 |
78,773 |
3,22,778 |
22,421 |
1,91,672 |
|
2.1 Demand Deposits with Banks |
-40,911 |
66,320 |
-26,343 |
1,34,985 |
-86,410 |
44,635 |
|
2.2 Time Deposits with Banks |
1,75,739 |
98,397 |
1,05,116 |
1,90,793 |
1,08,831 |
1,47,037 |
3. |
‘Other’ Deposits with RBI |
4,046 |
-5,545 |
918 |
-1,150 |
-735 |
894 |
|
Sources |
|
|
|
|
|
|
4. |
Net Bank Credit to Government |
1,20,816 |
71,703 |
35,598 |
1,61,646 |
47,024 |
36,930 |
|
4.1 RBI’s Net Credit to Government |
-11,145 |
-14,953 |
51,428 |
1,24,676 |
15,796 |
-20,621 |
|
4.2 Other Banks’ Credit to Government |
1,31,961 |
86,656 |
-15,830 |
36,970 |
31,228 |
57,551 |
5. |
Bank Credit to the Commercial Sector |
-7,232 |
1,07,136 |
68,093 |
3,09,890 |
68,700 |
1,11,980 |
6. |
NFA of Banking Sector |
-37,923 |
47,908 |
-20,701 |
-59,998 |
6,967 |
53,422 |
7. |
Government’s Currency Liabilities to the Public |
254 |
302 |
309 |
351 |
355 |
137 |
8. |
Net Non-monetary Liabilities of the Banking Sector |
-87,872 |
65,079 |
-41,478 |
57,472 |
36,943 |
16,139 |
Note: Data are provisional. |
 |
IV.18 The momentum in credit growth
was seen across all bank groups, with
private banks showing the highest growth
rate at the beginning of the third quarter
of 2010-11 (Table IV.7). Public sector
banks accounted for 74 per cent of the
incremental credit off take on a year-onyear
basis as at the beginning of October
2010. Though the pace of deposit growth
for SCBs as a whole remains lower than last year, banks have increased their
borrowings from overseas as well as from
financial institutions. These alternative
funds have supported a higher credit
growth, as investment in government and
other approved securities, non-SLR
securities as well as foreign currency
assets has exhibited deceleration or
contraction in y-o-y growth (Table IV.8).
IV.19 Data on sectoral deployment of
gross bank credit show significant
improvement in credit flow to industry, services and personal loans during the
current financial year, while credit to
agriculture has declined further (Table IV.9).
A look at the disaggregated data, however,
suggests that the credit flow to industry is
not yet broad-based as the growth is mainly
driven by flow of credit to the infrastructure
sub-sector, iron and steel, chemicals and
chemical products, other metal and metal
products and engineering industries.
Table IV.7 : Credit Flow from Scheduled Commercial Banks |
(Amount in ` crore) |
Item |
Outstanding as on October 8, 2010 |
Variation (Y-o-Y) |
As on October 9, 2009 |
As on October 8, 2010 |
Amount |
Per cent |
Amount |
Per cent |
1 |
2 |
3 |
4 |
5 |
6 |
1. Public Sector Banks |
25,67,838 |
2,83,483 |
15.2 |
4,24,171 |
19.8 |
2. Foreign Banks |
1,75,580 |
-29,770 |
-15.9 |
17,979 |
11.4 |
3. Private Banks |
6,39,361 |
12,076 |
2.4 |
1,24,213 |
24.1 |
4. All Scheduled Commercial Banks* |
34,68,999 |
2,79,305 |
10.7 |
5,80,005 |
20.1 |
*: including Regional Rural Banks.
Note: Data are provisional. |
Table IV.8: Select Sources and Uses of Funds of SCBs |
(Amount in ` crore) |
Item |
Outstanding
as on
October 8,
2010 |
Variation (Y-o-Y) |
As on October 9, 2009 |
As on October 8, 2010 |
Amount |
Per cent |
Amount |
Per cent |
1 |
2 |
3 |
4 |
5 |
6 |
Sources of Funds |
|
|
|
|
|
1. Aggregate Deposits |
47,88,309 |
6,94,231 |
20.0 |
6,25,710 |
15.0 |
2. Call/Term Funding from Financial Institutions |
1,19,336 |
-18,121 |
-15.6 |
20,996 |
21.3 |
3. Overseas Foreign Currency Borrowings |
41,342 |
-34,583 |
-55.5 |
13,637 |
49.2 |
4. Capital |
65,965 |
13,809 |
30.3 |
6,649 |
11.2 |
5. Reserves |
3,69,068 |
48,836 |
17.4 |
39,603 |
12.0 |
Uses of Funds |
|
|
|
|
|
1. Bank Credit |
34,68,999 |
2,79,306 |
10.7 |
5,80,004 |
20.1 |
of which: Non-food Credit |
34,19,245 |
2,85,480 |
11.1 |
5,72,971 |
20.1 |
2. Investments in Government and |
14,75,697 |
3,87,549 |
39.6 |
1,10,264 |
8.1 |
Other Approved Securities |
|
|
|
|
|
a) Investments in Government Securities |
14,70,231 |
3,92,145 |
40.6 |
1,12,680 |
8.3 |
b) Investments in Other |
5,466 |
-4,595 |
-36.8 |
-2,417 |
-30.7 |
Approved Securities |
|
|
|
|
|
3. Investments in non-SLR Securities |
2,65,729 |
1,37,765 |
91.4 |
-22,823 |
-7.9 |
4. Foreign Currency Assets |
66,656 |
19,397 |
84.8 |
24,373 |
57.6 |
5. Balances with the RBI |
2,75,559 |
-1,29,595 |
-40.7 |
86,832 |
46.0 |
Note: Data are provisional. The sources and uses of funds will not match as the list is not exhaustive
and excludes the assets and liabilities within the banking system. |
IV.20 Overall flow of resources from
the financial sector to the commercial
sector increased significantly in the first
half of 2010-11 relative to the flows in
the corresponding period of last year
(Table IV.10). While domestic non-bank sources of funds declined compared to the
corresponding period last year, funding
from foreign sources increased on account
of higher amounts raised in the form of
short-term credit and through ECBs and
ADRs/GDRs. Reflecting the pick-up in
demand for credit, incremental non-food
credit (adjusted) exceeded the flows from
non-banking sources.
IV.21 Overall, the liquidity conditions
have changed consistent with the objective
of calibrated normalisation of monetary
policy. Net liquidity switched to deficit
mode towards the end of May 2010 after
eighteen months of surplus, and has largely
remained so since then. Reflecting the strengthening demand for finance
consistent with robust economic growth,
credit growth has picked up. Even though broad money growth remains below the
trajectory envisaged in the Monetary Policy
Statement for 2010-11, there has been an improvement since July 2010. With banks
expected to scale up their deposit
mobilisation to meet the demand for credit,
broad money growth could be expected to rise. With liquidity in deficit mode and as
deposit and lending rates start to move up
further with some lag, the transmission of
monetary policy could further strengthen.
Table IV.9: Deployment of Gross Bank Credit by Major Sectors (Revised) |
(Amount in ` crore) |
Sector |
Outstanding
as on September 24, 2010 |
Variation (financial year so far) |
September 25, 2009 |
September 24, 2010 |
Absolute |
Per cent |
Absolute |
Per cent |
1 |
2 |
3 |
4 |
5 |
6 |
Non-Food Gross Bank Credit (1 to 4) |
31,99,151 |
92,341 |
3.5 |
1,62,206 |
5.3 |
1. Agriculture and Allied Activities |
4,01,933 |
- 1,760 |
-0.5 |
-13,481 |
-3.2 |
2. Industry |
14,17,200 |
84,982 |
8.1 |
1,07,386 |
8.2 |
3. Personal Loans |
6,15,195 |
3,836 |
0.7 |
29,170 |
5.0 |
Housing |
3,17,150 |
7,891 |
2.8 |
16,195 |
5.4 |
Advances against Fixed Deposits |
51,379 |
- 3,473 |
-7.1 |
2,771 |
5.7 |
Credit Card Outstanding |
18,509 |
- 3,754 |
-13.4 |
-1,478 |
-7.4 |
Education |
40,944 |
4,557 |
15.9 |
4,060 |
11.0 |
Consumer Durables |
9,083 |
- 112 |
-1.4 |
800 |
9.7 |
4. Services |
7,64,823 |
5,281 |
0.8 |
39,130 |
5.4 |
Transport Operators |
53,876 |
- 128 |
-0.3 |
1,229 |
2.3 |
Professional Services |
53,370 |
658 |
1.5 |
4,859 |
10.0 |
Trade |
1,70,606 |
9,884 |
6.8 |
8,279 |
5.1 |
Commercial Real Estate |
1,01,662 |
1,766 |
1.9 |
9,604 |
10.4 |
Non-Banking Financial Companies |
1,25,667 |
7,192 |
7.3 |
7,746 |
6.6 |
Memo |
Priority Sector |
11,20,343 |
8,320 |
0.9 |
11,150 |
1.0 |
Micro and Small Enterprises |
3,94,604 |
20,808 |
6.7 |
19,343 |
5.2 |
Industry |
|
|
|
|
|
Food Processing |
68,153 |
327 |
0.6 |
2,896 |
4.4 |
Textiles |
1,23,764 |
3,525 |
3.4 |
2,364 |
1.9 |
Paper and Paper Products |
19,969 |
203 |
1.3 |
933 |
4.9 |
Petroleum, Coal Products and Nuclear Fuels |
57,098 |
2,590 |
3.8 |
-20,556 |
-26.5 |
Chemicals and Chemical Products |
88,348 |
1,093 |
1.4 |
3,431 |
4.0 |
Rubber, Plastic and their Products |
18,417 |
536 |
3.9 |
2,741 |
17.5 |
Iron and Steel |
1,37,588 |
14,375 |
14.5 |
9,956 |
7.8 |
Other Metal and Metal Products |
38,719 |
2,214 |
7.5 |
3,047 |
8.5 |
Engineering |
82,987 |
- 893 |
-1.4 |
9,090 |
12.3 |
Vehicles, Vehicle Parts and Transport Equipments |
40,915 |
1,818 |
5.2 |
2,166 |
5.6 |
Gems and Jewellery |
33,962 |
1,997 |
7.0 |
2,182 |
6.9 |
Construction |
42,661 |
- 592 |
-1.5 |
-1,074 |
-2.5 |
Infrastructure |
4,69,621 |
48,659 |
18.0 |
87,499 |
22.9 |
Note: 1. Data are provisional and relate to select banks, which account for 95 per cent of total non-food credit extended by all SCBs.
2. Data include the effects of mergers of Bank of Rajasthan with ICICI Bank and State Bank of Indore with State
Bank of India. |
Table IV.10 : Flow of Financial Resources to the Commercial Sector |
(` crore) |
Item |
April-March |
April-September |
2008-09 |
2009-10 |
2009-10 |
2010-11 |
1 |
2 |
3 |
4 |
5 |
A. Adjusted Non-food Bank Credit (NFC) |
4,21,091 |
4,80,258 |
1,06,575 |
2,55,674 |
i) Non-food Credit |
4,11,824 |
4,66,960 |
1,16,935 |
2,22,946$ |
ii) Non-SLR Investment by SCBs |
9,267 |
13,298 |
-10,360 |
32,728$ |
B. Flow from Non-banks (B1+B2) |
4,39,926 |
5,80,821 |
2,22,780 |
2,29,519 |
B1. Domestic Sources |
2,58,132 |
3,64,989 |
1,45,829 |
1,30,141 |
1. Public issues by non-financial entities |
14,205 |
31,956 |
13,617 |
10,448 |
2. Gross private placements by non-financial entities |
77,856 |
1,41,964 |
39,420 |
19,702 # |
3. Net issuance of CPs subscribed to by non-banks |
4,936 |
25,835 |
50,999 |
32,812 * |
4. Net credit by housing finance companies |
25,876 |
28,485 |
3,581 |
7,519^ |
5. Total gross accommodation by the four RBI regulated AIFIs - NABARD, NHB, SIDBI and EXIM Bank |
31,408 |
33,871 |
-3,332 |
15,300 |
6. Systemically important non-deposit taking NBFCs (net of bank credit) |
42,277 |
60,663 |
18,064 |
30,935^ |
7. LIC’s gross investment in corporate debt, infrastructure and social sector |
61,574 |
42,215 |
23,480 |
13,425 ^ |
B2. Foreign Sources |
1,81,794 |
2,15,832 |
76,950 |
99,379 |
1. ECBs/FCCBs |
31,350 |
14,356 |
3,991 |
25,525^ |
2. ADR/GDR issues excluding banks and financial institutions |
4,788 |
15,124 |
4,881 |
6,660 |
3. Short-term credit from abroad |
-12,972 |
35,170 |
-7,137 |
25,455# |
4. FDI to India |
1,58,628 |
1,51,182 |
75,215 |
41,739^ |
C. Total Flow of Resources (A+B) |
8,61,017 |
10,61,079 |
3,29,355 |
4,85,193 |
Memo Item: |
|
|
|
|
Net resource mobilisation by Mutual Funds through Debt (non-Gilt) Schemes |
-32,168 |
96,578 |
1,01,956 |
-3,266 |
$: Up to October 8, 2010. #: April-June. ^: April-August. *: Up to September 15, 2010. |
1 The Reserve Bank's credit to the Centre is affected by LAF operations, OMO, MSS balances and government's cash surplus
with the Reserve Bank. Increase in repo/OMO purchases and decline in reverse repo/MSS balances/Government's surplus
balances with Reserve Bank lead to increase in net Reserve Bank credit to the Centre, and vice versa.
|