As renewed concerns about the strength of the global recovery started to dampen the
external demand conditions, the impact of robust domestic growth was visible in the
form of a higher current account deficit in the first quarter of 2010-11. While better
absorption of foreign capital through a higher current account deficit contained the
impact of surplus capital flows on the exchange rate, persistent positive inflation
differential remained a source of pressure on external competitiveness of exports.
Moreover, despite stronger absorption of capital inflows, the nominal exchange rate of the
rupee appreciated against the US dollar.
International Developments
III.1 The global economy is projected to
recover from -0.6 per cent growth recorded
in 2009 to 4.8 per cent in 2010. This overall
outlook, however, masks large divergence
in the pace and nature of the recovery, both
across countries and between the two halves
of 2010. According to the IMF, in the
advanced economies, growth is expected to
halve from 3.50 per cent in the first half of
the year to 1.75 per cent in the second half.
Emerging and developing economies too
are expected to witness a moderation in the
pace of growth from 8 per cent in the first
half to 6.25 per cent in the second half. The
temporary slowdown is also believed to
extend up to the first half of 2011.
III.2 The global recovery lost
momentum in the second quarter of the
year, with the pace of recovery starting to
slow down significantly in the advanced
economies, particularly in the US and Japan
(Chart III.1b & c). Growth in world
industrial production also exhibited signs
of deceleration after attaining peaks in
March 2010 (Chart III.1d). Emerging
Market Economies (EMEs), however,
sustained the strong growth, and as a result,
the asymmetry in growth widened further.
While another short phase of contraction in economic activities in advanced
economies, i.e., the fear of a double dip has
receded, the feeble growth has reinforced
concerns over deflation and high
unemployment rates (Chart III.1f). With
scope for fiscal stimulus already stretched
to the point where sovereign risk concerns
could be detrimental to recovery in growth,
several central banks of advanced
economies have signaled possible use of
additional accommodative monetary policy
stance (Chart III.1g & h). Unlike output,
trade activities have recovered strongly, and
the momentum has also been sustained
(Chart.III.1e). Reflecting this, the WTO
revised upwards its estimates for growth in
merchandise trade volume to 13.5 per cent
for 2010 from the previous estimates of
10.0 per cent, which will be the fastest ever
year-on-year expansion in trade so far. This
high growth, however, needs to be seen
against the low base that resulted from
sharp 12.2 per cent contraction experienced
in 2009. Moreover, even though the value
of merchandise trade expanded by 25 per
cent in the first half of 2010, the level of
activity still remains below the pre-crisis
level. With deficient domestic demand,
there have been signs of resorting to
protectionism and undervalued exchange
rates in some countries, which would hinder overall global recovery. The unemployment
situation in general continues to be grim, and
employment intensive recovery remains a
major global policy challenge. According to
the ILO’s August 2010 assessment of global
employment trends for the youth, the global
unemployment among youth (in the age
group of 15 to 24) has increased from 11.9
per cent in 2007 to 13.0 per cent in 2009,
which is expected to edge up further to 13.1
per cent in 2010. According to the IMF,
unemployment has increased by 30 million
since 2007, three fourth of which has been
in advanced economies.
 |
III.3 Developing Asia, according to the
September 2010 assessment of the ADB,
has sustained the momentum after
witnessing a robust recovery, and is
expected to grow at 8.2 per cent in 2010,
as against 5.4 per cent in 2009. Recovery
in both domestic demand and exports has
contributed to this performance. End of the
benefit of low base, fading policy stimulus
and weaker growth in advanced economies
in the second half of the year will be the
major downside risks to growth. Risks to
inflation could stem from buoyant domestic
demand and rising commodity prices. The
IIF revised upwards in October 2010 its
assessment of private capital flows to EMEs
for 2010 by US$ 116 billion from its April
projections. Projected capital flows to
EMEs in 2010 at US$ 825 billion will be
significantly higher than US$ 581 billion
in 2009. The Global Financial Stability
Report, October 2010 notes that higher
growth prospects and sounder fundamentals
in EMEs point to a structural asset
reallocation from advanced economies,
which may increase volatility in portfolio
capital flows and strain local market
valuations in emerging market economies.
III.4 The recent volatile external
developments suggest that for the purpose of
policy, their direct and indirect impact on the
Indian economy and the financial system
would have to be constantly assessed, and
appropriate corrective policy response may
have to be taken to deal with any visible signs
of vulnerability. The asymmetry in growth
relative to advanced economies would imply
higher trade imbalance in India, which also
has to recognise the risks from protectionism
and exchange rate policies of other countries.
The overall upbeat outlook for capital flows
to EMEs suggests that given the robust
domestic growth outlook and the increasing
interest rate differentials after the calibrated
normalisation of monetary policy, gross
capital inflows in 2010-11 would be higher
than what were expected a few months back.
Merchandise Trade
Exports
III.5 India’s merchandise exports, which
exhibited a robust recovery in the last
quarter of 2009-10, continued to record
high growth during the current financial
year (Chart III.2). After recording a growth of 36.4 per cent during the fourth quarter
of 2009-10, export growth has witnessed
some moderation to 27.6 per cent this year
during April-September. India’s export
performance, however, remains better than
the overall global trends (Chart III.3).
Imports
III.6 Reflecting the demand associated
with robust domestic growth, imports
increased at a higher pace, though with
some volatility during the year so far. Oil imports registered a growth of 54.8 per cent
during the first quarter of 2010-11 on
account of the combined effect of increase
in volume along with higher international
crude oil prices relative to the
corresponding quarter of the previous year
(Chart III.4). Non-oil imports increased by
33.7 per cent during April-August 2010,
reflecting strong domestic demand
conditions.
III.7 Stronger growth in both oil and
non-oil imports relative to exports resulted
in a wider merchandise trade deficit during
April-September 2010 at US$ 63.2 billion
as compared with US$ 46.9 billion during
the corresponding period of the previous
year (Table III.3).
Balance of Payments (BoP)
Current Account
III.8 The impact of the continuing
asymmetry between robust growth in India
and fragile recovery in the advanced
economies was visible in the current
account deficit, which expanded in the first quarter of 2010-11, relative to both
previous quarter and corresponding
quarter of the previous year (Table III.4).
The trade deficit, on a BoP basis, was higher at US$ 34.2 billion in the first
quarter of 2010-11 as compared with US$
25.6 billion during corresponding period
of 2009-10.
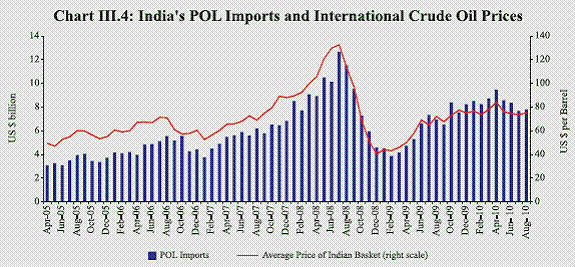 |
Table III.3 : India’s Merchandise Trade |
(US$ billion) |
| |
April-March |
April-September |
2009-10 P |
2009-10 R |
2010-11 P |
Absolute |
Growth (%) |
Absolute |
Growth (%) |
Absolute |
Growth (%) |
1 |
2 |
3 |
4 |
5 |
6 |
7 |
Exports |
178.7 |
-3.6 |
80.9 |
-25.7 |
103.3 |
27.6 |
Oil |
28.1 |
2.1 |
10.8 |
-42.5 |
.. |
.. |
Non-oil |
150.5 |
-4.6 |
70.2 |
-22.2 |
.. |
.. |
Imports |
286.8 |
-5.6 |
127.8 |
-30.9 |
166.5 |
29.9 |
Oil |
87.1 |
-7.0 |
37.5 |
-40.8 |
40.7* |
31.7* |
Non-oil |
199.7 |
-4.9 |
90.4 |
-25.8 |
101.2* |
33.7* |
Trade Balance |
-108.2 |
-8.6 |
-46.9 |
-38.4 |
-63.2 |
34.8 |
Non-Oil Trade Balance |
-49.2 |
-5.9 |
-20.2 |
-36.0 |
.. |
.. |
R: Revised. P: Provisional. .. Not Available. *: Figures pertain to April-August.
Source : Directorate General of Commercial Intelligence and Statistics (DGCI&S). |
Table III.4 : India's Balance of Payments |
(US$ billion) |
|
2008-09
Apr-Mar
PR |
2009-10
Apr-Mar
P |
2009-10 |
2010-11 |
Apr-Jun
PR |
Jul-Sep
PR |
Oct-Dec
PR |
Jan-Mar
P |
Apr-Jun
P |
1 |
2 |
3 |
4 |
5 |
6 |
7 |
8 |
1. |
Exports |
189.0 |
182.2 |
39.2 |
43.5 |
47.1 |
52.4 |
53.7 |
2. |
Imports |
307.7 |
299.5 |
64.8 |
72.6 |
78.1 |
83.9 |
87.9 |
3. |
Trade Balance (1-2) |
-118.7 |
-117.3 |
-25.6 |
-29.1 |
-31.1 |
-31.5 |
-34.2 |
4. |
Net Invisibles |
89.9 |
78.9 |
21.2 |
20.4 |
18.9 |
18.5 |
20.5 |
5. |
Current Account Balance (3+4) |
-28.7 |
-38.4 |
-4.5 |
-8.8 |
-12.2 |
-13.0 |
-13.7 |
6. |
Gross Capital Inflows |
312.4 |
344.0 |
77.1 |
95.4 |
81.3 |
90.2 |
95.3 |
7. |
Gross Capital Outflows |
305.2 |
290.4 |
73.1 |
76.6 |
66.6 |
74.1 |
76.9 |
8. |
Net Capital Account (6-7) |
7.2 |
53.6 |
4.0 |
18.8 |
14.7 |
16.1 |
18.4 |
9. |
Overall Balance (5+8)# |
-20.1 |
13.4 |
0.1 |
9.4 |
1.8 |
2.1 |
3.7 |
Memo: |
|
|
|
|
|
|
|
i. |
Export growth (%) |
13.7 |
-3.6 |
-31.8 |
-18.9 |
19.3 |
36.2 |
37.2 |
ii. |
Import growth (%) |
19.4 |
-2.7 |
-21.7 |
-21.7 |
6.3 |
43.0 |
35.7 |
iii. |
Net service exports growth (%) |
27.7 |
-31.1 |
-3.1 |
-47.4 |
-40.8 |
-24.5 |
-3.0 |
iv. |
Net Invisibles growth (%) |
18.7 |
-12.2 |
-3.7 |
-23.3 |
-15.6 |
-2.6 |
-3.4 |
v. |
Foreign Exchange Reserves (as at end Period) |
252.0 |
279.1 |
265.1 |
281.3 |
283.5 |
279.1 |
275.7 |
P : Preliminary. PR : Partially Revised.
# : also includes errors & omissions. |
Invisibles
III.9 India’s net surplus in the invisibles
account (comprising services, income and
transfers) declined during the first quarter
of 2010-11 as compared to last year, mainly
because of strong growth in services
payments and decline in investment income
receipts. The increase in services exports
(by 22.5 per cent) during April-June 2010
was mainly due to a rise in services related
to travel, and transportation as well as
miscellaneous services such as software,
business and financial services, which was
largely offset by substantial expansion in
services payments, particularly
transportation, business and financial
services. As a result, there was a net decline
of 3.0 per cent in the services account. The
invisibles surplus financed about 60.0 per cent of the trade deficit during the quarter
as against about 83.0 per cent during the
corresponding quarter of the previous year
(Table III.5).
Capital Account
III.10 The net surplus in the capital
account in the first quarter of 2010-11
exceeded the levels of the previous two
quarters, as well as the financing need in
the current account (Table III.6). There was
a compositional shift across different
components of capital flows during recent
months. Foreign investment, which used to
be a major constituent of the capital
account, showed some moderation, mainly
due to the slowdown in Foreign Direct
Investment (FDI) inflows. Net inflows by
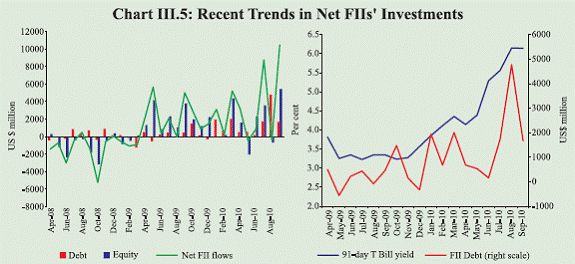
FIIs were also lower during the quarter. FIIs, which were traditionally investing in
equity market, started diversifying towards
debt markets (Chart III.5). The attraction
of the debt market could be attributed to
the rising interest rate environment in India
and the near zero interest rate conditions in advanced countries over an extended
period. In order to support the development
of vital infrastructure, to facilitate the
transfer of power from energy surplus
regions to underserved areas and to improve
the quality of public services, India received large foreign capital in the form of external
assistance during the quarter. Strong
domestic demand along with the rising
interest rate differentials also led to higher
net inflows of External Commercial
Borrowings (ECBs) during the quarter.
Short-term trade credit to India recorded a
large net inflow of US$ 5.6 billion in the
first quarter of 2010-11 (as against a net
outflow of US$ 1.5 billion during the
corresponding quarter of 2009-10) in line
with the increase in imports associated with
strong domestic economic activity and
improved conditions in the global financial
markets. Banking capital recorded inflows
of US$ 4.0 billion during the quarter,
mainly due to overseas foreign currency
borrowings of banks and net inflows under
NRI deposits. Debt flows during the quarter
at about US$12 billion accounted for almost
64 per cent of total net capital flows.
Table III.5 : Invisibles Gross Receipts and Payments |
(US$ billion) |
|
Invisibles Receipts |
Invisibles Payments |
April-March |
April-June |
April-March |
Apr-June |
2008-09
PR |
2009-10
P |
2009-10
PR |
2010-11
P |
2008-09
PR |
2009-10
P |
2009-10
PR |
2010-11
P |
1 |
2 |
3 |
4 |
5 |
6 |
7 |
8 |
9 |
1. Travel |
10.9 |
11.9 |
2.3 |
3.0 |
9.4 |
9.3 |
2.0 |
2.3 |
2. Transportation |
11.3 |
11.1 |
2.5 |
3.1 |
12.8 |
11.9 |
2.8 |
3.1 |
3. Insurance |
1.4 |
1.6 |
0.4 |
0.4 |
1.1 |
1.3 |
0.3 |
0.3 |
4. Govt. not included elsewhere |
0.4 |
0.4 |
0.1 |
0.1 |
0.8 |
0.5 |
0.1 |
0.1 |
5. Miscellaneous |
77.7 |
68.7 |
16.0 |
19.6 |
27.9 |
36.5 |
5.7 |
10.2 |
Of which : |
|
|
|
|
|
|
|
|
Software |
46.3 |
49.7 |
11.0 |
12.7 |
2.8 |
1.5 |
0.4 |
0.6 |
Non-Software |
31.4 |
19.0 |
5.0 |
6.9 |
25.1 |
35.0 |
5.3 |
9.6 |
6. Transfers |
47.5 |
54.4 |
13.3 |
13.8 |
2.7 |
2.3 |
0.5 |
0.7 |
Of which : |
|
|
|
|
|
|
|
|
Private Transfers |
46.9 |
53.9 |
13.3 |
13.7 |
2.3 |
1.8 |
0.4 |
0.6 |
7. Income |
14.3 |
13.0 |
3.0 |
2.9 |
18.8 |
20.4 |
5.0 |
5.5 |
Investment Income |
13.5 |
12.1 |
2.7 |
2.6 |
17.5 |
18.7 |
4.7 |
5.0 |
Compensation of Employees |
0.8 |
0.9 |
0.2 |
0.2 |
1.3 |
1.7 |
0.4 |
0.5 |
Total (1 to 7) |
163.5 |
161.2 |
37.6 |
42.7 |
73.6 |
82.3 |
16.4 |
22.3 |
P: Preliminary. PR: Partially Revised. |
Table III.6 : Net Capital Flows |
(US$ billion) |
|
2008-09
Apr-Mar PR |
2009-10 Apr-Mar
P |
2009-10 |
2010-11 |
Apr-Jun PR |
Jul-Sep
PR |
Oct-Dec PR |
Jan-Mar
PR |
Apr-Jun
P |
1 |
2 |
3 |
4 |
5 |
6 |
7 |
8 |
1. Foreign Direct Investment (FDI) |
17.5 |
19.7 |
6.1 |
6.5 |
3.9 |
3.2 |
3.2 |
Inward FDI |
35.0 |
31.7 |
8.7 |
10.7 |
7.1 |
5.1 |
6.0 |
Outward FDI |
17.5 |
12.0 |
2.6 |
4.2 |
3.2 |
1.9 |
2.8 |
2. Portfolio Investment |
-14.0 |
32.4 |
8.3 |
9.7 |
5.7 |
8.8 |
4.6 |
Of which: |
|
|
|
|
|
|
|
FIIs |
-15.0 |
29.0 |
8.2 |
7.0 |
5.3 |
8.5 |
3.5 |
ADR/GDRs |
1.2 |
3.3 |
0.04 |
2.7 |
0.5 |
0.1 |
1.1 |
3. External Assistance |
2.6 |
2.0 |
0.1 |
0.5 |
0.6 |
0.8 |
2.3 |
4. External Commercial Borrowings |
7.9 |
2.5 |
-0.5 |
1.2 |
1.7 |
0.1 |
2.7 |
5. NRI Deposits |
4.3 |
2.9 |
1.8 |
1.0 |
0.6 |
-0.6 |
1.1 |
6. Banking Capital excluding NRI Deposits |
-7.5 |
-0.8 |
-5.2 |
3.4 |
1.3 |
-0.4 |
2.9 |
7. Short-term Trade Credit |
-1.9 |
7.7 |
-1.5 |
0.8 |
3.3 |
5.0 |
5.6 |
8. Rupee Debt Service |
-0.1 |
-0.1 |
-0.02 |
- |
- |
-0.1 |
-0.02 |
9. Other Capital |
-1.5 |
-12.7 |
-5.2 |
-4.3 |
-2.4 |
-0.9 |
-3.9 |
Total (1 to 9) |
7.2 |
53.6 |
4.0 |
18.8 |
14.7 |
16.1 |
18.4 |
P: Preliminary. PR: Partially Revised. – : Negligible. |
 |
III.11 Available information on certain
lead indicators of capital flows for the period
2010-11 so far shows some moderation in
inflows in the form of FDI and NRI deposits,
but larger net inflows under FIIs and ECBs
(Table III.7). Debt flows, particularly ECBs, which are sensitive to interest rate
differential, have been higher. FII flows have
remained volatile during the year so far. They
recorded net outflows in May 2010 but
revived strongly in July recording net
inflows of US$ 8.8 billion. Again, there were
net outflows in August 2010, followed by
net inflows in September 2010 at US$ 10.5
billion. Inflows in October increased to a
record level of US$ 28.7 billion (up to
October 22, 2010), which also reflected the
over subscription of IPOs floated in the
capital market. In this context, it may be
noted that although many other Asian EMEs
have also seen large capital inflows recently,
India runs a current account deficit as
opposed to current account surpluses in
many other Asian economies.
Table III.7 : Capital Flows in 2010-11 so far |
(US$ billion) |
Component |
Period |
2009-10 |
2010-11 |
1 |
2 |
3 |
4 |
FDI to India |
April-September |
17.8 |
13.5 |
FIIs (net) |
April-October 22 |
18.9 |
51.0 |
ADRs/GDRs |
April-September |
2.7 |
1.6 |
ECB Approvals |
April-September |
7.2 |
10.6 |
NRI Deposits (net) |
April-September |
2.9 |
2.2 |
FDI : Foreign Direct Investment.
FII : Foreign Institutional Investors.
ECB : External Commercial Borrowings.
NRI : Non Resident Indians.
ADR : American Depository Receipts.
GDR : Global Depository Receipts. |
Foreign Exchange Reserves
III.12 As net capital flows were higher
than the current account deficit, India’s
foreign exchange reserves (excluding
valuation effects) increased by US$ 3.7
billion during the first quarter of 2010-11 as
compared to only a marginal increase of US$
0.1 billion during the corresponding period
of the previous year. Since the valuation loss
on account of the appreciation of the US
dollar against major international currencies
amounted to about US$ 7 billion during
April-June 2010, there was a net decline in
the outstanding level of foreign exchange
reserves by US$ 3.3 billion. India’s foreign
exchange reserves stood at US$ 295.4 billion
as on October 22, 2010 (Table III.8).
Real Effective Exchange Rate of the Rupee
III.13 The real effective exchange rate
(REER) indices for both 6-currency and 36 currency baskets had exhibited significant
appreciation in 2009-10. During 2010-11 so
far (April-October 22, 2010), the 6-currency
REER has recorded higher appreciation as
compared with 36-currency REER (Chart
III.6 and Table III.9). The 36-currency
REER covers around 90 per cent of India’s
foreign trade. If the positive inflation
differentials persist, and the tendency
among some countries to use undervalued
exchange rates to boost their exports
amplifies further, then the competitiveness of Indian exports may face pressures. The
reason for the divergence between 6-
currency REER and 36-currency REER
indices could be seen from the movement
in the 30-currency REER index, which
excludes 6 currencies (covered in the 6-
currency REER). India’s inflation
differentials with respect to 6 major countries included in the 6-currency REER
have been higher than that with respect to
other EMEs in the 30-currency index.
Table III.8 : Composition of Foreign
Exchange Reserves |
(US$ million) |
Month |
Gold |
SDR |
Foreign
Currency
Assets |
Reserve
Tranche
Position
in the IMF |
Total
(2+3+ 4+5) |
1 |
2 |
3 |
4 |
5 |
6 |
Mar-09 |
9,577 |
1 |
241,426 |
981 |
251,985 |
Mar-10 |
17,986 |
5,006 |
254,685 |
1,380 |
279,057 |
Apr-10 |
18,537 |
4,982 |
254,773 |
1,341 |
279,633 |
May-10 |
19,423 |
4,861 |
247,951 |
1,309 |
273,544 |
Jun-10 |
19,894 |
4,875 |
249,628 |
1,313 |
275,710 |
Jul 10 |
19,278 |
5,006 |
258,551 |
1,348 |
284,183 |
Aug 10 |
20,008 |
4,974 |
256,227 |
1,932 |
283,142 |
Sept 10 |
20,516 |
5,130 |
265,231 |
1,993 |
292,870 |
Oct 10# |
20,516 |
5,178 |
267,694 |
2,012 |
295,399 |
# : As on October 22, 2010. |
Table III.9 : Nominal and Real Effective Exchange Rates of the Indian Rupee (Trade Based Weights, Base: 1993-94=100) |
(Per cent, appreciation + /depreciation -) |
|
Index
October 22,
2010 P |
2008-09 |
2009-10 |
2009-10 (Apr- Oct) |
2010-11 (Apr-
Oct 22) P |
1 |
2 |
3 |
4 |
5 |
6 |
36-REER |
100.1 |
-13.6 |
13.2 |
4.4 |
0.4 |
36-NEER |
88.3 |
-10.3 |
9.3 |
4.5 |
0.0 |
30-REER |
92.7 |
-6.9 |
4.1 |
1.3 |
-0.6 |
30-NEER |
108.2 |
-2.6 |
2.7 |
1.2 |
0.3 |
6-REER |
118.1 |
-14.0 |
20.0 |
8.8 |
3.1 |
6-NEER |
66.5 |
-14.8 |
10.2 |
3.5 |
-0.1 |
Memo: |
|
|
|
|
|
Rs/US$ |
44.47 |
-21.5 |
12.9 |
8.5 |
1.5 |
NEER : Nominal Effective Exchange Rate.
REER : Real Effective Exchange Rate. P: Provisional.
Note : Rise in indices indicates appreciation of the rupee and vice versa. |
External Debt
III.14 India’s external debt stock at US$
273.1 billion at end-June 2010 recorded an
increase of US$ 10.8 billion over its level
at end-March 2010, mainly on account of
significant increase in short-term trade
credits, ECBs and multilateral borrowings
of the Government. Excluding valuation
effects resulting from the appreciation of
the US dollar against major international
currencies, India’s external debt increased
by US$ 12.1 billion. As at end-June 2010,
the share of short-term debt in total external debt based on original maturity was 21.2
per cent, while based on residual maturity
its share was higher at 42.5 per cent. The
key debt sustainability indicators remained
at comfortable levels as at end-June 2010
(Table III.10).
International Investment Position
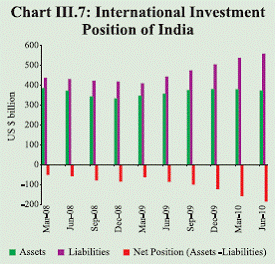
III.15 India’s net international liabilities
increased by US$ 26.8 billion during the
first quarter of 2010-11 mainly due to
increase in net inflows under trade credits
and loans along with FDI and portfolio
investment. Total external financial assets
decreased by US$ 5.3 billion to US$ 373.6
billion as at end-June 2010 over the
previous quarter due to decline in reserve assets and trade credits. The reserve assets
declined by US$ 3.4 billion due to the
valuation loss, reflecting appreciation of the
US dollar against major international
currencies. Total international financial
liabilities increased by US$ 21.4 billion
over the previous quarter to US$ 558.7
billion as at end-June 2010 (Chart III.7).
Table III.10 : India’s External Debt |
(US$ billion) |
|
End-March
2009 |
End-March
2010 PR |
End-June
2010 P |
Variation (June 2010 over March 2010) |
Amount |
Per cent |
1 |
2 |
3 |
4 |
5 |
6 |
1. Multilateral |
39.5 |
42.7 |
44.7 |
1.9 |
4.5 |
2. Bilateral |
20.6 |
22.6 |
22.9 |
0.3 |
1.5 |
3. International Monetary Fund |
1.0 |
6.0 |
5.9 |
-0.1 |
-2.6 |
4. Trade Credit (above 1 year) |
14.5 |
16.9 |
17.6 |
0.7 |
4.2 |
5. External Commercial Borrowings |
62.4 |
72.0 |
74.5 |
2.5 |
3.5 |
6. NRI Deposit |
41.6 |
47.9 |
48.1 |
0.2 |
0.5 |
7. Rupee Debt |
1.5 |
1.7 |
1.6 |
-0.1 |
-4.4 |
8. Long-term (1 to 7) |
181.1 |
209.8 |
215.3 |
5.4 |
2.6 |
9. Short-term |
43.4 |
52.5 |
57.8 |
5.4 |
10.2 |
Total (8+9) |
224.5 |
262.3 |
273.1 |
10.8 |
4.1 |
(Per cent) |
Total Debt /GDP |
20.5 |
18.9 |
- |
|
|
Short-term Debt/Total Debt |
19.3 |
20.0 |
21.2 |
|
|
Short-term Debt/Reserves |
17.2 |
18.8 |
21.0 |
|
|
Concessional Debt/Total Debt |
18.7 |
16.7 |
15.9 |
|
|
Reserves/Total Debt |
112.2 |
106.4 |
101.0 |
|
|
Debt Service Ratio |
4.4 |
5.5 |
3.9 |
|
|
-: Not available. P: Provisional; PR: Partially Revised. |
III.16 Overall, India’s balance of payments
situation reflected the impact of robust
domestic growth, which was visible in the wider current account deficit. The upbeat
growth outlook of India and rising interest
rate differentials have contributed to attract
larger net capital inflows, which financed the
current account deficit. Going forward, the
magnitude of the current account deficit may
exceed the levels of the previous year, as
asymmetry between the growth outlook of
India and the developed countries is likely
to persist, which will be reflected in export
growth lagging behind import growth during
the year. Recent outlook for capital flows to
EMEs suggests that after the temporary
uncertainty created by the sovereign risk
concerns in the Euro area, capital flows to
EMEs will be stronger. Although financing
of the current account deficit may not be a
problem, possible increase in the magnitude
of the deficit could pose sustainability risks.
Sustainable current account deficit is
important for stable growth, and persisting
high positive inflation differential will be a
source of pressure on the external
competitiveness of Indian exports.
Containing inflation, thus, is important even
for improving the external balance position.
 |
|