Various forward looking surveys conducted in the recent period suggest an overall improvement in business sentiments as also the possibility of further acceleration of growth in 2010-11. The Professional Forecasters’ Survey of the Reserve Bank also shows upward revision in the median growth projections for 2010-11. With stronger growth outlook, high generalised inflation has emerged as the key macroeconomic concern. The anti-inflationary monetary policy measures taken so far by the Reserve Bank, coupled with an improved supply position that may result from better performance of kharif relative to last year, could be expected to help in arresting inflation by firmly anchoring inflationary expectations in
the coming months. VII.1 The Indian economy witnessed robust recovery in growth in the last quarter of 2009-10. Most of the business expectations surveys suggest continuation of the growth momentum in 2010-11. The Industrial Outlook Survey of the Reserve Bank indicates further improvement in several parameters of the business environment for the July-September 2010 quarter. The Professional Forecasters’ Survey conducted by the Reserve Bank in June 2010 places overall (median) GDP growth rate for 2010-11 at 8.4 per cent, higher than 8.2 per cent reported in the previous round of the survey.
Business Expectations Surveys
VII.2 The forward looking surveys
conducted by various agencies generally convey an optimistic picture about the
economy. In continuation of the trend
observed in recent rounds of surveys, the
latest round of most of the surveys also
shows strong y-o-y as well as q-o-q
improvement. (Table VII.1).
VII.3 NCAER-MasterCard Worldwide
Index of Business Confidence points to
continuation of high level of optimism
notwithstanding a marginal decline in the
index. The optimism is led by sustained
recovery in the industrial activity and
improvement in merchandise export during
April-May 2010, which contributed to the
expectation that the overall GDP growth in
the first quarter of 2010-11 may exceed 8.5
per cent. At the same time, there are
concerns that persistence of double digit
inflation may affect consumption and investment demand and also lead to policy
response that could increase the cost of
credit and funds.
Table VII.1 : Business Expectations Surveys |
Period/Index |
NCAER-MasterCard Worldwide Index of Business Confidence June 2010 |
FICCI Q4:2009-10 Overall Business Confidence Index |
Dun & Bradstreet Q3 : 2010 Business Optimism Index |
CII Apr.-September 2010-11 Business Confidence Index |
1 |
2 |
3 |
4 |
5 |
Current level of the Index |
155.9 |
74.8 |
150.0 |
67.6 |
Index as per previous survey |
156.8 |
70.0 |
142.8 |
66.1 |
Index levels one year back |
118.6 |
64.1 |
132.1 |
58.7 |
% change (q-o-q) sequential |
-0.6 |
6.9 |
5.0 |
2.3 |
% change (y-o-y) |
31.5 |
16.7 |
13.6 |
15.2 |
VII.4 The latest round of Business
Confidence Survey of the FICCI suggests
that 87 per cent of the companies view the
overall economic conditions as “moderately
to substantially better”. Going ahead,
around 82 per cent of the companies foresee
an improvement in overall economic
conditions in the coming six months. The
outlook for jobs has been somewhat
subdued, with about two-thirds of the
participants anticipating no change in
employment levels in the coming six
months, even though about 30 per cent
firms expect an increase in their employee
strength in the coming six months.
VII.5 The Dun and Bradstreet Business
Optimism Survey recorded sustained
improvement, which at a two year high, is
reflective of the continuous strengthening of
confidence amongst corporates. Robust
growth in industrial production, stabilising
domestic consumption demand, rapidly
growing investment demand coupled with
increase in imports and exports seem to have
supported the growing business confidence.
Five out of the six optimism indices, viz.,
volume of sales, net profits, new orders,
inventory levels and employee levels have
registered an increase as compared to the
previous quarter. However, selling prices
recorded a decline as compared to the
previous quarter. Demand conditions are
expected to witness significant improvement
in the medium to long-term and employment
scenario is expected to improve in the July-
September 2010 quarter.
VII.6 The CII Business Confidence
Survey for April-September 2010-11 suggested growing confidence of
respondents about expansion of exports over
the next six months. Headline inflation
touching double digits emerged as a major
concern, while the respondents felt that
procedural delays need to be addressed
urgently.
VII.7 The seasonally adjusted HSBC
Markit Manufacturing Purchasing
Managers’ Index (PMI), which had
recorded a twenty-seven month high in May
2010, witnessed a marginal fall in June
2010, mainly reflecting slower growth in
output and new orders, even though the
pace of new export orders accelerated. On
the downside, the employment levels
remained stagnant. Notwithstanding the
recent fall, the index has remained in the
above neutral territory (i.e., above 50) in
each of the past fifteen months.
VII.8 The HSBC Markit Services PMI
accelerated sharply to reach a two year
high in June 2010, indicating optimism
and continuation of higher levels of
activity in the services sector. India is one
of the few countries that showed an
improvement in the services PMI in June
2010. The employment scenario also
improved and the output prices continued
to rise at accelerated pace, thus suggesting
continuation of pricing pressures. The
growth in services sector offset the
weakness in manufacturing sector and, as
a result, the composite output index
registered the sharpest rise in almost two
years.
Reserve Bank’s Industrial Outlook Survey
VII.9 The 50th round of the Industrial
Outlook Survey of the Reserve Bank
conducted during April-June 2010, based on a sample of 1,092 companies, suggested
a moderate slowdown in the index, both for
the assessment quarter (April-June 2010)
as well as expectations for the July-
September 2010 quarter. However, both
indices (i.e., assessment about the current
quarter and expectations about the next
quarter) remained in the growth terrain (i.e.,
above 100, which is the threshold that
separates contraction from expansion)
(Chart VII.1a). Most of the parameters of the survey indicate buoyancy in business
environment (Table VII.2). The findings
of the survey are in line with the forward
looking manufacturing PMI survey
(Chart VII.1b).
Survey of Professional Forecasters
VII.10 The results of the twelfth round of
“Survey of Professional Forecasters”
conducted by the Reserve Bank in June 2010
shows overall (median) GDP growth rate for 2010-11 at 8.4 per cent, as against 8.2
per cent reported in the previous survey
(Table VII.3). The sectoral growth rate forecast for the agriculture sector was
revised marginally upwards from 4.0 per cent
to 4.1 per cent. For the services sector also the assessment was revised marginally
upwards from 9.0 per cent to 9.1 per cent.
For industry, the forecast remained
unchanged at 9.0 per cent.
Table VII.2 : Reserve Bank's Survey -Net Response on Expectations and Assessment about the Industrial Performance |
Parameter |
Optimistic Response |
Jul-Sept 2009 |
Oct-Dec 2009 |
Jan-Mar 2010 |
Apr-Jun 2010 |
July-Sep 2010 |
E |
A |
E |
A |
E |
A |
E |
A |
E |
1 |
2 |
3 |
4 |
5 |
6 |
7 |
8 |
9 |
10 |
11 |
1 Overall business situation |
Better |
24.2 |
26.3 |
39.8 |
36.0 |
44.9 |
43.1 |
41.2 |
40.7 |
41.5 |
2 Financial situation |
Better |
20.0 |
21.8 |
33.5 |
29.5 |
39.3 |
35.8 |
36.3 |
32.2 |
34.1 |
3 Working capital finance requirement |
Increase |
26.3 |
23.8 |
30.4 |
28.8 |
32.7 |
30.5 |
27.7 |
29.9 |
31.1 |
4 Availability of Finance |
Improve |
16.6 |
19.2 |
26.1 |
23.0 |
29.2 |
25.7 |
26.8 |
26.4 |
28.5 |
5 Cost of external finance |
Decrease |
|
|
|
-14.7 |
-18.3 |
-15.9 |
-20.6 |
-21.9 |
-23.3 |
6 Production |
Increase |
22.4 |
22.6 |
35.0 |
28.9 |
40.0 |
36.5 |
35.9 |
35.4 |
40.2 |
7 Order books |
Increase |
16.8 |
20.5 |
32.3 |
25.9 |
35.8 |
31.9 |
33.4 |
31.3 |
36.3 |
8 Pending orders, if applicable |
Below normal |
19.1 |
17.4 |
11.0 |
11.6 |
5.7 |
8.8 |
6.4 |
6.9 |
4.2 |
9 Cost of raw material |
Decrease |
-27.1 |
-41.7 |
-38.4 |
-47.1 |
-44.3 |
-60.2 |
-48.6 |
-62.7 |
-49.3 |
10 Inventory of raw material |
Below average |
-0.5 |
-2.1 |
-1.2 |
-4.2 |
-3.6 |
-5.8 |
-2.6 |
-5.0 |
-5.1 |
11 Inventory of finished goods |
Below average |
-1.8 |
-4.3 |
-3.7 |
-4.3 |
-1.9 |
-4.3 |
-2.6 |
-4.1 |
-5.0 |
12 Capacity utilisation (main product) |
Increase |
10.7 |
10.1 |
22.0 |
16.5 |
25.4 |
21.7 |
19.7 |
21.1 |
26.5 |
13 Level of capacity utilisation (compared to the average in the preceding four quarters) |
Above normal |
-12.1 |
-11.2 |
-3.8 |
-3.9 |
1.3 |
3.0 |
1.6 |
2.5 |
5.8 |
14 Assessment of the production capacity (with regard to expected demand in the next six months) |
More than adequate |
5.5 |
5.8 |
6.5 |
5.3 |
5.0 |
6.4 |
7.1 |
3.1 |
4.1 |
15 Employment in the company |
Increase |
1.5 |
4.1 |
8.8 |
10.3 |
12.1 |
13.7 |
13.6 |
14.7 |
16.8 |
16 Exports, if applicable |
Increase |
0.1 |
-2.9 |
12.5 |
9.2 |
20.2 |
12.7 |
18.5 |
15.3 |
20.7 |
17 Imports, if any |
Increase |
4.6 |
7.8 |
11.5 |
13.0 |
16.9 |
17.1 |
17.1 |
20.9 |
21.7 |
18 Selling prices are expected to |
Increase |
0.0 |
0.2 |
6.0 |
2.6 |
9.8 |
12.4 |
13.3 |
17.3 |
15.2 |
19 Increase in selling prices, if any, is expected |
Increase at lower rate |
-100.0 |
23.2 |
19.4 |
19.3 |
16.8 |
21.6 |
19.7 |
17.4 |
14.3 |
20 Profit margin |
Increase |
-13.4 |
-15.1 |
-2.8 |
-9.9 |
1.1 |
-2.9 |
3.2 |
-4.8 |
3.1 |
Note: 1. ‘Net response’ is measured as the percentage share differential between the companies reporting ‘optimistic’ (positive) and‘pessimistic’ (negative) responses; responses indicating status quo (no change) are not reckoned. Higher ‘net response’indicates higher level of confidence and vice versa.
2. E: Expectations and A: Assessment.
3. ‘Cost of external finance’ is a newly added question from the 48th (October – December 2009) survey round. |
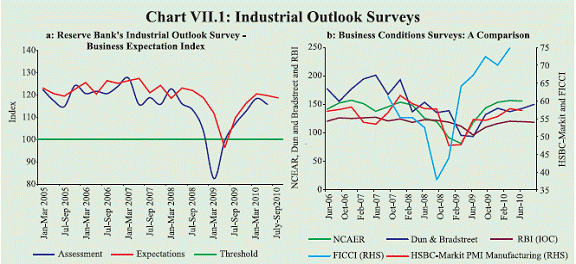
Table VII.3 : Median Forecasts of Select Macroeconomic Indicators by Professional Forecasters 2010-11 |
| |
Actual 2009-10 |
Annual Forecasts |
Quarterly Forecasts |
2010-11 |
2011-12 |
2011-12 |
2011-12 |
Q1 |
Q2 |
Q3 |
Q4 |
Q1 |
E |
L |
E |
L |
E |
L |
E |
L |
E |
L |
E |
L |
E |
L |
1 |
2 |
3 |
4 |
5 |
6 |
7 |
8 |
9 |
10 |
11 |
12 |
13 |
14 |
15 |
16 |
1. Real GDP growth rate at factor cost (in per cent) |
7.4 R |
8.2 |
8.4 |
– |
8.5 |
8.1 |
8.7 |
8.3 |
8.2 |
8.4 |
8.5 |
8.5 |
8.4 |
– |
8.3 |
a. Agriculture and Allied Activities |
0.2 R |
4.0 |
4.1 |
– |
3.0 |
2.9 |
2.7 |
3.8 |
4.0 |
5.7 |
6.0 |
4.3 |
3.9 |
– |
3.0 |
b. Industry |
10.4 R |
9.0 |
9.0 |
– |
9.1 |
10.6 |
11.6 |
9.3 |
9.3 |
9.0 |
8.7 |
8.5 |
8.4 |
– |
8.7 |
c. Services |
8.3 R |
9.0 |
9.1 |
– |
9.5 |
8.9 |
9.1 |
8.8 |
8.9 |
9.7 |
9.3 |
9.9 |
9.2 |
– |
9.5 |
2. Gross Domestic Saving (per cent of GDP at current market price) |
– |
35.3 |
34.7 |
– |
35.9 |
– |
– |
– |
– |
– |
– |
– |
– |
– |
– |
3. Gross Domestic Capital Formation (per cent of GDP at current market price) |
– |
38.0 |
36.0 |
– |
37.8 |
37.0 |
36.8 |
38.0 |
36.8 |
38.7 |
36.3 |
38.8 |
36.1 |
– |
37.3 |
4. Corporate profit after tax (growth rate in per cent)* |
28.8 |
20.0 |
22.5 |
– |
21.0 |
18.5 |
20.0 |
18.8 |
18.0 |
18.4 |
18.9 |
26.1 |
25.0 |
– |
25.0 |
5. Inflation WPI |
3.8 |
7.0 |
8.6 |
– |
6.0 |
9.5 |
10.4 |
8.0 |
9.5 |
6.7 |
8.1 |
5.7 |
7.0 |
– |
6.4 |
6. Exchange Rate (INR/US$ end period) |
45.1 |
44.0 |
44.5 |
– |
43.5 |
45.0 |
46.3 |
44.8 |
45.5 |
44.6 |
44.8 |
44.1 |
44.5 |
– |
43.8 |
7. T-Bill 91 days Yield (per cent-end period) |
4.4 |
5.3 |
5.2 |
– |
5.0 |
– |
– |
– |
– |
– |
– |
– |
– |
– |
– |
8. 10-year Govt. Securities Yield (per cent-end period) |
7.2 |
8.0 |
7.8 |
– |
7.5 |
– |
– |
– |
– |
– |
– |
– |
– |
– |
– |
9. Export (growth rate in per cent)! |
-4.7 P |
15.0 |
15.0 |
– |
16.0 |
– |
– |
– |
– |
– |
– |
– |
– |
– |
– |
10. Import (growth rate in per cent)! |
-8.2 P |
18.0 |
17.9 |
– |
15.0 |
– |
– |
– |
– |
– |
– |
– |
– |
– |
– |
11. Trade Balance (US$ billion) |
-102.1P |
– |
– |
– |
– |
-32.7 |
-32.8 |
-34.6 |
-34.5 |
-35.5 |
-36.5 |
-32.1 |
-33.0 |
– |
-35.9 |
E : Previous Round Projection. L : Latest Round Projection. R : Revised Estimate. P : Preliminary Estimate.
– : Not Available. * : BSE listed companies. ! : US$ on BoP basis.
Note : The latest round refers to twelfth round for the quarter ended June 2010, while previous round refers to eleventh round for the quarter ended
March 2010.
Source : Survey of Professional Forecasters, First Quarter 2010-11. |
Table VII.4 : Agencies' Forecast for 2010-11 |
Agency |
Latest Projection |
Earlier Projection |
Real GDP Growth (Per cent) |
Month |
Real GDP Growth (Per cent)
|
Month |
1 |
2 |
3 |
4 |
5 |
Economic Advisory Council to the PM |
8.5 |
July-10 |
8.2 |
Feb-10 |
Ministry of Finance |
8.5 (+/-0.25) |
Feb-10 |
.. |
.. |
IMF (calendar year) |
9.4 |
July-10 |
8.8 |
April-10 |
ADB |
8.2 |
July-10 |
8.2 |
April-10 |
NCAER |
8.1 |
April-10 |
.. |
.. |
OECD |
8.3 |
May-10 |
7.3 |
Nov-09 |
.. : Not available. |
Growth Projections of Different Agencies
VII.11 All available projections of real
GDP growth for 2010-11 are higher than
8 per cent. The IMF’s projected growth
figure for India may seem to be on the
higher side but it is not so as it is at
constant market prices. (Table VII.4 and
Box VII.1).
Factors Influencing the Current Growth
and Inflation Outlook
VII.12 The economic recovery witnessed
in 2009-10 after the slowdown in 2008-09
was mainly driven by a turnaround in the
industrial output, with continued resilience
of the services sector. The leading indicators
point to the prospect of robust growth in the
coming quarters and fast closing of the
output gap. An uncertain external
environment, however, is a major risk to
growth in the near term.
Box VII.1: GDP Growth at Factor Cost and Market Prices
The growth projections generated by different
agencies, both in India and outside reflect the
divergence in their assessments. The difference
in growth estimates across agencies provides a
broader perspective to the market, though at
times they may not be exactly comparable. While
most of the projected growth numbers, including
those released by the Reserve Bank are at factor
cost, the IMF’s recent projection for India’s
growth in 2010 is at market prices and also relates
to the calendar year. GDP growth at market prices
may differ significantly from GDP growth at
factor cost depending on the trend in “indirect taxes net of subsidies”. For example, GDP
growth at factor cost in 2008-09 at 6.7 per cent
was higher than GDP growth at market prices
(5.1 per cent). In contrast, GDP growth at factor
cost in 2009-10 was lower at 7.4 per cent as
compared with 7.7 per cent at market prices.
During the fourth quarter of 2009-10, the
difference was particularly high with GDP at
market prices growing at 11.2 per cent as against
the growth of 8.6 per cent at factor cost. The
IMF’s 9.4 per cent projected growth for the
calendar year 2010 factors in the turnaround in
taxes in January-March 2010.
VII.13 The growth outlook for the Indian
economy for 2010-11 remains positive on
account of the following factors: (a) prospect
of better kharif output than last year,
(b) buoyancy in the industrial sector,
notwithstanding the moderation in May
2010, (c) stronger growth in corporate sales
with higher profitability, (d) improving
business environment as per optimism
expressed in different surveys, (e) strong
growth in exports, notwithstanding
weakness in global conditions, (f) indications
of pick-up in private consumption demand,
as evident from trends in production of
consumer durables and non-durables as also
auto sales, (g) significant pick-up in
investment demand, (h) stronger growth in
lead indicators of services sector like tourist
arrivals, commercial vehicles production
and railway freight traffic, (i) a potentially
lower fiscal deficit due to the favourable
outcome of the 3G/ BWA spectrum
auctions, which could create greater space
for private sector investment, and
(j) significant acceleration in credit demand
from the private sector.
VII.14 Notwithstanding the upside
prospects, certain downside risks remain:
(a) as the export growth hinges on external
demand conditions, given the asymmetry
in growth outlook for advanced economies
and EMEs, sustaining high export growth
would be challenging, (b) real appreciation
of the exchange rate could also weaken
external price competitiveness of Indian
exports, (c) even though investment
demand accelerated sharply in Q4 of 2009-
10, it needs to be sustained to return to the
pre-global crisis trajectory, (d) while
private consumption demand has shown
signs of revival, sustenance of the trend is crucial, given the gradual phasing out of
the fiscal stimulus and the monetary exit,
and (e) the inflationary pressures, besides
affecting the cost structure through
demands for higher wages and increase in
input costs, could also depress demand.
VII.15 Headline inflation, which reached
10.6 per cent in June 2010, has been in
double digits for last five months and is also
increasingly getting generalised. Even
though recent upward revisions in
administered prices have added to inflation,
demand side pressures are also building up.
Going forward, factors which may exert
further upward pressure on inflation are:
(a) return of pricing power in step with the
pick-up in private demand and faster
closing of capacity utilisation gap may
add further pressure on investment demand,
(b) recent measures to align domestic fuel
prices with the international prices; while
the first round impact of the rise in fuel
prices is presently becoming evident, the
indirect impact would be felt with a lag,
(c) possible wage pressures, and (d) recent
increase in minimum support prices.
VII.16 Given these risks, the factors that
may help in restraining the inflationary
pressures include: (a) better kharif
production, thereby easing the supply side
constraints in agricultural production, (b)
indications of stable global commodity
prices, especially that of oil and food, and
(c) the impact of monetary policy actions
already initiated by the Reserve Bank to
contain inflation and anchor inflationary
expectations.
VII.17 An overall assessment suggests that
the GDP growth will be higher than 8 per
cent projected in the April 2010 Monetary Policy Statement, as the upside bias has
materialised. The major policy concern,
therefore, would be to contain the
inflationary pressures and anchor
inflationary expectations. The acceleration
in growth seen so far needs to become selfsustaining,
with durable pick-up in both
private consumption and investment
demand. Moreover, uncertainties in the external environment cannot be overlooked.
Hence, the calibrated approach to
normalisation of monetary policy continues
to be appropriate. Given the risk to inclusive
growth from high inflation, the monetary
unwinding that started in October 2009 should
continue till inflation expectations are firmly
anchored and inflation is brought down.
|