The headline inflation has remained in double digits since February 2010, with increasing
generalisation of price pressures over successive months. Food prices, the initial source
of inflationary pressure, though moderated somewhat, still remain high. What has been
particularly significant for the conduct of monetary policy is the manner in which nonfood
manufactured inflation accelerated from near zero in November 2009 to 7.3 per cent
by June 2010. Given the risks that high and persistent inflation could pose to the growth
momentum as well as to the progress on inclusive growth, timely initiation of monetary
policy measures to anchor inflation expectations and contain the inflation persistence has
become essential. This is reflected in the Reserve Bank’s calibrated normalisation of
monetary policy, since October 2009.
VI.1 In the second half of 2009-10, the
year-on-year WPI inflation increased
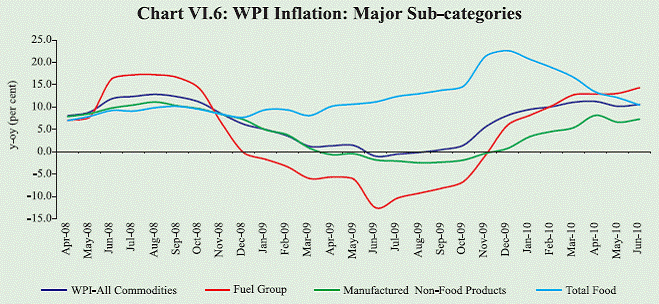
significantly and reached 11.0 per cent by
March 2010. What started as a supply side
pressure on inflation led by high food prices
in response to the deficient monsoon,
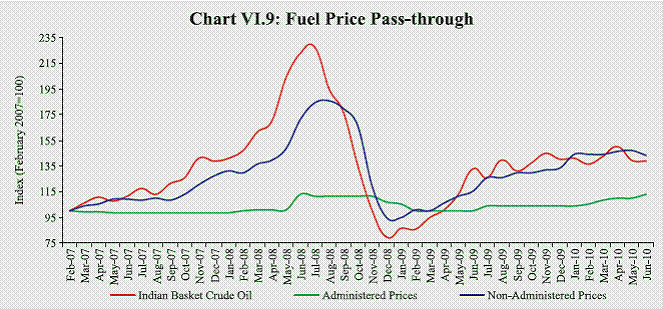
became increasingly more generalised. In
the first quarter of 2010-11, the headline
inflation remained elevated in double digits,
despite some moderation in prices of food
products. Manufactured non-food products
inflation further accelerated, indicating the
strengthening of demand side pressures on
inflation. Changes in administered prices
as well as upward revisions in price indices
that reflected lagged reporting of past price
increases, contributed significantly to the
increase in WPI in recent months. The
decision of the Government to increase the
prices of administered petroleum products
and allow full pass-through of global crude
price increases in the case of petrol in June
2010 is estimated to directly contribute
about 0.9 percentage point increase to the
WPI inflation immediately, apart from the
indirect impact with a lag. Moderation in
international commodity prices in recent
months, following the downside risks to global growth from the euro area fiscal
concerns, could ease some pressure on
inflation. With a stronger recovery and
consequent increasing demand side
pressures, containing inflation expectations
will remain as the highest priority for
monetary policy during 2010-11.
Global Inflation
VI.2 The global inflation environment
exhibited divergent trends, with the
advanced economies still facing the risk of
a possible deflation on the one hand and
the EMEs starting to face the build-up of
inflationary pressures on the other. Core
inflation in advanced economies continues
to remain subdued, indicating existence of
large spare capacity. Despite well anchored
inflation expectations, advanced economies
have witnessed gradual increase in headline
inflation since October/November 2009
from very low or negative levels during the
first half of 2009. This was mainly on
account of the waning of base effect of
sharp decline in commodity prices that was
recorded during the second half of 2008
(Chart VI.1 a).
VI.3 Year-on-year consumer price
inflation in OECD countries, which was
negative during the period June-September
2009, increased to 2.0 per cent in May 2010.
Core inflation (excluding food and energy)
remained stable at around 1.5 per cent since
June 2009, and declined to 1.3 per cent in
May 2010 indicating absence of any
pressure on inflation from the demand side.
Core inflation in the euro area had declined
in recent months, following the fiscal
turbulence. A weaker euro, however, is
expected to negate the possibility of a
deflationary situation, even when private
consumption demand remains relatively
weak.
VI.4 Emerging economies, on the other
hand, face risks to inflation from both
supply and demand sides. On the supply
side, the significant increases in
international commodity prices from their
historic low levels recorded in early 2009
exerted pressures on inflation,
notwithstanding the recent moderation in
international commodity prices. The
pressure from commodity price increase on inflation is more in the case of developing
countries as their consumption baskets have
larger shares of commodities, especially
food and oil, unlike the advanced
economies. As emerging economies
exhibited stronger recovery and faster
closing of output gap, risks to inflation from
the demand side have also started to
emerge. Moreover, stronger growth in
emerging economies could also lead to
further increases in demand for
commodities, specially oil and metals,
which in turn, could lead to additional
increases in their prices internationally.
Inflation in most of the emerging market
economies increased in recent months
(Chart VI.1b).
VI.5 Concerns over recession and the
subsequent fragile recovery were the major
factors guiding the monetary policy stance
adopted by most of the central banks in the
advanced economies during 2009-10.
Policy rates, accordingly, were left
unchanged at near zero levels. During the
second half of 2009-10, some inflationary
pressures started to emerge, particularly in economies which witnessed faster than
expected recovery and gradual closing of
the output gap. This led to exit from crisis
time easy monetary policy in those
countries. The Reserve Bank of Australia
and Bank of Israel have increased their
policy rates by 150 and 100 basis points,
respectively since September 2009. Greater
uncertainty about the recovery, particularly
since the escalation of fiscal concerns in
the euro area, made most central banks in advanced economies to delay the increase
in policy rates, except Bank of Canada
which has raised the policy rate by 50 basis
points since June 2010 (Table VI.1). Among
the emerging economies, Brazil, Korea and
Thailand have raised their policy rates since
April 2010, and China has raised the reserve
requirement ratio by a total of 150 basis
points since January 2010. China has also
taken measures to ease the overheating of
asset prices.
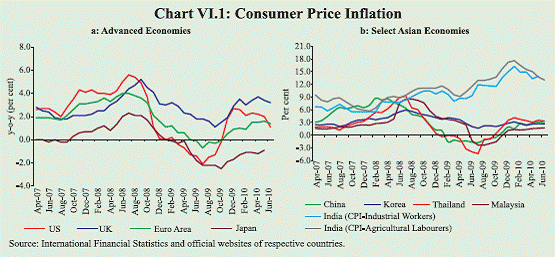
Table VI.1: Global Inflation Indicators |
(Per cent) |
Country/ Region |
Key Policy Rate |
Policy Rate |
(as on July 23, 2010) |
Changes in Policy Rates (basis points) |
CPI Inflation (y-o-y) |
Apr-09 - Aug-09 |
Since Sep-09 |
June 2009 |
June 2010 |
1 |
2 |
3 |
|
4 |
5 |
6 |
7 |
Developed Economies |
|
|
|
|
|
|
Australia |
Cash Rate |
4.50 |
(May 05, 2010) |
(-) 25 |
150 |
2.5 ^ |
2.9^ |
Canada |
Overnight Rate |
0.75 |
(Jul. 20, 2010) |
(-) 25 |
50 |
0.1* |
1.4* |
Euro area |
Interest Rate on Main Refinancing Operations |
1.00 |
(May 13, 2009) |
(-) 50 |
0 |
-0.1 |
1.4 |
Japan |
Uncollateralised Overnight Call Rate |
0.10 |
(Dec.19, 2008) |
0 |
0 |
-1.1* |
-0.9* |
UK |
Official Bank Rate |
0.50 |
(Mar. 05, 2009) |
0 |
0 |
1.8 |
3.2 |
US |
Federal Funds Rate |
0.00 to 0.25 |
(Dec.16, 2008) |
0 |
0 |
-1.4 |
1.1 |
Developing Economies |
|
|
|
|
|
Brazil |
Selic Rate |
10.25 |
(Jul. 22, 2010) |
(-) 250 |
200 |
4.8 |
4.8 |
India |
Reverse Repo Rate |
4.00 |
(Jul. 02, 2010) |
(-) 25 |
75 |
8.6* |
13.9* |
| |
Repo Rate |
5.50 |
(Jul. 02, 2010) |
(-) 25 |
75 |
|
|
| |
|
|
|
|
(100) |
|
|
China |
Benchmark 1-year Lending Rate |
5.31 |
(Dec 23, 2008) |
0 |
0 |
-1.7 |
2.9 |
| |
|
|
|
|
(150) |
|
|
Indonesia |
BI Rate |
6.50 |
(Aug. 05, 2009) |
(-) 125 |
0 |
3.7 |
5.0 |
Israel |
Key Rate |
1.50 |
(Apr. 01, 2010) |
(-) 25 |
100 |
3.6 |
2.4 |
Korea |
Base Rate |
2.25 |
(Jul. 09, 2010) |
0 |
25 |
2.0 |
2.6 |
Philippines |
Reverse Repo Rate |
4.00 |
(Jul. 09, 2009) |
(-) 75 |
0 |
1.5 |
3.9 |
Russia |
Refinancing Rate |
7.75 |
(Jun. 01, 2010) |
(-) 225 |
(-) 300 |
11.9 |
5.8 |
South Africa |
Repo Rate |
6.50 |
(Mar. 26, 2010) |
(-) 250 |
(-) 50 |
8.0* |
4.6* |
Thailand |
1-day Repurchase Rate |
1.50 |
(Jul. 14, 2010) |
(-) 25 |
25 |
-4.0 |
3.2 |
^ : Q1. *: May.
Note : 1. For India, data on inflation pertain to CPI for Industrial Workers.
2. Figures in parentheses in column (3) indicate the dates when the policy rates were last revised.
3. Figures in parentheses in column (5) indicate the variation in the cash reserve ratio during the period.
Source: International Monetary Fund, websites of respective central banks. |
Global Commodity Prices
VI.6 International commodity prices
started increasing in early 2009 and
rebounded ahead of the global recovery,
driven largely by the stronger growth
impulses in EMEs and expected increase
in demand, going forward (Chart VI.2).
Since April 2010, however, some decline
in commodity prices has been observed, as
concerns over euro area recovery and
sustainability of high growth in demand in
emerging economies spilled over to
commodity markets.
VI.7 Crude oil prices had increased by
about 70 per cent (year-on-year) in 2009-10.
International crude prices have been
volatile in recent months of 2010-11
tracking the uncertainties in global
recovery. Crude oil prices declined about
11 per cent during April-June 2010.
According to the World Bank, world crude
oil demand is projected to record a growth
of 1.9 per cent during 2010, with most of
the incremental demand coming from the developing economies. Ample surplus
capacity may, however, dampen any
sustained pressures on oil prices. The IMF’s
baseline projection for oil prices in 2010
has been revised downwards to US$ 75.3
per barrel in July 2010 from US$ 80 per
barrel in April 2010.
VI.8 Metal prices, which increased
significantly during 2009 on account of
strong demand, especially from China,
moderated in recent months. International
food prices, which were increasing
gradually in 2009, led by few crops like
sugar and coffee, declined in recent months.
The FAO Food Price Index, a measure of
the monthly change in international prices
of a food basket comprising cereals,
oilseeds, dairy, meat and sugar, increased
significantly up to January 2010, and has
declined since then by about 6.6 per cent
up to June 2010. Major agricultural markets
are expected to have sufficient supply
during 2010, which could keep prices
moderate over the medium-term.
Inflation Conditions in India
Wholesale Price Inflation
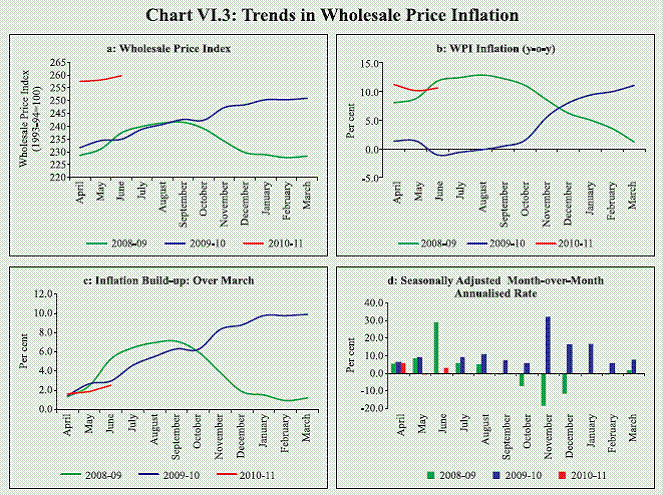
VI.9 WPI year-on-year inflation, which
remained moderate during April-May 2009
and subsequently turned negative during
June-August 2009, increased at a fast pace
to reach 11.0 per cent by March 2010 and
remains elevated since then (10.6 per cent
in June 2010) (Chart VI.3 a and b). The WPI
has exhibited sustained increase since
February 2009, indicating secular pressure
on prices (Chart VI.3 c). This is also
corroborated by positive month over month
seasonally adjusted annualised inflation
(Chart VI.3 d).
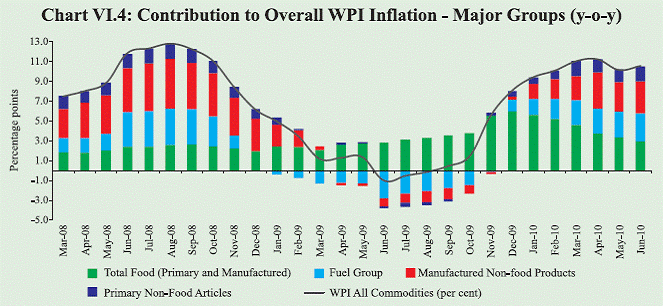
VI.10 The WPI inflation continues to
remain high at double digits since February
2010, though there have been shifts in the contributors and the relative strength of
each item in the WPI basket to inflation.
The contribution of food inflation to overall
inflation declined from above 100 per cent
in December 2009 to about 28 per cent in
June 2010. The contributions of the fuel
group and the non-food manufacturing
group increased with more or less equal
weighted contribution of each, suggesting
increasing generalisation of the inflationary
pressures (Chart VI.4).
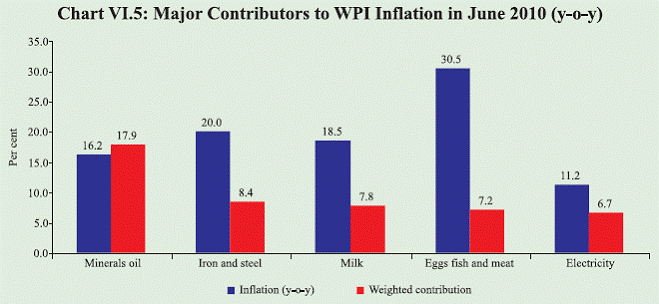
VI.11 The current inflationary pressures
initially originated from the supply side on
account of the shortfall in agricultural
production and gradually increasing
international commodity prices. With
increasing generalisation, the food items as
a key driver of inflation has now been
replaced by fuel and metals. Commodities like milk, egg, fish and meat continue to
have high inflation (Chart VI.5)
 VI.12 Divergence in inflation across
different sub-groups within the commodity
groups posed significant challenges in
assessing the underlying inflationary
pressures during 2009-10. Supply shock
dominated divergence should normally
remain temporary. Inflation across different
sub-groups, after witnessing considerable
divergence, have exhibited some
convergence in recent months. The decline
in food inflation (specially in manufactured food products, led by sugar) along with
increase in non-food inflation have led to
closing of the gaps between inflation across
different commodity groups (Chart VI.6).
VI.13 Inflation in essential commodities
group, which increased sharply during the
major part of 2009-10, has moderated since
January 2010 (Chart VI.7a).The y-o-y WPI
inflation, excluding food and fuel, though
increased significantly in recent months,
continues to remain below the headline
inflation. The trend of non-food non-fuel
inflation, a rough measure of core component, however, has moved in sync
with the headline inflation.
 VI.14 A major part of the increase in
inflation in recent months could be
attributed to a number of changes in
administered prices of several products.
With upward revision in administered
prices, the suppressed inflation became
more open, leading to increase in overall
inflation (Chart VI.8). Between November
2009 and June 2010, WPI has increased by
about 5.1 per cent, and changes in administered prices and lagged reporting of
earlier increases in prices have contributed
as much as 42 per cent of the increase in
WPI (Table VI.2). The full impact of the
revision in administered prices of petroleum
products effected in June 2010 will be
reflected largely in WPI for July 2010.
VI.15 Amongst the major groups, primary
articles inflation, y-o-y, has increased
significantly since October 2009, mainly on
account of food prices, which registered high
double-digit increase (Chart VI.7b). Some softening of inflation in primary articles is
visible in recent months reflecting the
seasonal moderation in prices of food
articles. The moderation in food inflation in
June 2010 partly reflected the base effect.
Primary articles inflation had increased
significantly in March 2010 as sugarcane
price index was revised upwards by about
50 per cent after keeping almost unchanged
for two years and thus reflected the effect of
lagged reporting of past increases in prices.
The y-o-y inflation in primary articles as on
July 10, 2010 was 16.5 per cent.
Table VI.2: Impact of Administered Price Changes Effected Since November 2009 on WPI Inflation |
Item |
Increase (in per cent) |
Contribution to WPI inflation in basis points |
1 |
2 |
3 |
LPG* |
6.5 |
17 |
Petrol* |
9.3 |
08 |
Diesel* |
10.3 |
40 |
Kerosene* |
8.9 |
09 |
Coal |
13.5 |
24 |
Electricity |
6.2 |
38 |
Fertiliser |
4.5 |
13 |
Impact of revision of sugarcane index |
50.6 |
63 |
Total Impact |
|
212 |
* : Includes impact of tax changes and partial impact of revision in prices
effected on June 25, 2010. |
VI.16 Year-on-year fuel group inflation
turned positive in December 2009 reflecting
the base effect of downward revision to
administered prices effected in December
2008. The reversal of customs and excise
duty concessions given on petroleum
products in the Union Budget for 2010-11,
as part of the fiscal exit, and increases in
taxes of petroleum products by certain state
governments, led to increases in
administered prices of petroleum products.
Freely priced products under the minerals
oil group usually track the trends in
international crude prices (Chart VI.9). A
significant gap in the administered prices
of petroleum products in relation to the
price of Indian basket crude oil (converted
to rupees at respective monthly average
exchange rates) increased the underrecoveries
of oil marketing companies and
the burden on the fiscal situation. As the
consumption growth of petroleum products
is also expected to pick-up with increase in
growth momentum, the fiscal burden could
have increased further, even with stable international prices. Motivated by fiscal as
well as fuel efficiency considerations, the
Government increased the price of diesel
(by Rs.2 per litre), PDS kerosene (by Rs.3
per litre) and domestic LPG (by Rs.35 per
cylinder) and deregulated petrol prices on
June 25, 2010. The direct impact of these
measures are expected to cause about 0.9
percentage point increase in WPI inflation,
with the indirect impact on prices through
input cost escalation with a lag likely to
raise the full impact to about 2 percentage
points, assuming partial pass-through. The
WPI inflation figures for June 2010 reflects
only part of the direct impact. As on July
10, 2010, the y-o-y fuel group inflation was
at 14.3 per cent.
 VI.17 Manufactured products inflation,
year-on-year, though remains lower than
food and fuel inflation, has increased since
August 2009 and was at 7.4 per cent in
March 2010, driven by inflation in
manufactured food products. Since then,
manufactured food inflation has declined
to 4.3 per cent in June 2010 from 15.5 per
cent in March 2010, led by lower inflation in sugar and decline in edible oil and oil
cakes prices. Manufactured non-food
products inflation, however, accelerated
from -0.4 per cent in November 2009 to 7.3
per cent in June 2010 (Table VI.3).
VI.18 Domestic price trends in several
commodities have been quite different
from corresponding international trends
(Table VI.4). Despite decline in inflation
in recent months in several food items
internationally, their prices have not come
down to levels that were prevailing in the
pre-global crisis period. This suggests why
import as an option for domestic price
control is still not available to India for
several essential items (Chart VI.10).
Consumer Price Inflation
VI.19 Inflation, as measured by various
consumer price indices, has exhibited some
moderation since January 2010 as food
price inflation witnessed some softening.
CPI inflation, however, remained high in
the range of 13.0-14.1 per cent during
May-June 2010 (Table VI.5).
Table VI.3 : Wholesale Price Inflation in India (Year-on-Year) |
(Per cent) |
Commodity |
Weight |
2009-10 (March) |
2010-11 (June) P |
Financial Year (over March 2010) |
Inflation |
C* |
Inflation |
C* |
Inflation |
C* |
1 |
2 |
3 |
4 |
5 |
6 |
7 |
8 |
All Commodities |
100.0 |
11.0 |
11.0 |
10.6 |
10.6 |
2.5 |
2.5 |
1. Primary Articles |
22.0 |
18.3 |
4.4 |
16.3 |
4.0 |
2.9 |
0.7 |
Food Articles |
15.4 |
17.4 |
2.9 |
14.6 |
2.5 |
3.1 |
0.5 |
i. Rice |
2.4 |
8.2 |
0.2 |
6.4 |
0.2 |
-0.2 |
0.0 |
ii. Wheat |
1.4 |
14.9 |
0.2 |
4.5 |
0.1 |
-7.2 |
-0.1 |
iii. Pulses |
0.6 |
31.3 |
0.2 |
32.6 |
0.2 |
7.2 |
0.1 |
iv. Vegetables |
1.5 |
2.6 |
0.0 |
0.0 |
0.0 |
51.7 |
0.6 |
v. Fruits |
1.5 |
17.2 |
0.3 |
10.9 |
0.2 |
-18.8 |
-0.1 |
vi. Milk |
4.4 |
17.7 |
0.8 |
18.5 |
0.8 |
2.9 |
0.1 |
vii. Eggs, Fish and Meat |
2.2 |
31.0 |
0.7 |
30.5 |
0.8 |
5.3 |
0.2 |
Non-Food Articles |
6.1 |
24.7 |
1.5 |
18.6 |
1.2 |
1.8 |
0.1 |
i. Raw Cotton |
1.4 |
18.3 |
0.2 |
16.3 |
0.2 |
4.4 |
0.1 |
ii. Oilseeds |
2.7 |
10.2 |
0.3 |
4.2 |
0.1 |
1.5 |
0.0 |
iii. Sugarcane |
1.3 |
53.2 |
0.7 |
53.2 |
0.7 |
0.0 |
0.0 |
Minerals |
0.5 |
1.3 |
0.0 |
28.5 |
0.3 |
5.7 |
0.1 |
2. Fuel, Power, Light and Lubricants |
14.2 |
12.7 |
2.5 |
14.3 |
2.8 |
3.5 |
0.7 |
i. Coal Mining |
1.8 |
13.5 |
0.3 |
13.5 |
0.3 |
0.0 |
0.0 |
ii Minerals Oil |
7.0 |
17.0 |
2.0 |
16.2 |
1.9 |
2.7 |
0.3 |
iii. Electricity |
5.5 |
4.7 |
0.3 |
11.2 |
0.7 |
6.2 |
0.4 |
3. Manufactured Products |
63.7 |
7.4 |
4.1 |
6.7 |
3.7 |
1.9 |
1.0 |
i. Food Products |
11.5 |
15.5 |
1.7 |
4.3 |
0.5 |
-3.7 |
-0.4 |
of which: Sugar |
3.6 |
44.6 |
1.3 |
18.4 |
0.6 |
-8.4 |
-0.3 |
Edible Oils |
2.8 |
-2.9 |
-0.1 |
-1.9 |
0.0 |
0.1 |
0.0 |
ii. Cotton Textiles |
4.2 |
16.8 |
0.5 |
18.8 |
0.6 |
4.5 |
0.2 |
iii. Man Made Fibres |
4.4 |
3.5 |
0.1 |
7.1 |
0.1 |
3.7 |
0.1 |
iv. Chemicals and Products |
11.9 |
8.0 |
0.9 |
5.8 |
0.7 |
3.1 |
0.3 |
of which : Fertilisers |
3.7 |
-4.7 |
-0.2 |
3.1 |
0.1 |
7.8 |
0.2 |
v. Non-Metallic Mineral Products |
2.5 |
2.0 |
0.0 |
-1.2 |
0.0 |
-1.6 |
0.0 |
of which: Cement |
1.7 |
-1.4 |
0.0 |
-5.8 |
-0.1 |
-2.6 |
0.0 |
vi. Basic Metals, Alloys and Metal Products |
8.3 |
2.4 |
0.2 |
12.1 |
1.1 |
8.8 |
0.8 |
of which: Iron and Steel |
3.6 |
4.2 |
0.2 |
20.0 |
0.9 |
14.4 |
0.6 |
vii. Machinery and Machine Tools |
8.4 |
3.2 |
0.2 |
3.9 |
0.2 |
0.4 |
0.0 |
of which: Electrical Machinery |
5.0 |
2.7 |
0.1 |
3.8 |
0.1 |
0.3 |
0.0 |
viii. Transport Equipment and Parts |
4.3 |
0.7 |
0.0 |
2.4 |
0.1 |
1.6 |
0.0 |
Memo: |
Food Items (Composite) |
26.9 |
16.6 |
4.6 |
10.4 |
3.0 |
0.4 |
0.1 |
Manufactured Non-food Products |
52.2 |
5.4 |
2.4 |
7.3 |
3.2 |
3.4 |
1.5 |
WPI Excluding Food |
73.1 |
8.9 |
6.5 |
10.6 |
7.6 |
3.4 |
2.4 |
WPI Excluding Fuel |
85.8 |
10.6 |
8.5 |
9.6 |
7.7 |
2.3 |
1.8 |
WPI Essential Commodities Group |
17.6 |
19.0 |
3.4 |
13.2 |
2.4 |
-0.3 |
-0.1 |
*: Contribution to inflation in percentage points. P: Provisional. |
Table VI.4 : International Commodity Prices |
Commodity |
Unit |
Market Price (2004) |
Index (2004=100) |
Variation (Per cent) |
2006 |
2007 |
2008 |
Mar-09 |
Mar-10 |
Jun-10 |
Jun-10 Over Jun-09 |
1 |
2 |
3 |
4 |
5 |
6 |
7 |
8 |
9 |
10 |
Energy |
|
|
|
|
|
|
|
|
|
Coal |
$/mt |
53 |
93 |
124 |
240 |
115 |
178 |
185 |
37.6 |
Crude oil |
$/bbl |
38 |
170 |
188 |
257 |
124 |
210 |
198 |
8.1 |
Non-Energy Commodities |
|
|
|
|
|
|
|
|
|
Palm oil |
$/mt |
471 |
101 |
165 |
201 |
127 |
177 |
169 |
9.9 |
Soybean oil |
$/mt |
616 |
97 |
143 |
204 |
118 |
149 |
139 |
-4.1 |
Soybeans |
$/mt |
307 |
88 |
125 |
171 |
124 |
133 |
133 |
-19.1 |
Rice |
$/mt |
238 |
128 |
137 |
274 |
247 |
211 |
185 |
-23.4 |
Wheat |
$/mt |
157 |
122 |
163 |
208 |
147 |
122 |
101 |
-38.6 |
Maize |
$/mt |
112 |
109 |
146 |
200 |
147 |
142 |
137 |
-14.9 |
Sugar |
c/kg |
16 |
206 |
141 |
178 |
187 |
260 |
222 |
-3.3 |
Cotton A Index |
c/kg |
137 |
93 |
102 |
115 |
83 |
139 |
146 |
47.7 |
Aluminium |
$/mt |
1716 |
150 |
154 |
150 |
78 |
129 |
113 |
22.7 |
Copper |
$/mt |
2866 |
235 |
248 |
243 |
131 |
260 |
227 |
29.6 |
Gold |
$/toz |
409 |
148 |
170 |
213 |
226 |
272 |
301 |
30.4 |
Silver |
c/toz |
669 |
173 |
200 |
224 |
196 |
256 |
277 |
26.4 |
Steel cold-rolled coil sheet |
$/mt |
607 |
114 |
107 |
159 |
148 |
128 |
140 |
21.4 |
Tin |
c/kg |
851 |
103 |
171 |
217 |
125 |
206 |
203 |
15.6 |
Zinc |
c/kg |
105 |
313 |
309 |
179 |
116 |
217 |
166 |
11.9 |
$: US dollar. c: US cent. kg: Kilogram. mt: metric tonne. toz: troy oz. bbl: Barrel.
Source: Based on World Bank's actual commodity price data. The year 2004 has been taken as the base to exhibit price trends over the relevant period. |
VI.20 The divergence between WPI and
CPI inflation reduced in recent months as
CPI inflation declined moderately in recent months while WPI inflation
increased significantly (Table VI.5 and
Chart VI.11).
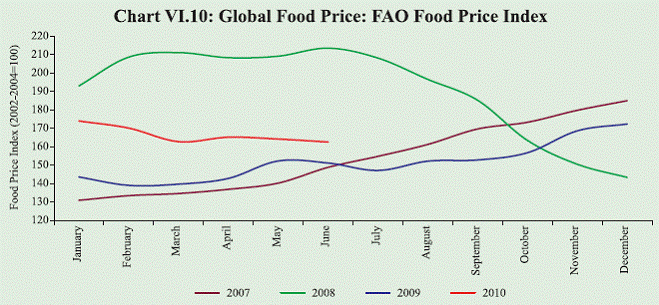
Table VI.5 : Consumer Price Inflation - Major Groups |
(Year-on-year variation in per cent) |
CPI Measure |
Weight |
Mar-08 |
Mar-09 |
Jun-09 |
Sep-09 |
Dec-09 |
Mar-10 |
Apr-10 |
May-10 |
June-10 |
1 |
2 |
3 |
4 |
5 |
6 |
7 |
8 |
9 |
10 |
11 |
CPI-IW (Base: 2001=100) |
General |
100.0 |
7.9 |
8.0 |
9.3 |
11.6 |
15.0 |
14.9 |
13.3 |
13.9 |
– |
Food Group |
46.2 |
9.3 |
10.6 |
12.2 |
13.5 |
21.3 |
16.0 |
14.5 |
13.6 |
– |
Pan, Supari etc. |
2.3 |
10.9 |
8.3 |
8.1 |
8.0 |
8.6 |
9.1 |
11.9 |
13.9 |
– |
Fuel and Light |
6.4 |
4.6 |
7.4 |
1.4 |
4.2 |
3.4 |
3.4 |
4.8 |
6.3 |
– |
Housing |
15.3 |
4.7 |
6.0 |
6.0 |
22.1 |
22.1 |
33.1 |
33.1 |
33.1 |
– |
Clothing, Bedding etc. |
6.6 |
2.6 |
5.0 |
4.1 |
4.1 |
4.1 |
4.0 |
4.8 |
4.0 |
– |
Miscellaneous |
23.3 |
6.3 |
7.4 |
6.6 |
5.7 |
4.2 |
4.8 |
5.5 |
4.8 |
– |
CPI-UNME (Base: 1984-85=100) |
General |
100.0 |
6.0 |
9.3 |
9.6 |
12.4 |
15.5 |
14.9 |
14.4 |
14.1 |
– |
Food Group |
47.1 |
7.8 |
12.2 |
13.6 |
14.4 |
21.4 |
16.3 |
14.8 |
14.0 |
– |
Fuel and Light |
5.5 |
4.6 |
5.9 |
1.3 |
4.2 |
3.5 |
3.3 |
4.8 |
6.3 |
– |
Housing |
16.4 |
4.0 |
5.8 |
6.0 |
22.0 |
22.0 |
33.2 |
33.2 |
33.2 |
– |
Clothing, Bedding etc. |
7.0 |
4.3 |
3.3 |
4.2 |
4.1 |
4.1 |
4.0 |
4.9 |
4.0 |
– |
Miscellaneous |
24.0 |
4.8 |
8.6 |
7.3 |
6.0 |
4.6 |
5.3 |
5.5 |
5.2 |
– |
CPI-AL (Base: 1986-87=100) |
General |
100.0 |
7.9 |
9.5 |
11.5 |
13.2 |
17.2 |
15.8 |
15.0 |
13.7 |
13.0 |
Food Group |
69.2 |
8.5 |
9.7 |
12.4 |
14.6 |
20.2 |
17.7 |
16.5 |
14.4 |
13.7 |
Pan, Supari etc. |
3.8 |
10.4 |
15.3 |
14.2 |
15.5 |
14.6 |
15.4 |
16.4 |
16.9 |
16.6 |
Fuel and Light |
8.4 |
8.0 |
11.5 |
11.0 |
12.0 |
14.3 |
15.2 |
16.0 |
16.6 |
15.5 |
Clothing, Bedding etc. |
7.0 |
1.8 |
7.4 |
8.3 |
8.1 |
8.2 |
9.1 |
9.2 |
9.4 |
9.6 |
Miscellaneous |
11.7 |
6.1 |
6.5 |
6.1 |
7.1 |
7.0 |
7.6 |
7.6 |
7.5 |
7.7 |
CPI-RL (Base: 1986-87=100) |
General |
100.0 |
7.6 |
9.7 |
11.3 |
13.0 |
17.0 |
15.5 |
15.0 |
13.7 |
13.0 |
Food Group |
66.8 |
8.2 |
10.0 |
12.4 |
14.6 |
20.4 |
17.7 |
16.7 |
14.6 |
13.9 |
Pan, Supari etc. |
3.7 |
10.6 |
15.0 |
14.1 |
15.4 |
14.4 |
15.5 |
16.5 |
17.0 |
16.7 |
Fuel and Light |
7.9 |
8.0 |
11.5 |
11.0 |
12.0 |
14.1 |
15.0 |
15.6 |
16.2 |
15.3 |
Clothing, Bedding etc. |
9.8 |
2.8 |
8.2 |
8.8 |
9.5 |
10.3 |
9.8 |
10.3 |
10.2 |
10.3 |
Miscellaneous |
11.9 |
6.2 |
6.7 |
6.2 |
6.9 |
6.6 |
7.2 |
7.4 |
7.3 |
7.3 |
Memo: |
WPI Inflation |
7.5 |
1.2 |
-1.0 |
0.5 |
8.1 |
11.0 |
11.2 |
10.2 |
10.6 |
GDP Deflator based Inflation* |
4.9 |
7.9 |
0.9 |
0.7 |
5.8 |
4.5 |
– |
– |
– |
*: Data for March pertain to full year.
IW : Industrial Workers. UNME : Urban Non-Manual Employees.
AL : Agricultural Labourers. RL : Rural Labourers. |
VI.21 Overall, the inflationary process,
which originated from supply shocks, has
now become generalised. Changes in
administered prices and lagged reporting of
past price increases have added force to the
uptrend in WPI in recent months. Given the
expected better kharif output than last year,
food price pressures may moderate during the course of the year. Non-food
manufactured products inflation, at 7.3 per
cent, is above the comfort level. Along with
the observed inflation persistence,
emerging demand pressures could add to
inflation expectations. Wage revisions to
offset the impact of inflation on purchasing
power, and use of higher mark ups with return of pricing power of firms, could
strengthen the interactions between
inflation expectations and actual inflation.
This suggests a need to continue the process
of normalisation of monetary policy to
anchor inflation expectations.
|