Risks to the global financial system increased in Q2 of 2010 in the wake of market concerns about fiscal sustainability in the Euro area and possible spillover to other parts of the world. Domestic financial markets functioned normally during Q1 of 2010-11 though there was some spillover from global volatility. While call money rates edged up due to tight liquidity conditions created by higher revenue inflows to the government, medium to longterm bond yields moderated because of expectations of lower fiscal deficit. Exchange rate of the Indian rupee exhibited some depreciation and equity prices remained mostly subdued, reflecting the impact of the global market trends and FII flows. Housing prices exhibited
moderate growth in Q4 of 2009-10.
V.1 The global financial markets witnessed greater volatility, drop in risk appetite and flight to safety during Q2 of 2010, reflecting rising fiscal sustainability concerns, weaker outlook for recovery than anticipated earlier and waning investor confidence. Domestic markets, particularly equity, exhibited spillover of global market volatility, notwithstanding the firmer domestic recovery in growth. Domestic fiscal concerns, which had impacted the government bond market in 2009-10 and kept pressure on the medium to long-term yield, remained contained in Q1 of 2010-11 because of the expectation of lower fiscal deficit resulting from larger realisations through 3G/BWA spectrum auctions. Sudden tightening of liquidity in the system in June 2010 exerted pressure on short-term interest rates, though the medium to longterm bond yields declined on receding
domestic fiscal risks.
International Financial Markets
V.2 Although global financial market conditions had improved during 2009 in terms of reduced risk spreads and higher
market activity, risks resurfaced towards the end of 2009 and intensified during the first
half of 2010. A series of events, starting
from debt default of Dubai World, the
Greek sovereign debt crisis, spreading of
contagion to Spain and other euro area
countries and weakening of market
confidence reflecting unresolved deeprooted
problems in the financial systems,
contributed to the significant volatility in
the global financial markets.
V.3 During Q2 of 2010, global financial markets turned highly volatile as fiscal problems of the euro area and other advanced economies and the risk of anaemic global growth, together led to significant deterioration in investor confidence. Deteriorating fiscal position across euro area continued to cause jitters in financial markets, despite transient stability instilled by the announcement of a significant European rescue package. These developments forced investors to
scale down their risk exposures.
V.4 The perception that unsustainable public debt of the advanced economies would weigh heavily on the global growth outlook, continues to unsettle equity
markets. The signs of growing stress and the fragility of the global financial system
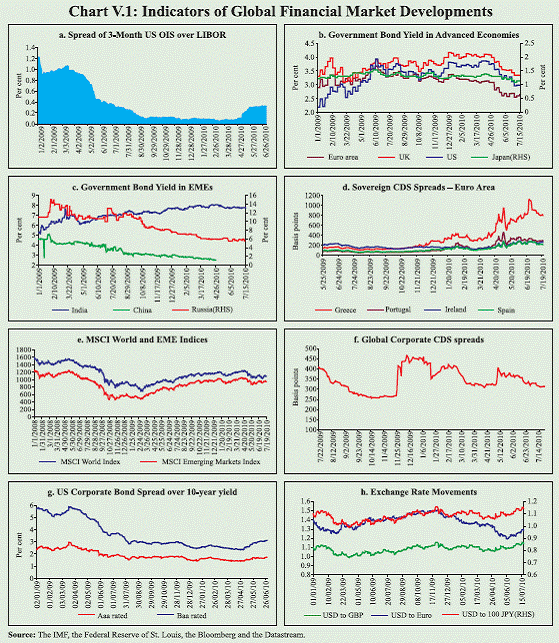
were evident in the rising Libor-OIS
spreads (Chart V.1a). Specific events, such
as growing geopolitical risk in the Korean
peninsula, the second sovereign downgrade
of Spain by the rating agencies, and
difficulties faced by the Spanish savings
banks, also weakened the market
confidence.
V.5 Investors, cautious about the rising and potential risks in the global financial system, reduced their exposure to risky assets. Consequently, there was flight to safe haven assets. This led to a significant fall in sovereign bond yields (Chart V.1b and c). At the same time, investors’ risk perception towards countries inflicted with fiscal problems remained high (Chart V.1d). In both the advanced and emerging market economies (EMEs) stock prices fell significantly and remained volatile (Chart V.1e). Corporate credit spreads, which had remained broadly stable after the Dubai World default, again widened (Charts V.1f and g). The fiscal problems and uncertainty about the growth outlook for the euro area also led to high volatility in currency markets with sharp depreciation of the Euro against other major currencies, though with some recovery in July 2010 (Chart V.1h). While the Euro depreciated against the US dollar, the EME currencies like Russian ruble, Turkish lira, Indian rupee, South Korean won, Argentine peso and Mexican peso came under depreciation pressure due to volatile capital flows and the general safe haven
flight to the US dollar (Table V.1).
V.6 Increased volatility in international
markets was rapidly transmitted to India and other EMEs through volatile capital
flows during Q2 of 2010. Reflecting the
impact of global market uncertainty, capital
inflows to India moderated, led by portfolio
flows. This, in turn, led to depreciation of
the rupee and moderation in stock prices.
Domestic Financial Markets
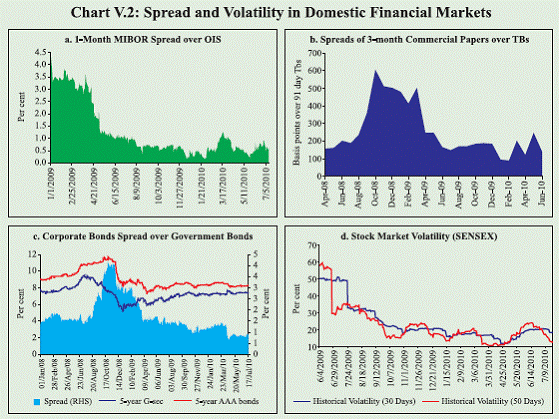
V.7 The concerns in domestic financial markets shifted from the large fiscal deficit and rising inflation in 2009-10 to escalated uncertainties in the global markets and the associated risks to global recovery in Q1 of 2010-11. Nevertheless, several segments of financial markets witnessed further recovery in trading volumes in Q1 of 2010-11, although marked by some increase in price volatility (Table V.2 and Chart V.2). Except for some increase in spread/volatility in certain segments, overall financial market conditions
remained stable.
Money Market
V.8 Liquidity conditions in the interbank market tightened significantly in June 2010, reflecting temporary withdrawal of liquidity from the banking system due to sharp increase in the Government’s one-off collections through 3G/BWA spectrum auction (about Rs.1,31,000 crore) besides the first installment of advance tax payments. Thus, call rate that had mostly remained around the lower bound of the informal LAF corridor up to May 2010, increased subsequently and hovered around the upper bound of the informal LAF corridor (Chart V.3). Responding to this
liquidity tightening, the Reserve Bank’s LAF window turned from reverse repo to
repo mode. In order to address the liquidity
pressures, additional liquidity support was
provided to scheduled commercial banks
under the LAF to the extent of 0.5 per cent
of their net demand and time liabilities
(NDTL). The Reserve Bank also conducted second LAF on a daily basis. These
measures helped overcome liquidity stress
in money markets and contain volatility in
call rates.
 V.9 Transaction volumes in the collateralised borrowing and lending obligation (CBLO) and market repo segments continued to remain high during Q1 of 2010-11 (Table V.3). As in the previous year, banks were the major borrowers in the collateralised segment and mutual funds (MFs) were the major lenders. The collateralised segment of the money market accounted for around 87 per cent of the total volume during Q1 of 2010-11.
Table V.1: Currency and Stock Price Movement in EMEs |
(Per cent) |
Items |
End-March 2009 @ |
End-March 2010 @ |
July 19, 2010* |
Items |
End-March 2009 @ |
End-March 2010 @ |
July 19, 2010* |
1 |
2 |
3 |
4 |
1 |
2 |
3 |
4 |
Appreciation (+)/Depreciation (-) of the US Dollar |
Stock Price Variations |
Japanese Yen |
-2.0 |
-4.9 |
-6.5 |
Indonesia (Jakarta Composite) |
-41.4 |
93.7 |
7.7 |
Chinese Yuan |
-2.6 |
-0.1 |
-0.8 |
Brazil (Bovespa) |
-32.9 |
71.9 |
-11.4 |
Russian Ruble |
44.3 |
-13.0 |
3.3 |
Thailand (SET Composite) |
-47.2 |
82.6 |
5.0 |
Turkish Lira |
27.7 |
-9.1 |
1.1 |
India (BSE Sensex) |
-37.9 |
80.5 |
2.4 |
Indian Rupee |
27.5 |
-11.4 |
3.7 |
South Korea (KOSPI) |
-29.2 |
40.3 |
2.7 |
Indonesian Rupiah |
25.6 |
-21.3 |
-0.7 |
China (Shanghai Composite) |
-31.7 |
31.0 |
-22.0 |
Malaysian Ringgit |
14.4 |
-10.3 |
-2.0 |
Taiwan (Taiwan Index) |
-39.2 |
52.0 |
-3.2 |
South Korea Won |
38.9 |
-17.8 |
6.5 |
Russia (RTS) |
-66.4 |
128.0 |
-11.6 |
Thai Baht |
12.8 |
-8.9 |
-0.1 |
Malaysia (KLSE) |
-30.1 |
51.3 |
1.2 |
Argentine Peso |
17.3 |
4.4 |
1.5 |
Singapore (Straits Times) |
-43.5 |
69.9 |
2.4 |
Brazilian Real |
31.2 |
-19.8 |
-1.5 |
|
|
|
|
Mexican Peso |
32.9 |
-12.3 |
3.9 |
|
|
|
|
@: Year-on-year variation. * Variation over End-March. Source: Bloomberg, IFS, IMF. |
Table V.2: Domestic Financial Markets at a Glance |
Year/ Month |
Call Money |
Govt. Securities Market |
Foreign Exchange Market |
Liquidity Management |
Stock Markets |
Daily Turn over (Rs. crore) |
Call Rates* (Per cent) |
Daily Turn over^ (Rs. Crore) |
10-Year Yield@ (Per cent) |
Daily Inter- bank Turnover (US$ mn) |
Exchange rate@ (Rs./ US$) |
RBI’s net FC purc hase (+)/ sale (-) |
MSS Out- stan ding# (Rs. crore) |
Aver age Daily LAF (Rs. crore) |
Daily BSE Turn over (Rs. crore) |
Daily NSE Turn over (Rs. crore) |
BSE Sensex** |
CNX Nifty** |
1 |
2 |
3 |
4 |
5 |
6 |
7 |
8 |
9 |
10 |
11 |
12 |
13 |
14 |
2008-09 |
22,436 |
7.06 |
10,879 |
7.54 |
34,812 |
45.92 |
-34,922† |
1,48,889 |
2,885 |
4,498 |
11,325 |
12303 |
3713 |
2009-10 |
15,924 |
3.24 |
14,426 |
7.23 |
30,107 |
44.95 |
-2,635† |
23,914 |
1,00,015 |
5,651 |
16,959 |
15585 |
4658 |
Apr-09 |
21,820 |
3.28 |
15,997 |
6.55 |
27,796 |
50.06 |
-2,487 |
75,146 |
1,01,561 |
5,232 |
15,688 |
10911 |
3360 |
May-09 |
19,037 |
3.17 |
14,585 |
6.41 |
32,227 |
48.53 |
-1,437 |
45,955 |
1,25,728 |
6,427 |
19,128 |
13046 |
3958 |
Jun-09 |
17,921 |
3.21 |
14,575 |
6.83 |
32,431 |
47.77 |
1,044 |
27,140 |
1,23,400 |
7,236 |
21,928 |
14782 |
4436 |
Jul-09 |
14,394 |
3.21 |
17,739 |
7.01 |
30,638 |
48.48 |
-55 |
22,159 |
1,30,891 |
6,043 |
18,528 |
14635 |
4343 |
Aug-09 |
15,137 |
3.22 |
9,699 |
7.18 |
27,306 |
48.34 |
181 |
19,804 |
1,28,275 |
5,825 |
17,379 |
14415 |
4571 |
Sep-09 |
16,118 |
3.31 |
16,988 |
7.25 |
27,824 |
48.44 |
80 |
18,773 |
1,21,083 |
6,211 |
18,253 |
16338 |
4859 |
Oct-09 |
15,776 |
3.17 |
12,567 |
7.33 |
28,402 |
46.72 |
75 |
18,773 |
1,01,675 |
5,700 |
18,148 |
16826 |
4994 |
Nov-09 |
13,516 |
3.19 |
17,281 |
7.33 |
27,599 |
46.57 |
-36 |
18,773 |
1,01,719 |
5,257 |
16,224 |
16684 |
4954 |
Dec-09 |
13,302 |
3.24 |
14,110 |
7.57 |
27,439 |
46.63 |
0 |
18,773 |
68,522 |
4,671 |
13,948 |
17090 |
5100 |
Jan-10 |
12,822 |
3.23 |
12,614 |
7.62 |
32,833 |
45.96 |
0 |
9,944 |
81,027 |
6,162 |
17,813 |
17260 |
5156 |
Feb-10 |
13,618 |
3.17 |
12,535 |
7.79 |
34,040 |
46.33 |
0 |
7,737 |
78,661 |
4,125 |
12,257 |
16184 |
4840 |
Mar-10 |
17,624 |
3.51 |
8,544 |
7.94 |
32,755 |
45.50 |
0 |
3,987 |
37,640 |
4,751 |
13,631 |
17303 |
5178 |
Apr-10 |
16,374 |
3.49 |
14,242 |
8.01 |
36,242 P |
44.50 |
0 |
2,737 |
57,150 |
4,696 |
13,828 |
19679 |
5295 |
May-10 |
16,786 |
3.83 |
24,225 |
7.56 |
39,997 P |
45.81 |
0 |
922 |
32,798 |
3,940 |
12,937 |
16845 |
5053 |
Jun-10 |
14,258 |
5.16 |
21,300 |
7.59 |
36,216 P |
46.57 |
.. |
317 |
-47,347 |
4,204 |
13,005 |
17300 |
5188 |
* : Average of daily weighted call money borrowing rates.
^: Average of daily outright turnover in Central Government dated securities.
@ : Average of closing rates. #: Average of weekly outstanding MSS. **: Average of daily closing indices.
†: Cumulative for the financial year. LAF : Liquidity Adjustment Facility. MSS: Market Stabilisation Scheme.
BSE: Bombay Stock Exchange Limited. NSE : National Stock Exchange of India Limited. P: Provisional. .. : Not available.
Note: In column 10, (-) indicates injection of liquidity, while (+) indicates absorption of liquidity. |
 V.10 The average certificates of deposit
(CD) issuance was placed around Rs.20,600
crore during this financial year (till July 2,
2010) so far, as compared with the average issuance of around Rs.16,700 crore during
2009-10. The volume in commercial paper
(CP) market picked up, as corporates
increasingly took recourse to CPs for
financing their working capital requirements,
which is evident from a significant rise in the
share of ‘manufacturing companies’ in the
outstanding amount of CPs (Table V.4). The
tightening of liquidity in money markets led
to some upward pressure on interest rates.
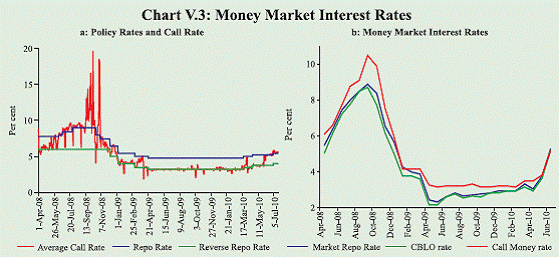
Table V.3: Activity in Money Market Segments |
(Rupees crore) |
Year/ Month |
Average Daily Volume (One Leg) |
Commercial Paper |
Certificates of Deposit |
Call |
Market Repo |
CBLO |
Total (2 to 4) |
Money Market Rate (%)* |
Term Money |
Outstanding |
WADR (%) |
Outstanding |
WADR (%) |
1 |
2 |
3 |
4 |
5 |
6 |
7 |
8 |
9 |
10 |
11 |
Apr-09 |
10,910 |
20,545 |
43,958 |
75,413 |
2.41 |
332 |
52,881 |
6.29 |
2,10,954 |
6.48 |
May-09 |
9,518 |
22,449 |
48,505 |
80,472 |
2.34 |
338 |
60,740 |
5.75 |
2,18,437 |
6.20 |
Jun-09 |
8,960 |
21,694 |
53,553 |
84,207 |
2.69 |
335 |
68,721 |
5.00 |
2,21,491 |
4.90 |
Jul-09 |
7,197 |
20,254 |
46,501 |
73,952 |
2.83 |
389 |
79,582 |
4.71 |
2,40,395 |
4.96 |
Aug-09 |
7,569 |
23,305 |
57,099 |
87,973 |
2.62 |
461 |
83,026 |
5.05 |
2,32,522 |
4.91 |
Sep-09 |
8,059 |
27,978 |
62,388 |
98,425 |
2.73 |
381 |
79,228 |
5.04 |
2,16,691 |
5.30 |
Oct-09 |
7,888 |
23,444 |
58,313 |
89,645 |
2.70 |
225 |
98,835 |
5.06 |
2,27,227 |
4.70 |
Nov-09 |
6,758 |
22,529 |
54,875 |
84,162 |
2.87 |
191 |
1,03,915 |
5.17 |
2,45,101 |
4.86 |
Dec-09 |
6,651 |
20,500 |
55,338 |
82,489 |
2.91 |
289 |
90,305 |
5.40 |
2,48,440 |
4.92 |
Jan-10 |
6,411 |
14,565 |
50,571 |
71,547 |
2.97 |
404 |
91,564 |
4.80 |
2,82,284 |
5.65 |
Feb-10 |
6,809 |
19,821 |
63,645 |
90,275 |
2.95 |
151 |
97,000 |
4.99 |
3,09,390 |
6.15 |
Mar-10 |
8,812 |
19,150 |
60,006 |
87,968 |
3.22 |
393 |
75,506 |
6.29 |
3,41,054 |
6.07 |
Apr-10 |
8,187 |
20,319 |
50,891 |
79,397 |
3.03 |
423 |
98,769 |
5.37 |
3,36,807 |
5.56 |
May-10 |
8,393 |
17,610 |
42,274 |
68,277 |
3.72 |
330 |
1,09,039 |
6.85 |
3,40,343 |
5.17 |
Jun10 |
7,129 |
9,481 |
31,113 |
47,723 |
5.22 |
447 |
99,792 |
6.82 |
3,21,589 |
6.37 |
CBLO: Collateralised Borrowing and Lending Obligation.
WADR: Weighted Average Discount Rate.
* : Weighted average rate of call, market repo and CBLO. |
Government Securities Market
V.11 The Reserve Bank continued with
the policy of front-loading of market
borrowings during the first half of 2010-11.
Accordingly, the Government would
complete a major part (about 63 per cent) of
the gross market borrowing programme for
2010-11 in the first half of the year so as to
limit any crowding-out concerns in the latter half of the year when the private credit
demand is normally strong (Table V.5). Due
to outflow of liquidity from the banking
system on account of 3G/BWA auctions and
rise in policy rates, there was an upward
movement in the primary market yields of
Treasury Bills except for 364-day T-bills
which showed a slight moderation initially
(Table V.6). The tightening liquidity
conditions were partially addressed by scaling
down the issuance of Treasury Bills in June
2010 from the planned Rs. 37,000 crore to
Rs. 15,000 crore. Further, the second quarter
auction calendar for T-Bills has planned for
a reduction in net issuance by Rs.24,000 crore.
The Government also bought back dated securities to the tune of Rs. 9,614 crore up to
July 20, 2010. The notified amount of dated
securities for July 2, 2010 auction was
lowered from the planned amount of
Rs.13,000 crore to Rs.10,000 crore. Cash
management bills of 28 and 35 days maturity
were also issued in May 2010.
Table V.4: Major Issuers of Commercial Paper |
(Rupees crore) |
End of Period |
Leasing and Finance |
Manufacturing |
Financial Institutions |
Total Outstanding |
Amount |
Share (%) |
Amount |
Share (%) |
Amount |
Share (%) |
1 |
2 |
3 |
4 |
5 |
6 |
7 |
8=(2+4+6) |
Mar-09 |
27,183 |
61.5 |
12,738 |
28.8 |
4,250 |
9.6 |
44,171 |
Jun-09 |
34,437 |
50.1 |
23,454 |
34.1 |
10,830 |
15.8 |
68,721 |
Sep-09 |
31,648 |
39.9 |
31,509 |
39.7 |
16,071 |
20.3 |
79,228 |
Dec-09 |
36,027 |
39.9 |
42,443 |
47.0 |
11,835 |
13.1 |
90,305 |
Mar-10 |
39,477 |
52.3 |
22,344 |
29.4 |
13,685 |
18.1 |
75,506 |
Jun-10 |
42,572 |
42.7 |
43,330 |
43.4 |
13,890 |
13.9 |
99,792 |
Table V.5: Issuances of Central and State Government Dated Securities |
| |
2008-09 |
2009-10 |
2009-10$ |
2010-11$ |
1 |
2 |
3 |
4 |
5 |
Central Government |
|
|
|
|
Gross amount raised (Rs. crore) |
2,61,000 |
4,18,000 |
1,62,000 |
1,51,000 |
Devolvement on Primary Dealers (Rs. crore) |
10,773 |
7,219 |
1,873 |
1,834 |
Bid-cover ratio (Range) |
1.2-4.5 |
1.4-4.3 |
1.52-3.51 |
1.39-3.87 |
Weighted average maturity (years) |
13.8 |
11.2 |
11.9 |
10.3 |
Weighted average yield (per cent) |
7.69 |
7.23 |
6.93 |
7.62 |
State Governments |
|
|
|
|
Gross amount raised (Rs. crore) |
1,18,138 |
1,31,122 |
20,266 |
23,322 |
Cut-off yield (per cent) |
5.80-9.90 |
7.04-8.58 |
7.04-7.89 |
8.05-8.58 |
Weighted average yield (per cent) |
7.87 |
8.11 |
7.52 |
8.31 |
$: Up to June 30. |
Table V.6 : Treasury Bills in the Primary Market |
Year/ Month |
Notified Amount (Rupees crore) |
Average Implicit Yield at Minimum Cut-off Price (Per cent) |
91-day |
182-day |
364-day |
1 |
2 |
3 |
4 |
5 |
2008-09 |
2,99,000 |
7.10 |
7.22 |
7.15 |
2009-10 |
3,80,000 |
3.57 |
4.00 |
4.37 |
2010-11 |
87,000 |
4.66 |
4.90 |
5.21 |
Apr-10 |
36,000 |
4.14 |
4.64 |
5.07 |
May-10 |
36,000 |
4.39 |
4.76 |
4.92 |
Jun-10 |
15,000 |
5.29 |
5.31 |
5.49 |
V.12 During Q1 of 2010-11, though short-term yields remained low till end- May due to surplus liquidity conditions, they hardened thereafter, reflecting the tightness in liquidity arising out of 3G/BWA auctions as well as quarterly advance tax payments. The yield at the longer end eased, presumably on expectations of improved fiscal position of the government because of higher than anticipated 3G/BWA auction revenues (Chart V.4). As fiscal deficit concerns for 2010-11 receded, the volume in government securities market improved in Q1 of 2010-11.
Credit Market
V.13 The spreads on corporate bonds over the government bond yield declined in Q1 of 2010-11 over the levels in Q4 of 2009-10, indicating further reduction in risk for corporates due to improved growth outlook (Chart V.2c).
V.14 Bank deposit rates have started moving upward, reflecting not only the competition for attracting deposits but also a change in the interest rate environment reflected in gradually rising policy rates (Table V.7). During Q1 of 2010-11, a few banks raised their deposits rates in the range of 75-100 basis points. On the lending side, the benchmark prime lending rates (BPLRs) of SCBs have remained unchanged since
July 2009. The switch over to the base rate system from July 1, 2010 is expected to bring about greater transparency in lending rates. The base rates announced by major public sector banks so far are in the narrow range of 7.25 per cent to 8.0 per cent.
Table V.7: Deposit and Lending Rates of Banks |
(Per cent) |
| |
Mar 09 |
Sep 09 |
Dec 09 |
Mar 10 |
Jun 10 |
1 |
2 |
3 |
4 |
5 |
6 |
1. Domestic Deposit Rate |
|
|
|
|
|
Public Sector Banks |
|
|
|
|
|
Up to 1 year |
2.75-8.50 |
1.00-7.00 |
1.00-6.25 |
1.00-6.50 |
1.00-6.25 |
> 1year-3 years |
8.25-9.25 |
6.50-8.00 |
6.00-7.25 |
6.00-7.25 |
6.00-7.25 |
> 3 years |
8.00-9.00 |
7.00-8.50 |
6.25-7.75 |
6.50-7.75 |
6.50-7.75 |
Private Sector Banks |
|
|
|
|
|
Up to 1 year |
2.50-9.25 |
2.00-7.50 |
2.00-6.75 |
2.00-6.50 |
2.00-6.50 |
> 1year-3 years |
7.25-9.25 |
6.00-8.75 |
5.25-7.50 |
5.25-7.75 |
6.25-7.50 |
> 3 years |
7.25-9.75 |
6.00-9.00 |
5.75-8.00 |
5.75-8.00 |
6.50-8.00 |
Foreign Banks |
|
|
|
|
|
Up to 1 year |
2.25-9.25 |
1.80-8.00 |
1.25-7.00 |
1.25-7.00 |
1.25-7.00 |
> 1year-3 years |
3.50-9.75 |
2.25-8.50 |
2.25-7.75 |
2.25-8.00 |
3.00-8.00 |
> 3 years |
3.60-9.50 |
2.25-9.50 |
2.25-8.50 |
2.25-8.75 |
3.00-8.50 |
2. BPLR |
|
|
|
|
|
1. Public Sector Banks |
12.25-13.50 |
11.00-13.50 |
11.00-13.50 |
11.00-13.50 |
11.00-13.50 |
2. Private Sector Banks |
13.00-16.50 |
12.50-16.75 |
12.50-16.75 |
12.50-16.75 |
12.50-16.75 |
3. Foreign Banks |
10.00-15.50 |
10.50-16.00 |
10.50-16.00 |
10.50-16.00 |
10.50-16.00 |
3. Actual Lending Rate* |
|
|
|
|
|
1. Public Sector Banks |
4.00-17.75 |
3.50-17.50 |
3.25-18.00 |
3.25-18.00 |
|
2. Private Sector Banks |
4.00-24.00 |
4.10-26.00 |
3.50-25.84 |
3.00-28.00 |
|
3. Foreign Banks |
5.00-28.00 |
2.76-25.50 |
3.50-22.00 |
3.60-23.00 |
|
* : Interest rate on non-export demand and term loans above Rs. 2 lakh excluding lending rates at the extreme five per cent on both sides. |
Foreign Exchange Market
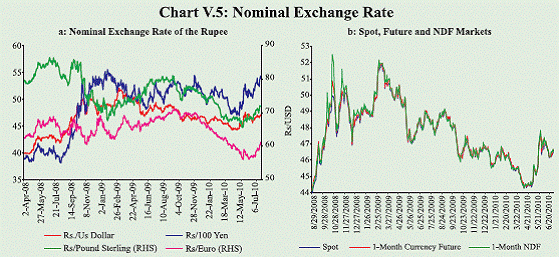
V.15 The Indian rupee exhibited greater two-way movement against the US dollar during Q1 of 2009-10. The rupee strengthened against the US dollar in April 2010 on the back of capital inflows and positive growth outlook. Subsequently, with the signs of the euro area debt crisis spreading further and the US dollar strengthening against most currencies, and withdrawal of funds by the FIIs, the rupee came under depreciation pressure (Chart V.5a). The exchange rates in the non-deliverable forward market (NDF), the currency future market and the spot market have exhibited similar pattern (Chart V.5b).
 V.16 Increased volatility in the foreign exchange market resulted alongside increase in turnover in the spot, forward and futures markets (Chart V.6a and b). The rupee-dollar futures continued to dominate the currency futures segments in the exchanges, accounting for about 90 per cent of the total notional values. The higher trading volumes, particularly in the futures market, have coincided with the increased volatility in the spot exchange rate.
Equity and Housing Markets
V.17 The sustained growth in equity prices that was witnessed in 2009-10, exhibited some correction in Q1 of 2010-11, mainly due to transmission of shocks from global markets (Table V.8), though there has been some recovery in July 2010.
V.18 The activity in the primary segment of the domestic capital market displayed signs of revival in Q1 of 2010-11. Resources raised
through public issues increased considerably (Table V.9). The resource mobilisation by mutual funds was, however, lower due to tight liquidity conditions and subdued stock markets. During 2009-10, mobilisation of resources by corporates through private placement (Rs.3,42,445 crore) was higher by 67.8 per cent.
V.19 Stock prices remained subdued during most part of Q1 of 2010-11 due to concerns regarding adverse global developments (Chart V.7a). While FII investments remained volatile, mutual funds turned net sellers due to increased market uncertainties. With increasing uncertainties and corrections in domestic stock prices, derivatives segment exhibited significant expansion in volumes (Chart V.7b).
Table V.8: Key Stock Market Indicators |
Indicator |
BSE |
NSE |
2008-09 |
2009-10 |
2009-10 (Apr- Jun) |
2010-11 (Apr- Jun) |
2008-09 |
2009-10 |
2009-10 (Apr-Jun) |
2010-11 (Apr-Jun) |
1 |
2 |
3 |
4 |
5 |
6 |
7 |
8 |
9 |
1. |
BSE Sensex/S&PCNX Nifty |
|
|
|
|
|
|
|
|
| |
(i) End-period |
9709 |
17528 |
14494 |
16945 |
3021 |
5249 |
4291 |
5313 |
| |
(ii) Average |
12366 |
15585 |
13078 |
17268 |
3731 |
4658 |
3964 |
5177 |
2. |
Coefficient of Variation |
24.2 |
11.9 |
13.1 |
2.8 |
23.2 |
11.3 |
12.3 |
2.7 |
3. |
Price-Earning Ratio (end-period)* |
13.7 |
21.3 |
19.0 |
21.1 |
14.3 |
22.3 |
20.0 |
22.3 |
4. |
Price-Book Value Ratio |
2.7 |
3.9 |
3.5 |
3.4 |
2.5 |
3.7 |
3.6 |
3.8 |
5. |
Market Capitalisation to GDP Ratio (per cent) |
59.0 |
106.5 |
92.2 |
82.0 |
55.4 |
103.8 |
89.8 |
76.5 |
*: Based on 30 scrips included in the BSE Sensex and 50 scrips included in the S&P CNX Nifty.
@: As at end-period.
Source: Bombay Stock Exchange Ltd. (BSE) and National Stock Exchange of India Ltd. (NSE). |
V.20 A sustained and rapid rise in
housing prices over successive quarters
remains an area of concern from the
standpoint of their possible spillover to
demand pressures and the general price level as well as financial stability
(Table V.10 and Chart V.8). During Q4 of
2009-10, however, housing prices
displayed subdued momentum in several
cities, which could be attributed to
concerns of high valuations and the
volatile stock market.
Table V.9: Resource Mobilisation from Capital Market |
(Rupees crore) |
Category |
2008-09 (Apr-Mar) |
2009-10 (Apr-Mar) |
2009-10 (Apr-Jun) |
2010-11 (Apr- Jun) |
1 |
2 |
3 |
4 |
5 |
A. Prospectus and Rights Issues* |
14,671 |
32,607 |
236 |
7,737 |
1. Private Sector (a+b) |
14,671 |
25,479 |
236 |
7,737 |
a) Financial |
466 |
326 |
– |
2,550 |
b) Non-financial |
14,205 |
25,153 |
236 |
5,187 |
2. Public Sector |
– |
7,128 |
– |
– |
B. Euro Issues |
4,788 |
15,967 |
215 |
4,844 |
C. Mutual Fund Mobilisation (net)@ |
-28,296 |
83,080 |
1,00,403 |
3,547 |
1. Private Sector |
-34,017 |
54,928 |
81,456 |
14,109 |
2. Public Sector # |
5,721 |
28,152 |
18,947 |
-10,562 |
*: Excluding offer for sale @: Net of redemptions. #: Including UTI Mutual fund.
Note: Data exclude funds mobilised under Fund of Funds Schemes.
Source: Mutual Fund data are sourced from Securities and Exchange Board of India. |
V.21 Despite increasing global market
uncertainties emanating from the euro area
fiscal sustainability concerns, domestic markets functioned normally, though with
higher volatility in some segments.
Domestic equity prices moderated, though
with some recovery in the recent period.
The exchange rate showed greater twoway
movement partly reflecting rising
pressure on the euro and volatility in FII
flows. Domestic money markets faced
liquidity pressures, leading to hardening
of short-term money market rates. Responding to these developments, the
Reserve Bank initiated temporary liquidity
facilities that helped contain inter-bank
call rates around the ceiling of the LAF
corridor. Medium to long-term yields,
however, moderated on expectations of
lower fiscal deficit of the Government and
the general safe haven appeal of
government bonds globally. The market
activities in various segments improved
and the primary segment of the domestic
capital market exhibited larger
mobilisation of resources.
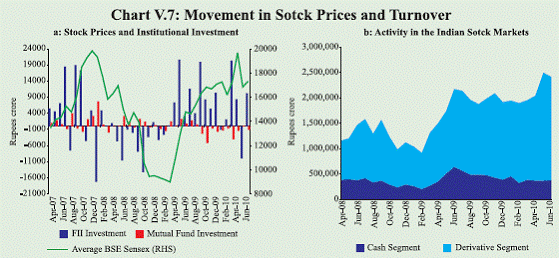
Table V.10: House Price Index (Base=Q4: 2008-09)* |
(Per cent) |
Quarter |
Bangalore |
Ahmedabad |
Delhi# |
Mumbai# |
Index |
Price Change (Q-on-Q) |
Index |
Price Change (Q-on-Q) |
Index |
Price Change (Q-on-Q) |
Index |
Price Change (Q-on-Q) |
1 |
2 |
3 |
4 |
5 |
6 |
7 |
8 |
9 |
Q4: 2008-09 |
100.0 |
– |
100.0 |
– |
100.0 |
– |
100.0 |
– |
Q1: 2009-10 |
103.6 |
3.6 |
101.4 |
1.4 |
101.9 |
1.9 |
116.0 |
16.0 |
Q2: 2009-10 |
101.7 |
-1.9 |
104.2 |
2.7 |
103.2 |
1.3 |
131.0 |
12.9 |
Q3: 2009-10 |
100.8 |
-0.9 |
117.3 |
12.6 |
107.4 |
4.1 |
135.1 |
3.1 |
Q4: 2009-10 |
98.5 |
-2.3 |
124.3 |
5.9 |
136.4 |
27.0 |
136.4 |
1.0 |
* : Based on weights obtained from number of transactions
# : Delhi and Mumbai indices are shifted to common base.
Source: Department of Registration and Stamps of the respective State Governments. |
|