Reflecting the calibrated monetary exit, the magnitude of the surplus liquidity in the
system moderated gradually. In June 2010, however, there was a severe tightness in
liquidity caused by the increase in Government's surplus balances with the Reserve
Bank due to sharply higher mobilisation under 3G and BWA spectrum auctions. The
liquidity situation was effectively managed by the Reserve Bank, which helped avoid
spillover to overall term structure of the interest rate. During the first quarter of 2010-11,
credit growth to the private sector picked up further reflecting strong recovery as also
payments towards 3G and BWA spectrum. Broad money growth, however, was lower due
to slowdown in the growth of deposits.
IV.1 The Reserve Bank has been
normalising the monetary policy instruments,
i.e., the policy rates and the cash reserve ratio
(CRR), since the fourth quarter of 2009-10,
through a process of calibrated exit from the
accommodative monetary policy stance that it
had adopted in response to the global crisis. The
CRR hikes effected since February 2010 helped
in reducing the excess liquidity in the system.
The comfortable liquidity situation turned into
a deficit fairly rapidly by end-May 2010 due to
an increase in currency with the public and
build-up of government cash balances.
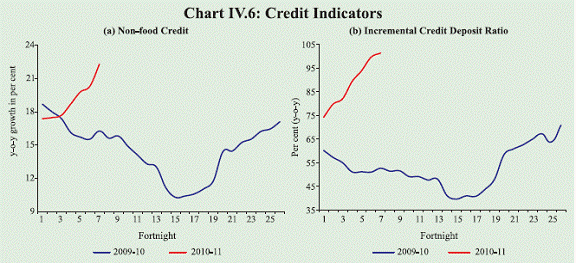
IV.2 Non-food credit growth of scheduled
commercial banks (SCBs) showed acceleration and by the first quarter of 2010-11 crossed
the indicative growth trajectory of 20.0 per
cent for the year, as set out in the Monetary
Policy Statement for 2010-11. Besides
strong economic activity, credit raised by
telecom companies to pay for the 3G and
broadband wireless access (BWA) spectrum
contributed to the high rate of credit growth
observed during the quarter. Money supply
(M3) growth, however, was below the
indicative trajectory of 17.0 per cent, set
out in April 2010. The deceleration was
largely on account of the slowdown in the
growth rate of aggregate deposits with
banks (Table IV.1).
Table IV.1: Monetary Indicators |
(Amount in Rupees crore) |
Item |
Outst anding
as on
July 2, 2010 |
Variation (year-on-year) |
2009-10 |
2010-11 |
Amount |
Per cent |
Amount |
Per cent |
1 |
2 |
3 |
4 |
5 |
6 |
I. |
Reserve Money*
(Reserve Money adjusted for CRR changes) |
11,73,831 |
-6,963 |
-0.7 |
2,28,880 |
24.2 |
| |
|
(15.9) |
|
(18.5) |
II. |
Broad Money (M3) |
57,82,141 |
8,56,523 |
20.6 |
7,69,448 |
15.3 |
III. |
Aggregate Deposits of SCBs |
46,32,703 |
7,26,938 |
22.0 |
6,01,737 |
14.9 |
IV. |
Non-food Credit of SCBs |
33,47,939 |
3,83,015 |
16.3 |
6,10,046 |
22.3 |
*: Data pertain to July 16, 2010.
Note: Data are provisional. |
Liquidity Management
IV.3 The liquidity conditions changed
significantly during the first quarter of
2010-11. The gradual moderation in the
volume of surplus liquidity in the system since
February 2010 reflected the calibrated
normalisation of the monetary policy by the
Reserve Bank. Accordingly, the liquidity
adjustment facility (LAF) remained in the
absorption mode, though the reverse repo
volumes declined gradually (Chart IV.1).
From end-May 2010, there was a sudden and
sharp tightening of liquidity, which was
reflected in the reversal of LAF to injection
mode. The liquidity tightness was caused by
the large increase in government’s cash
balances with the Reserve Bank, reflecting
proceeds from 3G/BWA spectrum auctions,
besides the first instalment of advance tax
payments.
IV.4 In terms of specific aspects of the
evolution of liquidity conditions, the scale of
surplus liquidity in the system increased
initially at the commencement of the financial year 2010-11 on account of higher government
expenditure. The average daily absorption
under the LAF increased to Rs.57,150 crore
in April 2010 from Rs.37,640 crore in March
2010. With the recovery of the economy firmly
in place, the Reserve Bank moved in a
calibrated manner in the direction of
normalising its policy instruments. To anchor
inflation and to prevent further build up of
inflationary pressure, the Reserve Bank
increased the repo and reverse repo rates as
well as the CRR by 25 basis points each in
April 2010 in the Annual Monetary Policy for
2010-11 (Table IV.2). The surplus liquidity in
the domestic market gradually declined
thereafter. The Reserve Bank auctioned cash
management bills in May 2010 (which matured
in mid-June 2010) to meet the temporary cash
flow mismatches of the government. The
liquidity conditions, however, changed to
injection mode from May 31, 2010 due to sharp
increase in government balances with the
Reserve Bank, on account of higher than
anticipated mobilisation under 3G/BWA
spectrum auctions.
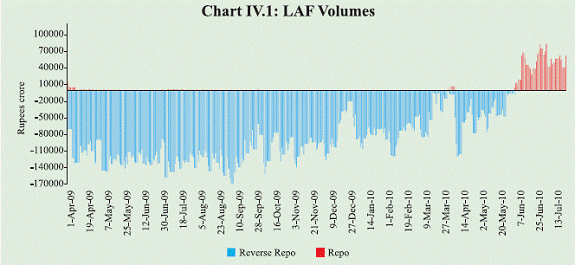
Table IV.2: Movements in Key Policy Rates in India |
(Per cent) |
Effective since |
Reverse Repo
Rate |
Repo Rate |
Cash Reserve
Ratio |
1 |
2 |
3 |
4 |
April 26, 2008 |
6.00 |
7.75 |
7.75 (+0.25) |
May 10, 2008 |
6.00 |
7.75 |
8.00 (+0.25) |
May 24, 2008 |
6.00 |
7.75 |
8.25 (+0.25) |
June 12, 2008 |
6.00 |
8.00 (+0.25) |
8.25 |
June 25, 2008 |
6.00 |
8.50 (+0.50) |
8.25 |
July 5, 2008 |
6.00 |
8.50 |
8.50 (+0.25) |
July 19, 2008 |
6.00 |
8.50 |
8.75 (+0.25) |
July 30, 2008 |
6.00 |
9.00 (+0.50) |
8.75 |
August 30, 2008 |
6.00 |
9.00 |
9.00 (+0.25) |
October 11, 2008 |
6.00 |
9.00 |
6.50 (–2.50) |
October 20, 2008 |
6.00 |
8.00 (–1.00) |
6.50 |
October 25, 2008 |
6.00 |
8.00 |
6.00 (–0.50) |
November 3, 2008 |
6.00 |
7.50 (–0.50) |
6.00 |
November 8, 2008 |
6.00 |
7.50 |
5.50 (–0.50) |
December 8, 2008 |
5.00 (-1.00) |
6.50 (–1.00) |
5.50 |
January 5, 2009 |
4.00 (-1.00) |
5.50 (–1.00) |
5.50 |
January 17, 2009 |
4.00 |
5.50 |
5.00 (–0.50) |
March 4, 2009 |
3.50 (-0.50) |
5.00 (-0.50) |
5.00 |
April 21, 2009 |
3.25 (-0.25) |
4.75 (-0.25) |
5.00 |
February 13, 2010 |
3.25 |
4.75 |
5.50 (+0.50) |
February 27, 2010 |
3.25 |
4.75 |
5.75 (+0.25) |
March 19, 2010 |
3.50 (+0.25) |
5.00(+0.25) |
5.75 |
April 20, 2010 |
3.75 (+0.25) |
5.25 (+0.25) |
5.75 |
April 24, 2010 |
3.75 |
5.25 |
6.00 (+0.25) |
July 2, 2010 |
4.0 (+0.25) |
5.50 (+0.25) |
6.00 |
Note : 1. Reverse repo indicates absorption of liquidity and repo indicates injection of liquidity.
2. Figures in parentheses indicate change in policy rates in
per cent. |
IV.5 In anticipation of temporary tightening
of liquidity conditions, the Reserve Bank
introduced measures allowing SCBs to avail
additional liquidity support under the LAF to
the extent of up to 0.5 per cent of their NDTL
and also access to second LAF on a daily basis
for the period May 28-July 2, 2010. The
average daily injection under the LAF during
June 2010 was around Rs.47,000 crore in
contrast to the average daily absorption of
around Rs.33,000 crore in May 2010.
Consequently, the call rate moved up
significantly, resulting in an effective tightening at the short end of the yield curve.
The call rate, however, remained around the
ceiling of the LAF corridor set by the repo rate.
IV.6 Overall, increase in currency with the
public and centre’s surplus balances with the
Reserve Bank, both representing withdrawal
of liquidity from the system, were the key
drivers of autonomous liquidity in Q1 of
2010-11 (Table IV.3). Due to the increase in
CRR, there was an additional withdrawal of
liquidity, over and above the autonomous
impact. The liquidity situation was managed
primarily through LAF by injecting liquidity
through repo operations (Table IV.4).
IV.7 Excess SLR investments of SCBs
amounted to Rs.1,87,705 crore, as on July 2,
2010, compared with Rs.2,85,491 crore a year
ago. Adjusted for LAF collateral securities on
an outstanding basis, given the repo mode of
the LAF, SCBs’ maintenance of SLR was 29.6
per cent of NDTL, an excess of 4.6 percentage
points over the prescribed SLR (Chart IV.2).
The banking system has used a part of the
excess SLR securities to access liquidity from
the Reserve Bank through repo, and the large
availability of excess SLR securities should
help in avoiding spillover of tight temporary
liquidity conditions to the term structure of the
interest rate. Debt buy-back conducted in June
2010 and cancellation of Treasury Bill auctions
in June and July 2010, also helped to an extent
in alleviating the liquidity pressure.
IV.8 On July 2, 2010, the repo and reverse
repo rates were further raised by 25 basis points
each to 5.5 per cent and 4.0 per cent,
respectively, on account of developments on
the inflation front, given that the upside bias
to growth projection that was highlighted in
the Annual Monetary Policy had materialised.
The liquidity management measures, introduced earlier on an ad hoc basis were also
extended up to July 16, 2010. It was clarified
that the temporary measures to ease the
liquidity pressures were consistent with the
overall calibrated monetary exit, which aimed
at containing inflation and anchoring inflation
expectations without hurting growth. On an
assessment of the prevailing overall liquidity
conditions and with a view to providing flexibility to SCBs and primary dealers in their
liquidity management, the Reserve Bank
further extended the second LAF on a daily
basis till July 30, 2010. The deficit liquidity
conditions have continued in July 2010 so far,
and the average daily injection of liquidity
during the first three weeks of the month was
around Rs.53,000 crore.
Table IV.3 : Reserve Bank’s Liquidity Management Operations |
(Rupees crore) |
Item |
2009-10 |
2010-11 |
Q1 |
Q2 |
Q3 |
Q4 |
Q1 |
1 |
2 |
3 |
4 |
5 |
6 |
A. Drivers of Liquidity (1+2+3+4) |
-45,110 |
-44,514 |
-66,785 |
55,055 |
-1,05,206 |
1. RBI’s net purchase from authorised dealers |
-15,874 |
2,523 |
436 |
910 |
816 |
2. Currency with the public |
-18,690 |
-9,020 |
-43,224 |
-31,650 |
-58,385 |
3.a. Centre’s surplus balances with RBI |
3,382 |
-67,938 |
-22,663 |
85,257 |
-58,249 |
3.b. WMA and OD |
0 |
0 |
0 |
0 |
0 |
4. Others (residual) |
-13,928 |
29,921 |
-1,334 |
538 |
10,612 |
B. Management of Liquidity (4+5+6+7) |
-21,674 |
62,376 |
89,870 |
1,618 |
67,255 |
4. Liquidity impact of LAF |
-1,30,020 |
25,390 |
86,330 |
18,795 |
75,785 |
5. Liquidity impact of OMO* (net) |
43,159 |
32,869 |
3,540 |
2,787 |
1,550 |
6. Liquidity impact of MSS |
65,187 |
4,117 |
0 |
16,036 |
2,420 |
7. First round impact of CRR change |
0 |
0 |
0 |
-36,000 |
-12,500 |
C. Bank Reserves # (A+B) |
-66,784 |
17,863 |
23,085 |
56,673 |
-37,951 |
(+) : Injection of liquidity into the banking system.
(-): Absorption of liquidity from the banking system.
* : Includes oil bonds but excludes purchases of government securities on behalf of State Governments.
# : Includes vault cash with banks and adjusted for first round liquidity impact due to CRR change.
Note: Data pertain to March 31 for Q4 and last Friday for all other quarters. |
Table IV.4: Liquidity Position |
(Rupees crore) |
Outstanding as on
Last Friday |
LAF |
MSS |
Centre’s
Surplus@ |
1 |
2 |
3 |
4 |
2009 |
|
|
|
April |
1,08,430 |
70,216 |
-40,412 |
May |
1,10,685 |
39,890 |
-6,114 |
June |
1,31,505 |
22,890 |
12,837 |
July |
1,39,690 |
21,063 |
26,440 |
August |
1,53,795 |
18,773 |
45,127 |
September |
1,06,115 |
18,773 |
80,775 |
October |
84,450 |
18,773 |
69,391 |
November |
94,070 |
18,773 |
58,460 |
December |
19,785 |
18,773 |
1,03,438 |
2010 |
|
|
|
January |
88,290 |
7,737 |
54,111 |
February |
47,430 |
7,737 |
33,834 |
March* |
990 |
2,737 |
18,182 |
April |
35,720 |
2,737 |
-28,868 |
May |
6,215 |
317 |
-7,531 |
June |
-74,795 |
317 |
76,431 |
@ : Excludes minimum cash balances with the Reserve
Bank in case of surplus.
* : Data pertain to March 31.
Note : 1. Negative sign in column 2 indicates injection of liquidity through LAF.
2. The second LAF was conducted only on reporting
Fridays since May 8, 2009. Since May 28, 2010, the
second LAF is being conducted on a daily basis. |
Reserve Money
IV.9 In 2009-10, the acceleration in the
growth rate of reserve money was primarily
on account of increase in bankers’ deposits
with the Reserve Bank on the components side
of reserve money, due to cumulative increase
in CRR by 75 basis points during the year. On the sources side, the increase in Reserve Bank’s
credit to the centre was a major factor, which
reflected the liquidity management operations
of the Reserve Bank (i.e., MSS unwinding and
de-sequestering, open market purchases and
LAF operations) to facilitate smooth
completion of the large government borrowing
programme for 2009-10, while ensuring
adequate financing for productive activities
and containing inflationary pressures.
IV.10 During the first quarter of 2010-11, the
main component of increase in reserve money
was currency in circulation (Table IV.5). The
higher growth in currency was mainly on
account of the increase in demand associated
with the strong rebound in economic activities as well as the spurt in inflation. On the sources
side, the increase in reserve money was led
by increase in Reserve Bank’s credit to the
centre, primarily reflecting the repo
operations in the market1 , and unwinding of
balances under the MSS. This was partially
offset by the increase in government’s cash
balances with the Reserve Bank. The net
foreign exchange assets of the Reserve Bank
also increased during the quarter.
Table IV.5 : Reserve Money - Variations |
(Rupees crore) |
Item |
2009-10 |
2010-11 |
Q1 |
Q2 |
Q3 |
Q4 |
Q1 |
1 |
2 |
3 |
4 |
5 |
6 |
Reserve Money |
-38,926 |
16,216 |
51,816 |
1,38,583 |
15,685 |
Components (1+2+3) |
|
|
|
|
|
1. Currency in Circulation |
29,692 |
1,081 |
45,442 |
32,181 |
64,785 |
2. Bankers’ Deposits with RBI |
-72,664 |
20,680 |
5,456 |
1,07,552 |
-49,042 |
3. Other Deposits with RBI |
4,046 |
-5,545 |
918 |
-1,150 |
-59 |
Sources (1+2+3+4-5) |
|
|
|
|
|
1. RBI’s Net Credit to Government |
-11,145 |
-14,953 |
51,428 |
1,24,676 |
15,796 |
of which to Centre |
-11,497 |
-14,968 |
51,597 |
1,24,688 |
15,807 |
2. RBI’s Credit to Banks and Commercial Sector |
-9,623 |
-3,747 |
-5,926 |
-2,384 |
851 |
3. Net Foreign Assets of RBI |
-16,750 |
50,120 |
-15,108 |
-66,428 |
14,613 |
4. Government’s Currency Liabilities to the Public |
254 |
302 |
309 |
351 |
238 |
5. Net Non-Monetary Liabilities of RBI |
1,662 |
15,506 |
-21,113 |
-82,369 |
15,814 |
Memo: |
|
|
|
|
|
LAF - Repo (+) / Reverse Repo (-) |
-1,32,800 |
28,170 |
67,765 |
37,360 |
39,375 |
Net Open Market Sales * |
-42,001 |
-31,591 |
-1,894 |
17 |
-8 |
Centre’s Surplus |
-13,156 |
77,713 |
17,519 |
-80,112 |
37,405 |
MSS Balances |
-65,187 |
-4,117 |
0 |
-16,036 |
-2,420 |
*: Excludes Treasury Bills.
Note : 1. The sum of the memo items will not add up to the net Reserve Bank credit to the Centre as LAF and OMO transactions are
at face value and also due to margin adjustment for LAF operations.
2. Data based on March 31 for Q4 and last reporting Friday for all other quarters.
3. Data are provisional.
4. Centre’s surplus includes Government’s investment balance and cash balance with the Reserve Bank. |
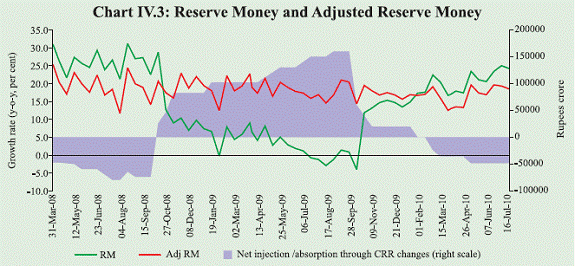
IV.11 Since bankers’ deposits with the
Reserve Bank, a key determinant of reserve
money on the components side, change in
response to variations in CRR effected by the
Reserve Bank as a part of its monetary policy
actions, it is useful to analyse the behaviour
of base money adjusted for the CRR changes.
The adjusted reserve money increased by 18.5
per cent (y-o-y) as on July 16, 2010,
reflecting the impact of increase in currency
in circulation (on the components side) and Reserve Bank credit to the government (on
the sources side) (Chart IV.3).
Money Supply
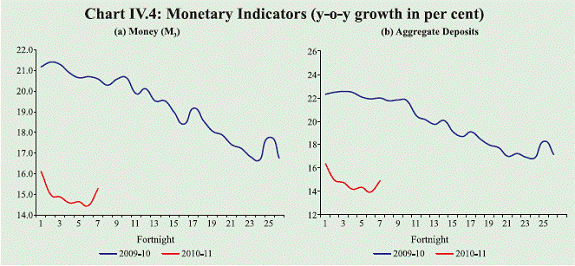
IV.12 The deceleration in the growth of M3 continued up to mid-June 2010 (Chart IV.4 a).
This was on account of the deceleration of
its major component, i.e., aggregate deposits
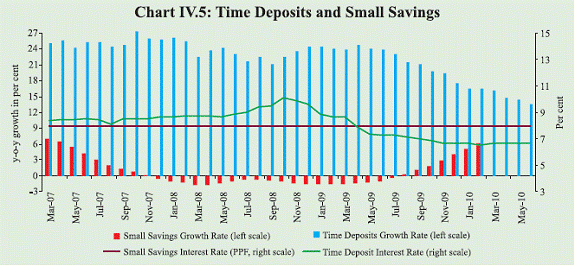
(Table IV.6 and Chart IV.4 b). The
moderation in the growth of time deposits
was particularly sharp, which was partly a
response to the low deposit rates, given high
inflation. During the fortnight ended July 2,
2010, aggregate deposits registered a
fortnightly increase of about Rs.1,15,000
crore; it is likely that the increased off-take
of credit has begun to be reflected in deposit
growth. There has been an increased inflow
into small savings schemes since August
2009 as returns on investments in small
savings have been higher than on time deposits with banks since the beginning of
2009-10 (Chart IV.5). Total incremental
inflows into small savings are, however, a
small fraction of monthly increases in time
deposits, notwithstanding the deceleration in
the growth of time deposits.
 IV.13 As regards sources of M3, the
increase in money supply during the quarter
came mainly from banking system’s credit
to the commercial sector. There has been
sustained acceleration in growth of non-food
credit extended by SCBs since the last quarter of 2009-10 (Chart IV.6 a). Telecom
operators raised credit to pay for the 3G/
BWA spectrums, which partly contributed to
the stronger growth in credit. With tepid
deposit mobilisation (barring the fortnight
ending on July 2, 2010), the incremental
non-food credit deposit ratio of SCBs moved
up to over 100 per cent (Chart IV.6 b). On
outstanding basis though, the non-food
credit to deposit ratio was 72.3 per cent on
July 2, 2010.
Table IV.6: Monetary Aggregates - Variations |
(Rupees crore) |
Item |
2009-10 |
2010-11 |
Q1 |
Q2 |
Q3 |
Q4 |
Q1 |
1 |
2 |
3 |
4 |
5 |
6 |
M3 (1+2+3 = 4+5+6+7-8) |
1,63,787 |
1,61,970 |
1,24,777 |
3,54,416 |
77,314 |
Components |
|
|
|
|
|
1 Currency with the Public |
24,913 |
2,797 |
45,086 |
29,787 |
64,381 |
2 Aggregate Deposits with Banks |
1,34,829 |
1,64,717 |
78,773 |
3,25,778 |
12,992 |
2.1 Demand Deposits with Banks |
-40,911 |
66,320 |
-26,343 |
1,34,985 |
-88,146 |
2.2 Time Deposits with Banks |
1,75,739 |
98,397 |
1,05,116 |
1,90,793 |
1,01,138 |
3 ‘Other’ Deposits with RBI |
4,046 |
-5,545 |
918 |
-1,150 |
-59 |
Sources |
|
|
|
|
|
4 Net Bank Credit to Government |
1,20,816 |
71,703 |
35,598 |
1,61,646 |
41,051 |
4.1 RBI’s Net Credit to Government |
-11,145 |
-14,953 |
51,428 |
1,24,676 |
15,796 |
4.2 Other Banks’ Credit to Government |
1,31,961 |
86,656 |
-15,830 |
36,970 |
25,255 |
5 Bank Credit to the Commercial Sector |
-7,232 |
1,07,136 |
68,093 |
3,09,890 |
65,642 |
6 Net Foreign Assets of Banking Sector |
-37,923 |
47,908 |
-20,701 |
-59,998 |
14,613 |
7 Government’s Currency Liabilities to the Public |
254 |
302 |
309 |
351 |
238 |
8 Net Non-Monetary Liabilities of the Banking Sector |
-87,872 |
65,079 |
-41,478 |
57,472 |
44,231 |
Note: Data are provisional. |
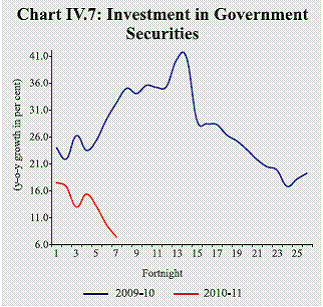
 IV.14 Given the deceleration in deposits
and acceleration in the growth of non-food
credit, there has been a deceleration in banks’
investment in government securities since
November 2009, which is the time when
growth in non-food credit turned around
(Chart IV.7).
IV.15 The revival in credit demand was
reflected in the lending figures for all bank
groups, with foreign banks and private sector
banks in particular, showing significant improvement in their y-o-y credit growth
compared to last year (Table IV.7). Credit
growth from the public sector banks
continued to be the highest and also most
stable.
 IV.16 Disaggregated data on sectoral
deployment of gross bank credit show
improvement in credit growth (y-o-y) to
industry, though the flow is yet not broadbased
(Table IV.8). Industry absorbed 57.9
per cent of incremental non-food credit (y-o-y) in May 2010 as compared with 47.4
per cent in the corresponding month of the
previous year. This expansion was led by
infrastructure, textiles, food processing,
paper and paper products, petroleum, coal
products and nuclear fuels, chemicals and
chemical products, and vehicles, vehicle
parts and transport equipments. The share
of incremental non-food credit to micro and
small enterprises (industry as well as
services), however, declined to 11.9 per cent
in May 2010 as compared with 16.0 per cent
in May 2009. Within services sector, credit
to real estate decelerated sharply, reflecting
definitional change to the concept of
“lending to real estate sector” effected in
September 2009.
IV.17 Banking system accounted for
roughly 65 per cent of the total flow of
financing to the commercial sector during
the first quarter of 2010-11, even as the flow
from non-bank sources also increased
significantly over the corresponding period
of the previous year. Besides bank credit,
issuance of IPOs, credit from housing
finance companies, external commercial borrowings and ADRs/GDRs were the other
important sources of finance for the
commercial sector (Table IV.9).
Table IV.7: Credit Flow from Scheduled Commercial Banks |
(Amount in Rupees crore) |
Item |
Outstanding
as on
July 2, 2010 |
Variation (Y-on-Y) |
As on July 3, 2009 |
As on July 2, 2010 |
Amount |
Per cent |
Amount |
Per cent |
1 |
2 |
3 |
4 |
5 |
6 |
1. Public Sector Banks |
25,26,007 |
3,71,522 |
22.0 |
4,62,443 |
22.4 |
2. Foreign Banks |
1,79,111 |
-12,257 |
-7.2 |
20,307 |
12.8 |
3. Private Banks |
6,17,033 |
18,716 |
3.8 |
1,10,019 |
21.7 |
4. All Scheduled Commercial Banks* |
34,02,390 |
3,89,967 |
16.2 |
6,06,823 |
21.7 |
*: including Regional Rural Banks.
Note: Data are provisional. |
Table IV.8 : Deployment of Gross Bank Credit by Major Sectors |
(Amount in Rupees crore) |
Sector |
Outstanding
as on May 21, 2010 |
Variation (year-on-year) |
May 22, 2009 |
May 21, 2010 |
Amount |
Per cent |
Amount |
Per cent |
1 |
2 |
3 |
4 |
5 |
6 |
Non-Food Gross Bank Credit (1 to 4) |
30,21,481 |
3,83,512 |
17.6 |
4,63,235 |
18.1 |
1. Agriculture and Allied Activities |
3,99,494 |
65,345 |
24.7 |
69,362 |
21.0 |
2. Industry |
13,08,721 |
1,81,932 |
21.2 |
2,68,274 |
25.8 |
3. Personal Loans |
5,89,003 |
24,489 |
4.6 |
36,032 |
6.5 |
Housing |
3,05,325 |
15,095 |
5.7 |
26,870 |
9.6 |
Advances against Fixed Deposits |
47,032 |
3,718 |
8.8 |
1,093 |
2.4 |
Credit Card Outstanding |
19,579 |
382 |
1.4 |
-7,398 |
-27.4 |
Education |
36,961 |
7,342 |
34.4 |
8,267 |
28.8 |
Consumer Durables |
8,138 |
- 1,651 |
-17.1 |
140 |
1.8 |
4. Services |
7,24,263 |
1,11,746 |
21.4 |
89,568 |
14.1 |
Transport Operators |
52,170 |
8,721 |
24.7 |
8,202 |
18.7 |
Professional Services |
49,549 |
9,537 |
29.9 |
8,070 |
19.5 |
Trade |
1,60,985 |
19,852 |
16.2 |
18,695 |
13.1 |
Real Estate Loans |
95,659 |
33,499 |
54.9 |
1,115 |
1.2 |
Non-Banking Financial Companies |
1,11,037 |
22,529 |
31.3 |
16,534 |
17.5 |
Memo |
|
|
|
|
|
Priority Sector |
10,65,619 |
1,46,173 |
19.1 |
1,52,429 |
16.7 |
Small Enterprises |
3,72,867 |
61,551 |
24.0 |
55,129 |
17.4 |
Industry |
13,08,721 |
1,81,932 |
21.2 |
2,68,274 |
25.8 |
Food Processing |
67,938 |
2,903 |
5.7 |
14,543 |
27.2 |
Textiles |
1,20,643 |
7,790 |
8.3 |
18,937 |
18.6 |
Paper and Paper Products |
19,536 |
1,936 |
14.0 |
3,774 |
23.9 |
Petroleum, Coal Products and Nuclear Fuels |
63,080 |
3,552 |
7.5 |
12,240 |
24.1 |
Chemicals and Chemical Products |
79,864 |
5,250 |
8.0 |
9,216 |
13.0 |
Rubber, Plastic and their Products |
16,570 |
2,284 |
20.6 |
3,169 |
23.7 |
Iron and Steel |
1,29,169 |
23,522 |
29.8 |
26,814 |
26.2 |
Other Metal and Metal Products |
35,470 |
5,406 |
21.5 |
4,951 |
16.2 |
Engineering |
73,821 |
12,709 |
24.2 |
8,561 |
13.1 |
Vehicles, Vehicle Parts and Transport Equipments |
37,544 |
2,958 |
9.9 |
4,570 |
13.9 |
Gems and Jewellery |
31,651 |
3,016 |
12.1 |
3,809 |
13.7 |
Construction |
43,876 |
11,671 |
44.7 |
6,123 |
16.2 |
Infrastructure |
3,96,544 |
71,384 |
35.1 |
1,21,829 |
44.3 |
Note: 1. Data are provisional and relate to select banks.
2. The deceleration in credit to real estate reflects largely the definitional change to the concept of lending to real
estate sector effected in September 2009. |
IV.18 Reflecting the strong growth
momentum and sharp acceleration in
investment demand, credit to the private sector recovered significantly. Flow of
resources from non-banks also increased to
meet the financing needs of the private sector.
Broad money growth remained below the
trajectory envisaged by the Monetary Policy
Statement for 2010-11, largely due to the
deceleration in the growth of aggregate
deposits up to mid-June 2010. There has been
a turnaround in the growth of both broad
money and deposits, which though coincided with a period of pick-up in credit to telecom
companies and the switchover to the base rate.
The tightness in liquidity conditions would
ease, but the calibrated normalisation of
monetary policy may not lead to return of the
persistent easy liquidity conditions that
prevailed last year. Banks, therefore, have to
step-up mobilisation of deposits to meet the
demand for credit from both the private sector
and the government.
Table IV.9: Flow of Financial Resources to the Commercial Sector |
(Rupees crore) |
Item |
April-March |
April-June |
2008-09 |
2009-10 |
2009-10 |
2010-11 |
1 |
2 |
3 |
4 |
5 |
A. Adjusted Non-food Bank Credit |
4,21,091 |
4,80,258 |
2,529 |
1,62,373 |
i) Non-food Credit |
4,11,824 |
4,66,960 |
8,555 |
1,51,640$ |
of which petroleum and fertiliser credit |
31,159 |
8,491 |
-18,796 |
-8,274# |
ii) Non-SLR Investment by SCBs |
9,267 |
13,298 |
-6,026 |
10,733$ |
B. Flow from Non-banks (B1+B2) |
4,61,702 |
5,97,263 |
58,946 |
87,837 |
B1. Domestic Sources |
2,79,908 |
3,81,431 |
38,659 |
54,091 |
1. Public issues by non-financial entities |
14,205 |
31,956 |
236 |
5,187 |
2. Gross private placements by non-financial entities |
77,856 |
1,41,964 |
N.A. |
N.A. |
3. Net issuance of CPs subscribed to by non-banks |
4,936 |
25,835 |
27,134 |
29,178 * |
4. Net credit by housing finance companies |
25,876 |
24,226 |
-892 |
4,028 # |
5. Total gross accommodation by the four RBI regulated AIFIs -NABARD, NHB, SIDBI & EXIM Bank |
31,408 |
33,871 |
-4,339 |
-3,097 # |
6. Systemically important non-deposit taking NBFCs (net of bank credit) |
42,277 |
60,663 |
8,004 |
14,859 # |
7. LIC’s gross investment in corporate debt, infrastructure and social sector |
83,350 |
62,916 |
8,517 |
3,936 # |
B2. Foreign Sources |
1,81,794 |
2,15,832 |
20,287 |
33,746 |
1. External Commercial Borrowings / FCCBs |
31,350 |
14,356 |
-1,805 |
9,091 |
2. ADR/GDR Issues excluding banks and financial institutions |
4,788 |
15,124 |
215 |
4,832 |
3. Short-term credit from abroad |
-12,972 |
35,170 |
N.A. |
N.A. |
4. FDI to India |
1,58,628 |
1,51,182 |
21,877 |
19,823 # |
C. Total Flow of Resources (A+B) |
8,82,793 |
10,77,521 |
61,475 |
2,50,210 |
Memo Item : |
|
|
|
|
Net resource mobilisation by Mutual Funds through Debt (non-Gilt) Schemes |
-32,168 |
96,578 |
80,149 |
8,335 |
$: Up to July 2, 2010. #: April-May, 2010. *: Up to June 15, 2010.
N. A.: Not Available. |
1 The Reserve Bank’s credit to the Centre is affected by LAF operations, OMO, MSS balances and
Government’s cash surplus with the Reserve Bank. Increase in repo/OMO purchases and decline in reverse
repo/MSS balances/Government’s surplus balances with Reserve Bank lead to increase in net Reserve Bank
credit to the Centre, and vice versa.
|