The Indian economy exhibited robust acceleration in the pace of recovery in the fourth
quarter of 2009-10, led by strong double digit growth in industrial activities. Contrary to
earlier concerns about the adverse impact of the deficient monsoon, the agricultural output
showed modest positive growth. Services activities, which had remained resilient throughout
the phase of slowdown, showed further pick-up in momentum. Excluding the“ community,
social and personal services” segment, growth in services sector in the fourth quarter of
2009-10 reached closer to the pre-global crisis trend. The IIP has continued to grow at a
robust pace in 2010-11 so far, notwithstanding some moderation in May 2010. Lead indicators
for services sector also suggest continuation of the robust trend. Capacity utilisation rate
remained high and employment growth was positive unlike the jobless recovery seen in
advanced economies. Overall GDP growth in 2010-11 could be expected to accelerate further
to get closer to its trend rate.
I.1 The real GDP growth for 2009-10
was revised upwards to 7.4 per cent from
the earlier estimate of 7.2 per cent, mainly
on account of strong growth of 8.6 per cent
in the fourth quarter as well as upward revision in growth figures for earlier quarters
(Table I.1). In Q4 of 2008-09, the pace of
deceleration in growth was the maximum.
The acceleration in Q4 of 2009-10 resulted
despite weak agriculture sector performance as well as tapering off of the stimulus
measures’ impact on the “community, social
and personal services” sector.
Table I.1: Growth Rates of Real GDP@ |
(Per cent) |
Sector |
2008-09* |
2009-10# |
2008-09 |
2009-10 |
Q1 |
Q2 |
Q3 |
Q4 |
Q1 |
Q2 |
Q3 |
Q4 |
1 |
2 |
3 |
4 |
5 |
6 |
7 |
8 |
9 |
10 |
11 |
1. Agriculture and Allied Activities |
1.6 |
0.2 |
3.2 |
2.4 |
-1.4 |
3.3 |
1.9 |
0.9 |
-1.8 |
0.7 |
| |
(15.7) |
(14.6) |
|
|
|
|
|
|
|
|
2. Industry |
3.1 |
10.4 |
5.2 |
4.9 |
1.7 |
0.8 |
4.6 |
9.0 |
12.3 |
15.1 |
| |
(20.0) |
(20.5) |
|
|
|
|
|
|
|
|
2.1 Mining and Quarrying |
1.6 |
10.6 |
2.6 |
1.6 |
2.7 |
-0.3 |
8.2 |
10.1 |
9.6 |
14.0 |
2.2 Manufacturing |
3.2 |
10.8 |
5.9 |
5.5 |
1.3 |
0.6 |
3.8 |
9.1 |
13.8 |
16.3 |
2.3 Electricity, Gas and Water Supply |
3.9 |
6.5 |
3.3 |
4.3 |
4.0 |
4.1 |
6.6 |
7.7 |
4.7 |
7.1 |
3. Services |
9.3 |
8.3 |
9.8 |
9.3 |
10.0 |
8.0 |
7.5 |
10.0 |
7.3 |
8.5 |
| |
(64.4) |
(64.9) |
|
|
|
|
|
|
|
|
3.1 Trade, Hotels, Restaurants, Transport, Storage and Communication |
7.6 |
9.3 |
10.8 |
10.0 |
4.4 |
5.7 |
5.5 |
8.5 |
10.2 |
12.4 |
3.2 Financing, Insurance, Real Estate and Business Services |
10.1 |
9.7 |
9.1 |
8.5 |
10.2 |
12.3 |
11.8 |
11.5 |
7.9 |
7.9 |
3.3 Community, Social and Personal Services |
13.9 |
5.6 |
8.7 |
10.4 |
28.7 |
8.8 |
7.6 |
14.0 |
0.8 |
1.6 |
3.4 Construction |
5.9 |
6.5 |
9.8 |
7.2 |
1.1 |
5.7 |
4.6 |
4.7 |
8.1 |
8.7 |
Real GDP at Factor Cost |
6.7 |
7.4 |
7.8 |
7.5 |
6.1 |
5.8 |
6.0 |
8.6 |
6.5 |
8.6 |
| |
(100) |
(100) |
|
|
|
|
|
|
|
|
Memo: |
(Amount in Rupees crore) |
Real GDP at Factor Cost(2004-05) |
41,54,973 |
44,64,081 |
|
|
|
|
|
|
|
|
GDP at current market prices |
55,74,449 |
62,31,171 |
|
|
|
|
|
|
|
|
@ : At 2004-05 Prices. * : Quick Estimates. # : Revised Estimates.
Note: Figures in parentheses indicate shares in real GDP.
Source: Central Statistical Organisation. |
Agricultural Situation
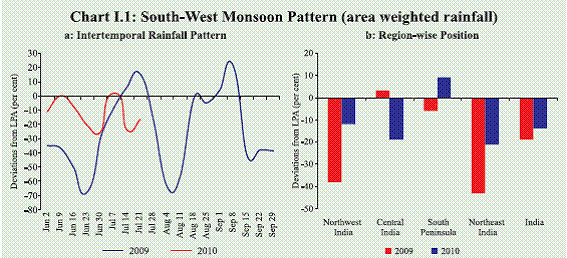
I.2 Rainfall during the South-West
monsoon season of 2010 (June to September)
is likely to be 102 per cent of the long period
average (LPA) (with a model error of ± 4.0
per cent) as per the revised forecasts dated
June 25, 2010 by the India Meteorological
Department. The cumulative area weighted
rainfall during the season so far (up to July
21, 2010) has been 14 per cent below LPA as
against 19 per cent below LPA during the
corresponding period of the previous year. Of
the 36 meteorological subdivisions,
cumulative rainfall was excess/normal in 26
sub-divisions (21 sub-divisions last year)
(Chart I.1). As on July 22, 2010, the total live
water storage in 81 major reservoirs of the
country was 19 per cent of the Full Reservoir
Level (24 per cent during the corresponding
period last year).
I.3 Available data show that the area
sown during kharif 2010 (as on July 22) was higher than in the corresponding period of
the previous year for all crop categories. The
area coverage was, however, lower in a few
individual crops such as urad, jowar, maize
and soyabean, mainly due to deficient
monsoon in the respective crop growing states
of Rajasthan and Madhya Pradesh (Table I.2).
Table I.2: Area Sown under Kharif Crops |
(in lakh hectares) |
Crop |
Normal Area during Kharif Season |
Area Sown Reported |
% Variation over Previous year |
% of Normal Kharif Area |
2010-11* |
2009-10* |
1 |
2 |
3 |
4 |
5 |
6 |
Rice |
395.10 |
169.71 |
157.67 |
7.6 |
43.0 |
Coarse Cereals |
222.23 |
141.42 |
132.40 |
6.8 |
63.6 |
Total Pulses |
107.94 |
57.23 |
50.55 |
13.2 |
53.0 |
of which |
|
|
|
|
|
Tur |
35.53 |
26.56 |
21.76 |
22.1 |
74.8 |
Urad |
22.82 |
12.83 |
12.92 |
-0.7 |
56.2 |
Moong |
26.14 |
13.60 |
11.01 |
23.5 |
52.0 |
Total Foodgrains |
725.27 |
368.36 |
340.62 |
8.1 |
50.8 |
Total Oilseeds |
175.72 |
129.49 |
123.89 |
4.5 |
73.7 |
of which |
|
|
|
|
|
Groundnut |
53.81 |
38.10 |
30.88 |
23.4 |
70.8 |
Soyabean |
84.00 |
80.28 |
81.53 |
-1.5 |
95.6 |
Sesamum |
17.76 |
6.52 |
5.98 |
9.0 |
36.7 |
Cotton |
90.86 |
95.04 |
80.63 |
17.9 |
104.6 |
Sugarcane |
44.97 |
47.37 |
41.79 |
13.4 |
105.3 |
Jute |
7.85 |
7.60 |
6.89 |
10.3 |
96.8 |
All Crops |
1044.67 |
647.86 |
593.82 |
9.1 |
62.0 |
* : As on July 22.
Source: Ministry of Agriculture, Government of India. |
 I.4 The Fourth Advance Estimates for
agricultural production in 2009-10 placed
the foodgrains output at 218.2 million
tonnes, a decline of 6.9 per cent over the
preceding year.
Food Management
I.5 The total stock of foodgrains with
the Food Corporation of India (FCI) and
other government agencies, increased to
58.4 million tonnes as on July 1, 2010
(Chart I.2). Since food price inflation has
remained high despite rising stock of
foodgrains much above the buffer norms,
the policy on food management has to focus
on better supply management in relation to
demand besides addressing the structural
capacity constraints in food items.
Industrial Performance
I.6 The industrial sector has maintained
double digit growth since August 2009
(except September 2009) (Chart I.3).
Increasingly manufacturing growth is being
led by capital goods industries and consumer
durables (Chart I.4a, b and Table I.3). The pick-up in capital goods production was
mainly on account of acceleration in
segments like “machinery and equipment
other than transport equipment”, “metal
products and parts” and “transport
equipment”. Although industrial output
decelerated marginally in the month of May 2010 as compared to 15 per cent growth
recorded during Q4:2009-10, the pace of
the increase is still robust. Notwithstanding
the impact of the base effect and possible weakness in global demand which may
cause some moderation in the pace of
growth, industrial activities could be
expected to remain buoyant.
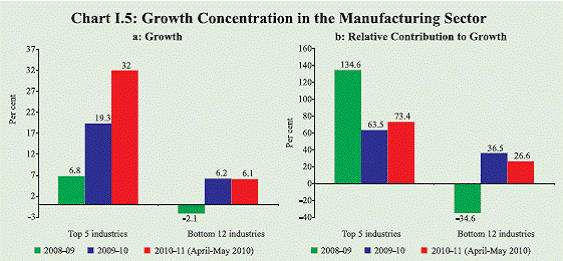
I.7 The manufacturing sector growth is
getting more broad-based. Five top
manufacturing industries, with a combined
weight of 24.6 per cent in IIP, grew at 19.3 per cent, contributing about 63.5 per cent
of the total growth during 2009-10 as
compared with 134.6 per cent in the
previous year. However, during April-May
2010, top five manufacturing industries
with a combined weight of 24.6 per cent in
IIP, grew at 32 per cent, contributing 73.4
per cent. (Chart I.5).
Table I.3: Index of Industrial Production: Sectoral and Use-based Classification of Industries |
(Per cent) |
Industry Group |
Weight in the IIP |
Growth Rate |
Weighted Contribution # |
April-March 2009-10 |
April-May |
April-March 2009-10 |
April-May |
2009-10 |
2010-11 P |
2009-10 |
2010-11 P |
1 |
2 |
3 |
4 |
5 |
6 |
7 |
8 |
Sectoral |
|
|
|
|
|
|
|
Mining |
10.5 |
9.8 |
3.4 |
10.2 |
6.3 |
14.2 |
5.0 |
Manufacturing |
79.4 |
10.9 |
1.1 |
15.1 |
88.9 |
59.3 |
91.0 |
Electricity |
10.2 |
6.0 |
4.8 |
6.6 |
4.8 |
25.2 |
4.1 |
Use-Based |
|
|
|
|
|
|
|
Basic Goods |
35.6 |
7.1 |
4.1 |
8.5 |
20.4 |
76.0 |
18.5 |
Capital Goods |
9.3 |
19.2 |
-4.7 |
50.9 |
24.5 |
-33.1 |
38.7 |
Intermediate Goods |
26.5 |
13.6 |
7.3 |
10.4 |
32.7 |
116.1 |
20.3 |
Consumer Goods (a+b) |
28.7 |
7.3 |
-2.9 |
10.0 |
22.4 |
-59.3 |
22.7 |
a) Consumer Durables |
5.4 |
26.2 |
15.3 |
28.1 |
19.4 |
70.1 |
16.8 |
b) Consumer Non-durables |
23.3 |
1.3 |
-8.0 |
3.5 |
3.0 |
-129.1 |
5.8 |
General |
100.0 |
10.4 |
1.6 |
14.0 |
100.0 |
100.0 |
100.0 |
P: Provisional. # : Figures may not add up to 100 due to rounding off. Source: Central Statistical Organisation. |
 I.8 During the period April 2009-
February 2010, capacity utilisation levels
in the infrastructure sector showed a mixed
trend. While finished steel and fertiliser
sectors recorded higher utilisation as
compared with the same period last year,
cement and refinery production of
petroleum sector witnessed lower
utilisation for the same period (Table 1.4).
The Order Books, Inventories and Capacity
Utilisation Survey (OBICUS) of the
Reserve Bank indicates that capacity
utilisation, which was witnessing an
improvement since Q2 of 2009-10, declined
marginally in Q4 of 2009-10. The Industrial Outlook Survey (IOS) of the Reserve Bank
also points to a similar pattern (Chart I.6). A
part of the moderation in capacity utilisation
could have resulted from the augmentation
of capacity driven by the sharp acceleration
in investment growth in the fourth quarter
of 2009-10. Capacity utilisation rates,
however, appear to be stretched in areas like
import cargo and domestic passenger
segment of the aviation sector.
Table I.4: Capacity Utilisation in Infrastructure Sector |
(Per cent) |
Sector |
(April-February) |
2008-09 |
2009-10 |
1 |
2 |
3 |
Finished Steel (SAIL+VSP+ Tata Steel) |
85.9 |
89.3 |
Cement |
86.0 |
83.0 |
Fertiliser |
83.3 |
94.7 |
Refinery Production–Petroleum |
107.7 |
107.3 |
Source: Capsule Report on Infrastructure Sector Performance (April 2009-Febraury 2010), MOSPI, GoI |
I.9 The government has been
monitoring the impact of the global crisis on employment through quarterly surveys.
Even though a decline was observed during
the first quarter of 2009-10, the
employment situation improved in the next
two quarters and showed a marginal rise in
the last quarter of 2009-10 (Table I.5).
Table I.5: Changes in Estimated Employment |
(in lakh) |
Industry/Group |
June 2009 Over March 2009 |
September 2009 Over June 2009 |
December 2009 Over September 2009 |
March 2010 Over December 2009 |
March 2010 Over March 2009 |
1 |
2 |
3 |
4 |
5 |
6 |
1. Textiles including apparels |
-1.54 |
3.18 |
0.16 |
-1.19 |
0.61 |
2. Leather |
0.07 |
-0.08 |
0.09 |
0.00 |
0.08 |
3. Metals |
-0.01 |
0.65 |
0.23 |
0.04 |
0.91 |
4. Automobiles |
0.23 |
0.24 |
0.06 |
0.29 |
0.82 |
5. Gems and jewellery |
-0.20 |
0.58 |
0.07 |
0.24 |
0.69 |
6. Transport |
-0.01 |
0.00 |
-0.02 |
-0.02 |
-0.05 |
7. IT/BPO |
-0.34 |
0.26 |
5.70 |
1.29 |
6.91 |
8. Handloom / Powerloom |
0.49 |
0.15 |
0.09 |
-0.05 |
0.68 |
Overall |
-1.31 |
4.98 |
6.38 |
0.61 |
10.66 |
Source: Sixth Quarterly Quick Employment Survey, December 2009-March 2010, Labour Bureau. |
Infrastructure
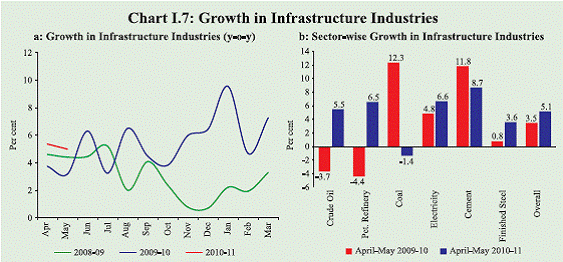
I.10 The six core industries registered
a growth of 5.1 per cent during April-May
2010-11 as against 3.5 per cent during the same period in 2009-10 (Chart I.7a and b).
The growth in the infrastructure sector
during the year so far has come largely
from electricity, steel, crude and petroleum
refinery sectors while the growth in
cement production was subdued and that
of coal production was negative. In recent
months, the pace of infrastructure growth
has lagged behind the pace of industrial
growth, which will further widen the
infrastructure gap.
 I.11 Natural gas production, which is
not reflected in the core infrastructure
index, increased sharply during 2009-10 on
account of commencement of production
from the D6 block in Krishna-Godavari
(KG) basin and Rajasthan fields (Cairn).
Natural gas production witnessed a sharp
growth of 44.8 per cent in 2009-10 as
compared with 1.4 per cent in 2008-09. Gas
production increased by 43.5 per cent in
April-May 2010 as compared with 11.7 per
cent in the same period last year.
Services Sector
I.12 The services sector rebounded in
Q4:2009-10 after some moderation in the
previous quarter (Chart I.8). While the
growth in the segment related to
manufacturing viz., ‘construction’ and
“trade, hotel, transports and communication”
accelerated, the “financing, insurance, real
estate and business services” segment
remained steady. Excluding “community,
social and personal services”, services sector
reached closer to the growth trajectory that
was achieved prior to the global crisis.
I.13 Data on a number of lead indicators
of services sector activities like tourist
arrivals, commercial vehicles production
and railway freight traffic suggest
continuation of the buoyancy in 2010-11
(Table I.6).
I.14 To sum up, GDP growth in the last
quarter of 2009-10 was higher than
previously expected, and going by the lead
indicators, this growth rate seems
sustainable. On the supply side, the
agriculture and allied sector is expected
to post a better performance than last year.
Continuing resilience of the services
sector, coupled with buoyancy of the
industrial sector would lend further
support to this growth momentum.
Demand side factors like revival of private
consumption demand and pick-up in
private investment are expected to offset
the slowdown in government consumption
due to the gradual exit from the fiscal
stimulus measures.
I.15 While the pick-up in investment is
already significant, going forward, the
sustainability of current buoyancy in industrial and services growth would
require large additions to capacity. The
possibility of crowding-out pressures has
reduced after the better than expected collections through 3G/BWA spectrum
auctions. However, risks to growth could
arise from inflation and uncertainties on the
external front.
Table I.6: Indicators of Services Sector Activity |
(Growth in Per cent) |
Indicators |
2007-08 |
2008-09 |
2009-10 |
2009-10 (April-June) |
2010-11 (April-June) |
1 |
2 |
3 |
4 |
5 |
6 |
Tourist arrivals |
12.2 |
-3.3 |
3.5 |
-1.9 |
8.4 |
Commercial vehicles production |
4.8 |
-24.0 |
58.9 |
-18.5 |
57.1 |
Cement# |
8.1 |
7.2 |
10.5 |
11.8 |
8.7 |
Steel# |
6.2 |
1.6 |
4.9 |
0.8 |
4.7 |
Railway revenue earning freight traffic |
9.0 |
4.9 |
6.6 |
5.1 |
8.3 |
Cell phone connections## |
38.3 |
80.9 |
47.3 |
83.5 |
42.0 |
Cargo handled at major ports## |
12.0 |
2.2 |
5.7 |
-1.2 |
2.7 |
Civil aviation |
|
|
|
|
|
Export cargo handled## |
7.5 |
3.4 |
10.4 |
0.7 |
13.1 |
Import cargo handled## |
19.7 |
-5.7 |
7.9 |
-17.2 |
29.9 |
Passengers handled at international terminals## |
11.9 |
3.8 |
5.7 |
0.4 |
6.9 |
Passengers handled at domestic terminals## |
20.6 |
-12.1 |
14.5 |
-17.1 |
27.0 |
# : Data pertain to April-May.
## : Data up to April.
Source: Ministry of Tourism; Ministry of Commerce and Industry; Ministry of Statistics and Programme Implementation; Reserve Bank of India. |
|