3.1 As discussed in the previous chapter, the
systemic risks posed by the immensely complex
financial system were overshadowed by the benign
macroeconomic outcomes observed for a sustained
period of time before the crisis. The complex nature
of new financial instruments and the inability to
assess counterparty risks in financial markets in
an environment of rapid growth in credit and
booming asset prices made the financial system
vulnerable. Due to the rapid global integration and
deep and complex interconnections between
financial institutions, the crisis which emerged in
the US sub-prime housing market manifested itself
across assets, markets, and economies. During the
initial stages of the crisis, the impact was
manifested in mounting losses on the exposures
of banks and financial institutions to the sub-prime
mortgages and structured finance products. These
losses were exacerbated by illiquidity in the markets
for those instruments, which led to substantial
reductions in their mark-to-market valuations.
3.2 With the collapse of Lehman Brothers, the
crisis entered a turbulent new phase in September
2008, after which the crisis rapidly developed into
a crisis of confidence and engulfed the whole
financial system in the US. Subsequently, it spread
to other developed economies, resulting in a
number of European bank failures, declines in
various stock indices with consequent large
reductions in the market value of equities and
commodities, failure of key businesses, declines
in consumer wealth and a significant decline in
economic activity. Moreover, the deleveraging of
financial institutions, as assets were sold to pay
back obligations that could not be refinanced in
frozen credit markets, further accelerated the
liquidity crisis. In this phase, bank losses and writedowns
became more closely linked and the impact
was felt in terms of a surge in borrower defaults
on the back of worsening macroeconomic
performance.
3.3 Global trade and financial integration had
given the US financial market crisis a global form
as the increasingly integrated global trading and
financial system magnified and accelerated the
transmission process. There had been rapid
transmission of shocks from the US and Europe to
the rest of the world. The impact of the crisis was
felt in almost all the economies of the world in
varying degrees. The crisis spread to EMEs through
all four channels – trade, finance, commodity and
confidence channels. In the EMEs, the slump in
export demand and tighter trade credit caused
deceleration in aggregate demand; reversal of
capital flows led to equity market losses and
currency depreciations; global liquidity tightening
resulted in lower external credit flows; and market
rigidities and erosion of confidence led to widening
of credit spreads.
3.4 The crisis that originated in the financial
sector was transmitted to the real sector through
several channels. The depth and spread of the
crisis can be gauged from the successive revisions
in the estimates of write-downs, decline in trade
and, finally, the contraction in economic activity.
The financial sector deleveraging, in conjunction
with weak credit markets, falling production and
rapidly shrinking global trade, led to a situation of
a more prolonged recession, especially with the
growth in EMEs showing significant moderation.
In the financial sector, the estimates for global
write-downs of loans and securities held by banks
over 2007-10 amounted to US$ 2.3 trillion (WEO,
April 2010). On the trade front, according to the
IMF (WEO, April 2010), world trade volume (goods
and services) has declined by 10.7 per cent during
2009 as against 2.8 per cent growth witnessed in
2008. In the real economy, the final impact of the
crisis was reflected in deteriorating global growth
outlook as can be observed from the successive
revisions in the growth projections for 2009 from
3.8 per cent in April 2008 to (-) 1.1 per cent in October 2009 which was revised further to (-)0.6
per cent in April 2010.
3.5 However, there are incipient signs of
recovery in the global economy, while financial
conditions are stabilising. According to the IMF,
emerging and developing economies are further
ahead on the road to recovery, led by resurgence
in Asia. Already there are signs of strong revival in
capital flows in line with improved macroeconomic
conditions in these economies, sound policy
framework and rebound in the risk appetite of global
investors and financial market sentiments. The
quick and strong policy responses across advanced
and emerging economies played an important role
in limiting the stress in the global economy as
compared to earlier crises (see Chapter 2).
3.6 Against this backdrop, this chapter analyses
the impact of the crisis on various sectors of the
economy, such as financial markets, financial
institutions, international trade, international capital
flows, remittances and the real economy in a global
context. Section I discusses the impact of the crisis
on financial markets, while Section II covers the
impact on the financial system. The impact on the
external sector covering trade, services, current
account deficit and capital flows is described in
Section III. The impact on the real economy is
discussed in Section IV, while some concluding
observations are given in Section V.
I. IMPACT ON FINANCIAL MARKETS
3.7 Global financial markets have witnessed
rapid changes during the past decade in terms of
evolution of new products and instruments and
increase in turnover volumes. Certain types of
financial innovations turned increasingly complex
and their usage increased dramatically in recent
years, generating speculative bubbles. These
products included adjustable rate mortgages
(ARM), mortgage backed securities (MBS),
collateralised debt obligations (CDO) and credit
default swaps (CDS). Interestingly, these complex
products were assigned safe ratings by credit rating
agencies. Also, the strong demand for these
instruments in an environment of easy liquidity and strong credit growth drove down lending standards.
Eventually this speculative bubble proved
unsustainable and manifested in financial market
turmoil in the US, which in a year’s time reached
unprecedented heights.
3.8 The crisis moved rapidly from the US subprime
market to the financial markets of Europe and
other advanced economies. After the onset of the
financial crisis, a number of features became
common across the financial markets of the most
affected economies, particularly in the US and
Europe. These were a broad re-pricing of risk, severe
shortages of market liquidity in many security and
commercial paper markets, a shortage of funding
liquidity in the interbank market, and, for some
European financial institutions, a shortage of US
dollar funding. Although the crisis started spreading
across financial institutions, markets and countries
from August 2007, the closing of the large US
investment bank, Lehman Brothers, in September
2008 aggravated panic in the financial markets. The
collapse of Lehman Brothers distorted the financial
intermediation process – it gave rise to rapid increase
in the cost of intermediation between financial
organisations as well as counterparty risks.
3.9 Initially, the EMEs were much less affected
by the recent crisis than during previous crisis
episodes. Some spillovers were evident in financial
markets, particularly associated with the rise in global
risk aversion. However, as the financial market
upheaval in developed economies persisted,
particularly after the Lehman failure in September
2008, EME financial markets came under severe
strain with increased volatility. Post-September 2008,
as global investors scaled back their holdings of
emerging market assets amid continued financial
system deleveraging, Asian equities and external
funding conditions became severely affected. Asian
stock markets collapsed even more sharply than the
mature markets and sovereign credit spreads
widened significantly. Heightened financial volatility
and a sharp reversal in risk appetite together with
elevated funding costs narrowed external funding
sources for Asian borrowers. This was accompanied
by a sharp drop in Asian offshore bond issuance,
massive capital outflows and unwinding of carry trade. As a result, the region’s currencies depreciated
sharply. The impact of the crisis on various segments
of the financial markets in advanced economies and
EMEs is discussed in detail in the following sections.
Impact on Interbank/ Money Market
3.10 One of the first financial market segments
to be affected by the crisis was the interbank
market. The first symptoms of the crisis appeared
in August 2007, when serious disruptions took place
in the interbank market, putting pressures on
liquidity. As uncertainty reigned over the extent of
subprime-related losses and their concentration,
banks became concerned about counterparty risk.
Banks increased their demand for liquid funds and
became reluctant to lend to one another. This
resulted in severe tightening of funding conditions
in the interbank credit markets. The illiquidity and
increase in perceived credit risk caused spreads
on interbank rates to widen. Later this crisis spread
to the money markets, taking the form of abnormal
levels of spreads, the shortening of maturities, and
the contraction, or even closure, of some market
segments. Through contagion, these tensions also
affected non-financial corporations and the
financing of the economy.
Spreads in Advanced Economies
3.11 An indicator of the severity of liquidity
pressure in the interbank market is the spread
between the interest rate in the London interbank
offered rate (LIBOR) and the overnight indexed
swap (OIS) rate of corresponding maturity. In
principle, this spread provides a measure of the
risk premium, which includes both credit and
liquidity factors. This spread hardened from early
August 2007 but reached unprecedented highs of
361 basis points in the US, 244 basis points in the
UK and 199 basis points in the Euro area in the
post-Lehman period (Table 3.1). The interbank
market in Japan, however, was relatively less
affected during the crisis with its spread peaking at
80 basis points at the height of the crisis.
3.12 In the post-Lehman period, this sharp rise
in spread reflected heightened concerns about liquidity risks, particularly for US dollar term funding
as also concerns about an increase in the credit
risk of the banking sector, following the collapse or
near-collapse of some large financial institutions.
Similar trends were noted in the financial markets
in Europe. Strains were particularly evident for
foreign exchange swaps, where rising financial
sector credit spread and the rising global demand
for US dollar funds raised the implied cost of dollars
to historically high levels above LIBOR. With the
viability of key players at stake and perceptions of
counterparty risk rising, the benchmark US
investment grade CDX credit default swap index
spread jumped by 42 basis points and US highyield
spreads rose by 118 basis points on
September 15, 2008 alone. The resulting turmoil
quickly spread through the intensely integrated
global financial system leading to widening of credit
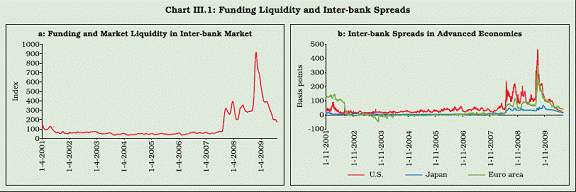
spreads in other major markets (Chart III.1).
Table 3.1: Movement in Interbank Spreads |
(basis points) |
Indicator |
Pre-
Crisis
End-
March 2007 |
LIBOR-
OIS
peak
level |
End-
Dec
2008 |
End-
March
2009 |
End-
June
2009 |
1 |
2 |
3 |
4 |
5 |
6 |
U.S. 3-month LIBOR-OIS |
8 |
361 |
123 |
99 |
37 |
Euro 3-month LIBOR-OIS |
6 |
199 |
160 |
82 |
50 |
Japan 3-month LIBOR-OIS |
16 |
80 |
73 |
49 |
37 |
UK 3-month LIBOR-OIS |
11 |
244 |
165 |
120 |
78 |
Source: IMF, Global Financial Stability Report, (GFSR), October 2009. |
3.13 The funding problem in the interbank market
quickly spilled over into the markets for commercial
paper (CP) and bank certificates of deposit (CDs),
where money market funds are a key investor group.
Commercial paper markets suffered due to
redemptions/ reallocations and illiquid secondary
markets for these securities. Unsecured financial
paper suffered the largest outflows: total
outstanding CP volumes in the United States
plummeted by more than US$ 325 billion between
September 10, 2008 and October 22, 2008, from a
total of about US$ 1.76 trillion. Foreign banks and
those US institutions without their own retail deposit
base thus lost access to an important source of
funds at a time when they needed to support or take onto their balance sheets the money market
funds that they sponsored. In response, the demand
for US dollar interbank funds surged, causing shortterm
credit and money markets to seize up.
 |
3.14 Responding to such tightness in the market,
the Federal Reserve acted to relieve money market
tensions with various credit facilities, which were
extended and enhanced on July 30, 2008. The
impact of these efforts, however, was partly offset
by increased uncertainty following the default of
large financial companies. In the euro area, the
spreads between deposit rates and OIS rates were
influenced by strong demand from European banks
for US dollar liquidity, because funds borrowed in
Euros had to be swapped for US dollars to support
euro area banks’ investment positions that were
denominated in this currency. The European Central
Bank (ECB) provided ample liquidity in its regular
weekly operations in order to allow banks to meet
their reserve requirements during maintenance
periods. In addition, the ECB renewed its
supplementary longer-term refinancing operations
for maturities of three and six months.
3.15 Quantitative and credit easing policies,
extraordinary liquidity measures and government
guaranteed funding programs have helped to improve
the functioning of short-term money markets. The
money market conditions have continued to improve
in the early months of 2010, accompanied by a decline
in market and liquidity risks as asset prices have
continued to recover across a range of asset classes
(IMF, GFSR, April 2010).
Spreads in Asian Economies
3.16 The liquidity strains in major international
interbank markets spilled over to several Asian
interbank markets—particularly in the key Asian
financial centres of Hong Kong, Singapore and
South Korea, where short-term interest rates
increased significantly in the second half of 2008.
The rise in local currency interbank market rates
prompted the monetary authorities in those
countries to inject liquidity to normalise market
operations. The domestic liquidity pressures in
Asian money markets reflect several factors,
including arbitrage across foreign and domestic
currency markets, rising uncertainty about the
economic outlook and increased risk aversion.
Overall, domestic interbank markets in Asia,
however, did not seize up as severely as their
counterparts in developed countries. With authorities’
support, domestic interbank markets in all three of
these economies saw a return to normality.
3.17 The creation of a number of new central bank
facilities and the willingness on the part of central
banks to provide necessary liquidity appeared to
alleviate concerns among banks about the availability
of short-term liquidity. However, money market
spreads increased for maturities longer than three
months, suggesting growing counterparty credit risk
concerns. Such cross-currency activity and the high
correlation between changes in equivalent spreads
of other major currencies indicate that global money
markets have become increasingly interlinked as a
result of the market turmoil.
Impact on Credit Market
3.18 Declining credit growth, particularly in the
advanced economies, worked as a catalyst to
aggravate and spread the impact of the crisis from
one market to another. Unlike the money market,
credit flows, however, had been impacted by the
crisis with a lag as credit flows were robust during
the early stages of the crisis. However, to a large
extent this reflected special circumstances. First,
during the initial stages of the crisis, there was
market and supervisory pressure on banks to
consolidate previously off-balance sheet exposures
to securitisation vehicles. This tended to swell
balance sheets even without any fresh extension
of credit. Second, borrowers pre-emptively raised
funds in anticipation of credit tightening by drawing
down credit lines that had been granted before the
crisis, often at very favourable terms.
Slowdown in Credit Growth
3.19 A sharp slowdown in credit growth to the
private sector was noted during the post-Lehman
phase in many of the advanced economies, where banks sought to reduce leverage and rebuild capital
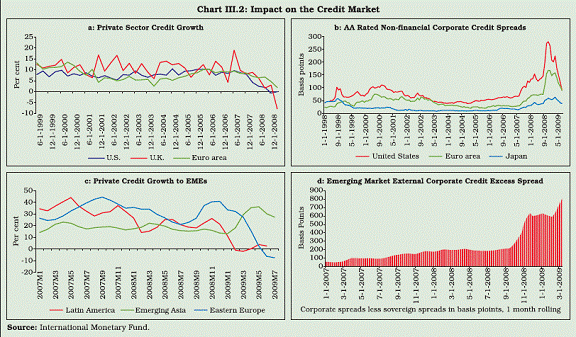
bases (Chart III.2). The overall deceleration in
lending to the private sector was broad based
across the various money-holding sectors, although
the level of adjustment varied from sector to sector.
Lending standards tightened across all types of
loans, although more sharply in the case of
household credit, including mortgages. Nominal
housing credit (excluding home equity loans)
contracted at an annual rate of 1–2 per cent from
the second quarter of 2008 to the first quarter of
2009 in the US, and it stopped growing in the euro
area by March 2009. On account of tightening of
lending standards, even households with good
credit histories faced difficulties in obtaining
mortgage loans or home equity lines of credit.
Consumer credit growth also slowed significantly
in many advanced countries, the exception being
the US, where it grew at an annual rate of 9 per
cent in the first quarter of 2009. Banks reduced
credit card limits and increased refusals of
automobile loan applications. Although business
credit continued to expand in many countries, it was
mainly driven by an increase in the use of existing credit lines rather than by new lending. In addition
to the supply-side credit constraints, decline in
credit growth to some extent also reflected a
slowdown in demand as the major economies
entered into recession with firms and households
refocusing towards capital preservation as well as
towards managing excess capacity and high levels
of debt.
 |
3.20 Credit growth continued to remain sluggish
in the advanced economies during the early months
of 2010, notwithstanding the improved private
sector credit risks. Constraints on bank capital and
sluggish non-financial credit growth continued to
impair the supply of credit in those economies. The
outlook for credit growth in the advanced economies
remain sluggish and uneven, as banks continue to
delever and private demand remains weak.
3.21 Within EMEs, the limited exposures of Asian
banks to sub-prime and CDO assets, coupled with
well-capitalised balance sheets allowed Asian
interbank markets to remain relatively calm. There
was no noticeable reduction in the growth of private
domestic credit in most countries in the region
during the initial phase of the crisis (Table 3.2).
However, as the crisis deepened, credit growth in
many countries weakened. Credit growth continued
to remain sluggist in many of the emerging Asian
economies during the second half of 2009. Credit
to the household sector increased by 7.8 per cent
in Singapore, 11.5 per cent in Indonesia, 2.4 per
cent in Korea, 2.7 per cent in Taiwan and 5.7 per cent in Malaysia between June-December 2009.
Credit growth to the corporate sector remained
lower than the household sector for all these
economies. (Regional Economic Outlook: Asia and
Pacific, April 2010). Credit growth started
accelerating in many of the emerging Asian
economies in the recent months, while in emerging
Europe, credit continues to contract though at a
decelerating pace (IMF, GFSR, April 2010).
Table 3.2: Growth of Private Domestic Credit in
Select Asian Economies |
(year-on-year, per cent) |
|
2006 |
2007 |
2008Q1 |
2008Q2 |
2008Q3 |
2008Q4 |
1 |
2 |
3 |
4 |
5 |
6 |
7 |
China |
12.1 |
18.0 |
19.1 |
16.9 |
14.8 |
13.2 |
Hong Kong |
4.3 |
7.6 |
9.6 |
14.6 |
18.3 |
0.6a |
India |
28.1 |
22.8 |
22.4 |
24.2 |
24.8 |
27.8a |
Indonesia |
13.9 |
18.9 |
27.4 |
31.5 |
34.2 |
36.5 |
Korea |
10.8 |
14.3 |
14.3 |
16.0 |
16.2 |
16.4b |
Malaysia |
8.6 |
9.0 |
10.9 |
10.8 |
9.7 |
9.5a |
Philippines |
1.2 |
5.9 |
8.4 |
8.9 |
16.9 |
16.5 |
Singapore |
3.6 |
10.2 |
18.5 |
20.5 |
20.7 |
17.5 |
Thailand |
6.4 |
3.3 |
5.4 |
6.8 |
9.5 |
9.7 |
a. November 2008. b. October 2008.
Source: ADB Outlook, 2009. |
Widening of Credit Spreads
3.22 Credit default swap (CDS) indices in the US
had reached historical highs across all categories,
for both the financial and the non-financial sectors.
At the same time, issuance of asset-backed
securities (ABSs) and collateralised debt obligations
(CDOs) remained sluggish. The US government’s
plans, the Troubled Asset Relief Program (TARP),
which aimed at restoring confidence in the ABS
market by authorising the US Treasury to take
troubled assets off the balance sheets of financial
institutions, followed by capital injections to banks,
helped to reduce the perceived risk of further
defaults, resulting in a tightening of banks’ CDS
spreads (ECB, 2009) (Table 3.3). Nevertheless,
CDS premia for global large and complex banking
groups (LCBGs) remained at relatively high levels,
reflecting market uncertainty about the
implementation of the programme, its influence on
particular institutions and concerns over the impact
of higher funding costs in the banking sector.
Table 3.3: Credit Market Spreads |
(basis points) |
|
Pre-Crisis
30/06/2007 |
Time of
Lehman
Collapse
12/09/2008 |
A Year
Later
31/08/2009 |
1 |
2 |
3 |
4 |
Residential Mortgage ABS |
|
|
|
United Kingdom |
10 |
215 |
190 |
United States |
26 |
875 |
1328 |
Commercial Mortgage ABS |
|
|
|
Europe |
20 |
330 |
975 |
United States |
30 |
290 |
650 |
Consumer ABS |
|
|
|
United Kingdom |
12 |
255 |
465 |
United States |
0-10 |
130-200 |
55-90 |
Source: IMF, GFSR, October 2009. |
3.23 In sum, in view of soaring demand for liquid
funds in the wake of the contraction in the money
market mutual fund sector, global inter-bank
markets came under pressure, squeezing banks’
access to short-term funding. Money markets,
which were already strained, failed to recuperate,
despite massive central bank liquidity injections. As
a result, interbank rates spiked to historic highs.
The movements in other major markets, such as
those for euro and sterling funds, also showed
similar signs, albeit moderately. Thus, the turmoil
transcended from credit and money markets to the
global financial system more broadly. The contagion
also spilled over to the emerging markets, which
saw broad-based asset price declines amidst
depressed levels of risk appetite. While policy
intervention on an unprecedented scale helped to
stabilise the money market conditions, credit
growth, however, continued to remain sluggish,
particularly in the advanced economies, even in the
recent months.
Impact on Stock Market
3.24 The stock market is another segment of the
financial sector that has borne much of the heat of
the global financial crisis. During the recent financial
crisis, equity markets all over the world witnessed
high volatility and sharp declines in prices. However,
in contrast to other markets, the impact of the crisis
was more pronounced on the EME stock markets
compared to their matured counterparts.
Advanced Economies
3.25 From the beginning of the year until mid-
March 2008, equity prices in the euro area, the
United States and Japan followed a declining trend.
This trend was partly reversed when JPMorgan
Chase took over Bear Stearns in March 2008. The
Bear Stearns rescue package was favourably
perceived by market participants, who changed
their risk perceptions, thereby contributing to
sustaining equity markets. Against this background,
from mid-March to the beginning of June 2008 the
Dow Jones EURO STOXX increased by almost 10
per cent, the Standard & Poor’s 500 by around 8.5
per cent, and the Nikkei 225 by 22.5 per cent. Stock price fluctuations, however, became pronounced
from September 2008, reflecting uncertainties
generated in global financial markets following the
collapse of Lehman Brothers and the failure of
many other significant financial institutions. Growing
concerns about the health of loss-making financial
institutions and the deteriorating economic outlook
and its impact on company earnings put downward
pressure on major stock indices during the last
quarter of 2008. Moreover, declining actual and
expected earnings growth also contributed to the
negative performance of stock markets in the US
and the euro area.
3.26 Along with sharp declines in prices, the
stock markets of the matured economies have also
experienced high volatility since September 2008.
In September 2008, volatility in the S&P 500 spiked
to levels not seen since the 1987 stock market
crash. Overall, at the end of 2008 equity prices in
the euro area, the United States and Japan, as
measured by the Dow Jones EURO STOXX, the
Standard & Poor’s 500, and the Nikkei 225 indices,
respectively, were lower by around 46 per cent, 39
per cent and 42 per cent, respectively, as compared
with their levels at end-2007.
Emerging Market Economies
3.27 The severe impact of the crisis was felt in
the EME stock markets, mainly in terms of a
collapse in stock prices. There were significant selloffs
by FIIs in most of the emerging Asian equity
markets from October 2007. Equity flows to the
EMEs declined substantially during 2008, with the
decline being more pronounced during the last two
quarters of the year. Equity flows to EMEs declined
sharply from US$ 207.8 billion in 2007 to US$ 54.2
billion in 2008. Within equity flows, while inflows
under FDI remain relatively resilient during the
crisis, portfolio flows were the worst sufferers.
Equity flows, however, have bounced back strongly
during the second quarter of 2009 (Table 3.4).
3.28 The fall in equity prices in EMEs was
particularly strong from the middle of 2008 in contrast
to matured economies, where the fall began in the
middle of 2007. Within Asian EMEs, the stock market valuation declined by 35 per cent in Korea, 33 per
cent in India, and 36 per cent in China between June
and December 2008, reflecting the wide-ranging
effect of the world financial crisis (Table 3.5). The fall
in equity prices took place amid heightened volatility
and some EMEs even temporarily halted trading on
their stock exchanges.
Table 3.4: Emerging Market Equity Issuance |
(US $ billion) |
Country |
2007 |
2008 |
2009 |
2008 |
2009 |
Q3 |
Q4 |
Q1 |
Q2 |
Q3 |
Q4 |
1 |
2 |
3 |
4 |
5 |
6 |
7 |
8 |
9 |
10 |
Asia |
|
|
|
|
|
|
|
|
|
China |
48.3 |
12.8 |
39.9 |
1.6 |
1.3 |
6.3 |
9.7 |
8.7 |
15.2 |
India |
21.7 |
6.0 |
16.6 |
0.2 |
0.0 |
0.0 |
3.8 |
8.4 |
4.4 |
Indonesia |
3.0 |
2.3 |
1.6 |
0.4 |
0.0 |
0.0 |
0.9 |
0.1 |
0.7 |
Malaysia |
1.8 |
0.7 |
4.0 |
0.0 |
0.0 |
0.1 |
0.4 |
0.5 |
3.0 |
Philippines |
2.2 |
0.2 |
0.3 |
0.0 |
0.0 |
0.0 |
0.0 |
0.3 |
0.0 |
Thailand |
0.8 |
0.4 |
0.1 |
0.0 |
0.0 |
0.0 |
0.0 |
0.1 |
0.0 |
Europe |
|
|
|
|
|
|
|
|
|
Hungary |
0.2 |
0.0 |
1.2 |
0.0 |
0.0 |
0.0 |
0.0 |
1.2 |
0.0 |
Poland |
0.5 |
1.2 |
2.8 |
0.0 |
0.6 |
0.0 |
0.2 |
0.4 |
2.2 |
Russia |
29.6 |
2.9 |
1.0 |
0.0 |
0.0 |
0.0 |
0.2 |
0.5 |
0.3 |
Latin America |
|
|
|
|
|
|
|
|
|
Argentina |
1.8 |
0.0 |
0.0 |
0.0 |
0.0 |
0.0 |
0.0 |
0.0 |
0.0 |
Brazil |
39.2 |
10.4 |
18.2 |
2.3 |
0.0 |
1.0 |
4.9 |
3.0 |
9.3 |
Chile |
0.3 |
0.0 |
0.0 |
0.0 |
0.0 |
0.0 |
0.0 |
0.0 |
0.0 |
Mexico |
2.1 |
2.1 |
1.6 |
0.0 |
0.0 |
0.0 |
0.0 |
1.6 |
0.0 |
Source: IMF, GFSR, October 2009, April 2010. |
3.29 Overall, emerging market equity valuations
lost about 50 per cent between May 2008 and end-
November 2008. The Emerging Market Bond Index Global (EMBIG) spread widened by more than 400
basis points, and yields on long-term domestic
bonds declined by 60 basis points. Risk aversion,
repatriation of foreign capital and, in some cases,
falls in commodity prices have weighed down on
equity prices in EMEs (Table 3.6). Such effects have
also weighed down on a range of EME currencies
against the US dollar.
Table 3.5 : Stock Market Changes -Select Countries |
(per cent) |
Country |
June-December 2008 |
December 2008-
December 2009 |
1 |
2 |
3 |
Emerging Asia |
|
|
China |
-36 |
76 |
Hong Kong |
-37 |
49 |
India |
-33 |
80 |
South Korea |
-35 |
49 |
Latin America |
|
|
Argentina |
-49 |
115 |
Brazil |
-44 |
82 |
Mexico |
-24 |
46 |
Advanced Economies |
|
|
Japan |
-37 |
20 |
Euro area |
-33 |
24 |
USA (S&P 500) |
-34 |
25 |
Source: The Economist, various issues. |
3.30 Amidst the decline in equity prices, there
was a significant decline in global stock market
turnover in 2008, though the decline was more
pronounced in the case of emerging market
economies compared to the advanced economies.
Moreover, the decline was sharper during the last
two quarters of 2008 than in the earlier quarters.
3.31 In line with the decline in turnover, the
market capitalisation of major stock exchanges,which started declining from the first half of 2008,
continued the same trend till the first quarter of
2009. However, with the improvement of the
general health of the global stock markets, there
are indications that market capitalisation began to
recover from the second quarter of 2009. Despite
substantial recovery, stock market capitalisation
remained lower than the 2007 level, for most of the
emerging economies at the end of 2009 (Table 3.7).
Table 3.6: Performance of Emerging Equity Prices |
(August 29, 2008 to March 16, 2009) |
Country |
CDS Spread
(Basis Points) |
Changes in Equity Prices
(Per cent) |
1 |
2 |
3 |
EM Asia average |
205 |
-18.7 |
EM Europe average |
524 |
-47.6 |
Latin America average |
563 |
-27.6 |
Africa/Middle East average |
217 |
-43.0 |
Source: IMF, Global Financial Stability Report, April 2009. |
Table 3.7: Cross-Country Stock Market Capitalisation |
(US $ billion) |
Country |
1990 |
2000 |
2005 |
2006 |
2007 |
Jun-08 |
Sep-08 |
Dec-08 |
Mar-09 |
Jun-09 |
Sep-09 |
Dec-09 |
1 |
2 |
3 |
4 |
5 |
6 |
7 |
8 |
9 |
10 |
11 |
12 |
13 |
Americas |
|
|
|
|
|
|
|
|
|
|
|
|
US |
311 |
3,597 |
3,604 |
3,865 |
4,014 |
3,175 |
2,904 |
2,249 |
2,168 |
2,590 |
3,026 |
3,239 |
Mexico |
41 |
125 |
239 |
348 |
398 |
414 |
329 |
234 |
197 |
265 |
308 |
352 |
Asia - Pacific |
|
|
|
|
|
|
|
|
|
|
|
|
Australia |
108 |
373 |
804 |
1,096 |
1,298 |
1,361 |
926 |
684 |
665 |
888 |
1,188 |
1,262 |
India |
NA |
NA |
553 |
819 |
1,819 |
1,020 |
885 |
647 |
610 |
992 |
1,187 |
1,307 |
Malaysia |
48 |
113 |
181 |
236 |
325 |
270 |
217 |
189 |
181 |
231 |
261 |
286 |
Sri Lanka |
1 |
1 |
6 |
8 |
8 |
7 |
6 |
4 |
5 |
7 |
8 |
10 |
Hong Kong |
83 |
623 |
1,055 |
1,715 |
2,654 |
2,096 |
1,615 |
1,329 |
1,307 |
1,825 |
2,059 |
2,305 |
Indonesia |
8 |
27 |
81 |
139 |
212 |
195 |
155 |
99 |
100 |
156 |
201 |
215 |
Japan |
2,929 |
3,157 |
4,573 |
4,614 |
4,331 |
4,043 |
3,334 |
3,116 |
2,611 |
3,204 |
3,413 |
3,306 |
Korea |
110 |
148 |
718 |
834 |
1,123 |
898 |
656 |
471 |
507 |
622 |
807 |
835 |
Philippines |
7 |
25 |
40 |
68 |
103 |
70 |
70 |
52 |
55 |
68 |
79 |
86 |
China |
NA |
NA |
286 |
918 |
3,694 |
2,106 |
1,776 |
1,425 |
1,863 |
2,329 |
2,250 |
2,705 |
Singapore |
34 |
155 |
257 |
384 |
539 |
485 |
349 |
265 |
249 |
368 |
445 |
481 |
Thailand |
21 |
29 |
124 |
140 |
197 |
181 |
139 |
103 |
98 |
140 |
172 |
177 |
Europe - Africa - Middle East |
|
|
|
|
|
|
|
|
|
|
|
|
Spain |
111 |
504 |
960 |
1,323 |
1,781 |
1,715 |
1,222 |
948 |
831 |
1,089 |
1,322 |
1,435 |
Italy |
149 |
768 |
798 |
1,027 |
1,073 |
867 |
663 |
522 |
418 |
532 |
680 |
656 |
Hungary |
NA |
12 |
33 |
42 |
46 |
41 |
32 |
18 |
14 |
21 |
29 |
30 |
Turkey |
19 |
70 |
162 |
162 |
287 |
192 |
188 |
118 |
110 |
165 |
216 |
234 |
South Africa |
137 |
131 |
549 |
711 |
828 |
748 |
535 |
483 |
445 |
608 |
709 |
799 |
London |
850 |
2,612 |
3,058 |
3,794 |
3,852 |
3,309 |
2,565 |
1,868 |
1,676 |
2,198 |
2,614 |
2,796 |
Poland |
NA |
31 |
94 |
152 |
212 |
182 |
146 |
91 |
69 |
93 |
123 |
151 |
Austria |
26 |
30 |
126 |
199 |
236 |
198 |
118 |
76 |
72 |
91 |
119 |
114 |
Source: World Federation of Exchanges. |
3.32 From a sectoral perspective, both in the euro
area and in the United States, stock prices of the
financial industry suffered the heaviest losses between
December 2007 and December 2008, declining by about
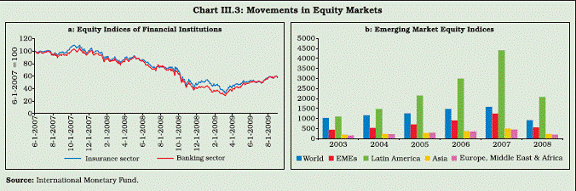
57 per cent and 51 per cent, respectively (Chart III.3).
Stock prices of the non-financial sector also fell
significantly, decreasing by around 41 per cent in the
euro area and 36 per cent in the United States . There
appears to have been greater initial contagion effects across financial stocks than total stocks in EMEs,
perhaps reflecting the reliance of some of their
financial institutions on external funding. A marked
decline in the stock market performance of banks and
finance companies in emerging East Asia relative to
the overall stock market index reflected fears that
banks in emerging East Asia could incur substantial
losses in the aftermath of the crisis as economic
growth slows. In general, most indexes of listed banks
and finance companies on the Asian stock markets
have performed below overall market indexes since
August 2007.
 |
3.33 In early 2009 the deteriorating global
economic outlook as well as renewed concerns
about the health of the financial system led to further
declines in matured economy stock prices. Between
the end of 2008 and February 27, 2009, the Dow
Jones EURO STOXX and the Standard & Poor’s 500
indices declined by around 17 per cent and 19 per
cent, respectively. In the second half of 2009,
however, the matured economies’ stock prices
posted some recovery with major stock indices in
Japan, the euro area and the US gaining in the range
of 10-15 per cent between December 2008 and
October 2009. The Dow Jones Industrial Average
crossed the 10,000 mark for the first time in a year
on October 14, 2009 on the back of indications about
US economic recovery. Between December 31,
2009 and June 16, 2010, however, the stock indices
of Japan and Euro area declined by 5 per cent and
7 per cent, respectively, partly due to the uncertainty
in the euro area growth prospects.
3.34 In contrast, the EME stock markets
rebounded strongly in the first half of 2009, with
the MSCI (All Country) Asia ex-Japan Index rising
68 per cent over its November 2008 trough,
showing some return of risk appetite. During the
year 2009 till October, the composite stock market
index of China increased 66.4 per cent, perhaps
reflecting the effects of China’s huge fiscal stimulus
package. Despite the rebound across emerging
East Asian equity markets, they remained below
their levels at the beginning of 2008. Moreover,
notwithstanding stock market recoveries, financial
share prices have performed less favourably than
overall market indices. India’s BSE crossed the 17,000 mark after a gap of 16 months (for the first
time since May 2008) on September 30, 2009. As
per the latest available trend, some of the emerging
market stock indices recorded a decline over
December 2009. For example, stock indices of
China, Hong Kong and Brazil declined by 22 per
cent, 8 per cent and 6 per cent, respectively,
between end-December 2009 and June 11, 2010,
while the others recorded marginal gains.
Corporate Bond Market
3.35 Corporate bond issuance from the EMEs
declined sharply during the financial crisis amidst
heightening of spreads, from the second half of
2008. In contrast, the corporate bond markets of
advanced economies exhibited relative resilience
during the crisis.
Advanced Economies
3.36 In the advanced economies, disruptions to
non-financial corporate bond markets had been
less severe than those seen in the credit or housing
market during the recent financial crisis. However,
there had been episodes of volatility in issuance
and widening of spreads during periods of
increased uncertainty in the global financial markets
(Chart III.4). Overall, US corporate bond issuance
has been much less affected than the US mortgage
market, though there are reports that lower-rated
firms have faced some difficulties in raising funds
in bond markets during the crisis.
Emerging Market Economies
3.37 In recent years, cross-border corporate bond
issuance in the form of Initial Public Offerings (IPOs)
from some EMEs such as China, Brazil and Russia
has rivalled developed economies in terms of their
scale. Since the onset of the financial turmoil,
international corporate bond issuance from EMEs
fell sharply on account of both demand and supply
factors (Table 3.8 and Chart III.4). On the demand
side, firms might have decided to delay issuance in
the hope of a return of more normal conditions in
the coming months. Second, firms may have had
access to other funds and, therefore, were reluctant to issue bonds into a relatively illiquid market. On
the supply side, there may have been some
reluctance to lend, as there was a desire by lenders
to hoard liquidity in the face of uncertainty. In such a
situation, lower-rated firms became most vulnerable to the global reassessment of risk, which often rely
on raising funds in external markets where investors
are generally more willing to bear the risk.
Table 3.8: Emerging Market Bond Issuance-Select Countries |
(US $ billion) |
Region |
2007 |
2008 |
2009 |
1 |
2 |
3 |
4 |
Latin America |
|
|
|
Argentina |
3.4 |
0.1 |
0.5 |
Brazil |
9.9 |
6.7 |
10.1 |
Chile |
0.3 |
0.1 |
3.0 |
Mexico |
6.3 |
4.5 |
15.5 |
Emerging Europe |
|
|
|
Hungary |
4.1 |
5.3 |
3.0 |
Poland |
4.1 |
3.8 |
10.2 |
Russia |
30.2 |
22.1 |
10.8 |
Asia |
|
|
|
China |
2.1 |
2.1 |
3.3 |
India |
7.5 |
1.4 |
2.2 |
Indonesia |
1.8 |
4.2 |
5.5 |
Malaysia |
0.9 |
0.4 |
0.1 |
Philippines |
1.0 |
0.4 |
5.4 |
Thailand |
0.8 |
0.5 |
- |
Source : IMF, GFSR, April 2010. |
3.38 Emerging market bond spreads reached
historical highs during the recent financial crisis,
touching their peaks following the collapse of Lehman
Brothers in September 2008 and continued to remain
at elevated levels in the first and second quarters of
2009. The spreads, however, narrowed down
substantially during the third and fourth quarters of
2009, with the pick up in the corporate bond isssuance
from the emerging market economies (Table 3.9).
3.39 During the second half of 2009 the corporate
bond markets functioned more normally, which is
critical for countries like the United States that rely
heavily on non-bank market financing. Corporate
credit and asset-backed spreads had tightened
significantly and issuance had risen as firms seek
alternatives to scarce bank credit. High-end issuance
had also increased though still restricted to higherquality
credit, and spreads remained historically wide
(IMF, GFSR Update, July 2009). In line with tentative
signs of improvement in economic conditions, corporate bond issuance increased for most of the
emerging market economies of Latin America and
Asia in 2009, though some of the economies of
emerging Europe, like Hungary and Russia have
experienced some moderation (Table 3.8).
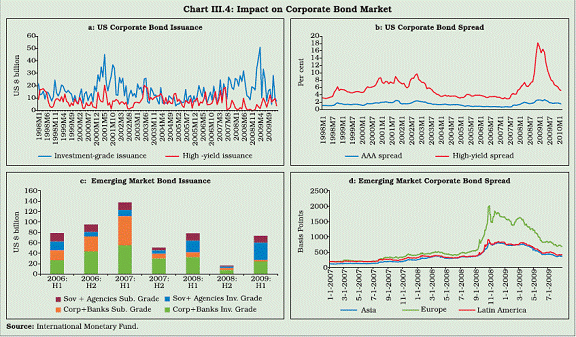 |
Table 3.9: Emerging Market Bond Spreads – Select Countries |
(basis points) |
Region |
2007 |
2008 |
2009 |
2008 |
2009 |
Q1 |
Q2 |
Q3 |
Q4 |
Q1 |
Q2 |
Q3 |
Q4 |
1 |
2 |
3 |
4 |
5 |
6 |
7 |
8 |
9 |
10 |
11 |
12 |
Latin America |
|
|
|
|
|
|
|
|
|
|
|
Argentina |
410 |
1704 |
660 |
581 |
614 |
953 |
1704 |
1894 |
1062 |
784 |
660 |
Brazil |
220 |
429 |
189 |
283 |
227 |
333 |
429 |
424 |
282 |
234 |
189 |
Chile |
151 |
343 |
95 |
176 |
177 |
223 |
343 |
286 |
161 |
139 |
95 |
Mexico |
172 |
434 |
192 |
193 |
194 |
275 |
434 |
441 |
280 |
234 |
192 |
Emerging Europe |
|
|
|
|
|
|
|
|
|
|
|
Hungary |
84 |
504 |
186 |
163 |
134 |
174 |
504 |
540 |
373 |
220 |
186 |
Poland |
67 |
314 |
124 |
112 |
115 |
169 |
314 |
319 |
219 |
148 |
124 |
Russia |
157 |
805 |
203 |
208 |
197 |
388 |
805 |
630 |
418 |
299 |
203 |
Asia |
|
|
|
|
|
|
|
|
|
|
|
China |
120 |
228 |
64 |
154 |
137 |
191 |
228 |
210 |
122 |
87 |
64 |
Indonesia |
275 |
762 |
230 |
329 |
381 |
490 |
762 |
742 |
433 |
295 |
230 |
Malaysia |
119 |
370 |
136 |
144 |
153 |
194 |
370 |
344 |
167 |
174 |
136 |
Philippines |
207 |
546 |
206 |
273 |
303 |
324 |
546 |
432 |
324 |
265 |
206 |
Source: IMF, GFSR, October 2009, April 2010. |
Impact on Government Bond Markets
3.40 Government bond markets all over the world
were characterised by large swings in yields during
the crisis period, driven mainly by direct and indirect
consequences of the intensified financial crisis. During
the recent crisis, due to declines in confidence levels
and increases in counterparty risks, investors sought
their way out mainly in the government instruments
which at a certain point had a negative yield.
Advanced Economies
3.41 Amid high day-to-day volatility, long-term
government bond yields in the euro area and the
United States declined markedly, largely reflecting
investors’ ongoing preference for highly liquid and
safe securities, significant reductions in monetary
policy rates, and eventually sharp downward
revisions in the market’s outlook for economic
activity and inflation.
3.42 As the crisis deepened, with continued decline
in yields in government securities, a number of measures were announced both in the US and the
euro area that aimed at supporting the financial
system, strengthening consumer confidence,
sustaining economic activity and ensuring credit
availability for households and the corporate sector.
Despite these measures, the declining trends in longterm
government bond yields continued as investors
shifted from stocks and other risky assets to sovereign
bonds. In the US, the decline in bond yields was more
pronounced than in Europe as US government bonds
were viewed, on average, as being more liquid than
euro area government bonds. At the end of 2008, euro
area and US ten-year government bond yields stood
at around 3.6 per cent and 2.2 per cent, respectively,
which were 75 and 184 basis points lower than the
levels prevailing a year ago (Chart III.5).
Emerging Market Economies
3.43 Within EMEs, generally, CDS spreads
tended to rise earlier in countries with some
external vulnerabilities or where governments rely
on external debt financing or have lost some market
confidence (Table 3.10). In the EMEs, until August
2008, sovereign debt bond spreads generally rose
proportionately with CDS spreads, implying that
repricing of risk was an important factor driving the
rise in bond spreads over this period.
Table 3.10: Sovereign External Borrowings in
Emerging Europe |
Country |
Loans in foreign currency
(per cent of total loans) |
Increase in CDS Spreads
(basis points) |
1 |
2 |
3 |
Czech Republic |
9.1 |
276 |
Hungary |
61.9 |
451 |
Poland |
34.0 |
320 |
Latvia |
88.4 |
756 |
Estonia |
85.3 |
588 |
Bulgaria |
56.3 |
502 |
Lithuania |
64.0 |
670 |
Source: IMF, WEO April 2009. |
3.44 Since September 2008, however, spreads
have risen sharply in the EMEs, reflecting a rise in
global risk aversion that partly stemmed from
concerns that slowing growth and financial turmoil
in developed economies would increasingly spill
over into EMEs. However, in contrast to developed
economies, risk spreads for many EMEs remained
below levels previously reached during periods of
financial crisis in these economies.
Later on
3.45 Sovereign yield curves steepened
considerably as conventional monetary policy easing
anchored short-term rates, while the longer end of
the curve rose sharply, reflecting in part improved
recovery prospects, and reduced risk of deflation.
With public debt levels expected to rise significantly
in many mature market economies, increased focus
on fiscal sustainability may have been reflected in
sovereign credit default swap spreads remaining well above their pre-crisis levels (GFSR, July 2009
update, IMF). There has been a decline in sovereign
debt spreads which has been driven almost entirely
by improved global risk appetite and core market
liquidity, whereas domestic economic fundamentals
continued to deteriorate in many countries through
the second quarter of 2009. More recently, some
fundamentals have started to turn around, such as
the external balance and official reserves, as well
as growth prospects.
3.46 Bond yield curves shifted upward and also
steepened in most of the emerging East Asian
markets in the first half of 2009. The upward movement
and steepening of the yield curves could be due to
several factors, including (i) additional market liquidity
as governments issued new debt to finance fiscal
stimulus; (ii) expectations that the new liquidity could
add to future inflationary pressures; and (iii) improved
investor expectations about economic recovery. In
China and Korea, where economic growth has been
strong, there has been a significant upward shift and
a slight steepening in the bond yield curves. In
Malaysia and Thailand, concerns about the size of
fiscal deficits may have caused the yield curves to
steepen significantly as well as pushing them upward.
Recent Developments
3.47 Sovereign credit risk premiums have more
recently widened across mature economies with fiscal
vulnerabilities. Sovereign bond markets of some
European economies came under renewed stress
following the debt crisis in Greece. The rising investor concerns were mirrored in the Greek bonds and credit
default swap markets. The possible loss of the ECB
funding source pushed up CDS premia and yield
spreads in Greek sovereign bonds. Yield spreads
widened when the acute fiscal problems surfaced in
Portugal and Spain. The spreads of Greek long-term
sovereign bonds over German bonds rose to more
than 650 basis points on April 27, 2010. In May, 2010,
the EU and the IMF reached an agreement to assist
Greece out of the crisis. The measures have been
well received by the global financial markets so far,
as reflected in terms of various indicators of the credit,
government securities, and equity markets.
Impact on Foreign Exchange Market
Advanced Economies
3.48 Development in the forex market during the
current financial crisis is a by-product of the
developments in other financial markets such as
money and credit markets which have tightened since
August 2007. In the period immediately following the
onset of the crisis, some pressures were noted in the
foreign exchange swap markets, movements in which
are generally guided by covered interest parity
conditions. However, after the onset of the financial
turmoil, there was a divergence between actual US
dollar LIBOR rates and the implied US dollar rate from
the LIBOR of the euro, pound and yen converted by
the relevant foreign exchange swap, suggesting
pressures in obtaining US dollar funding. Over time,
spillovers emerged in the longer-term cross-currency
basis swap markets as well (these are generally used
for foreign currency obligations of one year or more),
as it was perceived that dollar funding requirements
were likely to persist. With the deepening of the crisis,
US dollar funding once again became scarce in
markets outside of the US, particularly in Europe, as
reflected in the significant widening of the spread. To
alleviate the demand for dollars from overseas, the
Federal Reserve had significantly expanded its swap
operations with other major central banks.
3.49 The increase in volatilities in the foreign
exchange markets, in line with other markets,
reduced the attractiveness of carry trade positions
during the financial turmoil. Until early September
2008, the volatility of the currencies of the G-7 had been greater than that of EME currencies. Carry
trades involve investors borrowing in a low-yielding
currency and using the proceeds to invest in a highyielding
one. The strategy implicitly relies on
expectations that exchange rate movements will not
fully compensate for the interest differential. However,
volatility in markets raises the risk and reduces the
rewards of carry trades. Carry trade positions have
been partially unwound since the onset of the
financial turmoil, and may have been a factor in some
share market movements or currency movements
for the destination countries, which generally have
relatively high nominal interest rates – for example,
Brazil, Colombia, Hungary, Iceland, Indonesia,
Turkey and South Africa. On the other side of the
transactions, appreciation pressures have been seen
at times in some funding currencies (which are
primarily developed economy currencies), especially
the Japanese yen (IMF, GFSR, April 2009).
3.50 Among the advanced economies, the
Japanese yen in real effective terms exhibited an
appreciating trend, while the euro and the pound
sterling depreciated during the initial period of the
crisis (Chart III.6). Sharp appreciation of the real
effective value of the yen since late 2007 has
depressed Japan’s exports. In contrast, the tradable
sector in the UK has benefited from a substantial
reduction in the effective value of the sterling. A real
depreciation of the euro also helped euro area
exports in 2008, but the exchange rate appreciated
during the first quarter of 2009. In the United States,
however, the dollar’s appreciation during the second
half of 2008 and the first quarter of 2009 implied
that the exchange rate, on balance, has become
more neutral in the evolution of trade over the past
year. In nominal terms, both the euro and the pound
sterling depreciated strongly against the US dollar
betweeen March 2008 and March 2009, while the
Japanese Yen appreciated against the US dollar
during the same period. All these currencies,
however, experienced nominal appreciation against
dollar between March 2009 and February 2010.
Emerging Market Economies
3.51 Developments in the foreign exchange
markets of the EMEs broadly reflected the developments in their equity markets. Capital outflows
during 2008 and early part of 2009 significantly
weakened currencies in some countries, notably India,
Korea, New Zealand, and Vietnam. Several countries have responded by intervening to support their
currencies, in contrast to the past several years when
most Asian countries were concerned about the rapid
appreciation of their currencies (Table 3.11).
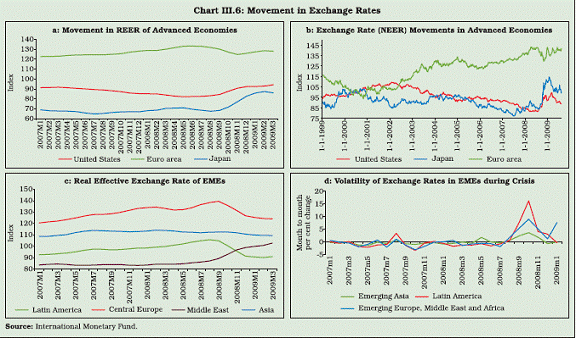 |
Table 3.11: Exchange Rates: Appreciation (+)/Depreciation (-) of Currencies against the US dollar |
(per cent) |
Currency |
end-March
2007 over
end-March
2006 |
end-March
2008 over
end-March
2007 |
end-August 08 over end-end-March 2008 |
end-March
2009 over
end-August
2008 |
end-March
2009 over
end-March
2008 |
end-Feb.
2010 over
end-March
2009 |
1 |
2 |
3 |
4 |
5 |
6 |
7 |
Euro |
10.7 |
19.0 |
-7.4 |
-9.3 |
-16.0 |
1.4 |
Pound Sterling |
13.7 |
2.0 |
-9.1 |
-21.4 |
-28.6 |
6.1 |
Japanese Yen |
-0.2 |
17.5 |
-8.2 |
11.2 |
2.0 |
9.9 |
Chinese Yuan |
3.8 |
10.1 |
2.8 |
-0.1 |
2.6 |
0.1 |
Russian Ruble |
6.7 |
10.6 |
-4.3 |
-27.7 |
-30.8 |
13.6 |
Turkish Lira |
-2.9 |
5.3 |
11.0 |
-29.3 |
-21.6 |
8.4 |
Indian Rupee |
2.3 |
9.0 |
-8.7 |
-14.1 |
-21.5 |
10.2 |
Indonesian Rupiah |
-0.5 |
-1.1 |
0.7 |
-20.9 |
-20.4 |
24.0 |
Malaysian Ringgit |
6.6 |
8.5 |
-5.9 |
-7.1 |
-12.6 |
7.0 |
South Korea Won |
3.3 |
-5.0 |
-9.1 |
-21.3 |
-28.4 |
19.4 |
Thai Baht |
11.0 |
11.2 |
-7.8 |
-3.8 |
-11.3 |
7.3 |
Argentine Peso |
-0.6 |
-2.2 |
4.7 |
-18.6 |
-14.9 |
-4.4 |
Brazilian Real |
5.9 |
17.1 |
7.4 |
-29.4 |
-24.2 |
-27.6 |
Mexican Peso |
-1.2 |
3.6 |
5.5 |
-29.2 |
-25.3 |
11.5 |
South African Rand |
-14.7 |
-10.1 |
5.1 |
-18.8 |
-14.7 |
23.1 |
3.52 The real effective exchange rates of Asian,
Latin American and Central European currencies
appreciated during the financial crisis till August
2008. Subsequently, real effective exchange rates
(REER) have depreciated in line with the nominal
depreciation in the exchange rate of these
currencies against the US dollar (Table 3.12). The
depreciations were in part the consequence of the
strengthening of the US dollar with respect to the
most important currencies of the world, a decline
in the worldwide demand for Asian and Latin
American exports, and strong negative pressures
in the financial markets of the region. For the Middle
East countries, however, the REER remained
largely flat till October 2008 and their currencies
have appreciated thereafter.
Later on
3.53 With the exception of Argentina and Brazil,
the currencies of almost all the emerging market
economies have reversed their decline and
strengthened against the US dollar since the second
quarter of 2009. In emerging Asia, the Indonesian
rupiah, the Korean won, the Indian rupee and the
Malaysian ringgit appreciated by 24.0 per cent, 19.4
per cent, 10.2 per cent, and 7.0 per cent, respectively,
against the US dollar between end-March 2009 and
end February 2010. Moreover, most Asian countries
have strengthened their external positions – they are
running current account surpluses, maintaining large
foreign reserves, and diversifying exports to
withstand the recession-induced unprecedented fall in their exports. There is clear evidence of recovery
in capital flows to the EMEs, particularly, China and
India. This has resulted in a appreciation of the
currencies of most of the emerging market
economies in the real effective terms since the
beginning of 2010. With further reform in renminbi
exchange rate regime announced on June 19, 2010,
the exchange rate of many EMEs appreciated.
Table 3.12: Movement of Real Effective Exchange Rates of Select Emerging Countries |
(Base: 2005=100) |
Period |
India |
China |
Brazil |
Russia |
S.Korea |
Thailand |
Mexico |
Indonesia |
Singapore |
1 |
2 |
3 |
4 |
5 |
6 |
7 |
8 |
9 |
10 |
2006-07 |
98 |
102 |
112 |
112 |
107 |
111 |
99 |
117 |
102 |
2007-08 |
106 |
106 |
125 |
118 |
103 |
115 |
98 |
113 |
103 |
2008-09 |
98 |
118 |
122 |
122 |
79 |
113 |
92 |
107 |
108 |
2009-10 |
97 |
117 |
134 |
118 |
79 |
112 |
87 |
114 |
108 |
2008 |
|
|
|
|
|
|
|
|
|
August 2008 |
102 |
115 |
140 |
125 |
89 |
112 |
103 |
116 |
107 |
September 2008 |
99 |
119 |
128 |
126 |
82 |
112 |
100 |
117 |
107 |
October 2008 |
96 |
123 |
111 |
127 |
72 |
113 |
87 |
112 |
108 |
November 2008 |
97 |
124 |
111 |
132 |
70 |
112 |
87 |
99 |
110 |
December 2008 |
94 |
121 |
104 |
125 |
71 |
109 |
86 |
101 |
110 |
2009 |
|
|
|
|
|
|
|
|
|
January 2009 |
95 |
121 |
110 |
113 |
72 |
110 |
83 |
103 |
109 |
February 2009 |
95 |
126 |
111 |
105 |
69 |
111 |
79 |
99 |
109 |
March 2009 |
91 |
125 |
112 |
114 |
69 |
112 |
80 |
100 |
108 |
April 2009 |
93 |
122 |
116 |
108 |
75 |
112 |
86 |
105 |
107 |
May 2009 |
94 |
120 |
122 |
117 |
78 |
112 |
86 |
109 |
108 |
June 2009 |
95 |
116 |
128 |
119 |
77 |
113 |
85 |
110 |
107 |
July 2009 |
95 |
116 |
129 |
115 |
77 |
112 |
85 |
111 |
108 |
August 2009 |
95 |
117 |
134 |
112 |
77 |
112 |
86 |
112 |
108 |
September 09 |
94 |
117 |
135 |
115 |
78 |
111 |
83 |
112 |
107 |
October 09 |
96 |
115 |
140 |
117 |
79 |
111 |
84 |
115 |
108 |
November 09 |
98 |
113 |
141 |
120 |
80 |
111 |
85 |
115 |
108 |
December 09 |
99 |
115 |
140 |
118 |
80 |
111 |
88 |
116 |
108 |
2010 |
|
|
|
|
|
|
|
|
|
January 2010 |
102 |
114 |
140 |
121 |
83 |
113 |
89 |
120 |
109 |
February 2010 |
102 |
118 |
138 |
122 |
82 |
114 |
89 |
120 |
108 |
March 2010 |
105 |
116 |
142 |
131 |
84 |
116 |
92 |
121 |
109 |
April 2010 |
107 |
116 |
145 |
123 |
86 |
117 |
94 |
123 |
111 |
May 2010 |
108 |
120 |
144 |
131 |
83 |
119 |
90 |
123 |
112 |
Note : Data are on trade-based weights derived from manufacturing trade flows, and capture both direct bilateral trade and third-market
competition by double-weighting.
Source : Bank for International Settlements and Reserve Bank of India. |
Impact on Commodity Market
Pre-Lehman: Rising Commodity Prices
3.54 The impact of the financial crisis on the
commodity market has been indirect through changes
in demand and supply of various commodities at
various stages of the crisis. During the initial stages
of the financial turmoil, commodity prices were pushed
higher as investors sought to hedge against a
depreciating US dollar and higher inflation. With the
deepening of the financial crisis, as uncertainties and
risk aversion in financial markets increased, investors
switched to commodity markets. This reinforced a
build-up of the commodity price bubble up to July-
August 2008. The price of oil nearly tripled from US$
50 in early 2007 to over US$ 140 in July 2008. Brent
crude oil prices peaked on July 11, 2008 at US$ 147.5
per barrel. The case was similar with many other
commodities which recorded multi-year peaks during
the first half of 2008 (Chart III.7).
Post-Lehman: Declining Commodity Prices
3.55 The deepening of the financial turmoil since
the collapse of Lehman Brothers in September 2008
and deteriorating global economic prospects ended
the commodity price boom. The magnitude and
volatility of price changes rose to unprecedented
levels in the case of certain commodities. By the end
of 2008, the IMF primary commodity price index had
declined by almost 55 per cent from its peak in July
2008. Brent crude prices declined to around US$ 40
per barrel on account of lower demand due to the
economic slowdown. OPEC’S decision to cut supply
by a sizable portion failed to prevent prices from
falling, amid expectations of an expansion in OPEC
production capacities in 2009 and 2010 when new
fields are expected to come online (ECB Annual
Report, 2008). For the year as a whole, however,
the average price of Brent crude oil was US$ 98 per
barrel during 2008, which was 35 per cent above
the average of the previous year.
3.56 Like oil, the prices of non-energy
commodities were volatile throughout 2008. During
the second half of 2008, as energy prices started
to decline, non-energy commodity prices followed.
Metal prices, which started to decline in 2007,
dropped more sharply in the second half of 2008
and in early 2009. Food prices have also fallen,
although not as dramatically as oil prices because
of their relatively weak link to global growth.
3.57 After bottoming out in February 2009,
commodity prices recorded sharp recovery thereafter.
By the end of 2009, the IMF commodity price index
had risen more than 40 per cent from its trough, mainly
due to large increase in the petroleum and metal
prices (Table 3.13). Petroleum prices strengthened
with improved global economic and financial
conditions. The sharp price rebound in metal was
mainly driven by stronger than expected recovery in
the emerging economies (China in particular), as well
as sustained cut in production.
Impact on Housing Market
Advanced Economies
3.58 The decline in US home prices was the most
important trigger for the market turmoil which has persistently affected many mature economy
financial systems since August 2007. In most euro
area countries, the deceleration in property price
inflation, which characterised 2007, continued in
2008 with prices (including commercial property
prices) even falling in some countries. On the
positive side, the deceleration in the growth of loans
to the household sector and a decline in house price
inflation contributed to a moderation of the risks.
However, a less favourable outlook for the labour
market and for households’ disposable income
points to a possible emergence of risk in the ability
of households to service their debts (Box III.1).
Table 3.13: Movement in Global Commodity Prices |
(Real commodity price indices monthly average 1990-99=100) |
|
December
2009 |
Peak
March
2008 |
Trough
February
2009 |
Average
2000-09 |
1 |
2 |
3 |
4 |
5 |
Commodity Price Index |
172.1 |
230.6 |
123.2 |
133.6 |
Nonfuel |
106.2 |
131.4 |
85.2 |
89.0 |
Food |
97.4 |
122.7 |
88.9 |
82.6 |
Beverages |
120.1 |
110.7 |
99.6 |
77.6 |
Industrial Inputs |
114.2 |
143.7 |
79.4 |
97.6 |
Agricultural Raw Materials |
73.8 |
77.7 |
58.9 |
75.2 |
Metal |
162.3 |
222.3 |
103.9 |
124.3 |
Fuel |
271.9 |
380.9 |
180.7 |
201.1 |
Crude Oil |
283.5 |
392.6 |
161.5 |
203.3 |
Source : IMF, WEO, April 2010. |
Emerging Market Economies
3.59 Housing prices in emerging Asia have not
experienced the sharp decline witnessed in the US
or EU (Chart III.8). The declines in emerging Asian
housing prices have been moderate and are
nowhere near as pronounced as those seen in the
region’s equity markets. Intuitively, property prices
are determined by local conditions and there is
much less scope for contagious effects from
industrialised countries, in particular the US.
3.60 To sum up, almost all segments of the global
financial markets experienced tremors of the
financial crisis, though to varying degrees. The
interbank market was one of the first financial
market segments to be affected by the crisis. The
interbank markets of the mature economies
suffered from a severe liquidity crisis as banks became reluctant to lend to one another for fear of
counterparty risks. Later, the crisis spread to the
money markets taking the form of abnormal level
of spreads, shortening of maturities, and
contraction, or even closure, of some market
segments. The sharp slowdown in credit growth
worked as a channel for transmitting the crisis from
financial institutions to the real economy,
particularly in the advanced economies where
banks seek to reduce leverage and rebuild capital
bases. Global stock markets, particularly the
emerging stock markets, have borne much of the
heat of the crisis as equity markets all over the world
witnessed high volatility and sharp declines in
prices, turnover volumes and market capitalisation.
During the second half of 2009, however, there have
been some signs of recovery in the health of global
stock markets. Commodity markets have also
witnessed significant corrections since the second
half of 2008 following the adverse impact of the
crisis. Government bond markets all over the world
witnessed large swings in yields driven mainly by
the direct and indirect consequences of the
intensified financial crisis. Corporate bond markets
of advanced economies exhibited relative resilience
during the current financial crisis even though
corporate bond issuance from the EMEs declined
significantly amid heightening of spreads, since the
second half of 2008.
3.61 Policy interventions on an unprecedented
scale, encompassing quantitative and credit
easing policies, extraordinary liquidity measures
and government guaranteed funding programs
have helped restore normalcy in the functioning
of short-term money market, equity and corporate
bond markets and the foreign exchange market.
Credit growth on the other hand, continued to
remain sluggish in most of the advanced
economies and some of the emerging market
economies reflecting both supply and demand side
weaknesses. While commodity prices started
gaining strength with the global economic
recovery, sovereign bond markets have come
under pressure in some of the mature market
economies, with weak fiscal fundamentals.
Box III.1
Impact of Declining Asset Prices on Household Wealth
Over the past few years, a combination of factors, like
the asset price boom, robust economic growth, rapid
financial innovation and low interest rates generated
speculative bubbles in the matured economies, which
encouraged banks, other financial institutions, households
and firms to leverage their balance sheets by increasing
their borrowings. Therefore, during the financial crisis,
once asset prices started to decline, high debt burdens
turned out to be unsustainable, especially as subdued
activity began to limit economic growth. This led to a sharp
deterioration in household wealth, among others which,
in turn, emerged as a key factor leading to the sharp
downturn in economic growth.
In the aftermath of the sub-prime crisis, the wealth effect
of asset prices and its relevance in conditioning consumer
behaviour and decisions relating to consumption and
saving have assumed major policy significance. Within
asset prices, the decline in equity prices and nominal
house prices had the most pronounced impact on
household wealth. Declining house prices impact
household wealth from both directions. While declining
asset prices have a direct negative impact on household
wealth, falling house prices imply a reduction in the implicit
rental cost of housing, offsetting some of the negative
wealth effects. Moreover, lower prices make houses more
affordable for prospective homeowners, reducing their
need to save for a given down payment. However, during
the current financial crisis, in general, these positive
effects could not offset the negative impact of declining
asset prices on household wealth.
Overall, from the second quarter of 2007 to the fourth
quarter of 2008, US households lost around 20 per cent
(about US$ 13 trillion) of their net worth; as a percentage
of disposable income; this loss was greater than the
wealth accumulated over the previous five years. Wealth
losses in the euro area have also become more
widespread across assets and countries. Decline in
household wealth, particularly in the matured market
economies due to erosion of asset prices, had direct
implication for consumption expenditure. The economic
literature suggests that consumption expenditure of
households depends on a number of factors, including
real interest rate, income uncertainty, growth rate of nonproperty
income, liquid assets, illiquid financial assets,
and housing wealth (Muellbauer 2008). The impact of
wealth contraction on consumer expenditure is likely to
vary across countries depending on institutional
arrangements. Although researchers disagree on the
estimates of the wealth effect on consumption, the impact
of housing wealth is generally assumed to be significant – ranging in several studies between 3 and 7 cents per
dollar in Australia, Canada, the United States and the
United Kingdom. It is assumed to be relatively small for
the euro area. Equity extraction from housing wealth was
significant in Australia, Canada, the United Kingdom and
the United States during the upswing, so household
spending is likely to be more affected in these countries
than in others. Some estimates suggest that in the United
States about 1.75 per cent of consumption annually was
financed through home equity withdrawals during 2001–
05, or 3 per cent if withdrawals used to repay nonmortgage
debts are included. In the United Kingdom,
home equity withdrawal has reversed, plummeting from
over 7 per cent of post-tax income in 2003 to –1 per cent
in 2008. By contrast, equity extraction played a relatively
minor role in household spending in the euro area as a
whole because of both a low home ownership ratio and,
in some countries, a less developed mortgage market.
With consumption deteriorating faster than income,
household saving rates increased in several advanced
economies, particularly in those where they had been low.
The United States recorded a sharp rise in savings of
almost 4 percentage points of disposable income (to 4.2
per cent) between the last quarter of 2007 and the first
quarter of 2009. Australia and the United Kingdom also
saw a jump in household savings, from almost zero and
a negative saving rate in the first quarter of 2008 to 8.5
per cent and 4.8 per cent, respectively, in the fourth
quarter. The propensity to save of euro area households
also increased markedly, with the saving rate rising by 1
percentage point (to 15.1 per cent) in the final quarter of
2008. In addition, the steep decline in the value of pension
fund assets may force individuals nearing retirement, who
have defined contribution pension schemes in which
benefits are linked to the market value of assets, to
increase saving or defer retirement. In the case of defined
benefit plans, the large funding gaps could harm the
financial position of the corporations sponsoring them and
reduce their ability to provide guaranteed benefits or
maintain existing employment.
References
1. Bank for International Settlement. 2009. 79th Annual
Report.
2. European Central Bank. 2009. ECB Annual Report
2008.
3. Muellbauer, John. 2008. “Housing, Credit and
Consumer Expenditure.” CEPR Discussion Paper No.
6782. April.
II. IMPACT ON FINANCIAL SYSTEM
3.62 As discussed in the previous chapter, the
flawed institutions and practices of the New
Financial Architecture – characterised by a globally
integrated system of giant bank conglomerates and
the ‘shadow banking system’ comprising investment
banks, hedge funds and bank-created Special
Investment Vehicles – were possible factors behind
the recent financial crisis. Naturally, therefore, the
recent financial crisis had the most severe impact
on financial institutions, particularly of the advanced
economies. The crisis has brought to the forefront
the major weaknesses inherent in the US financial
system and the regulatory framework that did not
recognise the systemic risks posed by the ‘shadow
banking system’ and the build-up of housing and
credit bubbles. Over time, the ‘shadow banking’
institutions became almost as important as
commercial banks in providing credit to the US
economy, but were not subject to the same
regulatory controls. On the other hand, these
entities were vulnerable because they borrowed
short term in liquid markets to purchase long-term,
illiquid and risky assets. Moreover, these institutions
as well as certain regulated banks had also
assumed significant debt burdens and did not have
a financial cushion sufficient to absorb large loan
defaults or MBS losses. All these factors together
made the US financial system increasingly fragile
and vulnerable to crisis.
3.63 At the onset of the crisis, as the US real
estate bubble burst, rapid devaluation of mortgagerelated assets led to massive write-downs on
financial institution balance sheets, eroding their
capital base. Disruption in the credit markets
subjected them to rapid deleveraging and sell-off
of their long-term assets at depressed prices. This
gave rise to mounting losses on the balance sheet
of the financial institutions. The collapse of two Bear
Stearns funds in June 2007 marked the onset of
the sub-prime crisis. The crisis, however, turned
worse in September 2008 when, within a few days,
Lehman Brothers filed for bankruptcy, Merrill Lynch
was bought by Bank of America, and American
International Group (AIG) received a rescue
package from the US Federal Reserve (US Fed).
This was accompanied by the failure of a number
of significant financial institutions. These
developments resulted in unprecedented policy
interventions including large bailouts by the US
government and central banks, which led to
dramatic changes in the US financial landscape.
3.64 The pressure built up in the US financial
system spread rapidly to Europe. In Europe, one
of the first victims of the crisis was the British bank,
Northern Rock, which had to request security from
the Bank of England. This led to investor panic
and a bank run in mid-September 2008. In Europe,
apart from the UK, the crisis was also transmitted
rapidly to the euro area, which had deep financial
linkages with the US. Many banks as well as other
financial institutions in the euro area, such as
insurance companies and asset managers, had
large exposures to US assets. Many of them were over-leveraged and depended on benign conditions
for liquidity to continue flowing. As a result, with
the onset of the crisis in the second half of 2007,
financial institutions including large and complex
banking groups (LCBGs) in the euro area started
getting affected. For LCBGs, financing became
more expensive and difficult to access, thereby
adding pressures on these institutions to reduce
the size of their balance sheets (ECB Financial
Stability Report, December 2008). As early as
September 2007, companies and non-banking
financial institutions accelerated their withdrawal
even from the short-term financing of banks, and
the banks were increasingly losing confidence in
extending loans to one another, leading to a rapid
rise in the costs of financing. As a result, credit to
the real sector almost stopped and many of the
institutions were only able to make overnight
borrowings.
3.65 With limited direct exposures to riskier
assets and derivatives, financial sectors in most
EMEs were not impacted severely, although a
decline in investor confidence led to fears of bank
vulnerabilities in the case of some EMEs. This
prompted authorities in those EMEs to take
measures such as implementing deposit
guarantees and making liquidity available to
domestic banks to reassure depositors and
counterparties. The banking system in emerging
Europe was more vulnerable as it relied significantly
on funding from external banks and from bond
issuance. In these countries, lower-rated banks were
exposed the most to drying up of external finance.
Impact on Banks
3.66 The report of the London Summit, 2009
identified three distinct phases through which the
banking industry has been affected by the current
financial crisis. In the first phase, market
participants realised that they had underestimated
the risks associated with a number of structured
loans. Demand for these products fell sharply,
driving down their prices. As no bank knew which
other bank was more exposed to these assets, they
became wary of lending to each other. In the second
phase of the crisis, banks started announcing losses made on structured loans and other impaired
assets. These losses, combined with deteriorating
macroeconomic conditions in the advanced
economies, turned uncertainty about the value of
impaired assets into concerns about the solvency
of a number of banks. In the third phase, the failure
of the large US investment bank, Lehman Brothers,
triggered a sharp intensification of the crisis. Banks
stopped trusting each other and their customers
stopped trusting their banks. There was loss of
confidence in the international financial system.
Starting with the UK’s recapitalisation plan in
October 2008, a large number of governments
adopted policies that restored trust in the banking
system. In this phase, however, bank losses were
more closely connected to borrowers’ defaults
owing to deteriorating macroeconomic performance
Bank losses in Asia were the least, reflecting limited
direct exposures to impaired assets and relatively
sound macroeconomic fundamentals (Chart III.9).
Commercial Banks
3.67 During the current crisis, the pro-cyclicality
in banking, i.e., lowering of lending standards in
an upturn and tightening of lending standards in a
downturn, was exposed. The profitability of banks
plunged in 2008 owing to the realisation of losses
on mark-to-market (securities) portfolios, the progressive deterioration of loan books as the
economic slump deepened, and increases in
operating costs. Although the decline in bank profits
was a global phenomenon, the way banks have
been affected by the crisis has differed somewhat
according to the circumstances in their respective
home markets (Table 3.14).
Advanced Economies
3.68 The pre-tax profits of US banks more than
halved in 2008 compared with the previous year.
There was a surge in US bank failures in 2008
during which a total of 25 deposit-taking institutions
failed; their combined assets were US$ 372 billion,
about 10 times higher than during the previous peak
in bank failures in 1993 (Chart III.10). The failure
of Washington Mutual alone accounted for US$ 307
billion of the total and was the largest US bank
failure in history. The bank was eventually absorbed
by JPMorgan Chase, another large bank, with the
assistance of the supervisory authorities. Besides
the failed banks, the number of institutions on the
US deposit insurer’s list of problem banks swelled
to 252 with total assets of around US$ 159 billion.
Further large bank failures were averted as
weakened institutions were acquired by others with
healthier balance sheets.
3.69 In Europe, profits plummeted across the
board with banks in the UK, Switzerland and the Netherlands registering net losses from their
exposure to structured finance investments. The
slowdown in real estate markets posed large
challenges to banks in Spain, Ireland and the UK.
Certain German banks were also affected by real
estate exposures, albeit mainly indirectly through
securities positions and exposures to commercial
property. In Germany, the crisis led to the
restructuring of the domestic banking sector as it
acted as a catalyst for a number of bank mergers
(ECB Annual Report, 2008). French and Italian banks were less affected by losses on structured
finance investments given their stronger focus on
the domestic retail market. A number of European
lenders averted outright bankruptcy through direct
support from the public sector. As a manifestation
of the global financial crisis, the market
capitalisation of the euro area’s large and complex
bank groups (LCBGs) collectively dropped by
almost Euro 200 billion between mid-September
and late November 2008, bringing the cumulative
decline since the turmoil erupted to around Euro
450 billion, which is more than half the aggregate
market value of these banks immediately prior to
August 2007.
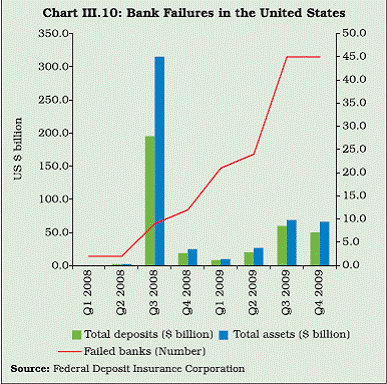 |
Table 3.14: Profitability of Major Banks as a Percentage of Total Average Assets |
|
Pre-tax profits |
Loan loss provisions |
Operating costs |
|
2006 |
2007 |
2008 |
2006 |
2007 |
2008 |
2006 |
2007 |
2008 |
1 |
2 |
3 |
4 |
5 |
6 |
7 |
8 |
9 |
10 |
Australia |
1.5 |
1.4 |
1.0 |
0.1 |
0.1 |
0.3 |
1.6 |
1.4 |
1.5 |
Canada |
1.2 |
1.1 |
0.5 |
0.1 |
0.1 |
0.2 |
2.4 |
2.3 |
2.0 |
France |
0.7 |
0.4 |
0.1 |
0.1 |
0.1 |
0.2 |
1.2 |
1.2 |
1.2 |
Germany |
0.4 |
0.3 |
-0.4 |
0.1 |
0.1 |
0.2 |
1.0 |
0.9 |
1.2 |
Italy |
1.1 |
0.9 |
0.3 |
0.3 |
0.3 |
0.4 |
2.2 |
2.0 |
2.3 |
Japan |
0.5 |
0.3 |
0.1 |
0.0 |
0.1 |
0.2 |
0.5 |
0.6 |
0.7 |
Netherlands |
0.5 |
0.3 |
-0.8 |
0.1 |
0.1 |
0.3 |
1.1 |
1.0 |
1.3 |
Spain |
1.4 |
1.4 |
1.1 |
0.3 |
0.4 |
0.5 |
1.8 |
1.8 |
1.9 |
Sweden |
1.0 |
0.9 |
0.7 |
-0.0 |
0.0 |
0.1 |
1.0 |
1.0 |
1.00 |
Switzerland |
0.8 |
0.4 |
-1.9 |
0 |
0.0 |
0.1 |
1.5 |
1.8 |
2.6 |
UK |
0.9 |
0.7 |
-0.1 |
0.3 |
0.2 |
0.4 |
1.6 |
1.4 |
1.3 |
US |
1.7 |
1.0 |
0.4 |
0.2 |
0.5 |
1.1 |
3.0 |
3.3 |
3.4 |
Source: Bank for International Settlement (2009), 79th Annual Report, 2008-09. |
3.70 Having put the loan problems of the
previous decade behind them, Japanese banks
were thought to be in a position to gain from the
weaknesses of their international competitors. In
the initial months of 2008, the Japanese banking
industry showed relative resilience to the financial crisis mainly because of smaller exposures to subprime
and structured products. However, with the
progress of the crisis, the profitability of Japanese
banks turned poor, partly because of their structurally
narrow net interest margins. Consequently, their
capital base weakened. Moreover, any plans for
international expansion were put on hold in the
second half of 2008 when the domestic economy
fell into recession and losses intensified.
3.71 In sum, during the initial phase of the crisis,
banks mostly faced funding pressures and markto-
market losses. As the macroeconomic situation
worsened from September 2008, financial
institutions faced increasing pressure on earnings
and mounting losses on their credit risk exposures
(Table 3.15). Bank losses witnessed a shifting
pattern in line with the evolution of the crisis. Initially
bank losses/write-downs were closely linked to
traded portfolios of structured finance products and
securitised exposures to the sub-prime mortgage market. Losses were exacerbated by illiquidity in
the markets for those instruments, which led to
substantial reductions in their mark-to-market
valuations. While there was considerable
uncertainty about the magnitude of the losses and
their distribution across the system, they were
perceived as being contained within a certain class
of assets. At a later stage, bank losses/write-downs
became more directly linked to a surge in borrower
defaults and to anticipated defaults, as evidenced
by the increase in the amount and relative importance
of provisioning expenses on account of slowdown in
economic activity. Loan loss provisions as a fraction
of bank assets were higher in 2008 than in previous
years. Compared with 2007, the rate at least
doubled for Australian, French, Swiss and US banks
and jumped even higher in the case of German,
Dutch and Swedish lenders.
Table 3.15 : Banking Indicators – Select Countries |
Region |
Banks’ Provision to Non-Performing Loans
(per cent)
|
Bank Return on Assets
(per cent) |
2007 |
2008 |
2009 |
Latest |
2007 |
2008 |
2009 |
Latest |
1 |
2 |
3 |
4 |
5 |
6 |
7 |
8 |
9 |
Latin America |
|
|
|
|
|
|
|
|
Argentina |
129.6 |
131.4 |
123.0 |
November |
1.5 |
1.6 |
2.4 |
November |
Brazil |
181.9 |
189.0 |
156.0 |
October |
2.9 |
1.5 |
1.2 |
October |
Chile |
210.2 |
179.9 |
177.5 |
December |
1.1 |
1.2 |
1.2 |
December |
Mexico |
168.9 |
161.2 |
163.8 |
September |
2.7 |
1.5 |
1.2 |
September |
Emerging Europe |
|
|
|
|
|
|
|
|
Hungary |
64.8 |
58.9 |
51.2 |
September |
1.2 |
0.8 |
1.1 |
September |
Poland |
- |
61.3 |
50.2 |
September |
1.7 |
1.6 |
1.2 |
September |
Russia |
144.0 |
118.4 |
94.8 |
December |
3.0 |
1.8 |
0.7 |
December |
Asia |
|
|
|
|
|
|
|
|
China |
39.2 |
116.4 |
155.0 |
December |
0.9 |
1.0 |
1.1 |
June |
Hong Kong SAR |
78.4 |
71.5 |
68.3 |
September |
1.9 |
1.8 |
1.6 |
September |
India |
56.1 |
52.6 |
- |
March |
0.9 |
1.0 |
1.0 |
March |
Indonesia |
104.5 |
118.6 |
127.4 |
April |
2.8 |
2.3 |
2.6 |
September |
Korea |
205.2 |
146.3 |
125.2 |
September |
1.1 |
0.5 |
- |
December |
Malaysia |
77.3 |
89.0 |
93.3 |
November |
1.5 |
1.5 |
1.2 |
September |
Philippines |
81.5 |
86.0 |
91.4 |
September |
1.3 |
0.8 |
1.1 |
September |
Singapore |
115.6 |
109.1 |
91.0 |
September |
1.3 |
1.0 |
1.1 |
September |
Thailand |
86.5 |
97.9 |
- |
December |
0.1 |
1.0 |
- |
December |
Advanced Economies |
|
|
|
|
|
|
|
|
Australia |
181.8 |
74.8 |
68.0 |
September |
1.0 |
0.7 |
0.6 |
June |
Canada |
42.1 |
34.7 |
59.1 |
September |
0.8 |
0.4 |
0.4 |
September |
Japan |
78.3 |
83.2 |
83.2 |
September |
0.3 |
-0.2 |
0.2 |
September |
United States |
91.7 |
75.3 |
58.1 |
December |
0.8 |
0.0 |
0.1 |
December |
Source: IMF, GFSR, April 2010. |
Emerging Market Economies
3.72 Although the banking sector of most EMEs
remained sound, a decline in investors’ confidence
led to fears of bank vulnerability in some of the
EMEs. Moreover, the significant presence of foreign
banks within many EMEs, particularly in Europe
and Latin America, raised a further potential source
of contagion during periods of financial stress.
Banks in emerging Europe relied heavily on
external financing, with the foreign banking sector
being an important conduit for funds. Banks in Asia
remained relatively resilient.
3.73 The relative resilience of emerging Asia’s
banking and financial systems during the current
financial crisis reflects a number of factors: (i) the
Asian financial system was bank-dominated and
banks generally had not invested in the illiquid
assets, which were at the heart of the current
financial crisis; (ii) Asian financial institutions had
limited exposure to US sub-prime mortgages and
structured credit products mainly on account of the
more cautious risk management and the
strengthening of the regulatory structure that
resulted both from Japan’s banking crisis in the late
1990s and the 1997 financial crisis in emerging Asia
(Table 3.16); (iii) relatively strong bank balance
sheets with a return to profitability, as impaired loans from the 1997/98 Asian financial crisis have
been worked off; (iv) improvements in risk and
liquidity management; (v) strengthening of
supervisory and regulatory systems; and (vi) moves
by banks into new and profitable domestic business
lines, such as consumer lending. The move into
consumer lending implies an absence of the strong
search for yield that led many banks and other
financial institutions in industrialised countries to
take on too much leverage and risk (Asian
Development Bank, 2009).
Table 3.16: Select Asian Banks with Exposure to Lehman Brothers |
Bank |
Economy |
Exposure
(US $ million) |
1 |
2 |
3 |
Citibank (Hong Kong, China branch) |
Hong Kong, China |
275 |
Mega Financial |
Taipei, China |
200 |
Industrial and Commercial |
China |
152 |
Bank of China |
|
|
Banco de Oro |
Philippines |
134 |
Bank of China |
China |
129 |
Bangkok Bank |
Thailand |
101 |
Bank of Nova Scotia (Singapore branch) |
Singapore |
93 |
Development Bank of the Philippines |
Philippines |
90 |
Shin Kong Fin |
Taipei, China |
80 |
Metropolitan Bank and Trust Company |
Philippines |
71 |
Source: ADB Outlook 2009. |
3.74 Asian banks had limited exposures to US
sub-prime mortgages and a very small percentage
of the write-downs reported globally since the subprime
debacle originated in Asia, the bulk of which
were concentrated in Japan and to a lesser extent
in China. Meanwhile, Asian banks have raised large
amounts to boost their capital positions. The new
capital not only replenished depleted amounts, but
also cushioned against potential losses arising from
future problematic loans.
3.75 Banks across the Asian region also held
generally comfortable domestic currency liquidity
cushions. During the current global crisis, a lower
loan-to-deposit ratio (less than 1) in the case of
many countries implied an absence of liquidity risk
arising from foreign liabilities (Table 3.17). Loanto-
deposit ratios across the region, with the
exception of Korea, have been rather conservative and many banking systems report high ratios of
short-term assets to liabilities. These cushions
reflect the increased attention to liquidity management since the 1997-98 crisis along with
relatively subdued levels of lending to the corporate
sector in recent years. Various indicators suggest
the overall soundness of the region’s banking
systems in terms of profitability and operational
efficiency. Some pressures on domestic currency
liquidity were, however, seen in a number of
countries during the later stage of the crisis.
Table 3.17: Bank Ratios |
(as of Q2 of 2008) |
|
Ratio of Loans to Domestic
Deposits |
Ratio of Loans to
Total Liabilities |
Ratio of
Foreign Liabilities to Domestic Deposits |
1 |
2 |
3 |
4 |
China |
0.72 |
0.71 |
0.01 |
India |
0.95 |
0.94 |
- |
Hong Kong |
0.54 |
0.30 |
0.80 |
Korea |
1.40 |
1.15 |
0.22 |
Singapore |
0.85 |
0.51 |
0.68 |
Taipei, China |
0.79 |
0.71 |
0.10 |
Indonesia |
0.78 |
0.73 |
0.06 |
Malaysia |
1.08 |
0.94 |
0.13 |
Philippines |
0.57 |
0.50 |
0.14 |
Thailand |
1.05 |
1.00 |
0.07 |
Vietnam |
1.04 |
0.96 |
0.09 |
Source: ADB Economics Working Paper Series No.139. |
3.76 In view of the emphasis on strengthening
capital requirements in recent years, the riskweighted
capital adequacy ratios (CRAR) were
comfortable and continued to provide a strong capital
cushion to the banks in emerging Asia and Latin
America (Table 3.18). This was true even in Korea
where the banking system was relatively more
vulnerable given the greater reliance on external
borrowing. During 2008, the ratio of non-performing
loans to total loans generally decreased in the Asian
economies, while it increased in advanced countries
perhaps reflecting the impact of the crisis. Within Asia, in countries like Hong Kong, Korea, Indonesia
and the Philippines, the ratio of non-performing loans
to total loans was comparatively higher in 2009; the
same trend was seen in emerging Europe.
Table 3.18: Banking Indicators – Select Countries |
Region |
Risk-Weighted Capital Adequacy Ratio
(per cent of risk-weighted assets) |
Non-Performing Loans
(per cent of Commercial Bank Loans) |
2007 |
2008 |
2009 |
Latest |
2007 |
2008 |
2009 |
Latest |
1 |
2 |
3 |
4 |
5 |
6 |
7 |
8 |
9 |
Latin America |
|
|
|
|
|
|
|
|
Argentina |
16.9 |
16.8 |
18.6 |
November |
2.7 |
2.7 |
3.1 |
November |
Brazil |
18.7 |
18.3 |
18.2 |
October |
3.0 |
3.1 |
4.5 |
October |
Chile |
12.2 |
12.5 |
14.3 |
December |
0.8 |
1.0 |
1.4 |
December |
Mexico |
15.9 |
15.3 |
15.9 |
September |
2.7 |
3.2 |
3.4 |
September |
Emerging Europe |
|
|
|
|
|
|
|
|
Hungary |
10.4 |
11.1 |
13.1 |
September |
2.3 |
3.0 |
5.9 |
September |
Poland |
12.0 |
10.8 |
13.1 |
September |
5.2 |
4.4 |
7.0 |
September |
Russia |
15.5 |
16.8 |
20.9 |
November |
2.5 |
3.8 |
9.6 |
December |
Asia |
|
|
|
|
|
|
|
|
China |
8.4 |
12.0 |
10.0 |
November |
6.2 |
2.4 |
1.6 |
December |
Hong Kong SAR |
13.4 |
14.8 |
16.6 |
September |
0.8 |
1.2 |
1.5 |
September |
India |
12.3 |
13.0 |
13.2 |
March |
2.5 |
2.4 |
2.4 |
March |
Indonesia |
19.3 |
16.8 |
17.5 |
October |
4.1 |
3.2 |
3.8 |
September |
Korea |
12.3 |
12.3 |
14.2 |
September |
0.7 |
1.1 |
1.5 |
September |
Malaysia |
13.2 |
12.7 |
14.6 |
November |
6.5 |
4.8 |
3.8 |
November |
Philippines |
15.7 |
15.5 |
15.8 |
September |
5.8 |
4.5 |
4.6 |
September |
Singapore |
13.5 |
14.7 |
16.5 |
September |
1.5 |
1.7 |
2.3 |
September |
Thailand |
14.8 |
13.8 |
—- |
December |
7.9 |
5.7 |
—- |
December |
Advanced Economies |
|
|
|
|
|
|
|
|
Australia |
10.2 |
11.4 |
11.7 |
September |
0.2 |
0.8 |
1.1 |
September |
Canada |
12.1 |
12.2 |
14.5 |
September |
0.7 |
1.1 |
1.2 |
September |
Japan |
12.3 |
12.4 |
14.3 |
September |
1.4 |
1.6 |
1.8 |
September |
United States |
12.8 |
12.8 |
14.3 |
December |
1.4 |
2.9 |
5.4 |
December |
Source: IMF, GFSR, April 2010. |
3.77 Like emerging Europe, some Latin American
EMEs had a large presence of foreign banks. Mexico
had a concentrated exposure with around 40 per cent
of its banking assets held by just two foreign banks.
However, in contrast to emerging Europe, many of
these foreign banks were locally funded, highly
profitable and contributed to overall group income.
Moreover, commercial banks in Latin America did
not invest to any significant degree in ‘toxic’ financial
instruments, but they had been hit by the sharp
contraction in external credit. The institutions in Latin
America were not exposed significantly to external
risks as they focused mainly on domestic markets,
which resulted in not incurring risks similar to
financial institutions in the advanced countries and
in emerging Europe. Latin America had also been
helped by the relatively small size of the national
financial systems and strong supervision and
prudential regulations (ADB, 2009).
Later on
3.78 Bank failures in the US continued in 2009
and 2010, even as the US economy showed
tentative signs of recovery. As per the records of
Federal Deposit Insurance Corporation (FDIC),
there are reports of 83 bank failures in the US in
the first half of 2010. Notwithstanding the bank
failures, confidence in the US banking system has
been bolstered by better-than-expected earnings,
a successful stress testing exercise, the
commitment by the US government to stand behind
the largest banks, and a series of bank capital
raising. However, the loss ratios continue to remain
high. In Europe, universal banks have also
benefited from better earnings and capital
increases. Given largely domestically-focused
business and relatively strong economic activities,
the profitability of emerging Asia’s banking systems
generally remained high and Asian banking and
financial systems weathered the financial turmoil
relatively well. Despite generally good profits and low non-performing loan ratios, increased signs of
stress in the financial sector emerged in a number
of Asian economies, largely due to falling income
from fees and commissions amid the economic
deceleration. Overall, however, the emerging Asian
banks continued to remain in good health till date.
3.79 In the recent months, some of the European
banks having exposure to euro area countries facing
market pressures (Greece, Ireland, Portugal and
Spain) have come under renewed stress. French and
German banks were particularly exposed to the
residents of those four countries, with a combined
exposure of US$ 958 billion at the end of 2009. Banks
headquartered in the United Kingdom, on the other
hand, had large exposures to Ireland (US$ 230
billion). Government debt, however, accounted for a
smaller part of euro area banks’ exposure to those
countries than claims on the private sector.
Investment Banks
3.80 The crisis has impacted the banking industry
as a whole, but investment banking seems to have
taken a more severe blow than commercial banks.
During the boom phase in 2004-07, the top five US
investment banks (Lehman Brothers, Bear Stearns,
Merrill Lynch, Goldman Sachs and Morgan Stanley)
significantly increased their financial leverage, which
increased their vulnerability to a financial shock.
These five institutions incurred over US$ 4.1 trillion
in debt for fiscal year 2007, which constituted about
30 per cent of US nominal GDP. The crisis left deep
scars on these institutions. The magnitude of their
losses reached very high levels as all lines of
business were affected. Securities underwriting
declined during 2008 as primary market issuance
slowed and associated revenues fell. In comparison,
the merger and acquisition advisory business held
up better, although it also slowed in the first quarter
of 2009. More generally, investment banking
operations were reduced across the board.
3.81 During the crisis, large holdings of highrisk
structured securities and unhedged exposures
in the securitisation pipeline were marked down
dramatically. The illiquidity of asset and funding
markets proved particularly challenging for the investment banks, which could no longer rely on
an increasing volume of transactions to generate
revenue growth or on cheap and readily available
short-term financing to support high levels of
leverage. As a result, firms’ balance sheets shrank
in size and employment in these institutions
declined radically. Staff strength at Bear Stearns
and Lehman Brothers were cut by more than half
as their operations were taken over by other
institutions. Decline in staff strength at other firms
broadly mirrored the size of their realised losses.
The net revenue for the largest investment banking
operations was estimated to have fallen by more
than 90 per cent in the third quarter of 2008
compared with the same period a year earlier, as
market activity seized up.
3.82 As a result of the deep impact of the crisis,
Lehman Brothers was liquidated, Bear Stearns
and Merrill Lynch were sold at low prices, and
Goldman Sachs and Morgan Stanley turned into
commercial banks, subjecting themselves to
more stringent regulation. With the exception of
Lehman Brothers, all these institutions required
or received government support. On the other
hand, Fannie Mae and Freddie Mac, the two US
government-sponsored enterprises, owned or
guaranteed nearly US$ 5 trillion in mortgage
obligations at the time they were placed into
conservatorship by the US government in
September 2008. These seven entities were
highly leveraged and it is estimated that they
together had US$ 9 trillion in debt or guarantee
obligations reflecting an enormous concentration
of risk, yet were not subject to the same
regulation as depository banks.
Insurance Funds
3.83 During the crisis, insurance companies
faced adverse conditions on both sides of their
balance sheet due to lower long-term interest rates
and asset price declines. The impact of the asset
market slump was reflected primarily in the
performance of financial asset portfolios of the
insurance companies. Insurance companies
suffered losses as prices fell across a broad array
of asset classes. For life insurance companies, the decline in the level of long-term yields also meant
an increase in liabilities on long-maturity policies.
3.84 The market capitalisation of insurance
companies came under similar pressures as banks
due to exposure to risky assets (notably, mortgagerelated
securities and commercial real estate loans)
and as a result of weakening macroeconomic
conditions. For the majority of insurance
companies, the main effect of the crisis has been
on their financial performance rather than on
premium income. The firms affected most by the
crisis were those involved in the provision of credit
risk insurance. Monoline insurers (more formally
known as Finance Guaranty Insurers), which
specialise in the provision of credit guarantees,
have been a conduit for contagion across markets
during the crisis. The protection that they offer is
dependent on their maintaining a high credit rating
(usually AAA). However, as losses mounted, credit
ratings of most monolines were downgraded, which
placed pressure on the ratings of all the debt that
they had insured, reflecting the higher probability
that investors will face losses. As the creditworthiness
of borrowers declined, concerns about the ability
of monoline insurers to honour their guarantees
mounted and led to significant mark-to-market
losses for banks that had purchased insurance.
3.85 Some global insurers continued to report
large losses during the second half of 2008, in
particular due to their insurance underwriting of
credit and structured credit products. The US
insurer, AIG, suffered heavy losses during the
second and third quarters of 2008. These troubles
led to rating downgrades in September 2008, which
forced the insurer to post collateral payments on
derivatives trades. AIG was unable to raise enough
capital to satisfy demands for collateral quickly
enough, which resulted in the Federal Reserve
Bank of New York offering AIG a two-year loan of
up to US$ 85 billion to give the ailing insurer the
opportunity to sell some of its assets in an orderly
fashion. In return, the US government received an
equity interest of 79.9 per cent in AIG. The nearcollapse
of AIG was directly linked to the
underwriting of credit risk. Its write-downs surged
along with soaring CDS spreads (Chart III.11). The
size of its liabilities and the central role its credit derivatives operation played as counterparty in the
over-the-counter market repeatedly necessitated
extraordinary official intervention to provide
substantial financial support.
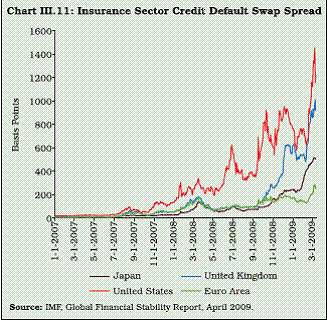 |
Hedge Funds
3.86 Hedge funds, along with institutional
investors, are considered to be a major channel of
financial transmission from advanced to emerging
market economies and they have been instrumental
in the development of local markets. Hedge funds,
in particular, have been important for providing
liquidity to financial markets in EMEs and facilitating
genuine hedging activities. Although hedge funds
had not played a central role in shaping the
dynamics of the crisis, they were also been severely
affected by the financial crisis. Hedge funds
performed very poorly during 2008 with almost all
investment strategies showing negative results as
returns in asset markets plummeted and the cost
of funding soared. As counterparties pressed for
increased transaction margins and investors
withdrew funds on an unprecedented scale, the
industry contracted sharply. Estimates of assets
under management shrank by more than one-third
in the course of the second half of 2008, with bad
performance and customer withdrawals playing an
equal role in the decline. A number of funds closed. Many fund managers attempted to preserve capital
by restricting withdrawals, thereby lengthening
investors’ effective lock-in period.
3.87 Outflows of foreign capital from emerging
equity markets and subsequent depreciation of their
currencies were attributed to unwinding of positions
by some global hedge funds (Table 3.19).
Interestingly, Asia-focused hedge funds have been
among the worst performers worldwide, with their
returns consistently below those of other emerging
market funds (Finance and Development, IMF,
December 2008).
3.88 On the positive side, the crisis is likely to
accelerate the trend towards greater
institutionalisation and transparency within the
hedge fund industry. It is already evident that to
avoid the fate of smaller funds that were liquidated
as a result of investor withdrawals, many larger
funds have oriented their marketing towards
institutional investors. Such a shift demands greater
transparency about the investment strategy and
greater scrutiny of risk management processes.
Responding to the challenges of the investment
environment, some of the larger funds introduced
lower fee schedules and processes that pay closer
attention to the needs of large institutional clients.
Finally, a number of official recommendations for
the reform of the prudential framework imply tighter
oversight of the industry. Such reforms include the
registration of all hedge funds, more demanding
reporting requirements for the larger funds and direct supervision of those whose operations have
implications for systemic stability.
Table 3.19: Emerging Market Hedge Funds |
(US $ billion) |
Year |
Net asset flows |
Estimated assets |
1 |
2 |
3 |
2002 |
-5.7 |
23.7 |
2003 |
3.4 |
34.2 |
2004 |
4.7 |
46.3 |
2005 |
5.3 |
55.1 |
2006 |
8.0 |
81.8 |
2007 |
9.1 |
116.7 |
2008 Q1 |
0.6 |
111.1 |
2008 Q2 |
1.0 |
122.7 |
2008 Q3 |
-2.6 |
90.4 |
2008 Q4 |
-6.7 |
67.0 |
Source: IMF estimates: GFSR April 2009. |
3.89 To sum up, financial institutions were the
worst sufferers of the financial crisis. With the onset
of the crisis, commercial banks suffered from a
decline in profitability and large mark-to-market
losses, which later gave rise to bank failures in the
US and other mature economies in Europe. The
banking system of the emerging market economies,
on the other hand, reflected relative resilience
during the crisis on account of their limited exposure
to the affected asset classes and the regulatory
and supervisory measures taken to strengthen their
balance sheets in the aftermath of the East Asian
crisis. The crisis almost sidelined the investment
banking industry, which was instrumental in
triggering the crisis. The crisis also heavily impacted
the financial performance of monocline insurers and
hedge funds and, in the case of the latter, the crisis
accelerated the trend towards greater
institutionalisation and transparency.
III. IMPACT ON THE EXTERNAL SECTOR
International Trade
Trade Openness
3.90 The volatilities in the financial markets along
with the slowdown in economic activities in the
advanced economies were transmitted to the EMEs
through both trade and financial channels on
account of the increased global integration
witnessed in recent years. Over the past quarter-century, the growth in world trade at about 6 per
cent was almost double the rate of world output.
As a result, the share of world trade in world GDP
increased and stood at over 53 per cent in 2008
(Chart III.12). Apart from trade liberalisation, this
can also be attributed to rapid developments in
financial markets which led to financialisation of
global trade. But the same developments also
widened the scope for economic turmoil when
global conditions deteriorated. For instance, trade
finance which is now being increasingly used for
financing trade was severely affected during the
crisis as the financial markets tumbled.
3.91 The rising importance of trade in the global
economy masks the underlying regional variations.
For example, Asian exports grew at an average rate
of above 10 per cent and those of Latin America
and the Caribbean by about 7 per cent, which are
higher than the world average of 6 per cent during
the past quarter-century. This led to increasing
openness of these economies as reflected in the
share of their trade in GDP (Table 3.20). The share
of international trade in developing countries’ output
grew from 35 per cent in 1980 to 57 per cent in
2007. The sharp increase in trade not only created
new markets for producers in the developing world
but also lowered prices for consumers. The growing
integration of developing economies with the global
economy and the increasing importance of their
firms and households in international finance over
the past decade have brought enormous economic
and financial benefits. But rising trade integration also widened channels through which a slowdown
in economic activity in advanced economies could
spread to the EMEs.
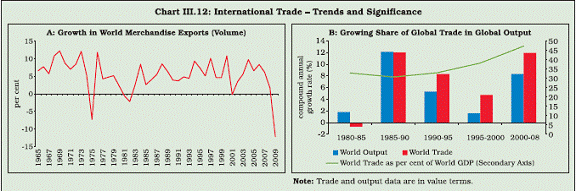 |
Table 3.20: Trade Openness – Select Countries |
(per cent of GDP) |
Region |
2001 |
2002 |
2003 |
2004 |
2005 |
2006 |
2007 |
2008 |
1 |
2 |
3 |
4 |
5 |
6 |
7 |
8 |
9 |
Latin America |
|
|
|
|
|
|
|
|
Argentina |
17.0 |
34.9 |
33.7 |
36.8 |
37.3 |
37.2 |
37.8 |
38.5 |
Brazil |
20.5 |
21.3 |
22.0 |
24.0 |
21.8 |
21.0 |
21.1 |
23.6 |
Chile |
50.6 |
50.5 |
53.5 |
58.0 |
60.7 |
64.4 |
68.2 |
73.2 |
Mexico |
48.6 |
47.0 |
47.9 |
50.7 |
51.4 |
53.1 |
54.0 |
55.1 |
Emerging Europe |
|
|
|
|
|
|
|
|
Czech Republic |
113.0 |
105.2 |
109.4 |
123.2 |
123.2 |
131.5 |
137.6 |
131.7 |
Poland |
47.8 |
50.8 |
58.9 |
66.9 |
64.3 |
70.8 |
72.4 |
71.8 |
Russia |
50.8 |
50.9 |
49.1 |
47.4 |
48.3 |
47.3 |
44.7 |
45.5 |
Asia |
|
|
|
|
|
|
|
|
China |
37.6 |
41.8 |
50.7 |
58.4 |
62.2 |
64.8 |
62.8 |
58.0 |
Hong Kong SAR |
234.2 |
247.7 |
287.0 |
319.4 |
330.1 |
341.8 |
343.7 |
349.9 |
India |
21.5 |
22.6 |
23.8 |
27.5 |
32.1 |
35.3 |
34.5 |
41.7 |
Indonesia |
57.3 |
48.5 |
44.1 |
47.2 |
54.7 |
48.7 |
47.1 |
49.9 |
Korea |
57.4 |
54.2 |
57.9 |
66.2 |
64.5 |
66.8 |
69.4 |
92.7 |
Malaysia |
169.8 |
167.2 |
167.2 |
181.2 |
181.5 |
181.5 |
169.5 |
N.A |
Philippines |
96.7 |
96.8 |
96.1 |
95.8 |
89.4 |
84.9 |
74.6 |
65.3 |
Singapore |
298.8 |
297.5 |
315.4 |
335.3 |
353.9 |
364.4 |
333.7 |
N.A |
Thailand |
101.8 |
97.0 |
101.7 |
111.1 |
122.1 |
116.9 |
111.6 |
121.7 |
Advanced Economies |
|
|
|
|
|
|
|
|
Australia |
34.1 |
32.8 |
29.6 |
30.0 |
31.9 |
34.4 |
33.2 |
37.9 |
Canada |
69.6 |
66.9 |
61.2 |
61.4 |
60.0 |
58.2 |
56.4 |
57.5 |
Japan |
17.0 |
17.8 |
18.7 |
20.5 |
22.9 |
26.4 |
28.6 |
29.6 |
United States |
18.2 |
17.5 |
17.8 |
19.3 |
20.4 |
21.5 |
22.1 |
23.5 |
Note: Trade openness is measured by the ratio of exports plus imports to GDP.
Source: 1. International Financial Statistics, IMF.
2. World Economic Outlook Database, IMF. |
3.92 During the recent financial crisis, the
evolution of international trade has mirrored that of
economic activity. International trade flows, which
had grown robustly in recent decades mainly on
account of waves of liberalisation, suddenly abated
by the end of 2008 and then strongly contracted in
some areas, further propagating the effects of the
crisis across countries. According to the IMF’s
estimates, world trade (goods and services)
contracted by 10.7 per cent in 2009 after recording
a subdued growth of 2.8 per cent in 2008 (Table
3.21). World trade volumes fell on three other
occasions after 1965 ( 0.2 per cent in 2001, 2.0
per cent in 1982, and 7.0 per cent in 1975), but
none of these episodes approached the magnitude
of decline observed in 2009. The decline in world trade volume was much higher than the earlier
plunge, showing the large impact of the recent
financial crisis through the increased integration of global trade across countries. According to the
World Trade Organisation (WTO), the year 2009
witnessed the sharpest decline of 12.2 per cent in
world trade in more than 70 years. Currently, world
trade is in a recovery phase and set to rebound in
2010 by growing at 9.5 per cent (WTO, 2010).
Table 3.21 : Developments in World Trade Volumes |
(per cent) |
Item |
2007 |
2008 |
2009 |
2010P |
2 |
3 |
4 |
5 |
World trade volume (goods and services) |
7.3 |
2.8 |
-10.7 |
7.0 |
Imports |
|
|
|
|
Advanced economies |
4.7 |
0.6 |
-12.0 |
5.4 |
Emerging and developing economies |
13.8 |
8.5 |
-8.4 |
9.7 |
Exports |
|
|
|
|
Advanced economies |
6.3 |
1.9 |
-11.7 |
6.6 |
Emerging and developing economies |
9.8 |
4.0 |
-8.2 |
8.3 |
Commodity prices (US dollars) |
|
|
|
|
Oil |
10.7 |
36.4 |
-36.3 |
29.5 |
Non-fuel (average based on world commodity export weights) |
14.1 |
7.5 |
-18.7 |
13.9 |
P : Projection.
Source: World Economic Outlook, April 2010, IMF. |
What Explains the Steep Fall in Trade?
3.93 The declines in trade flows since October
2008 were larger than in past slowdowns due to
several factors. First, the impact of the US sub-prime
crisis had its first-order impact on shortages of
liquidity in the advanced economies through the loss
of assets. With the loss of wealth, households in
the US and in European countries responded by
cutting their discretionary spending. This seems to
have had a particularly pronounced effect on
demand for manufactured goods. The contraction
in consumption demand along with investment
demand in the major economies led to a sharper
fall in the imports of the advanced economies.
These developments were reflected in the sudden
fall in exports from EMEs, particularly those where
a major portion of the exports were to crisis-hit advanced countries (Chart III.13). Second, the
decline in trade growth from October 2008 was due
not only to volume decline but also to sharp reductions
in prices in line with the decline in demand. This
decline in the EMEs’ export prices was sharper than
the fall in import prices of the advanced economies,
which was reflected in the large decline in EME
exports in value terms. Third, the sharp declines in
trade flows can be attributed to the increasing
presence of global supply chains in total trade; goods
cross many frontiers during the production process
and components in the final product are counted every
time they cross a frontier (WTO, 2009). Fourth, there
was a shortage of trade finance (discussed later). Fifth,
the rising tendency for protective measures could
contribute to trade contraction, although there is no
clear evidence on this count. Sixth, the decline in
spending on consumer durables in advanced
countries over the second half of 2008 has sharply
reduced EME exports of automobile and information
technology (IT) products. In the recent downturn, the
inventory-to-sales ratio of electronic goods had risen
sharply in East Asia, and their exports and production
had decreased.
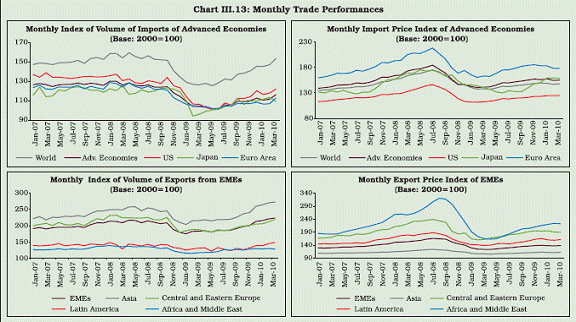 |
Impact across Regions
3.94 The impact of declining trade was felt
across all regions, although the extent varied
depending on the importance of manufacturing
exports in the economy (Chart III.14). Among
developed countries, Germany and Japan, for
instance, have been worse affected by their
declining exports of manufactures than other
countries. It is mainly the demand for investment
and durable consumer goods that was severely
affected. This is not only because the consumption
of such goods can be more easily deferred than
that of food and basic services, but also because
their acquisition partly relies on credit, which was
more difficult and costly to obtain. As a result,
countries that have a high share of investment and
durable consumer goods in their total output
experienced a larger fall in industrial production and
overall GDP growth than others. Australia and
Canada were also affected by a fall in commodity
prices. In Latin America, exports have fallen in all
countries, but the impact of the crisis has been
particularly strong in countries such as Mexico
where GDP was contracting rapidly since the last
quarter of 2008. Mexico relies heavily on exports
of manufactures to the United States, and they had
also been affected earlier and to a greater extent
than other countries due to lower income from
tourism and workers’ remittances.
3.95 Against the backdrop of increased global
integration and specialisation in manufacturing
production chains, developing economies in Asia experienced a strong contraction in economic
activity following the slowdown in advanced
economies (Box III.2). The synchronised fall in
exports intensified in the first quarter of 2009 with
an average year-on-year decrease of around 25
per cent in most EMEs (Table 3.22). In other Asian
countries, such as China, India and Indonesia,
declining exports of manufactures have had a less
dramatic effect on industrial output and GDP owing
to their large and still expanding domestic markets.
3.96 The global economy is now beginning to pull
out of the recession. Emerging Asia is leading the
global rebound and looks set to emerge from the
global downturn both faster and stronger than any
other region. This quick turnaround in Asia
benefited greatly from policy stimulus, and public
demand more than offset the drag from net exports.
Going forward, Asia will not be able to count on
strong external demand at least in the near term
as global recovery is expected to be sluggish. It is
essential to build the foundation of sustained growth
through infrastructure and financial development
and improvements in corporate incentives, rather
than relying too much on export demand. Further,
by developing or improving social safety nets and
healthcare systems, many emerging and
developing economies can boost domestic
consumption.
Trade in Services
3.97 The global financial and economic crisis has
also affected trade in services. The growth of world exports of transport, travel and other commercial
services decelerated from 20 per cent in 2007 to 12
per cent in 2008 (Table 3.23). Based on available
data, year-on-year global exports of commercial
services in the fourth quarter of 2008 fell by 7–8 per
cent (WTO, 2009). Exports of transport services rose
16 per cent in 2008, while travel services and other
commercial services increased by 11 per cent and
12 per cent, respectively. Maritime transport services reacted rapidly to the slowdown of global demand.
Data on the deployment of both dry and liquid bulk,
as well as on container ships, confirm an increasing
withdrawal of vessels from service. Accordingly, the
crisis led to reduced port traffic. In addition, freight
rates fell substantially during the final months of 2008.
After reaching a peak in May 2008, the Baltic Dry
Index plunged to its lowest level by the end of October
2008. The world export of commercial services declined by 13 per cent in 2009 with transportation
services contracting by 21 per cent.
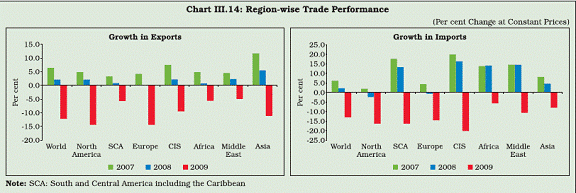 |
Box III.2
Why Asian Exports Were Worst Affected
East Asia has particularly benefited from trade liberalisation
as reflected in the export-led industrialisation in these
countries. This is perceived to have led to intra-regional
spillover effects, mainly emanating from technological
transfers through direct investment from Japan, and
indirectly from “hollowing out” of the industrial economies.
Each shift in the industrial focus of the Japanese economy,
from light to heavy electronics and hi-tech industries, created
market opportunities for other economies in the region such
as Korea and Taiwan. Even within the electronics industries,
mid-range goods gradually began to be supplied by Korea,
Taiwan, Singapore, and Malaysia, and only the most
sophisticated goods were produced in Japan. More recently,
as Korea, Taiwan and Singapore started specialising in the
heavy and hi-tech goods sectors, the light industries were
picked up by Thailand, the Philippines and Indonesia.
This sequence of industrialisation, often called the “flying
geese pattern”, succeeded in the East Asian economies in
passing on the comparative advantages in manufacturing
from a leader to the followers, and then to the followers’
followers. A sequential pattern of industrialisation was
observed from the agricultural sector to the industrial sector
with small capital requirements to heavy and petrochemical
industries, and to precision and electronics industries, with
latecomers repeating the changes in industrial composition.
High exports growth in the Asian countries has been possible
on the back of a strong domestic industrial sector which
created a base for sustainable growth. The value added in
the industrial sector during the high-growth phase exceeded
10 per cent (per annum) in these economies. Today, several
developing economies in Asia are part of a manufacturing
supply chain for exports to advanced economies. In some
of these countries, like Malaysia, the Republic of Korea,
Singapore, Taiwan and Thailand, exports of manufactures
represent a substantial share of their GDP.
On the back of rising manufacturing exports as well as strong
domestic fundamentals, the Asian region has become a
strong economic driver for the world with a rising share in
output, trade and reserves (Table). During the current crisis,
however, the abrupt deceleration in growth in Asia was more
rapid than in other regions, and in key countries even sharper
than at the epicentre of the global crisis due to the greater integration of these economies. In many ways, this severe
impact was unexpected. Asia is far from the epicentre of
the crisis, not just geographically but also in the sense that
it did not indulge in the financial practices that led to serious
problems in advanced economies’ banking systems.
Moreover, before the crisis, the region was in sound
macroeconomic shape, and thus in a strong position to resist
the pressures emanating from advanced economies.
Therefore, what explains the outcome contrary to
expectations? The answer lies in Asia’s exceptional
integration with the global economy. Much of Asia relies
heavily on technologically sophisticated manufacturing
exports for which demand had collapsed. At the same time,
Asia’s financial ties with the rest of the world have deepened
over the past decade, exposing the region to the forces of
global deleveraging.
Table: Developing Asia: The Emerging Economic
Driver of the World |
Year |
Share (%) in the World |
GDP |
Exports Imports |
Reserves |
1 |
2 |
3 |
4 |
5 |
1980 |
7.2 |
4.2 |
4.6 |
8.6 |
1985 |
8.6 |
4.9 |
5.9 |
15.2 |
1990 |
10.1 |
5.3 |
5.8 |
6.9 |
1995 |
13.5 |
8.2 |
8.8 |
12.3 |
2000 |
15.2 |
9.6 |
8.5 |
15.7 |
2005 |
18.3 |
12.7 |
11.9 |
27.1 |
2010/Latest |
22.9 |
14.5 |
13.3 |
33.8 |
Source: WEO database; IFS (IMF). |
Countries with a larger share of advanced manufacturing in
GDP experienced sharper output declines. The underlying
reason is that advanced manufacturing is more cyclically
sensitive than other items. Growth in Asian economies with
a lower share of manufacturing, such as commodity
exporters, initially held up better, although the collapse in
commodity prices hit them as well. The collapse in demand
has been transmitted through the integrated supply chain
with dramatic effects on intra-regional trade. The current
crisis vividly illustrates that Asia has not “decoupled” from
the global economy. Synchronised recession in advanced
economies has further complicated the matter during the
current crisis as against the experience in 1998 when the
decline in domestic demand was offset to some extent by
demand emanating from industrial economies.
Table 3.22: Trade Performance of Select Asian Countries |
(year on year per cent change) |
|
2007Q1 |
2007Q2 |
2007Q3 |
2007Q4 |
2008Q1 |
2008Q2 |
2008Q3 |
2008Q4 |
2009Q1 |
2009Q2 |
2009Q3 |
2009Q4 |
1 |
2 |
3 |
4 |
5 |
6 |
7 |
8 |
9 |
10 |
11 |
12 |
13 |
Export Growth
(in per cent) |
|
|
|
|
|
|
|
|
|
|
|
|
China |
28.0 |
27.5 |
26.2 |
22.2 |
21.3 |
22.4 |
23.3 |
4.4 |
-19.8 |
-23.5 |
-20.6 |
0.1 |
Hong Kong |
8.3 |
11.1 |
7.8 |
8.3 |
10.7 |
8.1 |
5.6 |
-1.8 |
-21.5 |
-12.4 |
-13.8 |
-2.0 |
India |
15.5 |
23.1 |
17.3 |
37.3 |
37.4 |
57.0 |
39.6 |
-8.4 |
-20.2 |
-34.9 |
-24.2 |
6.0 |
Indonesia |
14.5 |
14.6 |
8.7 |
18.4 |
29.2 |
27.9 |
26.9 |
-7.5 |
-29.7 |
-24.7 |
-17.9 |
21.6 |
Japan |
10.4 |
7.2 |
9.3 |
14.5 |
20.5 |
17.6 |
12.9 |
-10.0 |
-40.6 |
-33.9 |
-24.5 |
-1.0 |
Korea |
14.6 |
14.1 |
9.4 |
18.2 |
17.4 |
23.1 |
27.0 |
-9.9 |
-25.2 |
-21.1 |
-17.6 |
11.7 |
Malaysia |
7.6 |
7.8 |
6.9 |
16.1 |
19.2 |
28.9 |
21.4 |
-12.9 |
-28.9 |
-33.3 |
-26.4 |
10.1 |
Pakistan |
0.0 |
4.6 |
4.4 |
12.4 |
22.3 |
24.3 |
17.9 |
-7.3 |
-20.0 |
-23.9 |
-13.2 |
10.0 |
Philippines |
9.4 |
4.6 |
2.3 |
9.9 |
2.8 |
5.5 |
4.1 |
-22.3 |
-36.8 |
-28.9 |
-21.5 |
5.1 |
Singapore |
9.9 |
7.2 |
8.4 |
14.8 |
21.2 |
26.4 |
21.2 |
-13.9 |
-32.7 |
-30.8 |
-22.4 |
11.8 |
Sri Lanka |
13.0 |
12.5 |
12.1 |
12.1 |
11.5 |
11.1 |
12.0 |
2.8 |
-9.3 |
-22.7 |
-13.7 |
-5.6 |
Thailand |
17.3 |
17.8 |
13.3 |
25.8 |
23.1 |
28.2 |
26.1 |
-10.7 |
-20.7 |
-26.2 |
-17.7 |
11.9 |
Import Growth
(in per cent) |
|
|
|
|
|
|
|
|
|
|
|
|
China |
18.2 |
18.3 |
20.5 |
25.3 |
28.9 |
32.7 |
25.7 |
-9.1 |
-30.9 |
-20.2 |
-11.7 |
22.7 |
Hong Kong |
8.3 |
12.1 |
8.9 |
10.6 |
11.8 |
9.4 |
6.9 |
-4.0 |
-22.4 |
-14.3 |
-9.9 |
3.4 |
India |
18.9 |
40.3 |
25.3 |
29.2 |
45.9 |
49.0 |
61.2 |
7.4 |
-25.8 |
-30.9 |
-34.8 |
1.2 |
Indonesia |
14.1 |
14.1 |
18.5 |
15.0 |
42.1 |
51.2 |
43.5 |
12.5 |
-35.7 |
-38.0 |
-29.5 |
-4.4 |
Japan |
4.5 |
4.1 |
4.8 |
16.0 |
25.6 |
28.4 |
32.6 |
6.1 |
-29.3 |
-35.6 |
-30.6 |
-15.0 |
Korea |
13.4 |
14.7 |
7.3 |
25.9 |
28.9 |
30.5 |
42.8 |
-9.0 |
-32.7 |
-35.6 |
-31.0 |
1.4 |
Malaysia |
12.4 |
8.2 |
8.0 |
19.7 |
15.8 |
17.3 |
14.4 |
-17.3 |
-36.9 |
-31.0 |
-22.6 |
11.8 |
Pakistan |
6.9 |
2.9 |
8.5 |
19.1 |
49.6 |
47.5 |
33.8 |
-6.5 |
-37.8 |
-27.3 |
-29.6 |
1.2 |
Philippines |
7.8 |
-0.7 |
8.5 |
13.9 |
24.1 |
12.1 |
10.4 |
-23.9 |
-33.6 |
-26.9 |
-28.9 |
-0.8 |
Singapore |
8.7 |
6.7 |
4.7 |
20.8 |
32.1 |
35.5 |
32.9 |
-9.1 |
-32.5 |
-33.6 |
-25.1 |
3.8 |
Sri Lanka |
3.2 |
4.4 |
9.1 |
23.1 |
38.0 |
34.3 |
29.4 |
-0.1 |
-30.3 |
-42.2 |
-32.8 |
-10.1 |
Thailand |
3.7 |
7.3 |
7.9 |
15.4 |
36.4 |
30.6 |
40.1 |
6.1 |
-36.9 |
-33.3 |
-28.0 |
0.3 |
Source: World Trade Organisation. |
3.98 Within services, tourism was severely
impacted by the crisis. International tourist arrivals
to EMEs declined by 2 per cent in the second half
of 2008, compared with an increase of 6 per cent recorded in the first half of the year. Data for
January and February 2009 indicate a roughly 8
per cent year-on-year fall. All regions have
registered negative growth, with the exception of
Africa, Central and South America. West Asia,
South Asia and Europe have been among the worst
affected regions, with declines of 28.2 per cent,
14.6 per cent and 8.4 per cent, respectively, during
2008. According to the world tourism organisation
(UNWTO), international tourist arrivals, fell by an
estimated 4 per cent in 2009.
Table 3.23: World Exports of Merchandise and
Commercial Services |
|
Value
(US$ billion)
2009 |
Annual percentage change |
2005-09 |
2007 |
2008 |
2009 |
1 |
2 |
3 |
4 |
5 |
6 |
Merchandise |
12,147 |
4 |
16 |
15 |
-23 |
Commercial services |
3,312 |
7 |
20 |
12 |
-13 |
Transportation services |
704 |
5 |
20 |
16 |
-21 |
Travel |
854 |
6 |
15 |
11 |
-11 |
Other commercial services |
1,754 |
10 |
23 |
12 |
-10 |
Source: WTO Secretariat. |
Remittances
3.99 Remittances represent one of the largest
international flows of financial resources over the
past decade. For many remittance-receiving
developing economies, remittances exceeded foreign direct investment, portfolio flows from
financial markets and official development
assistance. In some countries, total remittance
receipts amount to a substantial portion of their
imports and a significant share of GDP. Given the
large size of aggregate remittance flows,
remittances have significant macroeconomic effects
on the recipient economies in terms of improving
the welfare of individual households, facilitating
domestic consumption, supporting investment and
balance of payments.
3.100 Remittances have grown significantly over
the past fifteen years particularly in Asia and Latin
America, with India, Mexico and the Philippines
being the largest recipients of workers’
remittances. These flows have been very stable,
and have acted as a counter-cyclical force in the
receiving countries. However, they are highly
sensitive to economic conditions in the host
countries. The pace of remittances slowed sharply
beginning in the third quarter of 2008 as the
economic crisis gathered strength in the countries
where migrants work. With many emigrants
working in the US, Europe, and the Middle East,
remittances started to fall in 2008, for the first time
in a quarter century. Remittances outflows from
the US and Europe declined during end 2008 and
early 2009 (Chart III.15).
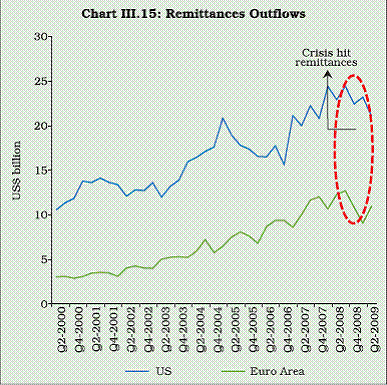 |
3.101 By region, East Asia and Pacific has been
the largest recipient of remittances followed by
South Asia and Latin America and the Caribbean
(Table 3.24). There are indications that the flows of
remittances to these countries slowed down in
response to slower growth in the US and other
advanced economies. Recorded flows to Latin
America and the Caribbean have already stagnated
since 2007, as the US recession, especially in the
construction sector, reduced the employment and
income of Latin American (especially Mexican)
migrants. With further slowdown in the construction
sector in the US, these countries may be
particularly affected since many immigrants from
these regions are employed in the construction
sector. Remittances to Sub-Saharan Africa have
decelerated sharply from a high growth rate of 48
per cent during 2007, partly due to significant
slackening in flows to Nigeria. On the other hand,
remittance flows increased to emerging Europe and
central Asia (with significant migration to the Gulf
region), at least earlier in the year 2008, benefiting
from increases in incomes from higher oil prices.
However, remittances to this region also have been
severely hit during 2009.
3.102 Overall, the officially recorded remittance
flows to developing countries reached US$ 317
billion in 2009, down 6 per cent from US$ 338
billion in 2008. For the first time since the 1980s,
remittances to developing countries declined,
albeit modestly, in 2009. The decline in remittance
flows was the highest in Europe and Central Asia
(15 per cent) and Latin America and Caribbean
(10 per cent), while South Asia and East Asia and
Pacific were among the least affected regions.
These regional trends reveal that: (a) the more
diverse the migration destinations, the more
resilient are remittances; (b) the lower the barriers
to labor mobility, the stronger the link between
remittances and economic cycles in that corridor;
and (c) exchange rate movements produce
valuation effects, but they also influence the
consumption-investment motive for remittances
(Ratha, et al, World Bank, 2010). Despite a modest
decline in remittance inflows, thse flows have
remained more resilient compared to private debt and equity flows and have become even more
important as a source of external financing in
many developing countries.
Table 3.24: Remittance Flows to Developing Countries, 2002-09 |
(US$ billions) |
Country/Region |
2002 |
2003 |
2004 |
2005 |
2006 |
2007 |
2008 |
2009e |
1 |
2 |
3 |
4 |
5 |
6 |
7 |
8 |
9 |
All developing countries |
112.6 |
140.4 |
164.4 |
198.9 |
235.4 |
289.4 |
337.8 |
317.2 |
(Per cent of GDP) |
1.81 |
1.98 |
1.95 |
1.99 |
2.00 |
2.00 |
1.95 |
2.00 |
By region |
|
|
|
|
|
|
|
|
East Asia and Pacific |
27.5 |
32.7 |
40.3 |
50.5 |
57.6 |
71.3 |
86.1 |
84.8 |
Europe and Central Asia |
12.8 |
14.4 |
21.0 |
30.1 |
37.3 |
50.8 |
57.8 |
49.3 |
Latin America and the Caribbean |
27.9 |
36.6 |
43.3 |
50.1 |
59.2 |
63.2 |
64.7 |
58.5 |
Middle East and North Africa |
15.2 |
20.4 |
23.0 |
25.0 |
26.1 |
31.4 |
34.7 |
32.2 |
South Asia |
24.1 |
30.4 |
28.7 |
33.9 |
42.5 |
54.0 |
73.3 |
72.0 |
Sub-Saharan Africa |
5.0 |
6.0 |
8.0 |
9.4 |
12.6 |
18.6 |
21.1 |
20.5 |
e: estimate.
Source: World Bank staff estimates. Remittances are defined as the sum of worker's remittances, compensation of employees, and migrant transfers - see www.worldbank.org/prospects/migration and remittances for data definitions and the entire dataset. |
3.103 Interestingly, migrants’ remittances are
concentrated in a relatively small number of
recipient countries; 10 countries account for more
than half of total remittances, and the three largest
recipients (India, China and Mexico) for more than
one-third of the total remittance inflows (Table
3.25). Remittances have a relatively large weight
in many smaller and mainly low-income
economies. These countries are particularly
vulnerable to recession in the main immigration
economies (i.e., countries of the European Union,
the Gulf Cooperation Council, the Russian
Federation and the United States), which
witnessed sharp contraction in the construction
and services sectors that gave employment to the
largest number of foreign workers.
3.104 The recent trend in remittances to
developing countries suggests that the decline in
remittances is far smaller than that for private flows
to developing countries. According to the World
Bank, the resilience of remittances arises from the
fact that while new migration flows have declined,
the stock of migrants has been relatively unaffected
by the crisis. Although the aggregate decline in
worldwide remittance flows as a result of the crisis
was small, the situation proved more serious for
some small, poor countries where remittances make up a relatively large share of GDP such as
Tajikistan (50 per cent), Moldova (31 per cent),
Kyrgyz Republic (28 per cent) and Lesotho (27
per cent) in 2009.
Table 3.25: Major Remittance-receiving
Developing and Transition Economies in 2009 |
|
Inflows of
migrants’ remittances
(US$ billion) |
Annual
change
(per cent) |
Share of
remittances
in GDP
(per cent) |
1 |
2 |
3 |
4 |
Ranked by Volume |
|
|
|
India |
47.0 |
-8.9 |
4.2 |
China |
47.0 |
-3.2 |
1.1 |
Mexico |
22.9 |
-13.1 |
2.4 |
Philippines |
19.4 |
4.1 |
11.2 |
Bangladesh |
10.4 |
16.0 |
11.4 |
Nigeria |
9.6 |
-4.0 |
4.7 |
Pakistan |
8.6 |
22.4 |
4.2 |
Poland |
8.5 |
-20.8 |
2.0 |
Romania |
8.0 |
-14.7 |
4.7 |
Egypt |
7.8 |
-10.3 |
5.3 |
Ranked by Share in GDP |
|
|
|
Tajikistan |
1.8 |
-28.7 |
49.6 |
Tonga |
0.1 |
-3.7 |
37.7 |
Moldova |
1.5 |
-21.4 |
31.4 |
Kyrgyz Republic |
1.0 |
-17.9 |
27.9 |
Lesotho |
0.5 |
12.0 |
27.3 |
Samoa |
0.1 |
-2.7 |
25.8 |
Lebanon |
7.0 |
-2.5 |
25.1 |
Guyana |
0.3 |
-4.6 |
24.0 |
Nepal |
3.0 |
10.4 |
21.6 |
Honduras |
2.5 |
-10.6 |
20.1 |
Source: Authors' computations based on World Bank data. |
Current Account Deficit
3.105 During 2008, the impact of the crisis on the
current account of developing economies was seen
in terms of reduction in current account surplus
(Argentina, China, Indonesia, Philippines,
Singapore and Israel) or surplus turning into deficit
for countries running current account surpluses
(Brazil, Chile and Korea), while the deficit of
countries that had a current account deficit
increased (Mexico, Hungary, Poland and India)
(Table 3.26). On the other hand, for some countries the impact of the crisis was not visible in their
current account as their current account surplus
increased (Russia, Hong Kong and Saudi Arabia).
In the course of 2009, global imbalances contracted
to some extent with reduction in current account
deficits/surpluses of several countries notably the
US and China.This trend was supported by
substantial decline in oil prices, fall in asset prices
forcing increased household savings in deficit
countries and steep fall in the export demand of
investment goods affecting the surplus countries.
Table 3.26: Cross-country Movement of Trade Balance and Current Account Balance |
(as % of GDP) |
|
Trade Balance |
Current Account Balance |
Country |
1990 |
2000 |
2007 |
2008 |
2009 |
1990 |
2000 |
2007 |
2008 |
2009 |
1 |
2 |
3 |
4 |
5 |
6 |
7 |
8 |
9 |
10 |
11 |
Latin America |
|
|
|
|
|
|
|
|
|
|
Argentina |
6.1 |
0.9 |
5.1 |
4.7 |
6.0 |
3.3 |
-3.1 |
2.3 |
1.5 |
2.8 |
Brazil |
2.1 |
-0.1 |
2.9 |
1.5 |
1.6 |
-0.7 |
-3.8 |
0.1 |
-1.7 |
-1.5 |
Chile |
4.1 |
2.8 |
14.6 |
5.2 |
8.6 |
-1.5 |
-1.2 |
4.4 |
-1.5 |
2.2 |
Mexico |
-0.3 |
-1.3 |
-1.0 |
-1.6 |
– |
-2.8 |
-3.0 |
-0.8 |
-1.5 |
-0.6 |
Emerging Europe |
|
|
|
|
|
|
|
|
|
|
Czech Republic |
– |
-5.5 |
3.4 |
2.9 |
– |
– |
-4.7 |
-3.1 |
-3.1 |
-1.0 |
Hungary |
1.6 |
-6.2 |
0.2 |
0.0 |
– |
1.1 |
-8.5 |
-6.8 |
-7.2 |
0.4 |
Poland |
5.8 |
-7.2 |
-4.0 |
-4.9 |
-1.0 |
1.9 |
-5.8 |
-4.8 |
-5.1 |
-1.6 |
Russia |
– |
23.2 |
10.1 |
10.8 |
9.1 |
– |
18.0 |
6.0 |
6.2 |
3.9 |
Turkey |
-4.7 |
-8.3 |
-7.2 |
-7.2 |
– |
-1.3 |
-3.7 |
-5.8 |
-5.7 |
-2.3 |
Emerging Asia |
|
|
|
|
|
|
|
|
|
|
China |
2.3 |
2.9 |
9.3 |
8.0 |
– |
3.1 |
1.7 |
11.0 |
9.4 |
5.8 |
India |
-1.6 |
-2.3 |
-5.3 |
-7.9 |
– |
-2.5 |
-1.0 |
-1.0 |
-2.2 |
-2.1 |
Indonesia |
4.3 |
15.1 |
7.6 |
4.5 |
6.5 |
-2.5 |
4.8 |
2.4 |
0.0 |
2.0 |
Korea |
-0.9 |
3.2 |
2.7 |
0.6 |
6.7 |
-0.7 |
2.3 |
0.6 |
-0.6 |
5.1 |
Malaysia |
5.7 |
22.2 |
20.0 |
23.1 |
– |
-2.1 |
9.0 |
15.7 |
17.5 |
16.7 |
Philippines |
-9.1 |
-7.9 |
-5.8 |
-7.7 |
– |
-6.1 |
-2.9 |
4.9 |
2.2 |
5.3 |
Thailand |
-7.9 |
9.5 |
10.8 |
6.6 |
– |
-8.3 |
7.6 |
6.3 |
0.6 |
7.7 |
Other EMEs/NIEs |
|
|
|
|
|
|
|
|
|
|
Singapore |
-4.4 |
15.1 |
27.4 |
16.4 |
– |
8.5 |
11.6 |
27.6 |
19.2 |
19.1 |
Hong Kong SAR |
– |
-4.8 |
-9.5 |
-10.7 |
– |
6.2 |
4.1 |
12.3 |
13.6 |
11.1 |
Israel |
-4.7 |
-3.1 |
-3.4 |
-3.6 |
-0.1 |
0.3 |
-1.8 |
2.9 |
0.7 |
3.7 |
Saudi Arabia |
19.6 |
26.4 |
39.1 |
44.6 |
– |
-3.6 |
7.6 |
24.3 |
27.9 |
5.5 |
South Africa |
5.8 |
3.5 |
-2.0 |
-1.6 |
0.2 |
1.4 |
-0.1 |
-7.2 |
-7.1 |
-4.0 |
Advanced Economies |
|
|
|
|
|
|
|
|
|
|
Australia |
0.1 |
-1.2 |
-1.9 |
-0.5 |
– |
-4.8 |
-3.8 |
-6.1 |
-4.4 |
-4.1 |
Austria |
-4.2 |
-2.1 |
0.5 |
-0.1 |
-0.8 |
0.7 |
-0.7 |
3.1 |
3.5 |
1.4 |
Canada |
1.6 |
6.2 |
4.2 |
4.2 |
0.9 |
-3.4 |
2.7 |
1.0 |
0.5 |
-2.7 |
France |
-1.1 |
-0.2 |
-2.2 |
-3.0 |
– |
-0.8 |
1.6 |
-1.0 |
-2.3 |
-1.5 |
Germany |
4.4 |
2.9 |
8.1 |
7.2 |
– |
2.9 |
-1.7 |
7.6 |
6.7 |
4.8 |
Japan |
2.3 |
2.5 |
2.4 |
0.8 |
– |
1.5 |
2.6 |
4.8 |
3.2 |
2.8 |
United Kingdom |
-3.2 |
-3.4 |
-6.4 |
-6.5 |
-5.8 |
-3.8 |
-2.6 |
-2.7 |
-1.5 |
-1.3 |
United States |
-1.9 |
-4.5 |
-5.9 |
-5.8 |
-3.6 |
-1.4 |
-4.2 |
-5.2 |
-4.9 |
-2.9 |
–: Not Available.
Source : World Economic Outlook, April 2009; International Financial Statistics, IMF. |
3.106 Although the crisis originated in the
financial sector of advanced economies, it had
implications for the current account position of
many developing countries through the trade
channel. In this context, the much debated issue
of the sustainable size of current account deficit
has again attracted attention from a countryspecific
perspective. The issue becomes more
pertinent in the light of severe reversal of capital
flows in EMEs, which necessitated a re-look at the
conventional rules derived on the basis of
historical experiences. It was historically argued
that CAD/GDP ratio above 5 per cent was a cause
for alarm (Summers, 1996), especially if the deficit
is financed by short-term debt (Milesi-Ferreti and
Razin, 1996). The Chilean crisis in the early 1980s
was associated with CAD/GDP ratio exceeding 14
per cent. The external crisis in Mexico in the early
1990s also witnessed a high CAD/GDP ratio
averaging 7 per cent. Indonesia, Malaysia, the
Philippines and Thailand also witnessed
persistently large current account deficits during
the East Asian crisis of the mid-1990s. Similarly,
the payments crisis in Brazil in 2001 reinforced
the view that the size of the current account deficit
does matter. The levels of current account deficits
from the viewpoint of sustainability drew more
focused attention in the policy debates during the
East Asian crisis. In fact, large current account
deficits were considered an important factor in the
East Asian crisis (Corsetti, Pesenti and Roubini,
1998; Radelet and Sachs, 2000).
Impact on Global Capital Flows
3.107 Apart from trade, the sub-prime crisis
spread through the financial channel, especially
through capital flows. Trade flows and capital flows
generally interact with each other during normal
times, while during a crisis the one that is impacted
first by the crisis influences its counterpart,
magnifying the overall impact. The flow of capital
between nations, in principle, brings benefits to both
capital-importing and capital-exporting countries.
But historical evidence, reinforced by the recent
global financial crisis, clearly shows that it can also
create new exposures and bring new risks.
3.108 Capital flows to developing and emerging
market economies were very large before the crisis,
especially during 2002-2007 (Table 3.27).
According to the IMF’s World Economic Outlook,
2009, net private capital flows to 143 emerging
markets and five small open economies rose from
US$ 90 billion in 2002 to around US$ 600 billion in
2007. Although the structure of flows has become
more stable, capital flows continue to be very
volatile and this has major macroeconomic
implications for recipient countries. Almost onequarter
of the total domestic capital formation of
the developing countries was funded by foreign capital
in the years immediately preceding the crisis.
3.109 It is noteworthy that the expansion of
capital flows has been much greater than that of
international trade flows (Goldstein, Mathieson and
Lane, 1991; Montiel, 1993). This reflects the
combined effect of several factors such as greater
financial liberalisation, rise of institutional investors
such as mutual funds and pension funds, growing
financial innovations and financial market
developments, intermediation in derivative products
and improvement in information technology. The
process has been reinforced by the ongoing
abolition of impediments and capital controls and
the widespread liberalisation of financial markets
in developing countries since the 1990s. In the
process, capital flows to developing countries
witnessed compositional shifts with the dominance
of private (bond and equity) flows in recent periods,
as opposed to official flows in the past. While
specialised investors such as hedge funds and mutual funds accounted for the bulk of portfolio
inflows up to the mid-1990s, subsequently it was
the pension funds, insurance companies and other
institutional investors who increased their presence
in emerging markets. International bank lending to
developing countries also increased sharply during
the 1990s, and was most pronounced in Asia (prior
to the Asian Crisis), followed by Eastern Europe
and Latin America.
Table 3.27: Capital Flows in EMEs: Various Episodes Compared* |
(US$ billion) |
|
Inflows |
Outflows |
Forex reserves
change |
Current account
balance |
1 |
2 |
3 |
4 |
5 |
1993-1996 |
280 |
110 |
90 |
-85 |
1997-2001 |
269 |
193 |
89 |
21 |
2002-2007 |
951 |
818 |
584 |
429 |
* All EMEs as defined in the IMF World Economic Outlook plus Hong Kong SAR, Korea, Israel, Singapore and Taiwan (China); annual average.
Sources: IMF, Balance of Payments Statistics; Central Bank of China (Taiwan). |
3.110 The pace, magnitude, direction and
composition of international capital flows have
crucial implications for the recipient countries. The
surge in private capital inflows to developing
economies in the 1990s (i.e., up to the Asian
financial crisis in 1997-98) and in the 2000s has
coincided with a period of low international interest
rates in the advanced economies and domestic
policy reforms in the developing world. This led to
a debate in the literature on whether the surge was
driven primarily by domestic or external factors. The
literature usually distinguishes between two sets
of factors affecting capital movements. The first are
country-specific ‘pull’ factors relating to improved
policies that increase the long-run expected return
or reduce the perceived risk on real domestic
investment, while the second ones are global or
‘push’ factors such as easy liquidity and the search
for yields in the US and other advanced economies.
3.111 Historically, most emerging market crises
of the 1980s and 1990s were associated with
reversals in gross private capital inflows that
reflected a loss of confidence in emerging market
policies. Developments in capital flows during the
current crisis are, however, somewhat different.
With the notable exception of some Central and
Eastern European countries, many emerging
market economies adopted sound policies before
the crisis and thus were more resilient to reversals
in capital flows, at least initially. But as the crisis
deepened, some developments in capital flows
followed a pattern similar to that of past crises,
because the nature of capital flows to the
developing economies has undergone dramatic
changes over time. While in the past official flows
dominated capital flows to the developing
economies, at present the bulk of capital flows come from private (bond and equity) sources. Thus, even
though most developing countries maintain better
policies and have stronger institutions than they did
during previous crises, many of them are
nevertheless vulnerable to external disruptions.
Emerging market equities and investments have
always been sensitive to the global economic cycle,
but the recent crisis has severely impacted the
developing countries. Net private capital flows to
emerging and developing economies went through
a sharp reversal during 2008 with many of the EMEs
facing much tighter limits on external financing, as
global deleveraging and increasing risk aversion
have curtailed investor interest in these markets.
On average, the levels of net private inflows to
EMEs during crisis years, i.e., 2008 and 2009, were
around 55 per cent lower than those during 2007
(Table 3.28 and Chart III.16). Although every region
was impacted by the crisis, in aggregate terms,
emerging Europe and Asia were the hardest hit,
while Latin America was relatively less affected.
Countries with larger current account and fiscal
deficits, and sectors with significant foreign
exchange exposures on their balance sheets were
more affected by the tightening of external financing
conditions and withdrawals of capital.
3.112 Total capital flows to developing countries
declined from around US$ 1.2 trillion during 2007 to US$ 780 billion during 2008 mainly on account
of sharp declines in portfolio equity and debt flows
(Table 3.29). On the other hand, FDI flows
continued to grow, albeit at a decelerated pace. In
Europe and Central Asia, the trend of rapid increase
in debt flows during recent years reversed
significantly during 2008, making it one of most
vulnerable regions during the current crisis.
Table 3.28: Net Capital Inflows to EMEs by Region |
(US$ billion) |
|
2007 |
2008 |
2009e |
2010f |
2011f |
1 |
2 |
3 |
4 |
5 |
6 |
A. Private Flows |
1252 |
588 |
531 |
709 |
746 |
Latin America |
229 |
130 |
157 |
190 |
183 |
Emerging Europe |
446 |
263 |
44 |
179 |
212 |
Africa/Middle East |
155 |
88 |
48 |
66 |
81 |
Emerging Asia |
422 |
107 |
283 |
272 |
270 |
B. Official Flows |
43 |
61.4 |
62.4 |
55.2 |
35.3 |
Latin America |
6 |
14 |
23 |
15 |
17 |
Emerging Europe |
4 |
21 |
26 |
20 |
0 |
Africa/Middle East |
4 |
4 |
3 |
5 |
4 |
Emerging Asia |
29 |
23 |
10 |
15 |
14 |
C. Total Flows (A+B) |
1295 |
650 |
593 |
764 |
782 |
e: estimate. f: forecast.
Source: Capital Flows to Emerging Market Economies (Various Issues), Institute of International Finance. |
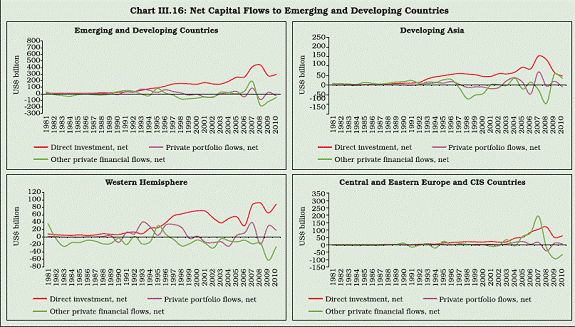 |
3.113 Capital inflows to EMEs slowed down, while
capital outflows increased during the crisis, partly on
account of growing financial integration. Driven by
ample liquidity and a desire to diversify their assets,
investors and multinational companies in developing
countries have acquired assets and invested in debt
markets abroad, in both developed and developing
countries. Net equity outflows reached US$ 244 billion
(1.5 per cent of GDP) in 2008, up from US$ 190 billion
(1.4 per cent of GDP) in 2007. As part of deleveraging
and also to meet domestic redemption pressures,
advanced countries sharply cut their investments in
emerging markets. While FDI investment remained
relatively stable, porfolio and other investments
(including througn banking channel) witnessed sharp
reversals (Table 3.30).
3.114 The private capital flows to emerging
economies have resumed with the post-crisis
recovery in the world economy. The major factors
include brighter growth prospects for emerging
economies relative to mature economies; shortterm
interest rates remaining close to zero for an
extended period in most mature markets; and nearterm
financial risks remaining most evident in
mature markets. However, the uncertainty about the
evolving global economic scenario, as
demonstrated during the recent bout of instability
in the Euro zone, holds the key to the direction and
quantum of financial flows to EMEs.
Foreign Direct Investment
3.115 Within private capital flows to EMEs, foreign
direct investment (FDI) witnessed an almost sevenfold
jump between 1990 and 2000, while portfolio
debt flows declined and equity flows were subdued
during this period. In contrast, since the beginning
of the current decade, it is portfolio flows, especially
debt flows, that have witnessed a sharp jump. During
the recent crisis, net FDI flows to EMEs remained
steady compared to other kinds of capital flows, reflecting the longer-term view of FDI investors on
EME growth potentials and the soundness of the
financial system unlike most portfolio investors and
lenders. Although there has been deceleration in
growth rates, many EMEs have performed better
than the advanced economies, which were officially
into recession during the second half of 2008.
Table 3.29: Net External Capital Flows to Developing Countries |
(US$ billion) |
Region |
1970 |
1980 |
1990 |
2000 |
2005 |
2006 |
2007 |
2008 |
1 |
2 |
3 |
4 |
5 |
6 |
7 |
8 |
9 |
Total Capital Flows |
9.3 |
102.7 |
87.8 |
167.3 |
501.5 |
659.0 |
1221.6 |
780.3 |
All developing countries |
|
|
|
|
|
|
|
|
FDI |
2.9 |
10.1 |
23.5 |
158.9 |
281.1 |
363.2 |
528.4 |
593.6 |
Portfolio equity |
0.0 |
0.1 |
3.4 |
14.4 |
68.9 |
105.8 |
135.3 |
-57.1 |
Debt |
6.4 |
92.5 |
60.9 |
-6.0 |
151.5 |
190.0 |
557.8 |
243.8 |
East Asia & Pacific |
|
|
|
|
|
|
|
|
FDI |
0.4 |
1.5 |
10.5 |
45.2 |
104.4 |
105.7 |
177.0 |
187.1 |
Portfolio equity |
– |
0.1 |
0.4 |
6.6 |
25.7 |
56.2 |
35.1 |
-8.1 |
Debt |
1.0 |
11.9 |
18.6 |
-17.3 |
54.0 |
32.1 |
79.6 |
-0.4 |
Europe & Central Asia |
|
|
|
|
|
|
|
|
FDI |
0.1 |
0.7 |
2.6 |
18.7 |
61.6 |
113.8 |
156.8 |
173.6 |
Portfolio equity |
– |
0.0 |
0.1 |
1.4 |
8.0 |
10.2 |
26.5 |
-14.6 |
Debt |
0.5 |
12.6 |
3.7 |
20.4 |
85.8 |
156.0 |
302.5 |
153.8 |
Latin America & Caribbean |
|
|
|
|
|
|
|
|
FDI |
1.3 |
6.2 |
8.1 |
79.5 |
71.9 |
72.0 |
109.4 |
125.0 |
Portfolio equity |
0.0 |
0.0 |
2.5 |
-0.6 |
12.2 |
11.3 |
29.6 |
-9.7 |
Debt |
2.8 |
45.6 |
19.9 |
-8.5 |
0.2 |
-14.1 |
92.2 |
58.0 |
Middle East & North Africa |
|
|
|
|
|
|
|
|
FDI |
0.2 |
1.4 |
0.5 |
4.5 |
13.8 |
24.9 |
25.0 |
26.1 |
Portfolio equity |
– |
0.0 |
0.0 |
0.3 |
2.4 |
1.0 |
-2.1 |
0.4 |
Debt |
0.4 |
6.8 |
3.4 |
-2.3 |
0.1 |
-13.8 |
3.3 |
-7.9 |
South Asia |
|
|
|
|
|
|
|
|
FDI |
0.1 |
0.2 |
0.5 |
4.4 |
10.9 |
26.0 |
32.3 |
48.7 |
Portfolio equity |
– |
0.0 |
0.0 |
2.5 |
12.4 |
10.4 |
36.1 |
-15.8 |
Debt |
0.8 |
5.7 |
8.3 |
3.5 |
4.7 |
24.9 |
65.9 |
29.8 |
Sub-Saharan Africa |
|
|
|
|
|
|
|
|
FDI |
0.8 |
0.2 |
1.2 |
6.7 |
18.5 |
20.7 |
27.9 |
33.1 |
Portfolio equity |
0.0 |
0.0 |
0.4 |
4.2 |
8.1 |
16.8 |
10.2 |
-9.3 |
Debt |
0.9 |
10.0 |
7.0 |
-1.8 |
6.7 |
5.0 |
14.5 |
10.5 |
Memo: |
|
|
|
|
|
|
|
|
Middle income |
|
|
|
|
|
|
|
|
FDI |
2.3 |
10.1 |
22.4 |
154.5 |
273.6 |
351.5 |
507.5 |
567.2 |
Portfolio equity |
0.0 |
0.1 |
3.4 |
14.4 |
68.7 |
104.4 |
129.0 |
-56.5 |
Debt |
5.1 |
81.2 |
55.7 |
-7.9 |
146.0 |
183.0 |
546.8 |
234.5 |
–: Not Available.
Source: Global Development Finance, World Bank (2009). |
3.116 FDI inflows to China and India, in fact,
increased during 2008 despite the deepening of the
global financial crisis (Table 3.31). There was also
an increase in FDI outflows from these economies
possibly to take advantage of the attractive investment opportunities thrown up by the equity
market corrections in the advanced economies
during the crisis. On the other hand, in the case of
many advanced economies, such as the UK,
Canada, France and Germany, FDI inflows
decelerated while they increased in the US and
Japan, reflecting unwinding of overseas positions
by investors due to risk aversion and repatriation
of the proceeds back home. At the same time, FDI
outflows from countries such as Japan and Canada
increased while it decreased in the case of the US
and the UK. This contrasting pattern in inflows and
outflows from advanced economies during the current financial crisis implies the differing risk
perceptions of investors and the nature of global
deleveraging.
Table 3.30: Outflows from Major Advanced Economies |
(US$ billion) |
|
2000 |
2005 |
2006 |
2007 |
2008 |
2009 |
2008Q1 |
2008Q2 |
2008Q3 |
2008Q4 |
2009Q1 |
2009Q2 |
2009Q3 |
2009Q4 |
1 |
2 |
3 |
4 |
5 |
6 |
7 |
8 |
9 |
10 |
11 |
12 |
13 |
14 |
15 |
Direct Investment |
|
|
|
|
|
|
|
|
|
|
|
|
|
|
Euro Area |
413 |
454 |
543 |
658 |
481 |
433 |
216 |
48 |
158 |
60 |
133 |
119 |
89 |
93 |
Japan |
32 |
45 |
50 |
73 |
131 |
75 |
29 |
18 |
21 |
63 |
19 |
17 |
24 |
15 |
UK |
246 |
81 |
86 |
276 |
163 |
17 |
44 |
54 |
31 |
33 |
17 |
3 |
-8 |
5 |
US |
159 |
36 |
245 |
399 |
332 |
221 |
97 |
107 |
61 |
67 |
47 |
51 |
75 |
48 |
Portfolio Investment |
|
|
|
|
|
|
|
|
|
|
|
|
|
|
Euro Area |
385 |
515 |
650 |
600 |
24 |
113 |
145 |
203 |
-106 |
-218 |
-92 |
83 |
65 |
56 |
Japan |
83 |
196 |
71 |
123 |
190 |
160 |
96 |
23 |
5 |
66 |
90 |
46 |
24 |
-1 |
UK |
97 |
273 |
257 |
180 |
-200 |
241 |
-37 |
3 |
5 |
-171 |
58 |
58 |
88 |
37 |
US |
128 |
258 |
499 |
396 |
-117 |
549 |
62 |
31 |
-101 |
-109 |
88 |
153 |
174 |
134 |
Other Investment |
|
|
|
|
|
|
|
|
|
|
|
|
|
|
Euro Area |
166 |
738 |
999 |
1,301 |
168 |
-689 |
440 |
-123 |
146 |
-295 |
-301 |
-200 |
-130 |
-58 |
Japan* |
-103 |
-124 |
-57 |
72 |
-411 |
-537 |
-22 |
-96 |
-16 |
-277 |
-187 |
-100 |
-125 |
-125 |
UK |
374 |
926 |
708 |
1,484 |
-1,000 |
-500 |
519 |
-764 |
40 |
-796 |
-247 |
-86 |
-108 |
-58 |
US |
273 |
267 |
544 |
677 |
-219 |
-585 |
100 |
-243 |
18 |
-94 |
-224 |
-242 |
-23 |
-97 |
Total |
|
|
|
|
|
|
|
|
|
|
|
|
|
|
Euro Area |
965 |
1,668 |
2,136 |
2,485 |
583 |
-144 |
801 |
127 |
198 |
-454 |
-260 |
1 |
24 |
91 |
Japan |
12 |
118 |
64 |
269 |
-91 |
-302 |
103 |
-56 |
10 |
-148 |
-78 |
-37 |
-76 |
-111 |
UK |
718 |
1,280 |
1,051 |
1,939 |
-1,004 |
-242 |
526 |
-706 |
77 |
-933 |
-172 |
-26 |
-28 |
-16 |
US |
560 |
561 |
1,288 |
1,472 |
-5 |
185 |
259 |
-105 |
-23 |
-135 |
-89 |
-38 |
227 |
85 |
*: includes investment in financial derivatives abroad.
Source: International Financial Statistics, June 2010, IMF. |
3.117 According to the World Bank’s Global
Development Finance (2009), investors repatriated
larger shares of their earnings from direct
investments in many large developing countries
during the first three quarters of 2008. Further,
some large troubled financial institutions had
disinvested their assets in developed and
developing countries to raise capital for their core
business management. The value of such sales
doubled to US$ 11 billion in 2008 from US$ 5 billion
in 2007 and this trend continued in 2009.
3.118 Recent reports indicate that FDI inflows
were lower in a number of countries in 2009. An
important factor behind the decline in FDI inflows
is the slowdown in cross-border mergers and
acquisitions (M&As) in developing countries. M&A
flows have been one of the main drivers of FDI
inflows in developing countries in recent years,
accounting for around 30 per cent of FDI. In the
first quarter of 2009, M&A activity declined to US$ 16 billion in inflows, compared with more than US$
30 billion in the previous two years. Lower
acquisitions by developed country multinationals,
reflecting lower earnings and less financing available
for investment, accounted for much of this decline.
Foreign Portfolio Investment
3.119 In contrast to FDI flows, portfolio flows to
the developing and emerging market economies
witnessed a massive reversal during the second half
of 2008, reflecting the process of global deleveraging
and risk aversion on the part of global investors.
Disruptions in emerging market portfolio flows
became more widespread following the collapse of
Lehman Brothers in mid-September 2008. The
reversal in portfolio equity inflows, notably in Asia,
led to weakening of emerging market currencies,
widening of spreads on international sovereign
bonds and a sharp rise in domestic bond yields in
many EMEs. On the other hand, portfolio outflows
from many developed economies fell significantly and
turned negative, implying liquidation of positions held
abroad and repatriation of money back to home countries (Table 3.32). However, since the second
quarter of 2009, there are indications of a revival in
portfolio flows to EMEs in line with the recovery in
major EME stock exchanges and prospects about
growth in EMEs recovering faster than that of
advanced economies.
Table 3.31: Cross-country Movement of FDI Flows |
(US$ billion) |
Country |
FDI Inflows |
FDI Outflows |
1990 |
2000 |
2005 |
2006 |
2007 |
2008 |
2009 |
1990 |
2000 |
2005 |
2006 |
2007 |
2008 |
2009 |
1 |
2 |
3 |
4 |
5 |
6 |
7 |
8 |
9 |
10 |
11 |
12 |
13 |
11 |
12 |
Latin America |
|
|
|
|
|
|
|
|
|
|
|
|
|
|
Argentina |
1.8 |
10.4 |
5.3 |
5.5 |
6.5 |
9.7 |
4.9 |
0.0 |
0.9 |
1.3 |
2.4 |
1.5 |
1.4 |
0.7 |
Brazil |
1.0 |
32.8 |
15.1 |
18.8 |
34.6 |
45.1 |
25.9 |
0.7 |
2.3 |
2.5 |
28.2 |
7.1 |
20.5 |
-10.1 |
Chile |
0.7 |
4.9 |
7.0 |
7.3 |
12.5 |
15.2 |
12.7 |
0.0 |
4.0 |
2.2 |
2.7 |
2.6 |
8.0 |
8.0 |
Mexico |
2.5 |
18.0 |
22.3 |
19.8 |
27.3 |
23.2 |
11.4 |
0.0 |
0.0 |
6.5 |
5.8 |
8.3 |
1.2 |
7.6 |
Emerging Europe |
|
|
|
|
|
|
|
|
|
|
|
|
|
|
Czech Republic |
– |
5.0 |
11.6 |
5.5 |
10.6 |
10.9 |
– |
– |
0.0 |
0.0 |
1.5 |
1.6 |
1.9 |
– |
Hungary |
0.0 |
2.8 |
7.6 |
19.7 |
72.3 |
63.4 |
-5.7 |
0.0 |
0.6 |
2.2 |
18.6 |
67.7 |
61.4 |
-7.3 |
Poland |
0.1 |
9.3 |
10.3 |
19.9 |
23.7 |
14.8 |
11.5 |
0.0 |
0.0 |
3.4 |
9.1 |
5.7 |
3.1 |
2.9 |
Russia |
– |
2.7 |
12.9 |
29.7 |
55.1 |
75.5 |
38.7 |
n.a. |
3.2 |
12.8 |
23.2 |
45.9 |
56.1 |
46.1 |
Emerging Asia |
|
|
|
|
|
|
|
|
|
|
|
|
|
|
China |
3.5 |
38.4 |
79.1 |
78.1 |
138.4 |
147.8 |
– |
0.8 |
0.9 |
11.3 |
21.2 |
17.0 |
53.5 |
– |
India |
0.0 |
3.6 |
7.6 |
20.3 |
25.1 |
41.2 |
– |
0.0 |
0.5 |
3.0 |
14.3 |
17.3 |
18.4 |
– |
Indonesia |
1.1 |
-4.6 |
8.3 |
4.9 |
6.9 |
9.3 |
5.3 |
0.0 |
0.0 |
3.1 |
2.7 |
4.7 |
5.9 |
3.0 |
Korea |
0.8 |
9.3 |
6.3 |
3.6 |
1.6 |
2.2 |
– |
1.1 |
5.0 |
4.3 |
8.1 |
15.3 |
12.8 |
– |
Malaysia |
2.3 |
3.8 |
4.0 |
6.1 |
8.5 |
7.4 |
– |
0.0 |
2.0 |
3.0 |
6.0 |
11.1 |
15.2 |
– |
Philippines |
0.5 |
2.2 |
1.9 |
2.9 |
2.9 |
1.4 |
– |
0.0 |
0.1 |
0.2 |
0.1 |
3.5 |
0.3 |
– |
Thailand |
2.4 |
3.4 |
8.1 |
9.5 |
11.3 |
8.6 |
6.0 |
0.1 |
0.0 |
0.5 |
1.0 |
2.9 |
2.6 |
3.8 |
Other EMEs/NIEs |
|
|
|
|
|
|
|
|
|
|
|
|
|
|
Singapore |
5.6 |
16.5 |
14.4 |
27.7 |
31.6 |
22.7 |
– |
2.0 |
5.9 |
11.2 |
13.3 |
24.5 |
8.9 |
– |
Hong Kong |
– |
61.9 |
33.6 |
45.1 |
54.4 |
59.6 |
48.4 |
– |
59.4 |
27.2 |
45.0 |
61.1 |
50.5 |
52.3 |
Israel |
0.2 |
5.9 |
4.8 |
15.3 |
8.8 |
10.9 |
3.8 |
0.2 |
3.3 |
2.9 |
15.5 |
8.6 |
7.2 |
1.2 |
South Africa |
-0.1 |
1.0 |
6.5 |
-0.2 |
5.7 |
9.6 |
5.6 |
0.0 |
0.3 |
0.9 |
5.9 |
3.0 |
-2.1 |
1.8 |
Advanced Economies |
|
|
|
|
|
|
|
|
|
|
|
|
|
|
Australia |
8.1 |
13.6 |
-35.6 |
26.4 |
41.1 |
47.3 |
– |
1.0 |
3.3 |
-33.9 |
23.9 |
20.0 |
38.1 |
– |
Canada |
7.6 |
66.1 |
25.9 |
59.8 |
111.4 |
45.4 |
20.6 |
5.2 |
44.5 |
27.6 |
44.5 |
59.6 |
79.0 |
42.2 |
France |
13.2 |
42.4 |
85.0 |
71.8 |
105.9 |
100.4 |
61.6 |
34.8 |
174.3 |
113.8 |
111.4 |
172.0 |
204.8 |
162.4 |
Germany |
3.0 |
210.1 |
46.5 |
56.6 |
77.3 |
25.0 |
35.8 |
24.5 |
59.7 |
77.0 |
119.2 |
163.7 |
137.2 |
61.6 |
Japan |
1.8 |
8.2 |
3.2 |
-6.8 |
22.2 |
24.6 |
11.8 |
50.5 |
31.5 |
45.4 |
50.2 |
73.5 |
130.8 |
74.6 |
UK |
33.5 |
122.2 |
177.4 |
154.1 |
197.8 |
93.5 |
47.0 |
20.1 |
246.3 |
80.8 |
85.6 |
275.5 |
163.1 |
16.7 |
US |
48.5 |
321.3 |
112.6 |
243.2 |
275.8 |
319.7 |
152.1 |
37.2 |
159.2 |
36.2 |
244.9 |
398.6 |
332.0 |
221.0 |
– : Not Available.
Source: International Financial Statistics, June 2010; IMF. |
Debt Flows
3.120 In international debt markets, primary
issuance froze and secondary trading of emerging
market bonds was greatly reduced in September and
October 2008, even for highly rated corporations and
sovereigns with relatively sound fiscal positions (e.g.
Brazil, Malaysia and South Africa). External bond
issuance and bank borrowing by corporations in
developing countries had risen from US$ 81 billion in
2002 to US$ 423 billion in 2007, mainly driven by
Europe and Central Asia where corporate borrowings
increased sharply from US$ 19 billion to US$ 197
billion over the same period. However, such
borrowings fell to US$ 271 billion in 2008 with the
deepening of the global financial turmoil. As against
net borrowings of US$ 28 billion during the first three
quarters of 2008, the last quarter saw net repayments
by EMEs of $27 billion, as many emerging market
corporate borrowers lost their access to international
capital markets. Overall, emerging market bond
issuance declined sharply from US$ 186 billion in
2007 to US$ 106 billion in 2008.
Table 3.32: Cross-country Movement of Portfolio Flows |
(US$ billion) |
Country |
Portfolio Investment Inflows |
Portfolio Investment Outflows |
1990 |
2000 |
2005 |
2006 |
2007 |
2008 |
2009 |
1990 |
2000 |
2005 |
2006 |
2007 |
2008 |
2009 |
1 |
2 |
3 |
4 |
5 |
6 |
7 |
8 |
9 |
10 |
11 |
12 |
13 |
14 |
15 |
Latin America |
|
|
|
|
|
|
|
|
|
|
|
|
|
|
Argentina |
-1.1 |
-1.3 |
-1.7 |
7.9 |
7.1 |
-7.1 |
-3.0 |
0.2 |
1.3 |
-1.4 |
0.0 |
0.0 |
0.0 |
0.0 |
Brazil |
0.6 |
8.7 |
6.7 |
9.1 |
48.1 |
-0.8 |
46.2 |
0.1 |
1.7 |
1.8 |
-0.5 |
-0.3 |
-1.9 |
-3.0 |
Chile |
0.4 |
-0.1 |
1.4 |
0.8 |
-0.5 |
2.8 |
2.0 |
0.0 |
-0.8 |
4.2 |
10.1 |
16.0 |
11.6 |
13.9 |
Mexico |
3.4 |
-1.2 |
7.8 |
0.1 |
13.4 |
4.8 |
15.3 |
7.4 |
-1.3 |
0.0 |
0.0 |
0.0 |
0.0 |
0.0 |
Emerging Europe |
|
|
|
|
|
|
|
|
|
|
|
|
|
|
Czech Republic |
– |
0.5 |
0.1 |
1.9 |
2.2 |
0.5 |
– |
– |
2.2 |
3.5 |
3.0 |
4.8 |
0.5 |
– |
Hungary |
0.0 |
-0.1 |
5.8 |
8.8 |
0.5 |
0.9 |
-3.7 |
0.0 |
0.3 |
1.3 |
2.4 |
2.9 |
3.9 |
0.9 |
Poland |
0.0 |
3.4 |
15.1 |
1.5 |
0.9 |
-4.4 |
16.2 |
0.0 |
0.1 |
2.5 |
4.6 |
6.3 |
-2.4 |
0.4 |
Russia |
– |
-12.8 |
-0.7 |
9.5 |
16.0 |
-27.4 |
8.2 |
– |
0.4 |
10.7 |
-6.2 |
10.0 |
7.8 |
10.9 |
Emerging Asia |
|
|
|
|
|
|
|
|
|
|
|
|
|
|
China |
0.0 |
7.3 |
21.2 |
42.9 |
21.0 |
9.9 |
– |
0.2 |
11.3 |
26.2 |
110.4 |
2.3 |
-32.7 |
– |
India |
0.0 |
2.5 |
12.2 |
9.5 |
35.0 |
-15.0 |
– |
0.0 |
0.1 |
0.0 |
0.0 |
-0.2 |
0.0 |
– |
Indonesia |
-0.1 |
-1.9 |
5.3 |
6.1 |
10.0 |
3.0 |
10.3 |
0.0 |
0.0 |
1.1 |
1.8 |
4.4 |
1.3 |
0.2 |
Korea |
0.7 |
12.7 |
14.1 |
8.1 |
30.0 |
-38.5 |
– |
0.5 |
0.5 |
14.1 |
26.9 |
54.6 |
-23.1 |
– |
Malaysia |
-0.3 |
-2.1 |
-3.0 |
5.6 |
9.3 |
-21.1 |
– |
0.0 |
0.4 |
0.7 |
2.1 |
3.9 |
2.9 |
– |
Philippines |
-0.1 |
0.3 |
3.4 |
6.1 |
3.9 |
-4.4 |
– |
0.0 |
0.8 |
0.1 |
1.6 |
-0.8 |
-0.6 |
– |
Thailand |
0.0 |
-0.6 |
7.1 |
5.7 |
2.9 |
-2.6 |
3.0 |
0.0 |
0.2 |
1.5 |
1.4 |
9.6 |
-0.4 |
12.2 |
Other EMEs/NIEs |
|
|
|
|
|
|
|
|
|
|
|
|
|
|
Singapore |
0.6 |
-1.2 |
6.3 |
12.0 |
18.6 |
-4.6 |
– |
1.6 |
13.4 |
5.3 |
17.3 |
28.1 |
18.6 |
– |
Hong Kong |
– |
46.5 |
9.3 |
15.0 |
75.2 |
-12.8 |
4.9 |
– |
22.0 |
40.7 |
41.8 |
77.9 |
25.4 |
49.1 |
Israel |
0.0 |
3.9 |
2.3 |
4.0 |
3.6 |
2.2 |
3.1 |
0.4 |
3.3 |
8.0 |
8.0 |
3.7 |
2.0 |
7.6 |
South Africa |
0.3 |
1.8 |
5.7 |
21.9 |
13.7 |
-7.6 |
13.4 |
0.3 |
3.7 |
0.9 |
2.2 |
3.4 |
6.7 |
1.9 |
Advanced Economies |
|
|
|
|
|
|
|
|
|
|
|
|
|
|
Australia |
7.0 |
14.9 |
59.0 |
97.2 |
60.2 |
30.4 |
– |
-0.4 |
10.9 |
21.3 |
43.9 |
77.3 |
-3.0 |
– |
Canada |
16.0 |
10.3 |
10.9 |
27.6 |
-32.5 |
29.6 |
95.9 |
2.2 |
43.0 |
44.2 |
69.4 |
42.8 |
-10.0 |
6.2 |
France |
43.2 |
132.3 |
225.2 |
191.3 |
114.5 |
242.6 |
417.2 |
8.4 |
97.4 |
243.6 |
350.3 |
282.1 |
126.8 |
92.4 |
Germany |
11.8 |
40.9 |
221.7 |
181.0 |
401.2 |
25.0 |
-26.0 |
14.0 |
191.5 |
257.3 |
203.4 |
199.9 |
-23.1 |
101.6 |
Japan |
46.7 |
47.4 |
183.1 |
198.6 |
196.6 |
-103.0 |
-56.3 |
37.8 |
83.4 |
196.4 |
71.0 |
123.5 |
189.6 |
160.2 |
UK |
23.8 |
268.1 |
237.0 |
285.5 |
406.7 |
363.9 |
284.0 |
30.0 |
97.2 |
273.4 |
257.0 |
179.6 |
-199.6 |
241.1 |
US |
22.0 |
436.6 |
832.0 |
1126.7 |
1154.7 |
527.7 |
376.6 |
28.8 |
127.9 |
257.5 |
498.9 |
396.0 |
-117.4 |
549.4 |
– : Not Available.
Source: International Financial Statistics, June 2010; IMF. |
3.121 As exchange rates depreciated sharply
against the major international currencies in view
of the deepening of the crisis, corporations that had
borrowed heavily in international debt and credit
markets to finance investment (e.g., Russian energy
companies) encountered difficulties rolling over that
debt. When local exchange rates fell against the
dollar or the euro, the corporations suffered heavy
losses. There are, however, indications of revival of
emerging market bond issuance during the first and
second quarter of 2009.
Trade Credit
3.122 As discussed earlier, the collapse in trade
during the crisis was partly attributed to the shortages of credit to exporters and importers. These
short-term credits, which have a typical tenor of 120–
180 days, are used to facilitate deals between distant
partners with limited knowledge or business
experience of one another. Although they cover only
between 10 and 20 per cent of all trade (most trade
is conducted on an “open account” basis between
regular business partners), short-term credits tend
to be most important for small and medium-sized
exporters. Thus, trade credits, which facilitated
growth in trade in the earlier years, turned out to be
one important reason for the decline in trade across
regions during the current crisis (Table 3.33).
3.123 With the deepening of the global financial
crisis, especially after the collapse of Lehman Brothers in September 2008, many international
banks either did not allow rollover of the credit or
cancelled funded overdraft facilities without warning.
When banks become risk-averse, they tend to shift
their portfolios to more creditworthy borrowers, which
are in a better position to serve longer-maturity loans.
Banks have moved away from funded open-account
facilities, which had become most common in recent
years, to more traditional forms of trade finance as
counterparty risk rose rapidly. According to the World
Bank’s Global Development Finance 2009, these
changes reflected the higher capital requirements
that banks faced as the creditworthiness of recipients
of trade credit was downgraded. Indeed, capital
requirements for trade finance tripled under the Basel
II Accords over Basel I. Spreads had reportedly
increased from 100 to 150 basis points (bps) to
around 400 bps over LIBOR as country risk and
counterparty concerns intensified, with much higher
spreads reported in some cases. According to the IMF, the combination of higher cost of funds, liquidity
premiums and higher risk resulted in a sharp
increase in the price of short-term trade finance.
Many exporters also restricted the credit they were
willing to provide their customers as a result of
reduced access to capital and heightened concerns
about customer creditworthiness. Realising that the
higher cost along with declining availability of finance
had the potential to undermine the efforts undertaken
to stimulate domestic economies, co-ordinated
global initiatives were announced to support trade
finance. For instance, the G-20 agreed to ensure
availability of at least US$ 250 billion over a twoyear
period to support trade finance.
Table 3.33: Cross-country Comparison of Short-term Trade Credit |
(US$ billion) |
Country |
2005 |
2006 |
2007 |
2008Q1 |
2008Q2 |
2008Q3 |
2008Q4 |
2009Q1 |
2009Q2 |
1 |
2 |
3 |
4 |
5 |
6 |
7 |
8 |
9 |
10 |
Advanced Economies |
|
|
|
|
|
|
|
|
|
Australia |
26.4 |
28.7 |
58.7 |
59.0 |
71.7 |
71.3 |
64.4 |
66.8 |
79.4 |
Canada |
5.7 |
6.1 |
6.9 |
6.9 |
6.9 |
6.6 |
5.5 |
5.2 |
5.7 |
France |
87.8 |
96.6 |
107.4 |
116.9 |
117.5 |
105.3 |
100.9 |
123.0 |
129.6 |
Germany |
918.7 |
1,109.1 |
1,354.4 |
1,596.9 |
1,550.4 |
1,469.7 |
1,211.9 |
1,146.6 |
1,198.9 |
Japan |
433.3 |
382.1 |
359.1 |
410.3 |
365.0 |
369.3 |
409.8 |
400.4 |
483.5 |
UK |
1.6 |
1.6 |
1.6 |
1.6 |
1.6 |
1.7 |
1.7 |
1.6 |
1.6 |
US |
492.3 |
557.3 |
726.0 |
734.0 |
737.9 |
778.9 |
907.8 |
802.0 |
796.5 |
Hong Kong |
9.0 |
7.4 |
9.5 |
10.7 |
10.1 |
9.9 |
9.3 |
7.2 |
8.6 |
Emerging Market Economies |
|
|
|
|
|
|
|
|
|
Argentina |
0.3 |
4.6 |
5.1 |
5.7 |
7.6 |
7.4 |
7.7 |
7.6 |
– |
Brazil |
16.5 |
16.7 |
31.0 |
31.1 |
33.5 |
38.2 |
31.2 |
28.5 |
32.4 |
Chile |
6.2 |
8.3 |
9.2 |
9.9 |
13.2 |
14.1 |
10.3 |
8.8 |
9.9 |
Czech Republic |
3.8 |
4.5 |
6.6 |
6.4 |
8.0 |
7.6 |
6.9 |
5.8 |
6.2 |
Hungary |
6.4 |
7.6 |
13.0 |
4.7 |
5.6 |
5.7 |
4.4 |
4.4 |
5.5 |
India |
NA |
25.1 |
36.7 |
43.2 |
45.6 |
46.8 |
42.6 |
40.2 |
37.1 |
Indonesia |
0.7 |
0.8 |
0.7 |
1.0 |
1.3 |
1.7 |
1.6 |
1.2 |
1.2 |
Israel |
7.7 |
9.0 |
11.6 |
11.3 |
11.6 |
11.4 |
9.3 |
7.0 |
7.1 |
Korea |
51.7 |
95.1 |
130.2 |
143.5 |
143.3 |
155.6 |
111.7 |
102.8 |
104.4 |
Malaysia |
10.2 |
8.1 |
12.6 |
23.4 |
26.4 |
27.0 |
20.6 |
21.6 |
21.5 |
Mexico |
8.4 |
9.2 |
9.7 |
9.9 |
10.2 |
10.1 |
9.2 |
9.1 |
8.1 |
Poland |
9.7 |
12.6 |
17.0 |
21.4 |
22.7 |
20.7 |
18.1 |
15.7 |
17.0 |
Russia |
8.2 |
17.6 |
23.9 |
26.3 |
29.8 |
34.6 |
21.3 |
16.1 |
12.9 |
South Africa |
5.5 |
7.5 |
10.7 |
9.6 |
10.3 |
11.6 |
10.6 |
9.8 |
9.2 |
Thailand |
9.4 |
9.6 |
11.1 |
13.0 |
13.9 |
13.6 |
12.1 |
10.3 |
10.7 |
Turkey |
26.8 |
25.6 |
28.6 |
30.0 |
34.1 |
36.1 |
31.5 |
28.4 |
26.6 |
– : Not Available.
Source: Joint BIS-IMF-OECD-World Bank Statistics on External Debt. |
3.124 Although the increase in costs of trade
finance turned out to be a global phenomenon, the
decline in availability of trade credit has been felt
more by the EMEs. According to a survey by the
IMF-Bankers’ Association for Finance and Trade
(BAFT) on bank-intermediated forms of international trade finance, the price of trade finance increased
sharply due to the increased cost of funds to the
banks, which outweighed the dampening price effect
of less restrictive monetary policies in many
advanced economies. The BAFT survey results also
suggest that the downturn in trade largely reflected
falling demand rather than a lack of trade finance.
Trade generally fell by much more than trade finance
during 2008 and the first half of 2009, including in
the areas hit hardest by the crisis (industrial
economies, emerging Europe, Latin America and,
in the first half of 2009, emerging Asia). The trade
finance problem is also sector-specific, apart from
being country- and region-specific. India has been
relatively less affected by the liquidity squeeze in
international credit markets. Despite tightness in the
overseas markets since September 2008, the
disbursement of short-term credit to India has
hovered around its monthly trend of over US$ 3 billion
in the subsequent months, reflecting the positive
impact of various policy initiatives by the authorities.
Short-term Debt
3.125 Flows of short-term debt (debt with an
original maturity of one year or less) to developing
countries were strong during the first half of 2008.
However, such flows became negative in the third
quarter of 2008 and later registered a sharper drop
in the fourth quarter of 2008 following the
deterioration of global financial market conditions.
Many countries borrowed short term to finance their
growing trade and firms contracted short-term loans
to finance imports and pre-pay for exports. In China,
for example, trade finance in 2007 amounted to US$
69 billion, accounting for more than half of the
country’s short-term debt. Similarly, all of India’s US$
45 billion in short-term debt is trade-related. As a
result, the sharp drop in short-term debt has also
strained trade finance. Reflecting the decline in shortterm
debt, short-term international liabilities of many
EMEs in Asia and Europe declined. Interestingly,
many advanced economies including the US and UK
also recorded sharp declines in their short-term
international liabilities, possibly reflecting a decline
in foreign private holdings of non-treasury securities
on account of risk aversion by investors (Table 3.34).
Bank Financing
3.126 The participation of foreign banks in
developing countries’ financial systems has
increased rapidly in recent years. At the end of
2007, the 910 foreign banks with a presence in
developing countries controlled combined assets
in excess of US$ 1.2 trillion and accounted for more
than 39 per cent of total domestic banking assets.
Foreign-owned lenders account for a particularly
high proportion of local banking assets in three
regions—70 per cent in several Eastern European
countries, and approximately 40 per cent in some
Latin American and Sub-Saharan countries.
3.127 International banks started to withdraw
funding from some emerging markets in the third
quarter of 2008. At first, countries with sound and
relatively liquid banking systems were affected. For
instance, cross-border loans to banks and the nonbank
sector in China, Chinese Taipei, the Czech
Republic, Malaysia and Poland decreased by US$
30 billion in the third quarter of 2008. Central banks
and market commentary at the time suggested that
some international banks may have reduced loans
to these EMEs in order to overcome severe liquidity
shortages in their home markets.
3.128 The reversal in cross-border banking flows
became more severe in the fourth quarter of 2008.
According to the BIS international banking statistics,
banks from advanced economies reduced crossborder
loans to developing countries by US$ 205
billion during the fourth quarter (1 per cent of the
combined GDP of EMEs), reversing more than 60 per
cent of the inflows recorded during the previous three
quarters of 2008. Brazil, China, Korea, Turkey and
oil-exporting countries, including Russia, were
particularly affected. Loans to banks declined more
sharply than loans to the non-bank sector. At the same
time, residents of many EMEs (especially in central
Europe and oil-exporting countries, including Russia)
withdrew part of their deposits and other foreign assets
held in BIS-reporting banks. This provided an
important cushion to the emerging markets that had
been unavailable in the past. However, some deposit
withdrawals may have reflected official foreign
exchange intervention rather than the autonomous response of emerging market banks to the reduced
availability of cross-border finance.
Table 3.34: International Short-term Liabilities up to One Year Remaining Maturity |
(US$ billion) |
Country |
1990 |
2000 |
2005 |
2007 |
Mar-08 |
Jun-08 |
Sep-08 |
Dec-08 |
Mar-09 |
Jun-09 |
1 |
2 |
3 |
4 |
5 |
6 |
7 |
8 |
9 |
10 |
11 |
Advanced Economies |
|
|
|
|
|
|
|
|
|
|
Australia |
25 |
35 |
54 |
119 |
118 |
125 |
110 |
81 |
95 |
107 |
Austria |
– |
49 |
87 |
98 |
116 |
111 |
97 |
67 |
64 |
59 |
Canada |
– |
76 |
129 |
201 |
219 |
190 |
186 |
191 |
199 |
197 |
France |
– |
250 |
610 |
1,148 |
1,288 |
1,313 |
1,155 |
979 |
923 |
921 |
Germany |
– |
356 |
685 |
938 |
1,086 |
1,000 |
920 |
739 |
750 |
736 |
Japan |
– |
193 |
410 |
405 |
444 |
400 |
365 |
352 |
368 |
480 |
UK |
– |
731 |
1,530 |
2,409 |
2,704 |
2,404 |
2,175 |
1,789 |
1,713 |
1,796 |
US |
– |
531 |
864 |
1,302 |
1,374 |
1,230 |
1,219 |
1,075 |
1,011 |
982 |
Latin America |
|
|
|
|
|
|
|
|
|
|
Argentina |
7 |
39 |
7 |
11 |
12 |
12 |
11 |
11 |
11 |
12 |
Brazil |
22 |
34 |
27 |
52 |
55 |
68 |
62 |
48 |
53 |
56 |
Chile |
4 |
10 |
11 |
18 |
20 |
21 |
23 |
19 |
17 |
18 |
Mexico |
18 |
22 |
22 |
25 |
28 |
28 |
30 |
31 |
34 |
33 |
Emerging Europe |
|
|
|
|
|
|
|
|
|
|
Czech Republic |
– |
6 |
11 |
17 |
21 |
19 |
19 |
15 |
13 |
11 |
Hungary |
3 |
5 |
15 |
27 |
31 |
28 |
29 |
30 |
27 |
28 |
Poland |
3 |
8 |
16 |
26 |
31 |
31 |
32 |
32 |
26 |
29 |
Russia |
– |
11 |
46 |
93 |
97 |
100 |
97 |
78 |
74 |
81 |
Emerging Asia |
|
|
|
|
|
|
|
|
|
|
China |
9 |
19 |
61 |
121 |
138 |
160 |
148 |
102 |
121 |
118 |
India |
4 |
9 |
31 |
78 |
80 |
83 |
83 |
69 |
66 |
69 |
Indonesia |
13 |
20 |
18 |
29 |
31 |
31 |
32 |
28 |
26 |
27 |
Korea |
2 |
7 |
16 |
21 |
28 |
32 |
23 |
17 |
15 |
15 |
Malaysia |
20 |
33 |
53 |
127 |
157 |
152 |
145 |
100 |
110 |
114 |
Philippines |
3 |
7 |
10 |
11 |
12 |
11 |
10 |
7 |
7 |
8 |
Thailand |
9 |
10 |
11 |
9 |
10 |
10 |
10 |
10 |
9 |
10 |
Other EMEs/NIEs |
|
|
|
|
|
|
|
|
|
|
Singapore |
134 |
65 |
78 |
123 |
142 |
144 |
138 |
106 |
108 |
109 |
Hong Kong |
131 |
70 |
70 |
93 |
110 |
110 |
99 |
82 |
86 |
89 |
Israel |
2 |
3 |
5 |
5 |
6 |
6 |
7 |
6 |
7 |
7 |
– : Not Available.
Source: Bank for International Settlements. |
3.129 With the global credit squeeze, some
emerging East Asian economies experienced severe
foreign currency liquidity shortages. Despite the large
build-up of foreign exchange reserves since the
1997-98 Asian financial crisis, dollar illiquidity tested
the resilience of Asian banks as access to
international interbank markets became difficult. As
the global financial crisis intensified, major
international banks sharply reduced interbank credit
to Asian banks. Although this reduction reflected
more the liquidity needs of major global banks than
any change in Asian banks’ creditworthiness, it
nonetheless led to tighter credit conditions and
foreign currency liquidity shortages. Especially in the
Republic of Korea and Indonesia, withdrawals of
foreign currency liquidity were on a scale large
enough that, from time to time, there were significant
challenges to financial stability. In view of the sharp
rise in foreign currency liquidity and counterparty
risks, cross-currency basis swap spreads (the cost
that Asian banks have to shoulder in borrowing
dollars by using local currency as collateral) widened
sharply. This foreign currency liquidity issue also had
important ramifications for the region’s investment
and trade flows. The countries that had built up their
international reserves from capital flows in the past
years experienced a decline in their reserve levels
during the recent crisis (Table 3.35). Nevertheless, during the recent crisis, reserves acted as buffer
against volatile capital flows and provided confidence
to the market in the inherent strength of the
macroeconomic fundamentals of several economies
including India.
Table 3.35: International Reserve Movement |
(US$ billion) |
Country |
2006 |
2007 |
2008Q1 |
2008Q2 |
2008Q3 |
2008Q4 |
2009 Q1 |
2009 Q2 |
2009 Q3 |
2009 Q4 |
1 |
2 |
3 |
4 |
5 |
6 |
7 |
8 |
9 |
10 |
11 |
Argentina |
31 |
45 |
49 |
46 |
46 |
45 |
45 |
44 |
46 |
46 |
Brazil |
85 |
179 |
194 |
200 |
206 |
193 |
189 |
200 |
221 |
237 |
Chile |
19 |
17 |
18 |
20 |
24 |
23 |
23 |
23 |
26 |
25 |
China |
1,066 |
1,528 |
1684 |
1811 |
1908 |
1949 |
1957 |
2135 |
2288 |
– |
Hong Kong |
133 |
153 |
161 |
158 |
160 |
182 |
186 |
207 |
227 |
256 |
France |
43 |
46 |
50 |
46 |
41 |
34 |
25 |
29 |
45 |
47 |
Germany |
42 |
44 |
47 |
48 |
45 |
43 |
43 |
45 |
61 |
60 |
India |
171 |
267 |
300 |
303 |
278 |
247 |
242 |
255 |
271 |
265 |
Indonesia |
41 |
55 |
57 |
57 |
55 |
50 |
53 |
55 |
60 |
64 |
Japan |
880 |
953 |
993 |
979 |
974 |
1009 |
996 |
996 |
1028 |
1022 |
Mexico |
76 |
87 |
91 |
94 |
99 |
95 |
85 |
81 |
88 |
100 |
Philippines |
20 |
30 |
33 |
33 |
33 |
33 |
34 |
35 |
38 |
39 |
Poland |
46 |
63 |
74 |
79 |
71 |
59 |
58 |
64 |
75 |
76 |
Russia |
296 |
467 |
499 |
555 |
543 |
413 |
368 |
396 |
395 |
417 |
South Africa |
23 |
30 |
31 |
31 |
31 |
31 |
30 |
32 |
35 |
35 |
Switzerland |
38 |
45 |
47 |
47 |
45 |
45 |
50 |
77 |
86 |
98 |
Thailand |
65 |
85 |
107 |
103 |
100 |
109 |
114 |
118 |
129 |
135 |
Turkey |
61 |
73 |
77 |
76 |
77 |
70 |
67 |
66 |
71 |
71 |
UAE |
28 |
77 |
83 |
61 |
45 |
32 |
34 |
36 |
39 |
– |
UK |
41 |
49 |
51 |
49 |
42 |
44 |
40 |
45 |
58 |
56 |
US |
55 |
60 |
65 |
65 |
61 |
67 |
64 |
70 |
123 |
120 |
– : Not Available.
Source: International Financial Statistics, June 2010; IMF. |
3.130 To sum up, the transmission of the global
financial crisis to the real economy was routed
mainly through the decline in world trade especially
in the second half of 2008 and early 2009. The
decline in trade flows was further accentuated by
the sharp reduction in commodity prices in line with
the decline in demand. The trade channel of the
transmission of global crisis played a particularly
important role in economies that had greater
integration in global trade, such as the East Asian
economies. Along with shrinking trade flows, net
private capital flows to emerging and developing
economies went through a sharp reversal during
2008 with many of the EMEs facing much tighter
limits on external financing, as global deleveraging
and increasing risk aversion curtailed investor
interest in these markets. Countries with larger
current account and fiscal deficits, and sectors with
significant foreign exchange exposures on their
balance sheets, were more affected by the
tightening of external financing conditions and
withdrawals of capital. Despite in modest decline
in remittance inflows in 2009, these flows have
remained more resilent compared to private debt
and equity flows, though the adverse developments
turned out to be more serious for some small, poor
countries where it makes up a relatively large share
of GDP. Finally, in the course of 2009, global
imbalances contracted to some extent with
reduction in current account deficits/surpluses of
several countries notably the US and China.
IV. IMPACT ON REAL ECONOMY
3.131 The period since the second half of the
1990s is generally characterised as benign inflation,
lower interest rates, higher risk appetite and booming
stock market-inflicted exuberance among
households and corporates. This strong growth of
the financial sector buttressed the growth of real economic activity during the period just before the
onset of the recent financial crisis. In the first half of
the 2000s, the world economy grew at a record 5.1
per cent – well above the average growth of 3.2 per
cent achieved during 1992-2001. World output
growth was mainly driven by emerging and
developing economies led by China and India. This
was the period when the world economy was
increasingly looking decoupled and the growth
potential was shifted from the US to developing Asia
(Table 3.36).
Table 3.36: Growth in Real GDP |
(Annual per cent change) |
|
Average 1992-2001 |
2006 |
2007 |
2008 |
2009 |
2010P |
1 |
2 |
3 |
4 |
5 |
6 |
7 |
World |
3.2 |
5.1 |
5.2 |
3.0 |
-0.6 |
4.2 |
Advanced Economies |
2.8 |
3.0 |
2.8 |
0.5 |
-3.2 |
2.3 |
USA |
3.5 |
2.7 |
2.1 |
0.4 |
-2.4 |
3.1 |
Euro area |
2.1 |
3.0 |
2.8 |
0.6 |
-4.1 |
1.0 |
Japan |
0.9 |
2.0 |
2.4 |
-1.2 |
-5.2 |
1.9 |
Other advanced economies |
3.7 |
3.9 |
3.9 |
1.2 |
-2.3 |
3.0 |
Emerging and Developing Economies |
3.8 |
7.9 |
8.3 |
6.1 |
2.4 |
6.3 |
Regional Groups |
|
|
|
|
|
|
Central and Eastern Europe |
2.6 |
6.5 |
5.5 |
3.0 |
-3.7 |
2.8 |
Commonwealth of Independent States |
—- |
8.5 |
8.6 |
5.5 |
-6.6 |
4.0 |
Developing Asia |
7.3 |
9.8 |
10.6 |
7.9 |
6.6 |
8.7 |
Middle East & North Africa |
3.4 |
5.7 |
5.6 |
5.1 |
2.4 |
4.5 |
Western Hemisphere |
3.0 |
5.6 |
5.8 |
4.3 |
-1.8 |
4.0 |
P: Projections.
Source: World Economic Outlook, April 2010. |
3.132 The impact of the global financial crisis spilled
over to the real sector in the advanced economies.
Even as policymakers acted to bring the banks back
from the brink of collapse, consumer & business
confidence declined substantially. Reflecting the
decline in asset prices were the end of a housing
construction boom in several countries, tight credit
market conditions, fall in consumer and business
sentiment, and contraction in household expenditure
(including on houses) in the advanced economies.
The impact on consumption was severe because the
recent recession involved housing busts as well as
systemic banking crises in some of the major
advanced economies. This was in line with the findings
in the literature that the impact of banking crises on
consumption has increased in the post-1990s period,
despite the benefits of financial liberalisation in easing
liquidity constraints (Barrell et al., 2004). The study also found that the impact becomes greater in
countries with high personal debt. Signs of weakening
also emerged in the corporate sector, particularly
those exposed to consumption or housing
construction or those with significant exposure to
energy prices. These developments were reflected in
falling income, shrinking demand and deceleration in
trade in leading major advanced economies such as
the US, Euro area, the UK and Japan into recession
by the fourth quarter of 2008 (Table 3.37). The
recession deepened, specially as the recent crisis
affected all the major components of aggregate
demand in advanced economies (Box III.3)
Table 3.37: Quarterly GDP Growth |
(Per cent) |
Country |
Q1-2008 |
Q2-
2008 |
Q3-
2008 |
Q4-
2008 |
Q1-
2009 |
Q2-
2009 |
Q3-
2009 |
Q4-
2009 |
Q1-
2010 |
1 |
2 |
3 |
4 |
5 |
6 |
7 |
8 |
9 |
10 |
Australia |
0.8 |
0.6 |
0.4 |
-0.8 |
0.6 |
0.8 |
0.3 |
1.1 |
0.5 |
Canada |
-0.2 |
0.0 |
0.1 |
-0.8 |
-1.8 |
-0.7 |
0.2 |
1.2 |
1.5 |
Germany |
1.6 |
-0.6 |
-0.3 |
-2.4 |
-3.5 |
0.4 |
0.7 |
0.2 |
0.2 |
Japan |
0.3 |
-1.0 |
-1.1 |
-2.5 |
-4.2 |
1.7 |
0.1 |
1.1 |
1.2 |
Korea |
1.2 |
0.3 |
-0.1 |
-4.5 |
0.2 |
2.4 |
0.1 |
0.2 |
2.1 |
Mexico |
1.3 |
-0.3 |
-0.2 |
-2.0 |
-6.8 |
0.3 |
2.4 |
1.9 |
-0.3 |
New Zealand |
-0.3 |
-0.6 |
-0.6 |
-1.0 |
-0.8 |
0.1 |
0.3 |
0.8 |
.. |
UK |
0.7 |
-0.1 |
-0.9 |
-1.8 |
-2.6 |
-0.7 |
-0.3 |
0.4 |
0.3 |
USA |
-0.2 |
0.4 |
-0.7 |
-1.4 |
-1.6 |
-0.2 |
0.6 |
1.4 |
0.8 |
Euro area |
0.8 |
-0.4 |
-0.5 |
-1.9 |
-2.5 |
-0.1 |
0.4 |
0.1 |
0.2 |
G-7 |
0.2 |
-0.1 |
-0.7 |
-1.7 |
-2.4 |
0.1 |
0.4 |
1.0 |
0.7 |
NAFTA |
0.0 |
0.3 |
-0.6 |
-1.4 |
-2.1 |
-0.2 |
0.7 |
1.4 |
0.7 |
Source: OECD database. |
Box III.3
Impact on Aggregate Demand
An analysis of aggregate demand revealed that during the
current financial crisis, the downturn in output growth in the
advanced economies has been unusually deep, involving
most components of spending. The weakening in demand
during 2008 was broad-based across all GDP components,
viz., consumption, investment and net exports.
Private consumption contracted in all major economies in
the final quarter of 2008. Rising commodity prices strongly
affected households’ real income in the first half of the year.
Faced with subdued real income growth, falling financial
wealth, tightening credit conditions and worsening labour
market prospects, household spending moderated
considerably in the course of the year, with private
consumption in the advanced economies growing by
around 0.3 per cent in 2008 as a whole. Consumer
confidence indicators, which had peaked in mid-2007, fell
to their long-term average levels in the early months of
2008, sharply deteriorating further to reach very low levels
by the end of the year. Decline in private consumption was
sharp in the United States, where it plunged by an
annualised 0.2 per cent, accounting for almost half of the
decline in output. The hardest hit category was spending
on consumer durables, which slumped during the second
half of 2008. In contrast, consumption accounted for only
a small part of the drop in output in the Euro area and
Japan. The downturn in these economies was led instead
by a major collapse of international trade, accounting for
about 75 per cent and 50 per cent of the decline in output
in Japan in the fourth quarter of 2008 and the first quarter
of 2009, respectively, and for about 60 per cent of the
decline in the Euro area in the final quarter of 2008.
Although private consumption contracted, public consumption
remained robust in most of the advanced economies in 2008
and 2009, reflecting the fiscal stimulus measures undertaken
by the sovereign government to boost domestic demand
(Table).
In the advanced economies, total investment growth
contracted by 1.9 per cent in 2008 following two years of
elevated growth. The decline in growth was more pronounced
for residential investment than for other private investment.
Indeed, housing investment contracted in 2008, following
the end of the expansionary phase of the residential
construction cycle in 2007 in the context of slowing house
price growth. The deceleration was generally more
pronounced in countries that had experienced very fast
growth in previous years. Waning capacity pressures,
renewed uncertainty and tighter financing conditions led to
cuts in corporate investment.
The external environment deteriorated significantly in 2008,
aggravated by the financial crisis, with growth slowing in
advanced economies and emerging markets becoming
increasingly affected. External demand slowed as activity
in advanced economies decelerated and emerging markets
became increasingly affected by the financial turmoil. Growth
in euro area exports slowed markedly in 2008, to an annual
rate of around 1.8 per cent, compared with 6.0 per cent in
2007, and turned negative over the last three quarters of
the year. During the last few months of the year, various
survey indices on industrial export orders or order books
fell to historically low levels. However, there are indications
of recovery in retail sales since the second quarter of 2009.
Table: Components of Aggregate Demand in Advanced Economies |
(annual per cent change) |
|
Private Consumer Expenditure |
Public Consumption |
Gross Fixed Capital Formation |
|
2007 |
2008 |
2009 |
2007 |
2008 |
2009 |
2007 |
2008 |
2009 |
Advanced Economies |
2.5 |
0.3 |
-0.8 |
2.0 |
2.5 |
2.3 |
2.2 |
-1.9 |
-12.0 |
United States |
2.7 |
-0.2 |
-0.6 |
1.4 |
3.0 |
1.8 |
-1.2 |
-3.6 |
-14.5 |
United Kingdom |
2.1 |
0.9 |
-3.2 |
1.2 |
2.6 |
2.2 |
7.8 |
-3.5 |
-14.9 |
Euro Area |
1.6 |
0.4 |
-1.1 |
2.3 |
2.1 |
2.2 |
4.8 |
-0.4 |
-11.1 |
Japan |
1.6 |
-0.7 |
-1.0 |
1.5 |
0.3 |
1.6 |
-1.2 |
-2.6 |
-14.3 |
Source: World Economic Outlook April 2010. |
3.133 Emerging market economies looked
relatively resilient during the initial months of the
crisis, benefiting from large capital inflows and benign
macroeconomic conditions. However, with the
slowdown in economic activities in advanced
economies becoming more entrenched, global trade
shrinking and turbulence in global financial markets
intensifying, the contagion spread to the EMEs. As a result, the crisis quickly spread around the world,
pushing the global economy into a severe and
synchronised recession (Chart III.17). Overall, world
GDP growth contracted by 0.6 per cent in 2009, after
recording a healthy growth in earlier years.
3.134 The cross-country comparison of fifteen
advanced and emerging economies suggested that the recent crisis was more negatively biased in
terms of real GDP growth and growth rates were
more clustered compared to the slowdown in
economic activity after the dot-com bubble burst in
2001 (Chart III.18). This reflects the growing interlinkages
between countries in terms of trade and
financial flows which facilitated swift transmission
of contagion across countries.
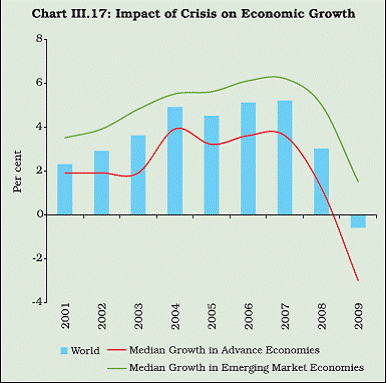 |
3.135 The severity of the impact of the financial
crisis on economic growth can be ascertained from
the significant downward revisions in growth
forecasts of major economies for 2009 by the IMF
before and after the collapse of Lehman Brothers in
September 2008 (Table 3.38). From a pre-Lehman scenario where every country was expected to
register positive growth in 2009, a year after the event
there were only a handful of countries, viz., China
and India that were projected to see positive
economic growth during the year. All other countries
were expected to contract during the year, though
at varying degrees.
Table 3.38: Comparison of GDP Growth Estimates for 2009 |
(per cent) |
Country |
April 2008
Pre-Lehman |
April 2010
A Year Later |
1 |
2 |
3 |
US |
+0.6 |
-2.4 |
Japan |
1.5 |
-5.2 |
China |
+9.5 |
+8.7 |
UK |
+1.6 |
-4.9 |
Canada |
+1.9 |
-2.6 |
France |
+1.2 |
-2.2 |
Germany |
+1.0 |
-5.0 |
Russia |
+6.3 |
-7.9 |
India |
+8.0 |
+5.7 |
Brazil |
3.7 |
-0.2 |
Source: WEO, IMF 2008 and 2010. |
3.136 Against the backdrop of falling household
income, weakening corporate performance and
heightened uncertainties following the financial
crisis, the trend of savings and investment across
the region decelerated in 2009 (Table 3.39). This,
in turn, appears to have contributed to the
deepening of recessionary conditions in major
advanced economies and expected slowdown in
growth in many EMEs during 2009. Even countries that had high savings and investment rates like
China experienced significant slowdown in real
GDP growth.
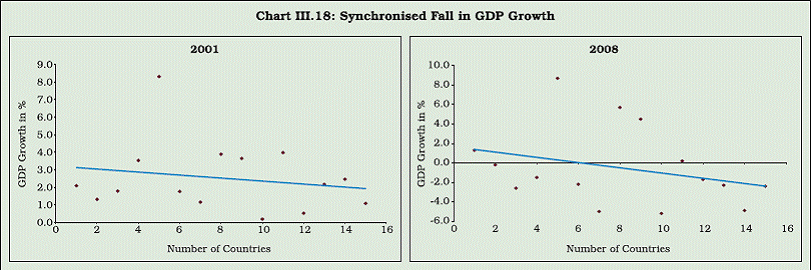 |
Table 3.39 : Gross Saving and Investment |
(as a percentage of GDP) |
|
Saving |
Investment |
|
1996-2003 |
2007 |
2008 |
2009 |
2010 (P) |
1996-2003 |
2007 |
2008 |
2009 |
2010 (P) |
1 |
2 |
3 |
4 |
5 |
6 |
7 |
8 |
9 |
10 |
11 |
Advanced economies |
21.1 |
20.7 |
19.5 |
17.1 |
17.8 |
21.3 |
21.5 |
21.0 |
18.0 |
18.4 |
United States |
17.0 |
14.5 |
12.6 |
10.8 |
12.2 |
19.6 |
19.5 |
18.2 |
15.0 |
15.7 |
Japan |
28.1 |
28.4 |
26.8 |
23.0 |
22.7 |
25.6 |
23.7 |
26.6 |
20.3 |
19.8 |
Germany |
20.1 |
26.0 |
25.9 |
21.8 |
21.6 |
20.2 |
18.3 |
19.2 |
17.0 |
16.1 |
United Kingdom |
16.0 |
15.6 |
15.3 |
12.5 |
12.3 |
17.4 |
18.3 |
16.9 |
13.8 |
14.0 |
Emerging economies |
25.0 |
33.6 |
33.7 |
31.1 |
32.6 |
24.9 |
29.4 |
29.9 |
29.2 |
30.4 |
Developing Asia |
33.1 |
45.0 |
43.9 |
43.6 |
45.4 |
31.7 |
37.9 |
38.2 |
39.5 |
41.3 |
Middle East & North Africa |
27.3 |
41.6 |
42.4 |
29.6 |
32.7 |
23.4 |
26.0 |
26.8 |
27.8 |
27.3 |
Source: World Economic Outlook, April 2010, IMF. P: Projection. |
3.137 The impact, however, varied across
countries/regions. For instance, the household
saving ratio in the Euro area increased during 2008
partly due to the rise in economic and financial
uncertainties. The increase in the savings rate has
been fairly widespread, in particular in countries
that witnessed strong deteriorations in the labour
market situation and sharp declines in house prices,
and households were highly indebted.
3.138 Two major features of the impact of the
recent crisis on the world economy came out
distinctly: (i) a synchronised decline or deceleration
in economic activity in all economies which are
associated with a collapse in world trade; and, (ii)
growing signs of an adverse feedback loop between
the real economy and the financial sector. The
weakening of economic activity has impaired the
quality of bank loans, adversely affecting their
capital positions and their willingness to extend
credit to the private sector. This, in turn, constrained
the pace of economic activity and the ability of the
private sector to service its debts, entailing the risk
of a vicious circle. By significantly eroding the level
of economic activity, the financial crisis has also
led to a loss of potential output in major economies.
This is also supported by various studies covering
both advanced and developing economies. A panel
study of output behaviour in 190 countries shows
large and persistent actual output losses associated with financial crises, with output falling by 7.5 per
cent relative to trend over a period of 10 years in
the event of a banking crisis (Cerra and Saxena,
2008). Another study for 30 OECD economies also
estimated that, on average, a financial crisis could
lower potential output by 1.5 –2.1 per cent within
five years (Furceri and Mourougane, 2009).
3.139 The sharp fall in global economic activities
along with the decline in international commodity
prices from mid-2008 had significant downward
pressures on inflation, even sparking fears of deflation
in many countries (Table 3.40 and Chart III.19).
According to the IMF, inflation is expected to decline
from 3.4 per cent in 2008 to 0.1 per cent in 2009 in
advanced economies, while in EMEs inflation is
expected to fall from 9.2 per cent to 5.2 per cent over
the same period. In China, the loss of foreign export
markets has created overcapacity that has added to
the downward pressure on prices. On the other hand,
inflation showed more persistence until early 2009 in
Latin America and Russia. In some countries (e.g.,
Mexico and Russia), inflation concerns have been
accentuated by depreciation pressures, a combination
that poses a dilemma for monetary policy. On balance,
in early 2010.The inflation pressures are generally
subdued but diversed.
Advanced Economies
3.140 The impact of the crisis on the real
economies of the advanced and emerging market
economies are analysed in the following sections.
Table 3.40: Trends in Consumer Price Inflation |
(Per cent) |
|
Average
1992-2001 |
2006 |
2007 |
2008 |
2009 |
2010P |
1 |
2 |
3 |
4 |
5 |
6 |
7 |
1. Advanced Economies |
2.4 |
2.4 |
2.2 |
3.4 |
0.1 |
1.5 |
United States |
2.7 |
3.2 |
2.9 |
3.8 |
-0.3 |
2.1 |
Euro area |
2.3 |
2.2 |
2.1 |
3.3 |
0.3 |
1.1 |
Japan |
0.4 |
0.3 |
0.0 |
1.4 |
-1.4 |
-1.4 |
2. Emerging and developing economies |
39.0 |
5.6 |
6.5 |
9.2 |
5.2 |
6.2 |
3. Regional groups |
|
|
|
|
|
|
Commonwealth of Independent States |
—- |
9.5 |
9.7 |
15.6 |
11.2 |
7.2 |
Central and Eastern Europe |
52.9 |
5.9 |
6.0 |
8.1 |
4.7 |
5.2 |
Developing Asia |
7.4 |
4.2 |
5.4 |
7.4 |
3.1 |
5.9 |
Middle East & North Africa |
10.1 |
7.5 |
10.0 |
13.5 |
6.6 |
6.5 |
Western Hemisphere |
51.9 |
5.3 |
5.4 |
7.9 |
6.0 |
6.2 |
P: Projections.
Source: World Economic Outlook Report, April 2010. |
The US
3.141 In the US, economic activity had shown
signs of deceleration even before the upsurge in
financial market tensions. The housing market was
a primary source of weakness in the US real
economy as well as in the financial markets. As per
the National Accounts data, residential investment
in the US started declining from the second quarter
of 2008 (Table 3.41). However, during the crisis,
the slowdown in economic activity spread outside
the housing sector. While there was positive growth
in the second quarter of the year partly due to
temporary fiscal stimulus measures and support
from foreign trade, intensifying financial market
strains, restrictive credit conditions and weaker foreign demand contributed to an outright
contraction in output throughout the second half of
2008. The US economy was officially declared to
have entered into recession from December 2008.
Overall, US economic activity decelerated markedly
in 2008 – the growth in real GDP was 0.4 per cent
in 2008 compared with 2.1 per cent in 2007.
According to the US Bureau of Economic Analysis,
downturns in manufacturing, retail trade, and
finance and insurance industries were the leading
contributors to the slowdown in US economic growth
in 2008. The value-added of finance and insurance
industries dropped 3.2 per cent in 2008 and further
to 2.7 per cent in 2009, which was its first decline
since 1992.
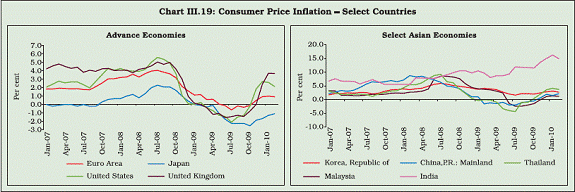 |
Table 3.41: Composition of Real Domestic Demand (seasonally adjusted) |
(Growth in per cent) |
Item |
2006 |
2007 |
2008 |
2009 |
2008 |
2009 |
2010 |
Q1 |
Q2 |
Q3 |
Q4 |
Q1 |
Q2 |
Q3 |
Q4 |
Q1 |
1 |
2 |
3 |
4 |
5 |
6 |
7 |
8 |
9 |
10 |
11 |
12 |
13 |
14 |
GDP |
2.7 |
2.1 |
0.4 |
-2.4 |
-0.7 |
1.5 |
-2.7 |
-5.4 |
-6.4 |
-0.7 |
2.2 |
5.6 |
3.0 |
PCE |
2.9 |
2.6 |
-0.2 |
-0.6 |
-0.6 |
0.1 |
-3.5 |
-3.1 |
0.6 |
-0.9 |
2.8 |
1.6 |
3.5 |
Goods |
3.3 |
3.1 |
-2.1 |
-1.9 |
-5.1 |
-0.5 |
-7.7 |
-10.0 |
2.5 |
-3.1 |
7.2 |
2.8 |
6.5 |
Services |
2.7 |
2.4 |
0.7 |
0.1 |
1.8 |
0.4 |
-1.3 |
0.5 |
-0.3 |
0.2 |
0.8 |
1.0 |
2.0 |
GPDI |
2.7 |
-3.8 |
-7.3 |
-23.2 |
-7.4 |
-10.4 |
-6.9 |
-24.2 |
-50.5 |
-23.7 |
5.0 |
46.1 |
14.7 |
Non-residential |
7.9 |
6.2 |
1.6 |
-17.8 |
1.9 |
1.4 |
-6.1 |
-19.5 |
-39.2 |
-9.6 |
-5.9 |
5.3 |
3.1 |
Residential |
-7.3 |
-18.5 |
-22.9 |
-20.5 |
-28.2 |
-15.8 |
-15.9 |
-23.2 |
-38.2 |
-23.3 |
18.9 |
3.8 |
-10.7 |
Exports |
9.0 |
8.7 |
5.4 |
-9.6 |
-0.1 |
12.1 |
-3.6 |
-19.5 |
-29.9 |
-4.1 |
17.8 |
22.8 |
7.2 |
Goods |
9.4 |
7.4 |
5.9 |
-12.2 |
4.2 |
14.1 |
-1.8 |
-25.5 |
-36.9 |
-6.3 |
24.6 |
34.1 |
8.9 |
Services |
7.9 |
11.8 |
4.2 |
-4.1 |
-9.0 |
7.8 |
-7.7 |
-4.3 |
-13.6 |
0.1 |
5.6 |
2.6 |
3.8 |
Imports |
6.1 |
2.0 |
-3.2 |
-13.9 |
-2.5 |
-5.0 |
-2.2 |
-16.7 |
-36.4 |
-14.7 |
21.3 |
15.8 |
10.4 |
Goods |
5.9 |
1.7 |
-3.9 |
-16.0 |
-3.5 |
-4.6 |
-3.7 |
-19.6 |
-41.0 |
-16.5 |
25.1 |
20.3 |
10.7 |
Services |
7.1 |
3.5 |
0.7 |
-3.6 |
3.0 |
-7.1 |
6.1 |
-0.9 |
-11.5 |
-7.5 |
7.0 |
-1.9 |
9.0 |
GCE&I |
1.4 |
1.7 |
3.1 |
1.8 |
2.6 |
3.6 |
4.8 |
1.2 |
-2.6 |
6.7 |
2.6 |
-1.3 |
-1.9 |
Memo: |
|
|
|
|
|
|
|
|
|
|
|
|
|
Corporate Profitability |
10.5 |
-4.1 |
-11.8 |
-3.8 |
-2.6 |
-3.8 |
3.6 |
-22.8 |
5.3 |
3.7 |
10.8 |
8.0 |
5.5 |
PCE: Personal Consumption Expenditure; GPDI: Gross Private Domestic Investment
GCE&I: Government Consumption Expenditures and Gross Investments
Source: Bureau of Economic Analysis, US. |
3.142 The impact of the sub-prime crisis was also
reflected in the deceleration in growth of private
consumption expenditure (PCE), which has turned
negative since the beginning of 2008 with
deteriorating consumer sentiment and labour
market conditions, in addition to a decline in
household wealth owing to falling house prices and
equity valuations. Contraction in private payrolls,
declines in employment and earlier increases in
food and energy prices have together eroded the
purchasing power of households. In the US, the
unemployment rate rose to 7 per cent in December
2008 which was highest level in last one and half
decade. Since then the pressure on unemployment
continued and the rate of unemployment remained
in the range of 8-10 per cent during 2009 and 2010.
With mounting job losses and resultant steep falls
in wealth, by the third quarter of 2008, US
household net worth had fallen by US$ 5.6 trillion
over the year. The sluggishness of real incomes,
coupled with tighter credit and declining household
wealth had put strong downward pressure on
consumer spending.
3.143 After recording sharp growth in 2005 and
2006, corporate sector profitability declined from 2007 in line with the decline in personal
consumption expenditure and increased costs of
production driven by energy and other commodity
prices up to mid-2008. The decline in corporate
profits along with looming uncertainty about future
growth prospects with the deepening of the global
financial crisis led to delayed investment plans.
Business investment, in fact, weakened amid
declining corporate profits, tighter lending
standards, and the broadly weakening outlook for
demand. The ongoing housing market correction –
intensified by the financial turmoil – continued to
be a major drag on the economy, with residential
investment contributing significant drag on GDP
growth during 2007 and 2008.
3.144 Foreign trade, however, was a major
contributor to growth in the US throughout most of
2008, reflecting buoyant external demand earlier
in the year and the lagged effects of past US dollar
depreciation. However, the positive trade effect
faded during the second half of 2008 as a sharp
economic slowdown in a number of US trading
partners weighed on foreign demand and exports.
Nonetheless, the current account deficit narrowed
from 5.2 per cent of GDP in 2007 to 4.9 per cent of GDP in 2008 and further 2.9 per cent in 2009.
Accordingly, the contribution of net exports to
growth in real GDP worsened in 2008 from its level
in 2007. According to the estimates of the
Congressional Budget Office (CBO) in March 2009,
the US federal budget deficit increased to 3.2 per
cent of GDP in 2008 from 1.2 per cent in 2007. The
rising deficit reflects an expected drop in tax
revenues and increased federal spending, in large
part related to the government’s actions to address
the crisis in the financial and housing markets.
The Euro area
3.145 While the year 2008 started on a relatively
resilient note, there was rapid deterioration in
economic activity from the middle of the year in the
face of weakening domestic demand and a
pronounced slowdown in the world economy. With
the onset of the crisis, consumer and business
confidence began to decline in the euro area and
the UK. Domestic demand has softened in the euro
area since the second quarter of 2008, with
investment registering a significant decline and
consumption moderating. Both domestic demand
and net trade made significant negative contributions
to growth during 2008 (Chart III.20). While half of
the quarter-on-quarter growth in the first part of 2009
in the Euro area arose from internal demand, amid
particularly subdued consumption and weakening
residential investment, the other half resulted from
net exports. During the second half of 2008, firms
started to react forcefully to the rapid depletion of order books, postponing expansion plans and cutting
inventories in the face of weak demand and costlier
access to financing. With the significant deterioration
in the external environment – on account of renewed
weaknesses in the US economy and activity in
emerging markets, which had previously been
perceived to be shielded from the effects of the global
slowdown – the year-on-year growth in euro area
exports fell to its lowest level since 2003 by the third
quarter of 2008. As the recession continued, the
contribution of external demand continued to be
negative till first quarter of 2009. As the global
economic environment improved, the negative
contribution improved in the fourth quarter of 2009.
There are a number of factors behind this decline,
including the fact that the global drop in investment
in equipment and machines particularly affects euro
area countries that are more specialised in capital
goods.
3.146 Tight credit conditions, commodity pricerelated
inflationary pressures and deteriorating
confidence brought an end to the rapid growth in
housing prices witnessed up to the third quarter of
2007. Faced with subdued real income growth,
falling financial wealth, tightening credit conditions
and worsening labour market prospects, household
spending moderated significantly during 2008 and
also during the first quarter of 2009. Household
spending decisions were also severely affected by
expectations regarding lifetime income, which, in
addition to expected future income, also includes
returns on financial and real estate wealth. Since the financial market turmoil began in mid-2007,
developments in euro area financial assets have,
for most consumers, had an adverse wealth impact
which has been heightened by subdued
developments in house prices. As a result, the yearon-
year growth in private consumption fell to its
slowest rate since 1993 in the euro area.
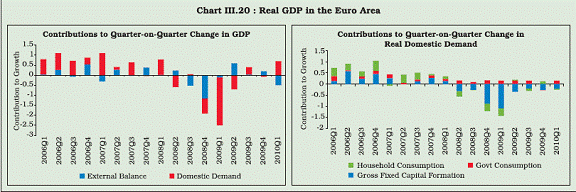 |
3.147 The falling house prices were reflected in
a slowdown in construction investment, which
includes both residential and commercial buildings,
that partly contributed to the moderation in
investment growth during 2008. Apart from falling
house prices in several countries, tighter financing
conditions and declining profitability also drove the
moderation in investment. Residential house prices
in the euro area decelerated from an annual growth
rate of 6.6 per cent in 2006 to 1.5 per cent in 2008 and decelerated to -3.1 per cent in 2009 (Table 3.42).
Falling residential house prices, by making
residential investment less profitable, depressed
construction investment. Fluctuations in the value
of commercial properties were more pronounced
than those observed for residential properties.
Business investment has also declined sharply over
the past year. Business investment slowed in the
euro area on account of the weakening of demand,
historically low capacity utilisation, lowering of
profitability, low business confidence, and tighter
lending standards which raised financing costs
coupled with reduced funding availability. In view
of these developments, the euro area entered into
recession in the second quarter of 2008, with the
three largest economies – Germany, France and
Italy – all contracting.
Table 3.42: Residential Property Prices in the Euro Area |
(annual % change) |
|
Weight
% |
1999-
2005
average
annual
change |
2006 |
2007 |
2008 |
2009 |
2009 |
2009 |
2010 |
H1 |
H2 |
Q1 |
Q2 |
Q3 |
Q4 |
Q1 |
1 |
2 |
3 |
4 |
5 |
6 |
7 |
8 |
9 |
10 |
11 |
12 |
13 |
14 |
Belgium1 |
3.7 |
7.5 |
11.8 |
9.3 |
4.8 |
-0.3 |
-0.6 |
-0.1 |
0.9 |
-2.1 |
-1.4 |
1.2 |
– |
Germany2 |
27.0 |
-0.9 |
0.2 |
0.7 |
1.0 |
-0.2 |
– |
– |
– |
– |
– |
– |
– |
Ireland2 |
2.1 |
12.0 |
13.6 |
-0.5 |
-9.1 |
-13.7 |
-11.3 |
-16.1 |
-11.0 |
-11.6 |
-13.8 |
-18.5 |
-18.9 |
Greece2 |
2.5 |
9.5 |
13.0 |
6.2 |
1.5 |
-4.7 |
-4.1 |
-5.2 |
-4.2 |
-4.1 |
-5.2 |
-5.3 |
– |
Spain2) |
11.7 |
13.8 |
10.4 |
5.8 |
0.7 |
-7.4 |
-7.6 |
-7.1 |
-6.8 |
-8.3 |
-8.0 |
-6.3 |
-4.7 |
France1 |
21.1 |
11.2 |
12.1 |
6.6 |
1.2 |
-7.1 |
-8.1 |
-6.2 |
-6.9 |
-9.3 |
-7.9 |
-4.4 |
|
Italy2 |
17.1 |
6.9 |
5.8 |
5.0 |
2.6 |
-0.5 |
-0.3 |
-0.7 |
– |
– |
– |
– |
– |
Cyrus2),3) |
0.2 |
– |
10.0 |
15.0 |
13.0 |
-6.0 |
– |
– |
– |
– |
– |
– |
– |
Luxembourg2 |
0.4 |
11.1 |
10.8 |
10.1 |
– |
– |
– |
– |
– |
– |
– |
– |
– |
Malta2 |
0.1 |
10.8 |
3.5 |
1.1 |
-2.7 |
-5.0 |
-7.9 |
-2.0 |
-9.9 |
-6.0 |
-2.5 |
-1.4 |
– |
Neitherlands1 |
6.3 |
7.8 |
4.6 |
4.2 |
2.9 |
-3.3 |
-1.5 |
-5.1 |
-0.3 |
-2.8 |
-5.1 |
-5.0 |
-4.3 |
Austria2,4 |
3.0 |
0.7 |
4.0 |
4.1 |
1.3 |
|
4.6 |
|
4.3 |
4.9 |
3.4 |
|
|
Portugal2 |
1.8 |
2.9 |
2.1 |
1.3 |
3.9 |
0.4 |
1.5 |
-0.7 |
2.7 |
0.3 |
-0.8 |
-0.6 |
– |
Slovania |
0.4 |
– |
17.6 |
22.6 |
3.1 |
-8.2 |
-8.4 |
-8.0 |
-7.1 |
-9.8 |
-10.9 |
-5.1 |
– |
Slovaka1 |
0.6 |
– |
16.8 |
23.9 |
22.1 |
-11.1 |
-8.9 |
-13.3 |
-4.3 |
-13.4 |
-14.3 |
-12.3 |
– |
Finland1 |
2.0 |
– |
|
5.5 |
0.6 |
-0.3 |
-4.5 |
4.1 |
-5.5 |
-3.6 |
0.4 |
7.9 |
11.3 |
Euro Area |
100.0 |
6.4 |
6.6 |
4.5 |
1.5 |
-3.1 |
-3.1 |
-3.1 |
– |
– |
– |
– |
– |
Note: Weights are based on 2007 nominal GDP.
1. Existing dwellings (houses and flats); whole country.
2. All dwellings (new and existing houses and flats); whole country.
3. Th property price index is estimated by the Central Bank of Cyprus.
4. Up to 2000; data for Vienna only.
Source: ECB Bulletin, May 2010. |
3.148 From a sectoral perspective, the slowdown
in activity was broad-based, although more marked
in the industrial sector, which tends to display
greater sensitivity to economic cycles (Chart III.21).
Manufacturing activity fell abruptly in the second
half of 2008, in particular with regard to capital
goods, which suffered from weaker external
demand, rapid depletion of order backlogs and
sharp cuts in activity in the car industry.
Construction continued to be very weak, despite a
temporary boost in the first quarter of 2009 owing
to good weather conditions, with a steady
deterioration in the residential sector, which was
particularly severe in some countries. Although
more resilient, services grew at their slowest pace
since 2004, against the background of weak private
consumption and slackening business activity.
3.149 A weak and uneven recovery is underway
in Europe. Macroeconomic policies still support the
upswing and extraordinary measures are underway
to address the sovereign crisis. Now policymakers
face the difficult balancing act between continuing
their support for the economy and establishing a
credible path to policy normalization. The spike in
government bond spreads in Greece in January
2010, and the spillovers to Portugal, Spain, and
other advanced economies with important fiscal challenges, have underscored continuing fragilities.
After more than a year, the trend of growth in Euro
area continued to be skewed and volatile
particularly in the Central and Eastern EU
countries. The Greek debt crisis deepened in mid-
April 2010 increased significant risks to the euro
recovery. Euro area real GDP rose, on a quarterly
basis, by 0.2 per cent in the first quarter of 2010,
following an increase of 0.1 per cent in the final
quarter of 2009. Although, GDP growth improved,
however, the rate of unemployment continued to
be at higher level. In comparison with US, the
unemployment rate began to increase in Euro area
latter but it stood at 10 per cent level in March 2010.
Private consumption declined by 0.1 per cent, on
a quarterly basis, in the first quarter of 2010, after
increasing by 0.2 per cent in the fourth quarter of
2009. The continued weakness in household real
disposable income, which has mainly reflected a
decline in employment. On the supply side, in the
first quarter of 2010, industrial production expanded
in February, by 0.9 per cent month on month,
following a 1.6 per cent increase in January. As a
consequence of these increases, industrial
production in the first two months of 2010 was on
average substantially above its level in the final
quarter of 2009. Value added in the industrial sector
(excluding construction) grew by 2.2 per cent in the
first quarter of 2010, following increases of 0.3 per
cent in the fourth quarter of 2009 and 2.1 per cent
in the third quarter.
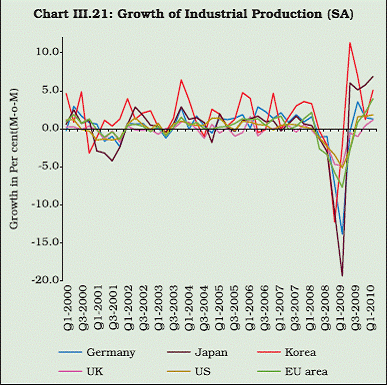 |
Japan
3.150 As regards Japan, its recovery from a
decade of stagnation in economic growth received
a setback during the financial crisis through the
collapse of external demand with serious knockon
effects on domestic economic activity.
Economic expansion in Japan ended abruptly in
2008, with slightly positive growth in the first
quarter followed by a marked decrease in overall
production thereafter. Strong external demand and
domestic investment supported real GDP growth
in the first quarter. However, substantial declines
in net exports and business investment – which
had been the driving force of the Japanese recovery in previous years – along with restrained
consumption owing to increasing labour market
uncertainty and declining real incomes offset the
positive growth of the first quarter and resulted in
negative GDP growth rates for the rest of the year.
In the first quarter of 2010, real GDP expanded
by 1.2 per cent quarter on quarter according to
the first preliminary data release of Japan’s
Cabinet Office. Economic activity was mainly
driven by net exports of goods and services, which
accounted for 0.7 percentage point of the quarterly
real GDP growth, and by private demand (0.5
percentage point). For the first time in two years,
personal consumption and residential and
business investment showed positive quarterly
growth rates.
3.151 While the Japanese banking sector
remained relatively resilient to the global financial
market turmoil, substantial stock market losses and
the intensification of the financial turmoil had a
negative impact on firms’ investment and
consumption in the second half of 2008. A strong
appreciation in effective terms of the Japanese yen
put additional downward pressure on profitability
and investment in export-oriented industries. In view
of the rapid deterioration in economic conditions,
the Bank of Japan lowered its target for the
uncollateralised overnight call rate cumulatively by
40 basis points to 0.1 per cent by December 2008;
it had earlier left the target unchanged since
February 2007 (ECB Annual Report, 2008).
3.152 The fiscal policy measures undertaken to
combat the adverse impact of the financial crisis
on the real economy, particularly the contraction in
demand, led to sharp deterioration in the fiscal
position of sovereign governments, with fiscal deficit
rising to double-digit levels in many of the advanced
economies in 2009 (Table 3.43). Japan’s high fiscal
deficit and net public debt may raise concerns
about fiscal sustainability, and the anticipation of a
sizeable fiscal adjustment in coming years could
weigh on the recovery. After the financial crisis,
Japan’s potential growth rate is projected to fall from
about 1½ percent in 2007 to around 1 percent over the medium term, led by a shrinking labor force and
slower capital accumulation dampening the cyclical
rebound.
Table 3.43: Government Fiscal Balance |
(Per cent of GDP) |
|
Average
1994-
2003 |
2006 |
2007 |
2008 |
2009 |
2010P |
1 |
2 |
3 |
4 |
5 |
6 |
7 |
Major advanced economies |
-3.6 |
-2.3 |
-2.1 |
-4.7 |
-10.0 |
-9.5 |
United States |
.. |
-2.0 |
-2.7 |
-6.6 |
-12.5 |
-11.0 |
Euro area |
-2.7 |
-1.3 |
-0.6 |
-2.0 |
-6.3 |
-6.8 |
Japan |
-6.0 |
-4.0 |
-2.4 |
-4.2 |
-10.3 |
-9.8 |
United Kingdom |
-2.1 |
-2.6 |
-2.7 |
-4.8 |
-10.9 |
-11.4 |
P: Projected.
Source: World Economic Outlook Report, April 2010. |
Emerging Market Economies
3.153 While advanced economies were
slowdown rapidly, the emerging market economies
appeared relatively insulated from the crisis in the
initial phases. However, with the deepening of the
crisis from September 2008, as global growth
slowed substantially with advanced economies
falling into recession, the growth in EMEs also came
down sharply. The IMF estimated the GDP growth
of emerging market and developing economies to
decelerate to 2.4 per cent in 2009, down from 6.1
per cent in 2008. This downturn is clear evidence
that the forces of globalisation are too strong for
the decoupling hypothesis to work.
3.154 International trade and finance were the
two major channels through which the crisis
affected the real economies of the EMEs (Box III.4).
The drying-up of external funds, particularly trade
credits, made international trade more difficult and
put great strain on smaller firms in emerging
economies that have few internal sources of
working capital. This, coupled with the decline in
external demand for products from countries in
recession, resulted in a synchronised global
collapse in trade and industrial production. The
IMF estimated world trade to have contracted by
10.7 per cent in volume terms during 2009 (see
Table 3.22).
Box III.4
Transmission Channels of Financial Crisis: Financial and Real Linkages
The current financial crisis has been transmitted to the
emerging market economies in three phases. The period
between February 2007 and May 2008 appears to have
been a brief golden age of decoupling of emerging
economies when they largely remained insulated from the
financial crisis. However, in the second and third phases
the world economy moved closely in tandem, largely
negating the ‘decoupling’ argument.
In terms of geographical expansion, three factors led to
the transmission of the financial crisis from advanced
economies to EMEs. The shocks from the financial market
were relatively less persistent, although there was a
dramatic increase in uncertainty in financial markets and
cross-country capital flows reversed towards safer
destinations. In this period of a credit crunch, the stock
markets crashed and financial market became volatile. The
EMEs were relatively insulated from developments in the
US financial market primarily due to the limited exposure
of their financial system to the toxic innovative products.
The persistent shock to the real economic activity
emanated from the trade channel, which emerged as the
single most important factor that contributed to sharp
declines in economic activity in the expectation of
weakening external demand. The confidence channel
emerged due to the collapse of big financial institutions
that raised uncertainty in the global economic environment
and spread a negative investment outlook.
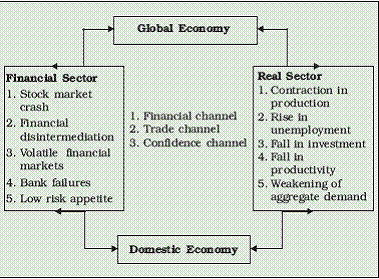 |
1. Financial Channel
The financial markets in EMEs were relatively immune
largely due to their limited exposure to sub-prime and
related products, the so-called toxic assets, unlike
European countries. As of May 2008, the total reported
write-downs and credit losses of the world’s 100 biggest
banks and securities amounted to US$ 379 billion. Of these, Asia (excluding Japan) accounted for US$ 10.8
billion, which was less than 3 per cent of global losses
(William E. James, 2008). However, real economic impacts
through the financial channel could not be ignored. In
particular, the availability of loanable funds was a key factor
that influenced investment behaviour independent of the
cost of capital. Available bank credit to the private sector
may be quantitatively the most important variable in
determining the amount of actual investment in developing
countries (Gertler, 1988; Hubbard, 1998; Jongwanich and
Kohpaiboon, 2008).
2. Trade channel
Initially, global trade did not collapse due to the slowdown
of economic activity in the advanced countries, since over
the period there was significant expansion of trade
relations amongst the EMEs. The economic recession in
the G-3 economies had ultimately led to a contraction in
their import demand, thereby discouraging exports from
developing EMEs. The effects of the slowdown in G-3
demand varied across industries and countries. The
electronics sector was severely affected since the extent
of intra-Asian trade in parts and components in this
industry is perhaps larger than in any other industry. In
addition, this industry is probably more dependent on the
G-3 markets than others and the products of this industry
display high world income elasticity.
3. Confidence channel
The confidence channel broadly operated through the
stock market. Major events such as the collapse of Lehman
Brothers, with implications for financial stability, had
negative spillover effects on EMEs’ stocks. The loss of
investor confidence in EMEs’ equity markets closely
mirrored that of the US, and the two markets have moved
in tandem since August 2007. Falling stock markets further
dampened business and consumer confidence, resulting
in the slowdown of economic activity and banking business.
Stock market slumps may also have had a significant
negative effect on the balance sheets of banks, especially
for banks with substantial exposure to equities.
To sum up, the financial crisis spread through three major
channels, of which the financial channel played the
dominant role in the slowdown in the real sector due to
increasing financial deepening and global financial
integration. As regard the trade channel, the impact were
somewhat reduced by the rebalancing of economic activity
by all the countries that were affected by the trade channel.
However, the confidence channel was critical in
exacerbating the impact of the finance and trade channels
on the overall financial crisis.
3.155 Economic growth in emerging Asia held up
well despite the financial market turbulence and
weakness in exports, mainly supported by strong
domestic investment rates supported by high
savings (Table 3.44). This could also be attributed
to macroeconomic fundamentals which were much
healthier than they were 10 years ago—as reflected
in the improved sovereign credit ratings of the
countries. Asian countries have cut back domestic
spending, reduced fiscal deficits, and reformed their
economies. Moreover, corporate balance sheets in
Asia have improved as debt-to-equity ratios
reduced sharply and foreign currency borrowing
was no longer a large component of corporate
sources of funding in most countries.
3.156 Amid the broadening of the economic
slowdown and tight global financial conditions,
export growth declined sharply in the second half
of 2008, especially in small open economies, such
as Singapore, Taiwan and Hong Kong. The overall
slowdown in economic activity was also driven by
a weakening of domestic demand owing to
deteriorating consumer and business confidence,
and the downturn in real estate investment (ECB
Annual Report, 2008). Within emerging Asia, the
adverse impact of the contraction in trade on
economic growth varied depending on the
contribution of final external demand to total value
added in these economies. Malaysia and Thailand
suffered most from a double-digit fall in exports. The global downturn also affected growth in Indonesia
and the Philippines. However, with both countries
less reliant on exports than many of their emerging
East Asian neighbours, their respective slowdowns
were not as dramatic. The four middle-income
ASEAN economies (Indonesia, Malaysia, the
Philippines, and Thailand) contracted by 1.0 per
cent in the first quarter of 2009. In line with the
slowdown in economic activity, industrial production
declined for all ASEAN-4 economies except
Indonesia. To date, ASEAN-4 economies have been
affected much less by the current crisis than during
1997-98.
3.157 Within Asia, economic contraction in the
NIEs was the worst since the 1997-98 Asian
financial crisis due to the precipitous drop in exports
and weak domestic demand. The fall in export
growth resulted in substantial reduction in GDP
growth due to the heavy reliance of these countries
on an export-led growth model. Consumption has
fallen substantially in line with the fall in income
and weakening of consumer confidence due to
heightened uncertain economic environment. In
terms of share, the fall in exports and imports has
been somewhat offset by the rise in the share of
government consumption expenditure in GDP
mainly due to the rebalancing of the economy
towards domestic sectors. The collapse in global
demand led to a dramatic slowdown in NIEs’ exports
during the first five months of 2009. Along with the precipitous drop in domestic demand, industrial
production fell sharply. However, the pace of the
decline has begun to moderate. The worst-hit
economies were Taiwan and Singapore, where
GDP in the first quarter fell by 10.2 per cent and
9.6 per cent, respectively. Double-digit declines in
fixed investments and exports contributed to the
steep fall in Taiwan’s GDP. Hong Kong’s economy
also continued to shrink in the first quarter of 2009,
declining by 7.8 per cent, with both external and
domestic demand contracting. Meanwhile, the
Republic of Korea’s economy contracted 4.2 per
cent in the first quarter of 2009; however, the decline
may have stopped as the economy grew by 0.5 per
cent (seasonally adjusted annualised rate)
compared with the last quarter of 2008. Collectively,
economic growth in the NIEs has declined more
than during the 1997-98 Asian financial crisis,
although the pace of decline has been less steep.
The growth continued to decline till the first half of
2009-10 and turned positive in the fourth quarter
of 2009. In the fourth quarter of 2009, Korea
witnessed significant increase in growth to 6.0 as
against 2.6 per cent in Hong Kong and 4.0 per cent
in Singapore.
Table 3.44 : Real GDP Growth, Investment and Export – Select Asian Economies |
(as a percentage of GDP) |
|
Real GDP Growth |
Investment Rate (Percentage to GDP) |
Merchandise Exports Growth |
2007 |
2008 |
2009 |
2007 |
2008 |
2009 |
2007 |
2008 |
2009 |
1 |
2 |
3 |
4 |
5 |
6 |
7 |
8 |
9 |
10 |
China |
13.0 |
9.6 |
8.7 |
41.7 |
42.5 |
45.8 |
25.8 |
17.6 |
-16.1 |
Hong Kong |
6.4 |
2.1 |
-2.7 |
20.9 |
20.5 |
22.5 |
8.9 |
5.6 |
-11.9 |
India |
9.2 |
6.7 |
7.2 |
37.6 |
35.6 |
34.5 |
28.9 |
13.7 |
-15.0 |
Indonesia |
6.3 |
6.0 |
4.5 |
24.9 |
27.8 |
31.0 |
14.0 |
18.3 |
-14.4 |
Korea |
5.1 |
2.3 |
0.2 |
29.4 |
31.2 |
25.9 |
14.2 |
14.2 |
-13.7 |
Malaysia |
6.2 |
4.6 |
-1.7 |
21.7 |
19.1 |
14.0 |
9.6 |
13.1 |
-21.1 |
Philippines |
7.1 |
3.8 |
0.9 |
15.4 |
15.2 |
14.0 |
6.4 |
-2.5 |
-22.3 |
Singapore |
8.2 |
1.4 |
-2.0 |
20.7 |
30.1 |
27.6 |
10.1 |
13.0 |
-20.3 |
Thailand |
4.9 |
2.5 |
-2.3 |
26.4 |
28.9 |
21.9 |
18.2 |
15.9 |
-13.9 |
Source: Asian Development Outlook 2010, ADB. |
3.158 Amid the slowdown across most of
emerging East Asia, China remains a major bright
spot as it continued to grow at a healthy rate during
the first half of 2009. Its 6.1 per cent GDP growth
in the first quarter of 2009 was the lowest since the
introduction of quarterly GDP figures in the fourth
quarter of 1999. But growth performance improved
in the second quarter, increasing by 7.9 per cent
and reached 11.9 per cent in first quarter of 2010.
Like other emerging East Asian economies,
however, Chinese exports were badly affected by
the plunge in external demand, falling 22.2 per cent
in May 2009. However, continued strong growth in
fixed-asset investment, which was given added
impetus by the government’s massive stimulus
package, managed to offset the effects of declining
exports (Box III.5). Fixed-asset investment growth
accelerated to 38.7 per cent in May 2009, compared
with 25.4 per cent in May 2008 and moderated to
26.1 per cent in April 2010. However, consumer
demand, as reflected by retail sales growth, weakened to 13.7 per cent in April before rising
again to 14.9 per cent in May 2009 and increased
to 18.5 per cent in April 2010.
Latin America
3.159 Economic growth in Latin America was
robust in the first half of 2008. Inflationary pressures
were elevated and rose throughout the year, with
inflation rates for the region increasing to 8.7 per
cent in 2008 from 6.1 per cent in 2007. Countries
with fixed or quasi-fixed exchange rates recorded
higher inflation than those with an inflation-targeting
regime. Improved macroeconomic fundamentals,
high commodity prices and strong domestic
demand continued to support the economic outlook
in the first half of 2008, although they also resulted
in increased inflationary pressures. However, from
mid-September 2008 external financial conditions
deteriorated as the global financial crisis unfolded.
In particular, spreads on credit default swaps on
Latin American sovereign debt widened
considerably, especially in Argentina and Venezuela
(by around 4,000 and 3,000 basis points
respectively at the end of the year). In addition,
currencies fell vis-à-vis the US dollar, equity
markets dropped significantly by around 50 per cent
over the year and liquidity shortages emerged.
Brazil and Mexico were particularly hit by liquidity
shortages, as large outflows affected the financial
landscape of the region. For 2010, regional GDP is
expected to grow by 4 percent—good performance
by historical standards. Real linkages with the Latin
American region are limited to Greek crisis, but the
region could be affected if tail risks materialize.
Exports to Greek, Italy, etc. account for less than 5
percent of total exports of the LAC region, limiting
contagion through real channels. However, in an
extreme scenario, a sovereign debt crisis in
Southern Europe could have spillovers through
market confidence effects. The recovery in global
capital markets has been faster than anticipated,
contributing to a positive short-term growth in
advanced economies, and easing external
financing conditions for emerging markets have
significantly buoyant the overall economic
environment in Latin America in 2010. However, fiscal prudence and weak growth continue to be a
key challenge in the region.
Box III.5
Impact of the Global Crisis on Asia
The current global economic slowdown has had a
significant impact on the Asian economy through its
external sector linkages. The Asian economies were
witnessing high growth led by an export-driven growth
model. During the 1990s, world trade rose by around 7 per
cent on average, providing impetus to Asian economies’
growth performance. The Asian region is highly dependent
on exports particularly on US consumption, which is
responsible for about one-fourth of Asia’s export value
added. In the midst of the global financial crisis, the demand
for Asian exports dropped significantly, resulting in overall
contraction in trade. In the last quarter of 2008, real exports
fell by 6.5 per cent in the United States, 6.7 per cent in the
euro area, 13.8 per cent in Japan and an estimated 10 per
cent in China. Industrial production in the Asian economies
decelerated significantly in line with the sharp deceleration
in demand from the advanced economies (Chart). The
Asian economies rely heavily on the export sectors, the
contribution of final external demand to total value added.
As the crisis struck the world economy, trade and financial
flows, which used to act as powerful drivers of globalisation, abated at the end of 2008, further
transmitting the effect of the crisis across borders. The
crisis has resulted in significant weakening of consumer
and investor confidence. Despite efforts of rebalancing
growth through domestic sectors, the poor consumer and
investor confidence prolonged the recovery from the crisis.
The most interesting fact which emerged from the crisis is
that there was a synchronised fall in confidence which
heightened the uncertainty. The weakening of economic
activity and wealth effects due to corrections in asset prices
resulted in a huge fall in consumption and investment
activity.
In the period of weakening of demand both domestically
and externally, discretionary fiscal measures were
undertaken in Asian economies. As a result, the strong
fiscal response played an important role in stabilising Asian
economies during the first half of 2009. As per the IMF,
simulations using the IMF’s Global Integrated Monetary
and Fiscal (GIMF) model estimated that fiscal stimulus
accounted for, on average, about 1¾ percentage points of
GDP growth in the first half of 2009 in Asia.
References
1. Adams, C. 2006. “Global Current Account Imbalances.” Lee
Kuan Yew School of Public Policy. National University of Singapore.
2. Jongwanich, J. 2007. “Determinants of Export Performance
in East and Southeast Asia.” ERD Working Paper No.106.
Economics and Research Department, Asian Development
Bank. Manila.
3. Asian Development Bank. 2009. Asian Development
Outlook 2009. Manila, Philippines.
Impact on Labour Market
3.160 The financial crisis had an adverse impact
on the level of employment. The erosion of
economic activity and depressed economic
environment led to rapid lay-offs, both in private corporate businesses and factories. The fall in
employment was prominent in the manufacturing
sector, which has a higher sensitivity to financial
crises due to its dependence on international trade.
Labour market conditions deteriorated further due
to the reversal of labour migration. The inefficient
allocation factors of production such as capital and
labour led to sharp falls in productivity during the
current financial crisis (Box III.6).
Box III.6
Labour Productivity Analysis during Boom and Bust Period
The economic literature provides strong evidence that
financial crises are periods of turbulence, that often result
in lay-offs, a strained labour market and, at times, high
losses of skills from the displacement of workers from crisis
sectors to non-crisis sectors (Ljungqvist and Sargent,
1998). In the period of crisis, the fall in output is largely
attributed to a fall in factor productivity as a result of higher
prices of factors of production, protectionist tendencies
and significant fall in research & development. In a crosscountry
analysis, empirical estimates of the impact of the
productivity shock on output shows that output falls by
nearly 4.5 per cent, which is close to half (46 per cent) of
the overall impact of the crisis on GDP (Chart). TFP
(measured as y/k) falls by about 4 per cent, which is
roughly 43 per cent of the corresponding fall.
During the period of financial crisis, due to rapid and large
relative price changes, many workers have to move to
occupations and sectors that are very different from their
prior employment experience. Thus, one can expect more
displaced workers to find themselves in jobs for which their
accumulated skills are ill-suited, and where new skills must
be acquired, causing at least transitory losses in
productivity. In normal times, this effect disappears and
the differences in the change of wages are small or
imprecisely measured. Earnings losses for movers are over
14 per cent higher than for stayers during the crisis. Outside
the crisis, these relative losses do not show any clear
pattern and are rarely statistically significant. A sudden
drop in the quality of labour causes the capital-output ratio
to fall and, hence, should cause utilisation of capital as well. The endogenous response of utilisation should
therefore magnify the effect of labour turbulence on TFP.
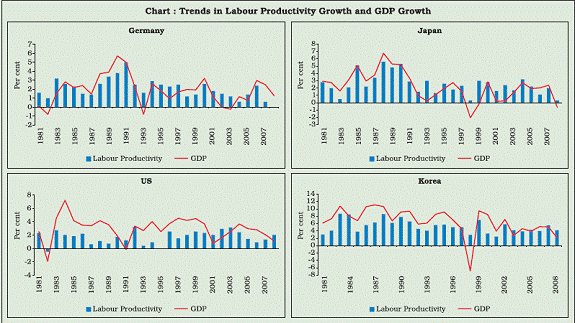 |
The current financial crisis originated in the fall in the
housing sector which has direct linkages with the
construction sector. The construction sector emerged as
an important driver in the fall in labour productivity in the
US. The construction sector is around 5 per cent of total
GDP, but due to poor productivity performance it has been
a significant drag on aggregate productivity. In 2007, an
abysmal negative 12 per cent labour productivity growth
in construction accounted for negative 0.6 percentage
points of aggregate productivity growth (OECD 2009).
The construction of new dwellings in the US remained
high up to early 2006; afterwards, it started to decline
steadily. In parallel, the negative labour productivity
growth in the construction sector, after a short
improvement in 2005, started again to decelerate strongly
during 2006 and 2007. This suggested a serious excess
supply problem. In contrast, the housing price bubble was
still inflating in 2005; it levelled during 2006 but started
to decline at the beginning of 2007. It is significant to
note that the boom years of the mortgage and sub-prime
business (2005-2006) coincide precisely with the periods
where productivity performance was deteriorating rapidly,
as if a substantial boost in demand through extended
credit conditions could have compensated for the supplyside
problems. There was clear evidence that pressure
on the housing sector mainly emanated from a fall in
productivity before the actual cooling of the housing
market. On the other hand, disproportionate growth of
financial activity in the housing market away from the real
activity in the housing sector resulted in a mismatch of
optimism about housing prices and the collapse of the
financial system.
The ordinary least square estimates suggest that the
financial crisis had a higher negative impact on output in
the US and Korea than in Japan, which is possibly due to
long phase of recession in Japan. This negative impact of
the financial crisis is captured by a dummy variable; for
the period when the crisis struck the economy it is 1, while
for normal years it was defined as 0.1
Historically, it may be observed that labour productivity
has a significant relationship with a financial crisis. In select
countries, the average relationship of labour productivity
growth tends to increase further during a financial crisis.
This suggests that output growth expands/contracts in
response to the shock in the labour market.
To sum up, the above analysis suggests that the period of
financial crisis does impact the productivity growth due to
strained impact on the labour market segment. The labour
market shocks lead to a fall in total factor productivity which
coupled with low investment activity in depressed business
sentiments, cascades the impact of the financial crisis on
the output in the economy.
References
1. Aghion, P., P. Askenazy, N. Berman, G. Cette and L.
Eymard. 2008. “Credit constraints and the cyclicality of
R&D investment: Evidence from France.” PSE Working
Papers 2008-26, PSE. (Ecolenormale supérieure).
2. Beaulieu, J. J. and J. Mattey. 1998. “The workweek of
capital and capital utilization in manufacturing.” Journal of
Productivity Analysis. Vol. 10: 199-223.
3. Bassanini, A. and R. Duval. 2006. “The determinants of
unemployment across OECD countries: reassessing the
role of policies and institutions.” OECD Economic Studies
No. 42, 2006.
3.161 Among the advanced economies, in the
United States the total hours worked were cut at
an annualised pace of 9 per cent in the first quarter
of 2009 following an equally large cut in the
preceding quarter, lifting the unemployment rate to
9.4 per cent by May 2009. Over the past few years,
euro area labour markets had performed very
positively, with strong increases in employment,
rising participation levels and low unemployment rates. However, during crisis Euro area
unemployment rate reached a 25-year high of 7.2
per cent in March 2008. With the onset of the
financial turmoil and the associated sharp
economic downturn, unemployment began to
increase markedly (Table 3.45). In August 2009 the
euro area unemployment rate was at 9.6 per cent
– the highest rate recorded in a decade. Since then
it increased further to 10.1 per cent in April 2010.
In the euro area, sustained growth in the labour
supply, coupled with weak demand for labour, was
behind the steady increase in the unemployment
rate. A marked decline in the ratio of job offers to
applicants since the beginning of 2009 suggests
that the employment downturn in Japan is likely to
deepen further. Within EMEs, during the current crisis,
India and China have each lost 10 million jobs and
14,000 jobs have gone in South African mining.
Table 3.45: Unemployment Rates |
(Per cent) |
|
Euro Area 16 |
Bulgaria |
Czech Republic |
Denmark |
Estonia |
United Kingdom |
Hungary |
Lithuania |
Latvia |
Poland |
Romania |
Sweden |
1 |
2 |
3 |
4 |
5 |
6 |
7 |
8 |
9 |
10 |
11 |
12 |
13 |
2005Q1 |
9.4 |
10.8 |
8.1 |
5.2 |
9.0 |
4.7 |
6.8 |
9.6 |
9.4 |
18.2 |
7.7 |
7.4 |
2005Q2 |
8.9 |
10.2 |
8.0 |
5.1 |
8.2 |
4.7 |
7.3 |
8.7 |
9.4 |
18.3 |
7.4 |
7.9 |
2005Q3 |
8.7 |
9.6 |
7.8 |
4.7 |
7.2 |
4.7 |
7.3 |
7.7 |
8.8 |
17.7 |
6.7 |
7.8 |
2005Q4 |
8.9 |
9.8 |
7.9 |
4.2 |
7.1 |
5.1 |
7.4 |
7.1 |
8.0 |
16.9 |
6.9 |
7.6 |
2006Q1 |
9.2 |
9.2 |
7.7 |
4.2 |
6.1 |
5.2 |
7.4 |
5.8 |
7.4 |
15.6 |
7.0 |
7.5 |
2006Q2 |
8.2 |
9.2 |
7.2 |
4.1 |
6.3 |
5.4 |
7.4 |
5.7 |
7.3 |
14.4 |
7.2 |
7.3 |
2006Q3 |
8.0 |
9.2 |
7.0 |
3.7 |
5.6 |
5.5 |
7.5 |
6.1 |
6.4 |
13.3 |
7.6 |
6.9 |
2006Q4 |
8.1 |
8.4 |
6.6 |
3.7 |
5.6 |
5.5 |
7.6 |
4.9 |
6.2 |
12.3 |
7.3 |
6.6 |
2007Q1 |
8.0 |
7.6 |
5.8 |
4.1 |
5.0 |
5.5 |
7.2 |
4.5 |
6.4 |
10.8 |
6.4 |
6.4 |
2007Q2 |
7.3 |
7.0 |
5.5 |
3.7 |
5.1 |
5.3 |
7.2 |
4.2 |
5.9 |
9.8 |
6.7 |
6.1 |
2007Q3 |
7.3 |
6.9 |
5.1 |
3.9 |
4.3 |
5.3 |
7.3 |
4.3 |
6.1 |
9.3 |
6.4 |
6.0 |
2007Q4 |
7.3 |
6.2 |
5.0 |
3.4 |
4.1 |
5.1 |
7.8 |
4.4 |
5.5 |
8.6 |
6.2 |
6.1 |
2008Q1 |
7.6 |
6.1 |
4.5 |
3.2 |
4.0 |
5.2 |
7.6 |
4.3 |
6.1 |
7.5 |
5.7 |
5.9 |
2008Q2 |
7.3 |
5.9 |
4.4 |
3.1 |
4.1 |
5.3 |
7.8 |
4.5 |
6.2 |
7.3 |
5.8 |
6.0 |
2008Q3 |
7.3 |
5.3 |
4.3 |
3.3 |
6.4 |
5.8 |
7.8 |
6.4 |
7.5 |
7.0 |
5.8 |
6.2 |
2008Q4 |
7.9 |
5.1 |
4.5 |
3.7 |
7.7 |
6.3 |
8.1 |
8.2 |
10.3 |
7.0 |
5.9 |
6.7 |
2009Q1 |
9.3 |
5.9 |
5.5 |
4.8 |
11.0 |
7.0 |
9.2 |
11.2 |
13.3 |
7.5 |
6.2 |
7.5 |
2009Q2 |
9.2 |
6.4 |
6.5 |
6.1 |
13.5 |
7.7 |
9.8 |
13.5 |
16.4 |
8.0 |
6.4 |
8.4 |
2009Q3 |
9.4 |
7.0 |
7.3 |
6.2 |
15.2 |
7.8 |
10.5 |
14.3 |
18.8 |
8.5 |
7.2 |
8.6 |
2009Q4 |
9.8 |
8.0 |
7.4 |
7.1 |
15.6 |
7.8 |
10.6 |
15.9 |
20.2 |
8.9 |
7.6 |
8.8 |
2010Q1 |
10.5 |
8.6 |
7.8 |
7.1 |
19.0 |
|
10.9 |
17.4 |
21.5 |
9.7 |
NA |
8.9 |
Source: European Central Bank. |
3.162 In an integrated world, every region has
been affected by the current global crisis,
irrespective of the differences in their economic
structures or policy frameworks. The volatilities in
the financial markets along with the slowdown in
economic activities in the advanced economies
were, in fact, transmitted to the EMEs through all
three channels – trade, financial and confidence –
on account of the increased global integration
witnessed in recent years. As a result, the
decoupling theory which had gained prominence
during the pre-crisis period has been discredited.
The sharper declines in trade flows in the wake of
the current financial crisis could be attributed to
the increasing presence of global supply chains in
total trade as also to the rapid developments in
financial markets which led to the financialisation
of global trade. The collapse in commodity prices
has been a further blow to the value of global trade
and has adversely affected the net commodity
exporters. Thus, the crisis has highlighted the
vulnerability of a growth strategy that is based on
over-dependence on export demand. Consumption
and investment witnessed sharp contractions in line
with the fall in output and productivity. Industrial
production collapsed in response to contraction in
global trade while unemployment rates touched an
all-time high.
V. CONCLUDING OBSERVATIONS
3.163 The flow of capital between nations, in
principle, brings benefits to both capital-importing
and capital-exporting countries. But the historical evidence, reinforced by the current global financial
crisis, clearly shows that it can also create new
exposures and bring new risks. The failure to
analyse and understand such risks, excessive
haste in liberalising the capital account and
inadequate prudential buffers to cope with the
greater volatility in more market-based forms of
capital allocation have compromised financial or
monetary stability in many emerging market
economies. In an integrated world, every region has
been affected by the current global crisis,
irrespective of the differences in their economic
structures, financial systems or policy frameworks.
3.164 Almost all segments of the global financial
markets experienced tremors of the financial crisis,
though to varying degrees. Interbank markets in
advanced economies were the first one to be
affected by the crisis – this market segment suffered
from a severe liquidity crisis as banks became
reluctant to lend to one another for fear of
counterparty risks. Subsequently, the crisis spread
to the money markets as manifested in the
abnormal levels of spreads, shortening of
maturities, and contraction, or even closure, of
some market segments. In the wake of credit and
money markets witnessing a squeeze and equity
prices plummeting, banks and other financial
institutions experienced erosion in their access to
funding and capital base, owing to accumulating
mark-to-market losses. The pressure on financial
markets mounted with the credit spreads widening
to record levels and equity prices crashing to
historic lows, leading to widespread volatility across
the market spectrum.
3.165 Domestic interbank markets in EMEs,
however, did not seize up as severely as their
counterparts in developed countries, although they
experienced some liquidity strains largely due to
the ‘knock-on’ effects of the crisis. Stock markets
in EMEs, on the other hand, bore much of the heat
of the crisis as equity markets all over the world
witnessed high volatility, sharp declines in prices,
turnover volumes and market capitalisation. During
the second half of 2009, however, there have been
some signs of recovery in the health of global stock
markets. Government bond markets all over the world witnessed large swings in yields driven mainly
by direct and indirect consequences of the
intensified financial crisis. Corporate bond markets
of advanced economies exhibited relative resilience
during the current financial crisis, even though
corporate bond issuance from the EMEs declined
significantly amid heightening of spreads since the
second half of 2008. Commodity prices, which
reached record highs during the initial stages of
the crisis as investors sought to hedge against a
depreciating US dollar and possibly also as a hedge
against higher inflation, witnessed a reversal in
trend since the collapse of Lehman Brothers in
September 2008, leading to a slowdown in
economic activities.
3.166 Against the backdrop of large-scale
disruptions in international financial markets and
deteriorating macroeconomic conditions, financial
institutions also suffered significantly. Commercial
banks suffered from a decline in profitability and
large mark-to-market losses; as a result, the
liquidity problems transformed into a solvency
problem leading to bank failures in the US and other
matured economies in Europe. In order to restore
confidence and revive the financial system, there
were large-scale efforts by the governments and
central banks in advanced economies. The banking
system of the emerging market economies, on the
other hand, reflected relative resilience during the
crisis on account of their limited exposure to the
toxic assets and the regulatory and supervisory
measures taken to strengthen their balance sheets
in the aftermath of the East Asian crisis. The crisis
almost side-lined the investment banking industry,
while the financial performance of the monoline
insurers and hedge funds was impacted severely.
As a result, the crisis accelerated the trend towards
greater institutionalisation and transparency.
3.167 The tightening of credit conditions
combined with deleveraging and risk aversion by
banks and financial institutions led to a sharp
slowdown in private sector credit growth,
particularly in the advanced economies, which
worked as a channel for transmitting the crisis from
financial institutions to the real economy. The overall
deceleration in bank lending to the private sector was broadly based though more pronounced in the
case of household credit, including mortgages.
Despite co-ordinated policy efforts, bank lending
in the advanced economies remains restricted
during the recent months, while credit growth in the
EMEs is yet to pick up. Another channel through
which the financial crisis impacted the real economy
was through contraction in world trade especially
during the second half of 2008. The sharper
declines in trade flows in the wake of the current
financial crisis could be attributed to the increasing
presence of global supply chains in total trade as
also to the rapid developments in financial markets
which led to the financialisation of global trade. The
collapse in commodity prices has been a further
blow to the value of global trade and adversely
affected net commodity exporters. Thus, the crisis
has highlighted the vulnerability of the growth
strategy based on over-dependence on export
demand. Apart from decline in trade flows, net
private capital flows to EMEs also reversed,
reflecting global deleveraging and risk aversion on
the part of investors, which led to tightening of
external financing conditions. The impact, however,
varied depending on the country’s current account
and fiscal position. On the other hand, remittance
flows remained more stable than private capital
flows. The current and capital account
developments across countries indicate signs of
rebalancing of the global imbalances in the recent
period.
3.168 The global crisis that mainly emanated from
the crisis in the financial sector resulted in
widespread recession and caused serious output
loss and heightened global uncertainties.
Interestingly, factors such as globalisation, trade
and capital flows which were major drivers of growth
and prosperity of the world economy witnessed
sharp contraction. The synchronised global
economic recession has challenged the theory of
decoupling which was emerging during the period
before the economic crisis. In fact, the crisis
transmitted to the EMEs through all the channels
such as trade, financial and confidence channels on account of increased global integration
witnessed in recent years. As a result, GDP growth
witnessed sharp contraction and the baseline global
growth scenario for 2009 fell into a negative
trajectory. Many countries witnessed significant
losses in their potential output. Consumption and
investment witnessed sharp contraction in line with
the fall in output and productivity. The industrial
production collapsed in response to contraction in
global trade, while unemployment rates touched an
all-time high.
3.169 As demonstrated during the current crisis,
while rising trade integration with the global
economy and the increasing importance of their
firms and households in international finance over
the past decade have brought enormous economic
and financial benefits to the EMEs, they have also
widened channels through which a slowdown in
economic activity in advanced economies could
spread to the EMEs. Of the three major channels
of contagion, the trade channel which has the
strongest linkages with the financial and real sector
has inflicted heavy loss of output and confidence.
In response to weakening global economic
demand, various countries have undertaken coordinated
monetary-fiscal measures to stimulate
demand. The impact of fiscal measures began to
provide some signs of recovery in the second
quarter of 2009. Emerging market economies, led
by resurgence in Asia, are expected to lead the
recovery process. However, the downside risk
continues to pose challenge to the overall global
economic outlook and the shape of the recovery
continues to remain uncertain, depending on the
exit policy toward discretionary measures. Financial
market conditions have also improved markedly
supported by strong public policies, but still there
is a long way to go before returning to the pre-crisis
situation. In recent months, sovereign yield curves
have steepened considerably both in the advanced
as well as emerging market economies, reflecting
a combination of factors, such as monetary policy
easing, improved recovery prospects and reduced
risk of deflation.
1The ordinary least squares (OLS) method specification with the coefficient significant at 5% to 10% is as follows for select
countries: Pd=Labour Productivity, Dfin= Financial Crisis.
US Y= 2.17+Pd 0.49-Dfin3.18 Adj R-Sq 0.60 Dw stat 1.6
Japan Y= 0.03+Pd0.98-dfin1.19 Adj R-Sq 0.67 Dw stat 1.8
Korea Y= 1.13+Pd1.1-Dfin2.4 Adj R-Sq 0.43 Dw stat 1.5 |