Various forward looking surveys in the recent period generally point to an improvement
in business sentiments, besides the prospects of further acceleration in economic
activities in the forthcoming quarters. The Industrial Outlook Survey conducted by the
Reserve Bank shows improvement in the sentiments in the manufacturing sector, in
continuation of the trend seen in the previous survey. The professional forecasters’ survey
of the Reserve Bank suggests an overall (median) GDP growth of 8.2 per cent for 2010-
11. Stronger growth impulses now coexist with significant acceleration in headline
inflation in recent months. While the recovery in growth is expected to further firm up
in 2010-11 over the preceding year, headline inflation could be expected to moderate
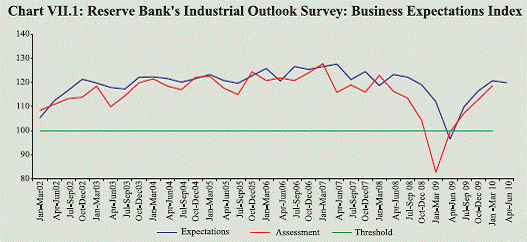
over the next few months.
VII.1 After witnessing a slowdown
during 2008-09, the economy has recovered
in 2009-10, which is expected to firm up
further and take hold in 2010-11.
Continuing the optimism witnessed in the
previous business confidence surveys, the
bullish sentiments have grown stronger.
The industrial outlook survey of the
Reserve Bank indicates improved
assessment of the January-March 2010
quarter. The professional forecasters’
survey conducted in March 2010 shows
overall (median) growth rate for 2010-11
at 8.2 per cent, driven mainly by increased
private consumption expenditure growth
and relatively increased industrial activity
in the first half and pick-up in services in
the second half.
Business Expectation Surveys
VII.2 The forward looking surveys
conducted by various agencies generally
convey an optimistic picture about the
economy. While almost all the surveys
report strong Y-o-Y improvements, the
picture about sequential Q-o-Q growth is
somewhat mixed (Table VII.1)
VII.3 Business Confidence Index (BCI)
of the National Council of Applied
Economic Research (NCAER) increased to
156.8 in April 2010, registering a gain of
2.0 per cent over its January 2010 level
(Table VII.1). This is the fourth successive
quarter in which the BCI has registered an
increase. Among the four components,
‘investment climate’ and ‘capacity utilisation’ were weaker as compared to the
earlier quarter, but expectations about
improvement in ‘overall business conditions’
and ‘financial position of firms’ in the next
six months rose substantially, thus driving
the increase in the BCI.
Table VII.1: Business Expectations Surveys |
Period/Index |
NCAER Apr. 2010 Business Confidence Index |
FICCI Q3:2009-10 Overall Business Confidence Index |
Dun & Bradstreet CII Oct. 2009- Mar. Q2: 2010 Business 2010 Business Optimism Index Confidence Index |
1 |
2 |
3 |
4 |
5 |
Current level of the Index |
156.8 |
70.0 |
142.8 |
66.1 |
Index as per previous survey |
153.8 |
72.4 |
137.3 |
58.7 |
Index levels one year back |
81.6 |
44.0 |
93.8 |
56.3 |
% change (Q-o-Q) |
2.0 |
-3.3 |
4.0 |
12.6 |
% change (Y-o-Y) |
92.2 |
59.1 |
52.2 |
17.4 |
VII.4 The Business Confidence Survey
of the FICCI for Q3:2009-10, which was
released in February 2010, suggests that
83 per cent of the companies felt the
overall current economic conditions to be
“moderately to substantially better”.
Going ahead, around 77 per cent of the
companies feel that the economic
conditions would improve further in the
coming six months. The overall business
confidence index contracted by 3.3 per cent
over the previous quarter on account of
anxiety over withdrawal of stimulus
measures. The outlook for jobs, according
to the survey, has somewhat improved, with
30 per cent firms stating that they would
add to their employee strength in the
coming six months.
VII.5 The Dun and Bradstreet Business
Optimism Index (BOI) for Q2:2010
increased by 4.0 per cent to 142.8 over
Q1:2010 on account of improvement in
overall business sentiment. However, some
cautiousness on account of high inflation and
expected hardening of interest rates is visible
from relatively lower optimism with regard
to volume of sales, new orders, net profits
and employee levels during Q2:2010 as
compared to Q1:2010. On a Y-o-Y basis,
the BOI for the Q2:2010 recorded a sharp
increase of 52.2 per cent, corroborating the
fact that the economy is firmly on a revival
path. Improving domestic demand, surge in domestic stock markets, increase in
advance tax collections, increased capital
inflows and stabilising export demand
seem to have supported the optimism in
the business sentiments.
VII.6 The CII Business Confidence
Index for October 2009-March 2010
increased by 7.4 points to 66.1 on top of
the 2.4 point increase during the first half
of 2009-10. Nevertheless, according to the
survey, uncertain global economic outlook
and slackening consumer demand continue
to affect confidence levels.
VII.7 The seasonally adjusted HSBC
Markit Purchasing Managers’ Index (PMI)
(manufacturing) which had recorded a
twenty month high in February 2010
witnessed a marginal fall in March 2010
largely reflecting weaker expansion of both
output and new orders. Notwithstanding this
fall, the index which reached a level of 57.8
in March 2010, has remained in the above
neutral territory (above 50 mark) in each of
the past twelve months. It is noteworthy that
the strong rise in domestic new orders had
been driving the index in recent months.
The survey also revealed a sharp rise in
input prices, which in turn may be reflected
in higher output prices, thus building up
supply side pressures on inflation.
VII.8 The HSBC Markit Services PMI
complemented the trend in manufacturing
PMI. The Services PMI declined to 58.1 in
March 2010 from the seventeen month peak
of 60.9 witnessed in February 2010. In the
case of services as well, both input prices
and prices charged in the services sector
registered some increase.
Reserve Bank’s Industrial Outlook Survey
VII.9 The 49th round of Industrial
Outlook Survey of the Reserve Bank
conducted during January-March 2010
showed improvement in assessment for the
same quarter (Table VII.2). The
expectations for the quarter April-June
2010, however, exhibited marginal
moderation as compared to January-March
2010 quarter, partly reflecting seasonality. The index, though, remained significantly
higher as compared to the corresponding
quarter last year. It is noteworthy that in
line with the trend witnessed since Q2:
2009-10, both indices (i.e. assessment
about the current quarter and expectations
about the next quarter) remained in the
growth terrain (i.e., above 100, which is
the threshold that separates contraction
from expansion) (Chart VII.1).
Table VII.2: Reserve Bank’s Survey – Net Response on Expectations and Assessment About the Industrial Performance |
Parameter |
Optimistic Response |
Optimistic Response |
Apr-Jun 2009 |
Jul-Sep 2009 |
Oct-Dec 2009 |
Jan-Mar 2010 |
E |
A |
E |
A |
E |
A |
E |
A |
E |
1 |
2 |
3 |
4 |
5 |
6 |
7 |
8 |
9 |
10 |
11 |
1. Overall business situation |
Better |
11.2 |
9.3 |
24.2 |
26.3 |
39.8 |
36.0 |
44.9 |
43.1 |
41.2 |
2. Overall financial situation |
Better |
8.4 |
7.0 |
20.0 |
21.8 |
33.5 |
29.5 |
39.3 |
35.8 |
36.3 |
3. Working capital finance requirement |
Increase |
23.2 |
24.6 |
26.3 |
23.8 |
30.4 |
28.8 |
32.7 |
30.5 |
27.7 |
4. Availability of finance |
Improve |
9.3 |
11.2 |
16.6 |
19.2 |
26.1 |
23.0 |
29.2 |
25.7 |
26.8 |
5. Cost of external finance |
Decrease |
|
|
|
|
|
-14.7 |
-18.3 |
-15.9 |
-20.6 |
6. Production |
Increase |
9.9 |
6.9 |
22.4 |
22.6 |
35.0 |
28.9 |
40.0 |
36.5 |
35.9 |
7. Order books |
Increase |
6.4 |
-0.9 |
16.8 |
20.5 |
32.3 |
25.9 |
35.8 |
31.9 |
33.4 |
8. Pending orders, if applicable |
Below normal |
23.2 |
24.6 |
19.1 |
17.4 |
11.0 |
11.6 |
5.7 |
8.8 |
6.4 |
9. Cost of raw material |
Decrease |
-16.2 |
-26.3 |
-27.1 |
-41.7 |
-38.4 |
-47.1 |
-44.3 |
-60.2 |
-48.6 |
10. Inventory of raw material |
Below average |
1.1 |
-2.4 |
-0.5 |
-2.1 |
-1.2 |
-4.2 |
-3.6 |
-5.8 |
-2.6 |
11. Inventory of finished goods |
Below average |
-4.4 |
-4.2 |
-1.8 |
-4.3 |
-3.7 |
-4.3 |
-1.9 |
-4.3 |
-2.6 |
12. Capacity utilisation (Main product) |
Increase |
-0.7 |
-3.7 |
10.7 |
10.1 |
22.0 |
16.5 |
25.4 |
21.7 |
19.7 |
13. Level of capacity utilisation (Compared to the average in the preceding four quarters) |
Above normal |
-20.8 |
-19.2 |
-12.1 |
-11.2 |
-3.8 |
-3.9 |
1.3 |
3.0 |
1.6 |
14. Assessment of the production capacity (With regard to expected demand in the next six months) |
More than adequate |
8.9 |
4.6 |
5.5 |
5.8 |
6.5 |
5.3 |
5.0 |
6.4 |
7.1 |
15. Employment in the company |
Increase |
-5.1 |
-3.3 |
1.5 |
4.1 |
8.8 |
10.3 |
12.1 |
13.7 |
13.6 |
16. Exports, if applicable |
Increase |
-3.8 |
-13.5 |
0.1 |
-2.9 |
12.5 |
9.2 |
20.2 |
12.7 |
18.5 |
17. Imports, if any |
Increase |
-1.4 |
-1.3 |
4.6 |
7.8 |
11.5 |
13.0 |
16.9 |
17.1 |
17.1 |
18. Selling prices are expected to |
Increase |
-9.1 |
-7.4 |
0.0 |
0.2 |
6.0 |
2.6 |
9.8 |
12.4 |
13.3 |
19. Increase in selling prices, if any, is expected |
At a lower rate |
25.9 |
11.0 |
-100.0 |
23.2 |
19.4 |
19.3 |
16.8 |
21.6 |
19.7 |
20. Profit margin |
Increase |
-18.6 |
-25.1 |
-13.4 |
-15.1 |
-2.8 |
-9.9 |
1.1 |
-2.9 |
3.2 |
Note: 1. ‘Net response’ is measured as the percentage share differential between the companies reporting ‘optimistic’ (positive) and
‘pessimistic’ (negative) responses; responses indicating status quo (no change) are not reckoned. Higher ‘net response’ indicates higher level of confidence and vice versa.
2. E: Expectations and A: Assessment.
3. ‘Cost of external finance’ is a newly added question from the 48th survey round (October-December 2009). |
 |
VII.10 The survey reveals that for the
assessment quarter, an optimistic view
was expressed about the demand
conditions. For the forthcoming quarter,
however, deterioration in production
capacity and capacity utilisation are
anticipated by the respondents, reflecting
an expected slowdown in demand. The
respondents also expect the financial
conditions to be adversely affected in the
next quarter as reflected in an expected
decline in working capital finance requirement and availability of finance.
Notwithstanding this, the respondents
expect their profit margins to increase as
compared to the present quarter.
Furthermore, as a sign of gradual return of
the pricing power, the selling prices are
expected to increase at a higher rate as
compared to the previous quarter.
VII.11 The findings of various surveys on
business conditions largely reflect similar
pattern (Chart VII.2).
Survey of Professional Forecasters1
VII.12 The results of the eleventh round
of ‘Survey of Professional Forecasters’
conducted by the Reserve Bank in March
2010 places overall (median) growth rate
for 2010-11 at 8.2 per cent, driven mainly
by increased private consumption
expenditure growth, stronger industrial
activity in first half and further pick-up in
services in the second half (Table VII.3).
The sectoral growth rate forecast for 2010-11 suggests upward revision for
agriculture and industry. The forecast for
the agriculture sector growth was revised
upwards to 4.0 per cent from 3.5 per cent.
The forecast for industry was also revised
upwards to 9.0 per cent from 8.1 per cent.
For services, however, the forecasts
remained constant at 9.0 per cent. The
overall (median) growth rate for 2009-10
was revised upward to 7.2 per cent, as
against 6.9 per cent reported in the earlier
survey.
Table VII.3: Median Forecasts of Select Macroeconomic Indicators by Professional Forecasters : 2009-10 and 2010-11 |
| |
Actual 2008-09 |
Annual Forecasts |
Quarterly Forecasts |
2009-10 |
2010-11 |
2009-10 |
2010-11 |
Q4 |
Q1 |
Q2 |
Q3 |
Q4 |
E |
L |
E |
L |
E |
L |
E |
L |
E |
L |
E |
L |
E |
L |
1 |
2 |
3 |
4 |
5 |
6 |
7 |
8 |
9 |
10 |
11 |
12 |
13 |
14 |
15 |
16 |
1. Real GDP growth rate at factor cost (in per cent) |
6.7 |
6.9 |
7.2 |
7.9 |
8.2 |
7.5 |
8.4 |
7.9 |
8.1 |
7.7 |
8.3 |
8.2 |
8.4 |
– |
8.5 |
a. Agriculture & Allied Activities |
1.6 |
-0.9 |
-0.5 |
3.5 |
4.0 |
-0.9 |
-1.0 |
2.0 |
2.9 |
3.0 |
3.8 |
4.7 |
5.7 |
– |
4.3 |
b. Industry |
3.1 |
8.4 |
8.9 |
8.1 |
9.0 |
10.0 |
11.8 |
9.0 |
10.6 |
8.4 |
9.3 |
8.3 |
9.0 |
– |
8.5 |
c. Services |
9.3 |
8.7 |
8.4 |
9.0 |
9.0 |
8.9 |
9.2 |
9.3 |
8.9 |
9.1 |
8.8 |
9.0 |
9.7 |
– |
9.9 |
2. Gross Domestic Saving (per cent of GDP at current market price) |
32.5 |
35.0 |
34.0 |
36.4 |
35.3 |
– |
– |
– |
– |
– |
– |
– |
– |
– |
– |
3. Gross Domestic Capital Formation (per cent of GDP at current market price) |
34.9 |
37.7 |
36.0 |
39.0 |
38.0 |
38.1 |
36.0 |
37.9 |
37.0 |
39.8 |
38.0 |
39.7 |
38.7 |
– |
38.8 |
4. Corporate Profit after Tax (growth rate in per cent)* |
– |
11.3 |
17.8 |
18.0 |
20.0 |
19.0 |
12.5 |
18.5 |
18.5 |
18.5 |
18.8 |
22.0 |
18.4 |
– |
26.1 |
5. Inflation WPI |
8.4 |
4.4 |
3.7 |
6.1 |
7.0 |
8.2 |
9.6 |
7.4 |
9.5 |
6.4 |
8.0 |
5.5 |
6.7 |
– |
5.7 |
6. Exchange Rate (INR/US$ end period) |
51.0 |
45.5 |
45.5 |
44.3 |
44.0 |
45.5 |
45.1 |
45.3 |
45.0 |
44.9 |
44.8 |
44.7 |
44.6 |
– |
44.1 |
7. T-Bill 91 days Yield (per cent-end period) |
5.0 |
4.0 |
4.5 |
5.3 |
5.3 |
– |
– |
– |
– |
– |
– |
– |
– |
– |
– |
8. 10-year Govt. Securities Yield (per cent-end period) |
7.0 |
7.8 |
8.0 |
7.8 |
8.0 |
– |
– |
– |
– |
– |
– |
– |
– |
– |
– |
9. Export (growth rate in per cent)@ |
13.7 |
-5.2 |
-9.1 |
15.2 |
15.0 |
– |
– |
– |
– |
– |
– |
– |
– |
– |
– |
10.Import (growth rate in per cent)@ |
19.4 |
-8.3 |
-9.0 |
17.4 |
18.0 |
– |
– |
– |
– |
– |
– |
– |
– |
– |
– |
11.Trade Balance (US $ billion) |
-118.7 |
– |
– |
– |
– |
-29.7 |
-29.7 |
-28.8 |
-32.7 |
-31.9 |
-34.6 |
-36.4 |
-35.5 |
– |
-32.1 |
E : Earlier Projection. L : Latest Projection.
– : Not Available. * : BSE listed companies. @ : US $ on BoP Basis.
Note : The latest round refers to eleventh round for the quarter ended March 2010, while earlier round refers to tenth round for the quarter ended December 2009.
Source : Survey of Professional Forecasters, Fourth Quarter 2009-10. |
Growth Projections of Different Agencies
VII.13 The CSO advance estimates for
GDP growth for 2009-10 at 7.2 per cent
suggest that the economy has outperformed
the earlier projections of most of the
agencies, leading to subsequent upward
revisions (Table VII.4). Various agency
estimates suggest that this uptrend in
growth rate is expected to continue in the
next financial year as well.
Factors Influencing the Current Growth
and Inflation Outlook
VII.14 The economic recovery in 2009-10
so far has been driven by a turnaround in
the industrial output and continuing
resilience of the services sector. At this
juncture, the strong outlook for growth
points to significant improvement in the
overall macroeconomic conditions while
the substantial firming up of headline
inflation in recent months has emerged as
a key concern.
VII.15 The growth outlook for the Indian
economy in the near term remains positive
on account of the following factors: (a) expectations of satisfactory rabi output,
which may offset, partially, the decline in
kharif output; (b) expectations that the
industrial sector would remain buoyant;
(c) increase in corporate sales and
profitability; (d) pick-up in order books and
capacity utilisation as per different survey
results; (e) turnaround in exports with
improving global conditions; (f) pick-up in
lead services indicators for transportation,
telecommunication and construction, and
(g) revival in credit demand from the
private sector.
VII.16 Notwithstanding the overwhelming
positive sentiments about stronger growth
in the near term, certain downside risks
remain: (a) the revival in growth of
agriculture during 2010-11 hinges on the
assumption of normal monsoon, which
entails the usual uncertainties; (b) while
investment demand is showing signs of
picking up, it is still much below the rate
of growth in the pre-global crisis period;
(c) the private consumption demand, which
accounts for about 60 per cent of aggregate
demand, needs to gain significant
momentum; (d) decline in saving rate last year, led by sharp decline in public sector
savings; (e) global economic recovery,
though clearly visible, is still weak and
thus has implications for sustaining the
growth in Indian exports; and (f) the rising
inflation, which may push costs through
demand for higher wages and increase in
input costs.
Table VII.4: Projections of Real GDP Growth for India by Various Agencies |
(Per cent) |
Agency |
Real GDP Growth for 2010-11 |
Latest Projections for 2009-10 |
Earlier Projections for 2009-10 |
Real GDP Growth |
Month |
Real GDP Growth |
Month |
1 |
2 |
3 |
4 |
5 |
6 |
Economic Advisory Council to PM |
8.2 |
7.2 |
Feb-10 |
6.5 |
Oct-09 |
Ministry of Finance |
8.5 (+/-0.25) |
7.2 |
Feb-10 |
Above 7.0 |
Dec-09 |
IMF |
8.0 |
6.7 |
Feb-10 |
5.3 |
Jan-09 |
ADB |
8.2 |
7.2 |
Apr-10 |
7.0 |
Dec-09 |
NCAER |
– |
7.0 |
Jan-10 |
6.9 |
Oct-09 |
OECD |
7.3 |
6.1 |
Nov-09 |
5.9 |
Jun-09 |
VII.17 The headline inflation, which
remained at 9.9 per cent in February-March
2010, has emerged as a major policy
concern. In the recent weeks, while food
inflation is showing signs of slowdown,
inflation in fuel and manufactured products
is causing more generalised inflationary
pressures. Going forward, following factors
may exert further upward pressures on
inflation: (a) on the supply side, international
commodity prices, especially of crude oil and
industrial inputs have been rising in the
recent months, thus limiting the option of
imports that could contain inflation in India;
(b) return of pricing power of the corporates
with stronger revival in demand; (c) on
demand side, revival in private
consumption demand coupled with revival
in growth of credit and money supply, and
(d) the gradual exit of the fiscal stimulus
measures which has and would entail roll
back of excise and customs duty reliefs as
well as measures to align domestic prices
with international oil prices.
VII.18 While the near-term factors
corroborate the acceleration in inflation seen
so far, certain factors could help in dampening the inflationary pressures, which
include: (a) satisfactory rabi production and
arrival of new crops in the market that could
improve the supply conditions; (b) a normal
monsoon that may translate into
improvement in agricultural production, and
(c) the impact of monetary policy actions
already initiated by the Reserve Bank to
anchor inflationary expectations.
VII.19 The conflicting pulls of supporting
the recovery and anchoring inflationary
expectations continue to pose a challenge
for the conduct of monetary policy. While
recovery in private demand needs to be
stronger to make the growth process selfsustaining,
recent strong pick-up in
headline inflation has emerged as a key
policy concern, since high inflation itself
may hamper the recovery in growth. The
near-term outlook suggests that economic
growth in 2010-11 will be higher than in
2009-10. Inflation, in turn, could be
expected to moderate in next few months,
from the peak levels seen in recent months,
reflecting easing of supply pressures and
the impact of necessary policy actions. In
sum, there is an overall improvement in
business sentiments and economic activity,
but concerns relating to elevated levels of
inflation remain in the near term. It is likely
that the growth impulses could further
strengthen during 2010-11, and therefore,
anchoring inflationary expectations without
hurting the growth process continue to be
the focus of monetary policy.
1 Introduced by the Reserve Bank from the quarter ended September 2007. The forecasts reflect the views of professional
forecasters and not of the Reserve Bank. |