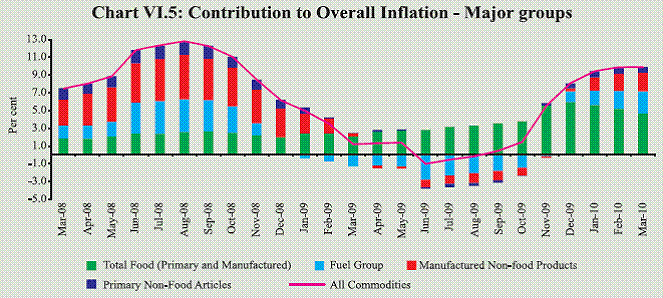
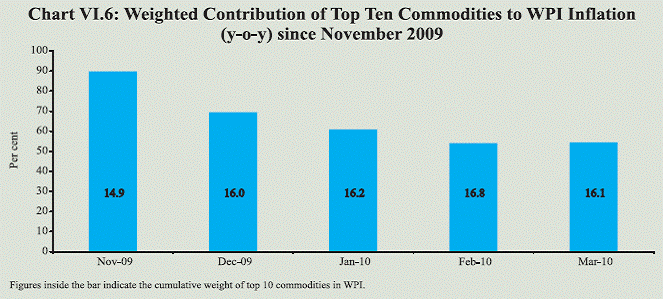
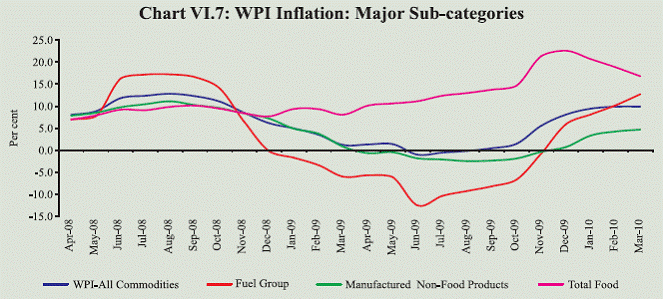
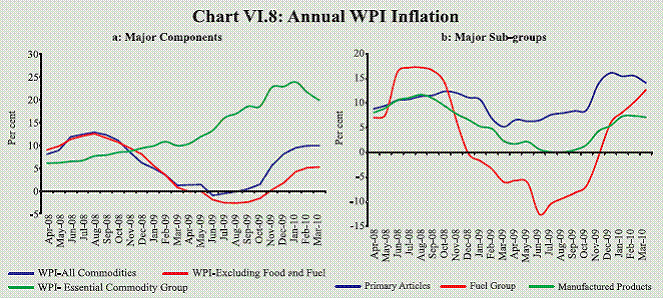
The Wholesale Price Index (WPI) inflation, after remaining significantly subdued during the first half of the year, increased at a faster pace in the second half and reached 9.9 per cent by February 2010, and remained almost unchanged at the same high level in March 2010. The Wholesale Price Index, though, exhibited secular increases throughout the year, indicating sustained momentum in inflation. Decline in agricultural production caused by deficient South-West monsoon as well as increases in international price of crude oil largely conditioned the inflation path. Indications of generalisation of inflation became increasingly evident starting from November 2009. Inflation in non-food manufactured products increased from (-)0.4 per cent in November 2009 to 4.7 per cent in March 2010. Alongside increasing generalisation of the inflation process, demand side pressures from certain quarters also became visible. Consumer price inflation moderated in February 2010 although it still remains high in double digits. With recovery in growth gaining momentum, the Reserve Banks’ policy emphasis has shifted to anchoring inflation expectations. VI.1 Inflationary conditions in India during 2009-10 were marked by two distinct phases. During the first half of 2009-10, the year-on-year WPI inflation remained significantly low (negative during June-August 2009) on account of the high base of sharp increases in prices recorded a year ago. This period, however, was characterised by a significant build-up of inflationary momentum, largely on account of the partial pass-through of increases in international prices. During the second half of the year, increasing food prices, on account of unfavourable agricultural supply conditions caused by the deficient South-West monsoon coupled with the waning of base effect led to sharp increase in inflation and the headline WPI inflation reached 9.9 per cent (y-o-y) in February 2010. Increase in international oil prices, and the resultant upward revision in POL prices also contributed to the inflation process during the course of the year. The recent increases in manufactured non-food products inflation signal how an inflation process triggered by supply side pressures could get generalised over time. The primary factor behind the rising headline inflation, i.e., food price inflation, however, has started to moderate since December 2009, largely reflecting seasonal pattern, though it still remains elevated. Moreover, inflation as per Consumer Price Indices (CPIs), which have a higher relative weight for food articles, though declined marginally in February 2010, still remain high. Global Inflation VI.2 Most advanced economies witnessed very low or negative headline inflation during the first half of 2009-10. This was mainly on account of the contraction in demand associated with the recession as well the impact of sharp decline in international commodity prices. The emerging economies also experienced significant decline in inflation, mostly due to decline in commodity prices and lower demand pressures on account of moderation in growth. During the second half of 2009- 10, inflation in major economies increased from sub zero/low levels, mainly reflecting the waning impact of the base (commodity prices had declined sharply during the second half of 2008-09 leading to decline in prices then in most countries). Some part of the recent increase in inflation across the globe could also be attributed to the rebound in commodity prices ahead of global recovery as well as gradual pick-up in demand as the economies work their way out of recession. VI.3 Except Japan, most economies registered positive, though subdued CPI inflation by November 2009 (Chart VI.1). Year-on-year consumer price inflation in OECD countries, which was negative during the period June-September 2009, increased to 1.9 per cent in February 2010. Core inflation (excluding food and energy) in OECD countries, after declining since September 2008, has remained stable at around 1.5 per cent since June 2009, indicating the limited pressure on inflation from the demand side. VI.4 During the first half of 2009-10, there were concerns over a possible deflationary spiral created by the negative inflation in the US, Japan and the Euro area. Those concerns abated with the recent increases in CPI inflation of major economies and stabilising core inflation. In the advanced economies, headline inflation is expected to pick up from 0.1 per cent in 2009 to 1.3 per cent in 2010, as rebound in energy prices could more than offset slowing labour costs. In emerging and developing economies, inflation is expected to increase from 5.2 per cent in 2009 to 6.2 per cent in 2010, as some of these economies may face growing upward pressures from limited economic slack and domestic liquidity effects of increased capital flows. In the emerging economies, inflationary pressures have remained subdued during 2009-10, albeit, with some firming up during the last quarter, except in India and Russia (Table VI.1). VI.5 Monetary policy stance of most central banks in the advanced economies during 2009-10 was conditioned by concerns over the recession and the subsequent fragile recovery, and policy rates accordingly were left unchanged at near zero levels. During the second half of the year inflationary pressures started to emerge in some economies, particularly those that witnessed faster than expected recovery and gradual closing of the output gap, which led to exit from easy monetary policy. The Reserve Bank of Australia and Bank of Israel have increased their policy rates by 125 and 100 basis points, respectively, since September 2009 on the back of signs of economic recovery and improvement in indicators of confidence (Table VI.1). Peoples Bank of China also raised the reserve requirement ratio by 50 basis points each in January and February 2010.
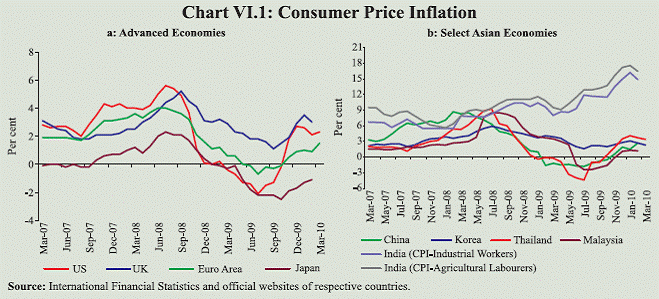 |
Table VI.1: Global Inflation Indicators |
(Per cent) |
Country/ Region |
Key Policy Rate |
Policy Rate (As on Apr. 16, 2010) |
Changes in Policy Rates (basis points) |
CPI Inflation (y-o-y) |
Sept 08 - Mar 09 |
Apr 09 - Aug 09 |
Sep 09 - Apr 10 |
Mar. 2009 |
Mar. 2010 |
1 |
2 |
3 |
4 |
5 |
6 |
7 |
8 |
Developed Economies |
|
|
|
|
|
|
Australia |
Cash Rate |
4.25 (Apr.7, 2010) |
(-) 400 |
(-)25 |
125 |
3.7^ |
2.1^ |
Canada |
Overnight Rate |
0.25 (Apr.21,2009) |
(-) 250 |
(-) 25 |
0 |
1.4* |
1.6* |
Euro area |
Interest Rate on Main Refinancing Operations |
1.00 (May 13,2009) |
(-) 275 |
(-) 50 |
0 |
0.6 |
1.4 |
Japan |
Uncollateralised Overnight Call Rate |
0.10 (Dec.19,2008) |
(-) 40 |
0 |
0 |
-0.1* |
-1.1* |
UK |
Official Bank Rate |
0.50 (Mar. 5,2009) |
(-) 450 |
0 |
0 |
3.2* |
3.0* |
US |
Federal Funds Rate |
0.00 to 0.25 (Dec.16,2008) |
(-) 200 |
0 |
0 |
-0.4 |
2.3 |
Developing Economies |
|
|
|
|
|
|
Brazil |
Selic Rate |
8.75 (July 22, 2009) |
(-) 250 |
(-) 250 |
0 |
5.6 |
5.2 |
India |
Reverse Repo Rate |
3.50 (Mar.19, 2010) |
(-) 250 |
(-)25 |
25 |
9.6* |
14.9* |
| |
Repo Rate |
5.00 (Mar 19, 2010) |
(-) 400 |
(-) 25 |
25 |
|
|
| |
|
|
(-400) |
|
(75) |
|
|
China |
Benchmark 1-year |
5.31 (Dec 23, 2008) |
(-) 216 |
0 |
0 |
-1.2 |
2.4 |
| |
Lending Rate |
|
(-300) |
0 |
(100) |
|
|
Indonesia |
BI Rate |
6.50 (Aug. 5, 2009) |
(-) 150 |
(-) 125 |
0 |
7.9 |
3.4 |
Israel |
Key Rate |
1.50 (Apr. 1, 2010) |
(-) 350 |
(-)25 |
100 |
3.3* |
3.6* |
Korea Base Rate |
|
2.00 (Feb. 12, 2009) |
(-) 325 |
0 |
0 |
3.9 |
2.3 |
Philippines |
Reverse Repo Rate |
4.00 (Jul. 9, 2009) |
(-) 125 |
(-)75 |
0 |
6.4 |
4.4 |
Russia |
Refinancing Rate |
8.25 (Mar 29, 2010) |
100 |
(-)225 |
(-)250 |
14.0 |
6.4 |
South Africa |
Repo Rate |
6.50 (Mar. 26, 2010) |
(-) 200 |
(-)250 |
(-) 50 |
8.6* |
5.7* |
Thailand |
1-day Repurchase Rate |
1.25 (Apr. 8, 2009) |
(-) 225 |
(-) 25 |
0 |
-0.2 |
3.4 |
^ : Q4. *: February.
Note : 1. For India, data on inflation pertain to CPI for Industrial Workers.
2. Figures in parentheses in column (3) indicate the dates when the policy rates were last revised.
3. Figures in parentheses in column (4) indicate the variation in the cash reserve ratio during the period.
Source: International Monetary Fund, websites of respective central banks. |
Global Commodity Prices
VI.6 International commodity prices,
which declined sharply during June-
December 2008, gradually firmed up in
2009-10. Commodity price rebound ahead of global recovery has been driven by the
expectations of recovery in growth and resultant tighter demand conditions in
relation to supply (Table VI.2, Chart VI.2).
Table VI.2: International Commodity Prices |
Commodity |
Unit |
Market Price (2004) |
Index (2004=100) |
Variation (Per cent) |
2005 |
2006 |
2007 |
2008 |
2009-10 |
Mar.09 over Jun.08 |
Mar.10 over Mar.09 |
Mar. |
Jun. |
Sep. |
Dec. |
Jan. |
Feb. |
Mar. |
1 |
2 |
3 |
4 |
5 |
6 |
7 |
8 |
9 |
10 |
11 |
12 |
13 |
14 |
15 |
16 |
Energy |
|
|
|
|
|
|
|
|
|
|
|
|
|
|
|
Coal |
$/mt |
53 |
90 |
93 |
124 |
240 |
115 |
135 |
128 |
157 |
183 |
178 |
178 |
-61.8 |
54.7 |
Crude oil |
$/bbl |
38 |
142 |
170 |
188 |
257 |
124 |
183 |
181 |
198 |
204 |
198 |
210 |
-64.5 |
70.0 |
Non-Energy Commodities |
|
|
|
|
|
|
|
|
|
|
|
|
|
|
|
Palm oil |
$/mt |
471 |
90 |
101 |
165 |
201 |
127 |
154 |
143 |
168 |
168 |
169 |
177 |
-50.7 |
39.1 |
Soybean oil |
$/mt |
616 |
88 |
97 |
143 |
204 |
118 |
145 |
137 |
152 |
150 |
148 |
149 |
-52.7 |
25.9 |
Soybeans |
$/mt |
307 |
90 |
88 |
125 |
171 |
124 |
164 |
140 |
147 |
142 |
132 |
133 |
-39.1 |
7.7 |
Rice |
$/mt |
238 |
120 |
128 |
137 |
274 |
247 |
242 |
218 |
249 |
239 |
225 |
212 |
-22.3 |
-14.2 |
Wheat |
$/mt |
157 |
97 |
122 |
163 |
208 |
147 |
164 |
122 |
131 |
128 |
124 |
122 |
-33.7 |
-17.3 |
Maize |
$/mt |
112 |
88 |
109 |
146 |
200 |
147 |
161 |
135 |
147 |
150 |
145 |
142 |
-42.7 |
-3.4 |
Sugar |
c/kg |
16 |
138 |
206 |
141 |
178 |
187 |
229 |
322 |
322 |
369 |
354 |
264 |
10.5 |
41.4 |
Cotton A Index |
c/kg |
137 |
89 |
93 |
102 |
115 |
83 |
99 |
103 |
123 |
125 |
129 |
138 |
-33.2 |
66.5 |
Aluminium |
$/mt |
1716 |
111 |
150 |
154 |
150 |
78 |
92 |
107 |
127 |
130 |
119 |
129 |
-54.8 |
65.1 |
Copper |
$/mt |
2866 |
128 |
235 |
248 |
243 |
131 |
175 |
216 |
244 |
258 |
239 |
260 |
-54.6 |
99.0 |
Gold |
$/toz |
409 |
109 |
148 |
170 |
213 |
226 |
231 |
244 |
277 |
273 |
268 |
272 |
3.9 |
20.4 |
Silver |
c/toz |
669 |
110 |
173 |
200 |
224 |
196 |
219 |
246 |
264 |
265 |
237 |
256 |
-23.0 |
30.8 |
Steel cold-rolled |
|
|
|
|
|
|
|
|
|
|
|
|
|
|
|
coil sheet |
$/mt |
607 |
121 |
114 |
107 |
159 |
148 |
115 |
115 |
115 |
115 |
115 |
128 |
-18.2 |
-13.9 |
Steel hot-rolled |
|
|
|
|
|
|
|
|
|
|
|
|
|
|
|
coil sheet |
$/mt |
503 |
126 |
119 |
109 |
176 |
159 |
119 |
119 |
119 |
119 |
119 |
134 |
-20.0 |
-15.6 |
Tin |
c/kg |
851 |
87 |
103 |
171 |
217 |
125 |
176 |
175 |
183 |
208 |
192 |
206 |
-52.0 |
64.4 |
Zinc |
c/kg |
105 |
132 |
313 |
309 |
179 |
116 |
149 |
180 |
227 |
232 |
206 |
217 |
-35.8 |
87.0 |
$: US dollar. c: US cent. bbl: Barrel mt: metric tonne kg:Kilogram toz: troy oz.
Source: Based on World Bank’s actual commodity price data. The year 2004 has been taken as the base to exhibit price trends over
the relevant period. |
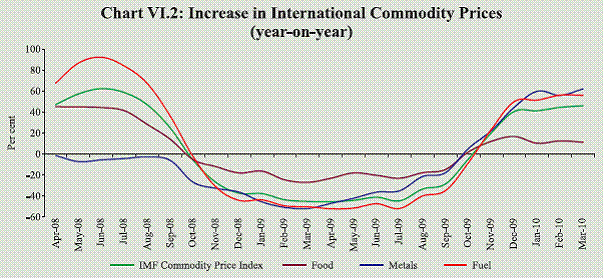 |
VI.7 Crude oil prices increased by about 70 per cent (year-on-year) in March 2010. According to the International Energy Agency (IEA) estimates, stronger global economic growth during 2010 may increase oil consumption by 1.7 million barrels per day. While this could suggest possible firming of crude oil prices, availability of ample surplus capacity may dampen any significant pressure on oil prices.
VI.8 The increase in metal prices was led by the improvement in global economic prospects as well as supply cutbacks in response to the prolonged decline in price. International food prices have been increasing gradually (except in July 2009). The FAO Food Price Index, a measure of the monthly change in international prices of a food basket composed of cereals, oilseeds, dairy, meat and sugar increased significantly up to January 2010. The major driver of this increase was sugar, the production of which was affected in the two major sugar producers, i.e., India and Brazil. The FAO Food Price Index, however, declined by 6.8 per cent during January- March 2010 as sugar and cereals price indices declined by 29 per cent and 7 per cent, respectively.
VI.9 The impact of increases in international commodity prices on domestic prices to an extent was modulated by the movements in exchange rate. As the exchange rate appreciated during the course of the year, the exchange rate pass-through effects helped in moderating the impact of higher international commodity prices on
domestic inflation.
Inflation Conditions in India
VI.10 The global trends in commodity
prices and domestic demand-supply balance pointed towards less pressure on
prices during 2009-10 at the time of the
Annual Policy Statement (APS) of the
Reserve Bank for the year 2009-10 (April
2009) and accordingly the APS projected
WPI inflation at around 4.0 per cent by end-
March 2010. The APS reduced the policy
rates further by 25 basis points to support
the revival of economic growth as
economic growth had declined well below
its potential level on account of the impact
of the crisis along with significant
moderation in price pressures (Table VI.3).
VI.11 The First Quarter Review (FQR) of Monetary Policy 2009-10 (July 2009) had highlighted that despite headline inflation turning negative, commensurate decline in inflationary expectations had not materialised. As the uncertain monsoon outlook increased the inflation risks, the FQR revised the end-March 2010 WPI inflation projection upward to 5.0 per cent. The Second Quarter Review (SQR) of Monetary Policy 2009-10 (October 2009) noted that the upside risk from deficient monsoon rainfall materialised and the baseline projection for WPI inflation at end- March 2010, therefore, was revised upwards to 6.5 per cent with an upside bias. The SQR noted that indications of consolidating recovery warranted a shift in policy stance from ‘managing the crisis’ to ‘managing the recovery’. The SQR also indicated the Reserve Bank’s commitment to a calibrated ‘exit’ from the expansionary monetary policy stance without hampering recovery process while anchoring inflation expectations and announced closure of some special liquidity support measures that had largely remained unutilised and restored the statutory liquidity ratio (SLR) of scheduled commercial banks to its pre-crisis level (25 per cent). It signalled the first phase of exit.
Table VI.3: Movements in Key Policy Rates in India |
(Per cent) |
Effective since |
Reverse Repo Rate |
Repo Rate |
Cash Reserve Ratio |
WPI Inflation |
CPI (IW) Inflation |
1 |
2 |
3 |
4 |
5 |
6 |
April 26, 2008 |
6.00 |
7.75 |
7.75 (+0.25) |
8.3 |
7.8 |
May 10,2008 |
6.00 |
7.75 |
8.00 (+0.25) |
8.6 |
7.8 |
May 24,2008 |
6.00 |
7.75 |
8.25 (+0.25) |
8.9 |
7.8 |
June 12, 2008 |
6.00 |
8.00 (+0.25) |
8.25 |
11.7 |
7.7 |
June 25, 2008 |
6.00 |
8.50 (+0.50) |
8.25 |
11.9 |
7.7 |
July 5, 2008 |
6.00 |
8.50 |
8.50 (+0.25) |
12.2 |
8.3 |
July 19, 2008 |
6.00 |
8.50 |
8.75 (+0.25) |
12.5 |
8.3 |
July 30, 2008 |
6.00 |
9.00 (+0.50) |
8.75 |
12.5 |
8.3 |
August 30, 2008 |
6.00 |
9.00 |
9.00 (+0.25) |
12.4 |
9.0 |
October 11, 2008 |
6.00 |
9.00 |
6.50 (–2.50) |
11.3 |
10.4 |
October 20, 2008 |
6.00 |
8.00 (–1.00) |
6.50 |
10.8 |
10.4 |
October 25, 2008 |
6.00 |
8.00 |
6.00 (–0.50) |
10.7 |
10.4 |
November 3, 2008 |
6.00 |
7.50 (–0.50) |
6.00 |
8.7 |
10.4 |
November 8, 2008 |
6.00 |
7.50 |
5.50 (–0.50) |
8.7 |
10.4 |
December 8, 2008 |
5.00 (-1.00) |
6.50 (–1.00) |
5.50 |
6.6 |
9.7 |
January 5, 2009 |
4.00 (-1.00) |
5.50 (–1.00) |
5.50 |
5.3 |
10.4 |
January 17, 2009 |
4.00 |
5.50 |
5.00 (–0.50) |
4.9 |
10.4 |
March 4, 2009 |
3.50(-0.50) |
5.00(-0.50) |
5.00 |
0.9 |
8.0 |
April 21, 2009 |
3.25 (-0.25) |
4.75(-0.25) |
5.00 |
1.6 |
8.7 |
February 13, 2010 |
3.25 |
4.75 |
5.50(+0.50) |
9.9 |
14.9 |
February 27, 2010 |
3.25 |
4.75 |
5.75(+0.25) |
9.9 |
14.9 |
March 19, 2010 |
3.50(+0.25) |
5.00(+0.25) |
5.75 |
9.9 |
– |
Note: 1. Reverse repo indicates absorption of liquidity and repo signifies injection of liquidity.
2. Figures in parentheses indicate change in policy rates. |
VI.12 The Third Quarter Review (TQR)
of Monetary Policy 2009-10 (January 2010)
raised the baseline projection for WPI
inflation for March 2010 to 8.5 per cent on
account of further strengthening of supply
side pressures and emerging risks of such
pressures spilling over on to a wider
inflationary process. As part of the
calibrated exit strategy, the CRR of
scheduled banks was increased by 75 basis
points from 5.0 per cent to 5.75 per cent of
NDTL in two stages. Further, as WPI
inflation increased and reached 9.9 per cent
(y-o-y) in February 2010 amidst signs of
generalisation of inflation, the Reserve
Bank raised the repo and reverse repo rates
under the LAF by 25 basis points each on
March 19, 2010, balancing the needs of supporting recovery while anchoring
inflation expectations.
Wholesale Price Inflation
VI.13 During the first half of 2009-10, the
year-on-year WPI inflation remained
moderate during April-May 2009 and
subsequently turned negative during June-
August 2009 on account of the strong base
effect of the significant increase in
administered prices of petroleum products
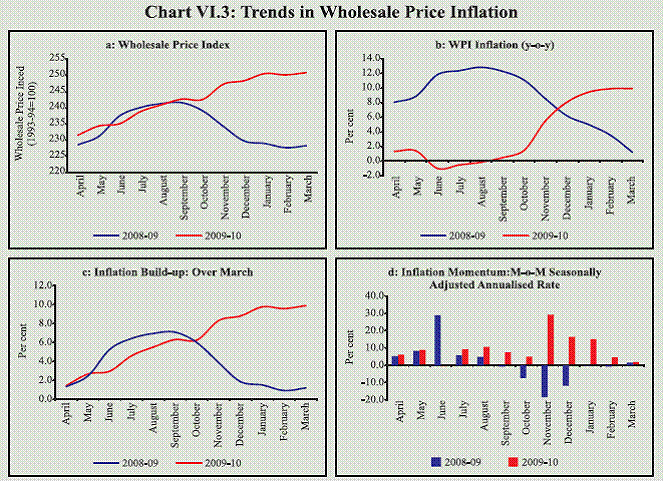
in June 2008 (Chart VI.3a and b). The base
effect of sharp increases in prices during the
first half of 2008-09 waned during the
second half as WPI had declined during the
period September 2008-February 2009
(Chart VI.3a). The secular build up in price pressures, however, was visible throughout
the year and WPI inflation increased
significantly to 9.9 per cent by March 2010.
The financial year build up of inflation
exhibited secular uptrend during the year
which was corroborated by the positive
inflation momentum during all the months
of 2009-10 (except June 2009) (Chart VI.3c and d).
 |
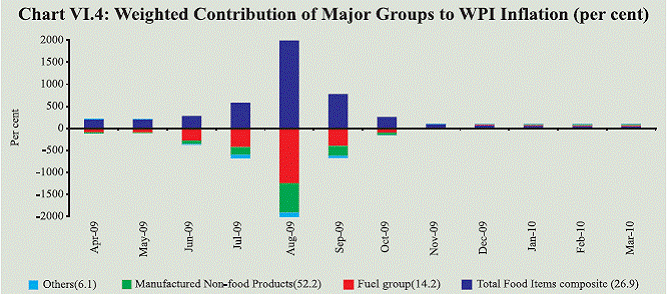
VI.14 Though the WPI inflation remained
moderate/negative during the first half of
2009-10, contrasting trends among the
major sub-groups were visible during that
period in terms of weighted contribution to
the headline inflation. Since the rate of
inflation in each month was different, the
weighted contribution based analysis needs
to be seen from the standpoint of making an
assessment about the extent of variability resulting from different components of the
WPI. Food inflation was significantly high
during this period, which meant that food
group (both primary food articles and
manufactured food products) had a
disproportionately larger contribution to
inflation. On the other hand, fuel group
exhibited large negative inflation, which
pulled down the overall inflation low during
the first half of the year (Chart VI.4 and
Chart VI.5). In the second half of the year,
inflation contribution came from all the
major groups as positive contribution was
visible from all the categories, indicating
generalisation of inflation.
VI.15 In terms of contribution to overall
inflation by the major groups, the
contribution of the fuel group, which was
significantly negative since January 2009, showed a reversal of trend in recent months
(Chart VI.5). The contribution of non-food
manufactured products group, which
declined during the receding phase of
inflation and turned negative during April-
November 2009, has also started to increase
in recent months. Food articles and products,
as a group continue to drive the overall WPI
inflation, though its contribution has
declined since December 2009.
 |
VI.16 The supply constraints on account
of the shortfall in agricultural production and increasing international crude prices
were the major drivers of inflation in India
uptill November 2009. The emergence of
inflationary pressures, thus, was led by
increases in prices of a few commodities
and inflation remained concentrated in a
few commodities. Since then, the inflation
has become increasingly generalised as
more number of commodities have started
to exhibit significant pick-up in inflation.
This is manifested in the declining share
of top ten contributors to inflation since
November 2009. The cumulative weight of the top ten contributors to inflation
have also increased indicating that
commodities with relatively higher weights
have emerged as the drivers of inflation
(Chart VI.6).
 |
 |
VI.17 When the inflation process tends to
get generalised, the transmission from
segmented pressures in certain items to the
general inflation takes place with a lag, and
during this period, containing inflation
expectations becomes critical to enhance the
effectiveness of monetary policy actions to
reign in inflationary pressures. It can be
expected that price pressure originating from
inflation in fuel group may entail much
greater risk to generalisation of inflation with
more immediate impact as fuel enter as an
intermediate input in most manufacturing
products. Pressure from food price shocks
on generalised inflation, on the other hand,
may be gradual. This, to an extent, has been
corroborated by the movements in
manufactured non-food products inflation,
which moved up significantly in recent
months alongside increase in fuel inflation,
while food inflation moderated in recent
months (Chart VI.7).
VI.18 The y-o-y WPI inflation excluding
food and fuel consistently remained below
the headline inflation during 2009-10. The
trend of non-food non-fuel inflation,
however, was mostly in sync with the
headline inflation. Inflation in essential
commodities group increased sharply
during 2009-10, largely driven by food
items’ price increases. Essential commodity
inflation shows signs of moderation since
January 2010 in line with the moderation
in food prices (Chart VI.8a).
VI.19 The increases in prices of food
articles and food products have
contributed 47 per cent of the build-up in
WPI inflation during 2009-10. The upward
revision of prices of petrol and diesel
(effective July 2, 2009) and increase in
prices of freely priced products under the
fuel group in line with hardening of
international crude oil prices further
contributed to the increase in inflation
during the year. Increases in administered
prices of coal, reversal of excise and
customs duty on petrol and diesel also
partly contributed to the increase in
inflation. Thus, the WPI inflation was above the Reserve Bank’s projection of 8.5
per cent by March 2010.
 |
VI.20 Amongst the major groups,
primary articles inflation, y-o-y, remained
in single digit up to October 2009 and
increased significantly thereafter, mainly on
account of food prices, which registered
high double-digit increase (Chart VI.8b).
Some softening of inflation in primary
articles is visible in recent months reflecting
the seasonal moderation in prices of food
articles and the impact of arrival of fresh
crops in the market.
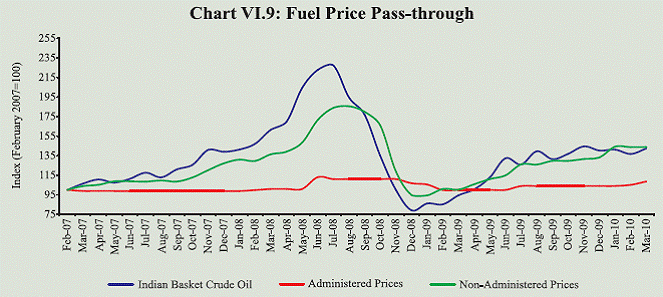
VI.21 Year-on-year fuel group inflation,
remained significantly negative during
December 2008-November 2009 on
account of the lower international crude oil
prices compared to the very high levels in
2008. Fuel inflation turned positive in
December 2009 reflecting the base effect
of downward revision of administered
prices in December 2008. The hikes in
administered prices of petrol and diesel
effective from July 2, 2009 and the reversal
of customs and excise duty concessions
given on petroleum products in the Union Budget for 2010-11, as part of the fiscal
exit, led to increases in administered prices
of petroleum products. Freely priced
products under the minerals oil group
followed the trends in international crude
prices and gradually increased during the
year (Chart VI.9). It is also to be noted that
international oil prices remaining at current
levels would imply a significant gap in the
administered prices of petroleum products
in relation to the price of Indian basket
crude oil (converted to rupees at respective
monthly average exchange rates), which would significantly increase the underrecoveries
of oil marketing companies.
 |
 |
VI.22 Among the other major items in
fuel group, coal prices were raised in
January 2010 as global prices increased
substantially (Chart VI.10). Increase in
domestic coal prices, however, remain
significantly lower than international
prices. Electricity prices inflation remained
moderate during the year. Recent increases
in oil and coal prices may, over time,
spillover to electricity prices.
VI.23 Manufactured products inflation,
y-o-y, declined during the first half of
2009-10 mainly reflecting the significant
negative inflation in metals. Manufactured
products inflation, however, increased from 0.1 per cent in August 2009 to 7.1
per cent in March 2010 mainly driven by
the manufactured food products, led by
sugar (Table VI.4). The non-food
manufacturing inflation, which was negative up to November 2009, has
changed course since then and increased
significantly to 4.7 per cent in March 2010.
Table VI.4: Wholesale Price Inflation in India (Year-on-Year) |
(Per cent) |
Commodity |
Weight |
2008-09 (March) |
2009-10 (March) |
Inflation |
C* |
Inflation |
C* |
1 |
2 |
3 |
4 |
5 |
6 |
All Commodities |
100.0 |
1.2 |
1.2 |
9.9 |
9.9 |
1. Primary Articles |
22.0 |
5.2 |
1.2 |
14.1 |
3.4 |
Food Articles |
15.4 |
7.5 |
1.2 |
16.7 |
2.7 |
i. Rice |
2.4 |
16.7 |
0.4 |
8.0 |
0.2 |
ii. Wheat |
1.4 |
4.6 |
0.1 |
14.4 |
0.2 |
iii. Pulses |
0.6 |
10.8 |
0.1 |
31.4 |
0.2 |
iv. Vegetables |
1.5 |
-5.3 |
-0.1 |
1.6 |
0.0 |
v. Fruits |
1.5 |
7.5 |
0.1 |
12.0 |
0.2 |
vi. Milk |
4.4 |
7.4 |
0.3 |
17.6 |
0.8 |
vii. Eggs, Fish and Meat |
2.2 |
3.5 |
0.1 |
31.0 |
0.7 |
Non-Food Articles |
6.1 |
-0.9 |
-0.1 |
12.8 |
0.8 |
i. Raw Cotton |
1.4 |
1.9 |
0.0 |
17.5 |
0.2 |
ii. Oilseeds |
2.7 |
-3.1 |
-0.1 |
9.8 |
0.3 |
iii. Sugarcane |
1.3 |
0.0 |
0.0 |
2.3 |
0.0 |
Minerals |
0.5 |
7.2 |
0.1 |
-9.6 |
-0.1 |
2. Fuel, Power, Light and Lubricants |
14.2 |
-6.0 |
-1.3 |
12.7 |
2.5 |
i. Coal Mining |
1.8 |
-0.7 |
0.0 |
13.5 |
0.3 |
ii Minerals Oil |
7.0 |
-8.6 |
-1.1 |
17.0 |
2.0 |
iii. Electricity |
5.5 |
-2.6 |
-0.2 |
4.7 |
0.3 |
3. Manufactured Products |
63.7 |
2.3 |
1.3 |
7.1 |
4.0 |
i. Food Products |
11.5 |
8.9 |
0.9 |
17.0 |
1.9 |
of which: Sugar |
3.6 |
22.7 |
0.5 |
48.8 |
1.4 |
Edible Oils |
2.8 |
-8.9 |
-0.2 |
-1.6 |
0.0 |
ii. Cotton Textiles |
4.2 |
13.4 |
0.4 |
13.9 |
0.4 |
iii. Man Made Fibres |
4.4 |
-1.3 |
0.0 |
2.2 |
0.0 |
iv. Chemicals and Products |
11.9 |
2.2 |
0.2 |
8.1 |
0.9 |
of which : Fertilisers |
3.7 |
5.4 |
0.2 |
-4.4 |
-0.1 |
v. Non-Metallic Mineral Products |
2.5 |
2.2 |
0.1 |
0.5 |
0.0 |
of which: Cement |
1.7 |
2.0 |
0.0 |
-3.2 |
-0.1 |
vi. Basic Metals, Alloys and Metal Products |
8.3 |
-9.4 |
-1.0 |
1.1 |
0.1 |
of which: Iron and Steel |
3.6 |
-14.6 |
-0.8 |
1.9 |
0.1 |
vii. Machinery and Machine Tools |
8.4 |
2.6 |
0.2 |
3.2 |
0.2 |
of which: Electrical Machinery |
5.0 |
1.1 |
0.0 |
2.9 |
0.1 |
viii. Transport Equipment and Parts |
4.3 |
2.8 |
0.1 |
0.5 |
0.0 |
Memo: |
Food Items (Composite) |
26.9 |
8.1 |
2.1 |
16.8 |
4.6 |
Manufactured Non-food Products |
52.2 |
0.8 |
0.4 |
4.7 |
2.1 |
WPI Excluding Food |
73.1 |
-1.2 |
-0.9 |
7.3 |
5.3 |
WPI Excluding Fuel |
85.8 |
3.2 |
2.5 |
9.2 |
7.4 |
Essential Commodities |
17.6 |
9.9 |
1.6 |
19.8 |
3.6 |
*: Contribution to inflation |
VI.24 Though the current inflation in food
articles in India is quite significant, it needs
to be noted that the international food prices have been much volatile in the recent past
as compared to the domestic prices. Imports
as an option to check price rise in India may
not be fully effective as global inflation in
food has already caught up with the high
levels in India (Chart VI.11, Table VI.5).
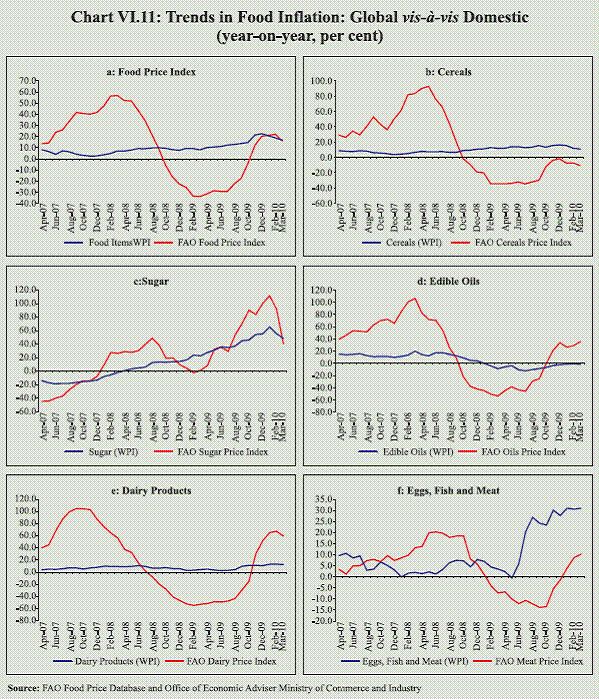 |
Table VI.5: Key Commodity Prices - Global vis-à-vis Domestic |
(Per cent) |
Item |
Annual Inflation (y-o-y, March 2010) |
Global |
India |
1 |
2 |
3 |
1. Rice |
-14.2 |
8.0 |
2. Wheat |
-17.3 |
14.4 |
3. Raw Cotton |
66.5 |
17.5 |
4. Oilseeds |
7.7 |
9.8 |
5. Iron Ore |
-28.2 |
-15.5 |
6. Coal mining |
54.7 |
13.5 |
7. Minerals Oil |
70.0 |
17.0 |
8. Edible Oils |
39.1 |
-1.6 |
9. Oil Cakes |
-4.4 |
7.0 |
10. Sugar |
41.4 |
48.8 |
11. Non-ferrous metals * |
62.0 |
3.3 |
12. Iron and Steel |
-13.8 |
1.9 |
# : Global oilseeds and edible oils prices are represented by soybeans and palm oil, respectively.
* : Represented by IMF metals price index, which covers copper, aluminium, iron ore, tin, nickel, zinc, lead and uranium.
Note: Global price increases are based on the World Bank and IMF primary commodity prices data and WPI for India. |
Consumer Price Inflation
VI.25 The divergence between WPI and
CPI inflation increased during the first half
of 2009-10 as WPI inflation declined and became negative while CPI inflation
continued to increase. During the second
half of the year, even though both CPI (up
to January 2010) and WPI inflation
increased, the increase in WPI inflation was
much faster than CPI inflation. This led to
some narrowing down of the gap between
and WPI and CPI inflation in recent months
(Table VI.6 and Chart VI.12).
VI.26 Overall, while the inflation process
continues to be dominated by supply factors,
there is increasing evidence of generalisation
as well as pick-up in demand in certain areas,
which could be expected to continue with
added momentum, going forward. Strong
revival in import growth, major turnaround
in corporate sales, gradual increase in
capacity utilisation and recent trends in
demand for credit from the private sector
point to the emerging demand side risks to
inflation. Though food prices have started
to show seasonal moderation, the level still
remains high. Fuel group inflation has
accelerated significantly, reflecting higher
prices of freely priced fuel products, upward revision in coal prices, and reversal in excise
and customs duties that led to corresponding
increases in POL product prices, besides the
impact of low base. Pressure on the inflation
process to get generalised has, therefore,
been persistent. Non-food manufacturing
products inflation rose from (-)0.4 in November 2009 to 4.7 per cent in March
2010 suggesting more generalisation of the
inflation process. Given inflation
persistence, high generalised inflation, if not
contained, could aggravate inflation
expectations and impede the ongoing
recovery.
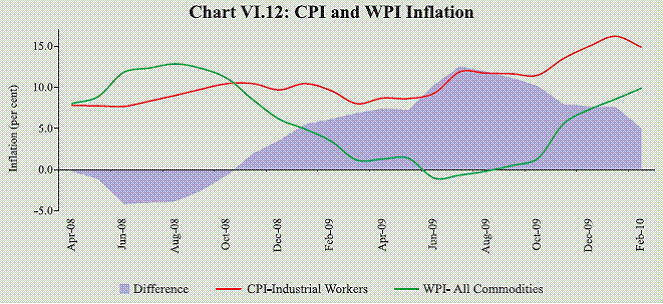 |
Table VI.6: Consumer Price Inflation - Major Groups |
(Year-on-year variation in per cent) |
CPI Measure |
Weight |
Mar-07 |
Mar-08 |
Jun-08 |
Sep-08 |
Dec-08 |
Mar-09 |
Jun-09 |
Sep-09 |
Dec-09 |
Jan-10 |
Feb-10 |
1 |
2 |
3 |
4 |
5 |
6 |
7 |
8 |
9 |
10 |
11 |
12 |
13 |
CPI-IW (Base: 2001=100) |
General |
100.0 |
6.7 |
7.9 |
7.7 |
9.8 |
9.7 |
8.0 |
9.3 |
11.6 |
15.0 |
16.2 |
14.9 |
Food Group |
46.2 |
12.2 |
9.3 |
10.5 |
13.1 |
13.1 |
10.6 |
12.2 |
13.5 |
21.3 |
19.2 |
17.3 |
Pan, Supari etc. |
2.3 |
4.4 |
10.9 |
7.1 |
7.8 |
8.5 |
8.3 |
8.1 |
8.0 |
8.6 |
8.5 |
9.2 |
Fuel and Light |
6.4 |
3.2 |
4.6 |
8.4 |
9.1 |
9.7 |
7.4 |
1.4 |
4.2 |
3.4 |
3.4 |
3.4 |
Housing |
15.3 |
4.1 |
4.7 |
4.7 |
3.8 |
3.8 |
6.0 |
6.0 |
22.1 |
22.1 |
33.1 |
33.1 |
Clothing, Bedding etc. |
6.6 |
3.7 |
2.6 |
2.5 |
2.5 |
4.2 |
5.0 |
4.1 |
4.1 |
4.1 |
4.9 |
4.8 |
Miscellaneous |
23.3 |
3.3 |
6.3 |
6.2 |
7.6 |
8.3 |
7.4 |
6.6 |
5.7 |
4.2 |
4.1 |
4.8 |
CPI-UNME (Base: 1984-85=100) |
General |
100.0 |
7.6 |
6.0 |
7.3 |
9.5 |
9.8 |
9.3 |
9.6 |
12.4 |
15.5 |
16.9 |
– |
Food Group |
47.1 |
10.9 |
7.8 |
9.6 |
13.2 |
13.4 |
12.2 |
13.6 |
14.4 |
21.4 |
20.3 |
– |
Fuel and Light |
5.5 |
6.4 |
4.6 |
5.3 |
6.2 |
7.7 |
5.9 |
1.3 |
4.2 |
3.5 |
3.5 |
– |
Housing |
16.4 |
5.6 |
4.0 |
3.8 |
3.5 |
3.5 |
5.8 |
6.0 |
22.0 |
22.0 |
33.2 |
– |
Clothing, Bedding etc. |
7.0 |
3.6 |
4.3 |
3.4 |
3.1 |
2.7 |
3.3 |
4.2 |
4.1 |
4.1 |
4.7 |
– |
Miscellaneous |
24.0 |
4.4 |
4.8 |
6.6 |
8.4 |
9.3 |
8.6 |
7.3 |
6.0 |
4.6 |
4.4 |
– |
CPI-AL (Base: 1986-87=100) |
General |
100.0 |
9.5 |
7.9 |
8.8 |
11.0 |
11.1 |
9.5 |
11.5 |
13.2 |
17.2 |
17.6 |
16.5 |
Food Group |
69.2 |
11.8 |
8.5 |
9.6 |
12.0 |
11.9 |
9.7 |
12.4 |
14.6 |
20.2 |
20.6 |
19.0 |
Pan, Supari etc. |
3.8 |
5.7 |
10.4 |
11.2 |
12.8 |
13.7 |
15.3 |
14.2 |
15.5 |
14.6 |
14.2 |
14.6 |
Fuel and Light |
8.4 |
6.9 |
8.0 |
8.9 |
10.2 |
11.3 |
11.5 |
11.0 |
12.0 |
14.3 |
15.1 |
15.1 |
Clothing, Bedding etc. |
7.0 |
3.5 |
1.8 |
3.1 |
6.0 |
7.0 |
7.4 |
8.3 |
8.1 |
8.2 |
8.4 |
8.9 |
Miscellaneous |
11.7 |
6.8 |
6.1 |
6.5 |
7.1 |
7.0 |
6.5 |
6.1 |
7.1 |
7.0 |
7.2 |
7.4 |
CPI-RL (Base: 1986-87=100) |
General |
100.0 |
9.2 |
7.6 |
8.7 |
11.0 |
11.1 |
9.7 |
11.3 |
13.0 |
17.0 |
17.4 |
16.5 |
Food Group |
66.8 |
11.5 |
8.2 |
9.6 |
12.0 |
11.9 |
10.0 |
12.4 |
14.6 |
20.4 |
20.8 |
19.3 |
Pan, Supari etc. |
3.7 |
5.7 |
10.6 |
10.9 |
12.5 |
13.4 |
15.0 |
14.1 |
15.4 |
14.4 |
13.9 |
14.8 |
Fuel and Light |
7.9 |
6.9 |
8.0 |
8.9 |
10.5 |
11.3 |
11.5 |
11.0 |
12.0 |
14.1 |
15.1 |
15.1 |
Clothing, Bedding etc. |
9.8 |
3.1 |
2.8 |
4.1 |
6.5 |
7.3 |
8.2 |
8.8 |
9.5 |
10.3 |
10.0 |
10.1 |
Miscellaneous |
11.9 |
6.3 |
6.2 |
6.8 |
7.4 |
7.5 |
6.7 |
6.2 |
6.9 |
6.6 |
6.8 |
7.0 |
| Memo: |
WPI Inflation |
6.6 |
7.5 |
11.8 |
12.3 |
6.1 |
1.2 |
-1.0 |
0.5 |
8.1 |
9.4 |
9.9 |
GDP Deflator based Inflation* |
5.5 |
4.9 |
8.8 |
11.6 |
8.7 |
7.9 |
0.9 |
0.8 |
5.6 |
– |
– |
*: Data for March pertain to full year.
IW : Industrial Workers. UNME : Urban Non-Manual Employees. AL : Agricultural Labourers. RL : Rural Labourers. |
|