The global financial markets witnessed further stabilisation with firmer indications about the strength of the recovery but with concerns about fiscal conditions as reflected in sovereign risks. Domestic financial markets remained stable. While the persistent surplus liquidity conditions kept the money market interest rates low, the medium to long-term yield on government bonds increased, reflecting the concerns relating to the size of the borrowing programme and inflationary conditions as well expectations about the monetary exit. The credit market conditions improved with a turnaround in the demand for credit from the corporate sector as well as better transmission of policy rates to the deposit and lending rates, though with lags. Asset prices, in terms of stock prices as well as residential housing prices, exhibited significant rise. The upward pressure on the exchange rate continued, reflecting the revival in capital inflows.
V.1 Uncertainties about the path of future global recovery and risks arising from large sovereign debt continue to threaten the return to stability in the international financial markets. These developments in the global financial markets transmitted to the domestic financial markets by way of sporadic volatility in stock prices and the exchange rate. The domestic financial markets faced concerns emerging from the large fiscal deficit, despite the beginning of exit, and the inflationary expectations stemming from high headline inflation, which affected the government bond market. The transmission of lower policy rates to the credit markets improved through lower lending rates, though with lags. The flow of credit to support the recovery in growth improved in recent months, while availability of resources from non-banking sources also increased. Asset prices increased at a relatively faster pace in the recent period. With the turnaround in capital inflows, the
exchange rate appreciated.
International Financial Markets
V.2 The global financial markets during 2009 exhibited significant stabilisation, despite the drag from the global financial crisis. Although financial markets were marked by intermittent volatility, mainly arising from the uncertainty regarding the shape of the global recovery, the risks in the global financial markets declined for most part of 2009, as stronger signs of global recovery became visible. The sovereign risk concerns, however, dominated the financial markets. Two major events i.e., the Dubai World debt standstill and the sovereign debt problem of the East European countries, mainly Greece, posed another bout of risk to the financial system towards the end of 2009 and beginning of 2010, which led to greater volatility in the international markets.
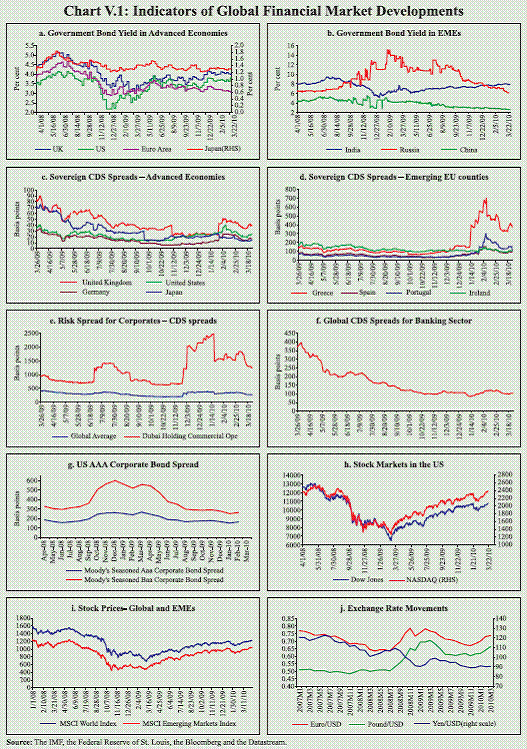
V.3 In the aftermath of the global financial crisis, the high debt levels in the advanced economies – an outcome of bailouts and unprecedented fiscal stimulus – have created adverse market expectations about sustainability of such debt levels and exerted pressures on the government bond yield (Chart V.1a). With signals from the major central banks in the advanced economies that interest rates may remain low for some time, the bond yields have somewhat moderated towards the end of the year. The government bond yields in EMEs witnessed broadly a moderating trend, excluding India (Chart V.1b). Recent events, i.e., Greece’s sharp revisions of budget deficit from 3.7 per cent to 12.7 of GDP in 2009 and the Dubai World default, have renewed risk aversion in the sovereign bond markets (Chart V.1c and d). Besides Greece, the other Euro area countries such as Italy, Portugal, Ireland and Spain also seem to be under stress due to high public debt. While Ireland is already on fiscal adjustment, the contingent liabilities from the banking sector still loom large. V.4 The US AAA-rated corporate bond spreads declined by about 100 basis points between January 2009 and March 2010 (Chart VI.1g). In the aftermath of the Dubai World debt default, however, the credit risk repricing for corporates was evident from the increase in global credit default swap (CDS) spreads for the corporate sector (Chart V.1e). In fact, activity in the CDS market in advanced economies increased significantly as investors reassessed their exposure to sovereign risks. The CDS spreads for the banking sector, which had shown sequential drop in 2009 due to improved bottom lines of the banks, witnessed pressure in Q1:2010 as the market concerns of sustainability of sovereign debt in many advanced countries and EMEs impacted on the risk perception towards the banking sector as they accumulated a large portfolio of government bonds in their balance sheet (Chart V.1f). V.5 A significant reduction in investor risk appetite to both the advanced economies and the EMEs was reflected in large gains in equity prices in 2009, which have been sustained in 2010 so far. The US stocks recorded gains of about 42 to 56 percent between March 2009 and March 2010 (Chart V.1h). Although the gains in equity prices in both the advanced economies and EMEs were marginal in Q1: 2010 over Q4:2009, overall the advanced economies’ stock prices gained by 52 per cent between March 2009 and March 2010, while the EMEs recorded even higher gains of 78 per cent, reflecting the uneven pace of global recovery (Chart V.1i). V.6 The gains in EME asset prices were aided by a number of factors such as robust economic recovery, reduced risks, low interest rates in the advanced economies and capital inflows in search for higher yield. The rising short-term capital flows to EMEs raised concerns about their adverse impact on the exchange rate and liquidity management, prompting some countries to impose variants of Tobin tax. Brazil imposed a 2 per cent tax on foreign capital (invested in domestic equity and bond markets) in October 2009 and a further 1.5 per cent tax on certain trades involving American Depository Receipts (ADRs). Taiwan also prevented flow of foreign funds into time deposits from mid- November 2009. V.7 In the foreign exchange market, the depreciating trend of the US dollar was reversed during Q1 of 2010 (V.1j). The US dollar generally appreciated against major currencies like the euro and pound sterling during the quarter, buoyed by positive economic data from the US. However, despite the strength exhibited by the US dollar against major currencies during Q4 of 2009, it depreciated against the major currencies as also against the currencies of EMEs during the year as a whole (see Table V.1).
 V.8 The stronger signs of global recovery taking hold led to reduction in risks in the international markets, which also favourably impacted the domestic equity markets during the major part of 2009. Reduction in risk perception towards EMEs along with continuance of low policy rates in the advanced economies for the extended periods, led to revival in capital flows to India, which in turn contributed to significant gains by the equity markets and at the same time put appreciation pressures on the exchange rate. Nevertheless, since the last quarter of 2009, the global shocks from Dubai World standstill on debt payments and sovereign debt concerns spreading from Greece to other East European countries, have impacted the domestic markets in terms of higher volatility in stock prices and to some extent the exchange rate. Overall, the impact of such global shocks remained contained and transient; the various segments of the domestic market functioned in an orderly manner, with increasing volumes in activities.
Domestic Financial Markets V.9 The domestic financial markets during 2009-10 were characterised by certain major trends, such as prevalence of comfortable liquidity conditions in money markets despite large government borrowing programme, MSS unwinding in alignment with the borrowing programme to contain pressure on yield, call rate remaining low and around the lower bound of the liquidity adjustment facility (LAF) corridor, rising pressure on medium to long-term government bond yield, appreciation of the rupee amid a two-way movement, and substantial gain in asset prices, in terms of both stock and housing prices (Table V.2).
Table V.1: Currency and Stock Price Movement in EMEs |
(Per cent) |
Items |
End-March 08 @ |
End-March 09 @ |
End-March 2010@ |
Items |
End-March 08 @ |
End-March 09 @ |
End-March 2010@ |
1 |
2 |
3 |
4 |
1 |
2 |
3 |
4 |
Appreciation (+)/Depreciation (-) of the US Dollar |
Stock Price Variations |
Japanese Yen |
-14.9 |
-2.0 |
-4.9 |
Indonesia |
33.7 |
-41.4 |
93.7 |
Chinese Yuan |
-9.3 |
-2.6 |
-0.1 |
(Jakarta Composite) |
|
|
|
Russian Ruble |
-9.7 |
44.3 |
-13.0 |
Brazil (Bovespa) |
33.1 |
-32.9 |
71.9 |
Turkish Lira |
-5.8 |
27.7 |
-9.1 |
Thailand (SET Composite) |
21.3 |
-47.2 |
82.6 |
Indian Rupee |
-8.3 |
27.5 |
-11.4 |
India (BSE Sensex) |
19.7 |
-37.9 |
80.5 |
Indonesian Rupiah |
1.1 |
25.6 |
-21.3 |
South Korea (KOSPI) |
17.3 |
-29.2 |
40.3 |
Malaysian Ringgit |
-7.8 |
14.4 |
-10.3 |
China |
9.1 |
-31.7 |
31.0 |
South Korea Won |
5.5 |
38.9 |
-17.9 |
Taiwan (Taiwan Index) |
8.7 |
-39.2 |
52.0 |
Thai Baht |
-10.2 |
12.9 |
-8.9 |
Russia (RTS) |
6.1 |
-66.4 |
128.0 |
Argentine Peso |
2.1 |
17.3 |
4.4 |
Malaysia (KLSE Composite) |
0.1 |
-30.1 |
51.3 |
Brazilian Real |
-17.0 |
31.2 |
-19.8 |
Singapore (Straits Times) |
-4.9 |
-43.5 |
69.9 |
Mexican Peso |
-3.5 |
32.9 |
-11.4 |
|
|
|
|
@: Year-on-year variation.
Source: Bloomberg, IFS, IMF. |
Table V.2: Domestic Financial Markets at a Glance |
Year/ Month |
Call Money |
Govt. Securities Market |
Foreign Exchange Market |
Liquidity Management |
Stock Markets |
Daily Turn over (Rs. crore) |
Call Rates* (Per cent) |
Daily Turn over^ (Rs. Crore) |
10-Year Yield @ (Per cent) |
Daily Inter- bank Turnover (US$ mn) |
Exchange rate @ (Rs./ US$) |
RBI’s net FC purch ase (+)/ sale (-) |
MSS Outstanding # (Rs. crore) |
Daily LAF Reverse Repo (Rs. crore) |
Daily BSE Turn over (Rs. crore) |
Daily NSE Turn over (Rs. crore) |
BSE Sensex ** |
CNX Nifty ** |
1 |
2 |
3 |
4 |
5 |
6 |
7 |
8 |
9 |
10 |
11 |
12 |
13 |
14 |
2008-09 |
22,436 |
7.06 |
10,879 |
7.54 |
34,712 |
45.92 |
-34,922† |
1,48,889 |
2,885 |
6,275 |
11,325 |
16569 |
4897 |
2009-10 |
15,924 |
3.24 |
13,936 |
7.23 |
29,447 |
44.95 |
-2,635† |
23,914 |
1,00,015 |
5,651 |
16,959 |
15585 |
4658 |
Apr-09 |
21,820 |
3.28 |
15,997 |
6.55 |
27,796 |
50.06 |
-2,487 |
75,146 |
1,01,561 |
5,232 |
15,688 |
10911 |
3360 |
May-09 |
19,037 |
3.17 |
14,585 |
6.41 |
32,227 |
48.53 |
-1,437 |
45,955 |
1,25,728 |
6,427 |
19,128 |
13046 |
3958 |
Jun-09 |
17,921 |
3.21 |
14,575 |
6.83 |
32,431 |
47.77 |
1,044 |
27,140 |
1,23,400 |
7,236 |
21,928 |
14782 |
4436 |
Jul-09 |
14,394 |
3.21 |
17,739 |
7.01 |
30,638 |
48.48 |
-55 |
22,159 |
1,30,891 |
6,043 |
18,528 |
14635 |
4343 |
Aug-09 |
15,137 |
3.22 |
9,699 |
7.18 |
27,306 |
48.34 |
181 |
19,804 |
1,28,275 |
5,825 |
17,379 |
15415 |
4571 |
Sep-09 |
16,118 |
3.31 |
16,988 |
7.25 |
27,824 |
48.44 |
80 |
18,773 |
1,21,083 |
6,211 |
18,253 |
16338 |
4859 |
Oct-09 |
15,776 |
3.17 |
12,567 |
7.33 |
28,402 |
46.72 |
75 |
18,773 |
1,01,675 |
5,700 |
18,148 |
16826 |
4994 |
Nov-09 |
13,516 |
3.19 |
17,281 |
7.33 |
27,599 |
46.57 |
-36 |
18,773 |
1,01,719 |
5,257 |
16,224 |
16684 |
4954 |
Dec-09 |
13,302 |
3.24 |
14,110 |
7.57 |
27,431 |
46.63 |
.. |
18,773 |
68,522 |
4,671 |
13,948 |
17090 |
5100 |
Jan-10 |
12,822 |
3.23 |
12,614 |
7.62 |
32,819 |
45.97 |
.. |
9,944 |
81,027 |
6,162 |
17,813 |
17260 |
5156 |
Feb-10 |
13,618 |
3.17 |
12,535 |
7.79 |
33,745 |
46.33 |
.. |
7,737 |
78,661 |
4,125 |
12,257 |
16184 |
4840 |
Mar-10 |
17,624 |
3.51 |
8,544 |
7.94 |
|
45.50 |
|
3,987 |
37,640 |
4,751 |
13,631 |
17303 |
5178 |
* : Average of daily weighted call money borrowing rates.
^ : Average of daily outright turnover in Central Government dated securities.
@ : Average of daily closing rates.
# : Average of weekly outstanding MSS. .. : Nil.
** : Average of daily closing indices. † : Cumulative for the financial year.
LAF : Liquidity Adjustment Facility. MSS : Market Stabilisation Scheme. BSE : Bombay Stock Exchange Limited.
NSE : National Stock Exchange of India Limited. FC : Foreign Currency.
Note : In column 10, (-) indicates injection of liquidity, while (+) indicates absorption of liquidity. |
Liquidity Conditions
V.10 The intra-year dynamics of
liquidity conditions reflected the calibrated
policy response to the evolving
macroeconomic and financial market
environment, interspersed with the impact
of quarterly advance tax outflows. The
surplus liquidity in the domestic markets,
partly induced by unwinding of the MSS
balances, prevailed during almost the entire
financial year 2009-10. The key drivers of
liquidity during the first half of 2009-10
were open market operations (OMO) to
manage the Government borrowing
programme coupled with MSS unwinding.
The total liquidity released during 2009-10
through the unwinding of MSS and auctionbased
OMO purchases amounted to Rs.1,42,827 crore. The surplus liquidity,
however, declined somewhat in the second
half of 2009-10 on account of relatively
lower MSS redemptions, absence of OMO
auctions, apart from the CRR hike in
February 2010, which absorbed primary
liquidity of around Rs.36,000 crore from
the system. The surplus liquidity declined
further on account of quarterly advance tax
outflows from the banking system that more
than offset the impact of de-sequestering of
Rs.5,000 crore of MSS balances on March
11, 2010 (Table V.3). Thus, the overall
surplus liquidity in the system declined
during the last quarter of 2009-10.
V.11 Overall, changes in the centre’s
balances were the key drivers of
autonomous liquidity in 2009-10 along with the uptick in currency demand in the latter
half of the year (Table V.4).
Table V.3: Liquidity Position |
(Rupees crore) |
Outstanding as on Last Friday |
LAF |
MSS |
Centre’s Surplus
@ |
Total
(2 to 4) |
1 |
2 |
3 |
4 |
5 |
2009 |
|
|
|
|
March* |
1,485 |
88,077 |
16,219 |
1,05,781 |
April |
1,08,430 |
70,216 |
-40,412 |
1,38,234 |
May |
1,10,685 |
39,890 |
-6,114 |
1,44,461 |
June |
1,31,505 |
22,890 |
12,837 |
1,67,232 |
July |
1,39,690 |
21,063 |
26,440 |
1,87,193 |
August |
1,53,795 |
18,773 |
45,127 |
2,17,695 |
September |
1,06,115 |
18,773 |
80,775 |
2,05,663 |
October |
84,450 |
18,773 |
69,391 |
1,72,614 |
November |
94,070 |
18,773 |
58,460 |
1,71,303 |
December |
19,785 |
18,773 |
1,03,438 |
1,41,996 |
2010 |
|
|
|
|
January |
88,290 |
7,737 |
54,111 |
1,50,138 |
February |
47,430 |
7,737 |
33,834 |
89,001 |
March* |
990 |
2,737 |
18,182 |
21,909 |
April (9) |
1,15,295 |
2,737 |
-10,789 |
1,07,243 |
@ : Excludes minimum cash balances with the Reserve Bank in case of surplus.
* : Data pertain to March 31.
Note: 1. Negative sign in column 2 indicates injection of
liquidity through LAF.
2. The Second LAF, conducted on a daily basis from September 17, 2008 to May 5, 2009 is being conducted only on reporting Fridays from May 8, 2009.
3. Negative sign in column 4 indicates injection of liquidity through WMA/OD. |
Money Market
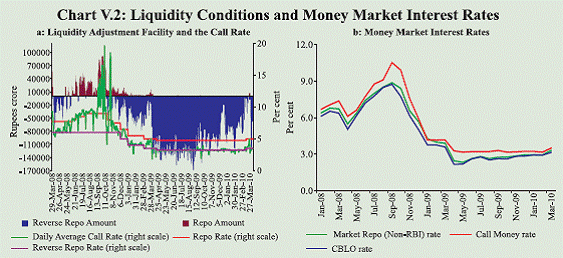
V.12 The call rate continued to hover around the lower bound of the informal LAF corridor during the financial year 2009-10 as surplus liquidity persisted throughout the year (Chart V.2a). Interest rates in the collateralised segments generally moved in tandem with but
remained below the call rate (Chart V.2b).
V.13 Transaction volumes in the collateralised borrowing and lending obligation (CBLO) and market repo segments continued to remain high during 2009-10 reflecting surplus liquidity and active market conditions throughout the year (Table V.5). Banks as a group continue to be the major borrowers in the collateralised segment whereas mutual funds (MFs) remain the single largest lender of funds in that segment. In fact, over 75
per cent of the lending in the collateralised segment is contributed by MFs, reflecting
their high lending capacity. The
collateralised segment continued to be the
predominant segment of the money market,
and its share in the total volume reached
around 90 per cent during the year 2009-10.
Table V.4: Reserve Bank’s Liquidity Management Operations |
(Rupees crore) |
| |
Item |
2008-09 |
2009-10 |
Q1 |
Q2 |
Q3 |
Q4 |
Apr-Mar |
Q1 |
Q2 |
Q3 |
Q4 |
1 |
2 |
3 |
4 |
5 |
6 |
7 |
8 |
9 |
10 |
11 |
A. |
Drivers of Liquidity (1+2+3+4) |
6,061 |
-18,851 |
-1,01,278 |
-53,641 |
-1,67,709 |
-44,284 |
-44,626 |
-66,784 |
54,801 |
1. |
RBI’s net Purchase from Authorised Dealers |
-8,555 |
-40,249 |
-1,12,168 |
-17,620 |
-1,78,592 |
-15,874 |
2,523 |
436 |
395 |
2. |
Currency with the Public |
-30,063 |
12,360 |
-40,070 |
-40,147 |
-97,921 |
-17,863 |
-9,132 |
-43,223 |
-31,553 |
3. |
a. Centre’s surplus balances with RBI |
40,073 |
-3,845 |
36,554 |
-12,415 |
60,367 |
3,382 |
-67,938 |
-22,663 |
85,257 |
| |
b. WMA and OD |
0 |
0 |
0 |
0 |
0 |
0 |
0 |
0 |
0 |
4. |
Others (residual) |
4,606 |
12,884 |
14,406 |
16,541 |
48,437 |
-13,929 |
29,921 |
-1,334 |
702 |
B. |
Management of Liquidity (5+6+7+8) |
-37,659 |
7,217 |
1,33,325 |
1,32,326 |
2,35,209 |
-21,674 |
62,376 |
89,870 |
1,618 |
5. |
Liquidity impact of LAF Repos |
-18,260 |
24,390 |
-71,110 |
13,145 |
-51,835 |
-1,30,020 |
25,390 |
86,330 |
18,795 |
6. |
Liquidity impact of OMO* (net) |
14,642 |
11,949 |
10,681 |
67,208 |
1,04,480 |
43,159 |
32,869 |
3,540 |
2,787 |
7. |
Liquidity impact of MSS |
-6,041 |
628 |
53,754 |
31,973 |
80,314 |
65,187 |
4,117 |
0 |
16,036 |
8. |
First round impact of CRR change |
-28,000 |
-29,750 |
1,40,000 |
20,000 |
1,02,250 |
0 |
0 |
0 |
-36,000 |
C. |
Bank Reserves # (A+B) |
-31,598 |
-11,634 |
32,047 |
78,685 |
67,500 |
-65,958 |
17,750 |
23,086 |
56,418 |
(+) : Injection of liquidity into the banking system. (-): Absorption of liquidity from the banking system.
* : Includes oil bonds but excludes purchases of government securities on behalf of State Governments.
# : Includes vault cash with banks and adjusted for first round liquidity impact due to CRR change.
Note: Data pertain to March 31 and last Friday for all other months. |
 V.14 During the year 2009-10, as observed in the Reporting Fridays’ statements, aggregate lending by MFs to banks (through CBLO, market repo and certificates of deposit) has generally exceeded banks’ aggregate investment in MFs. In general, banks have invested around Rs.1,00,000 crore in the liquid schemes of the MFs, while the MFs have lent around Rs.2,75,000 crore to banks through market repo, CBLO and certificates of deposit (CD); most of the increase in MFs investment in banks during 2009-10 has been in CD.
Table V.5: Activity in Money Market Segments |
(Rupees crore) |
Year/Month |
Average Daily Volume (One Leg) |
Commercial Paper |
Certificates of Deposit |
Call |
Market Repo |
CBLO |
Total (2 to 4) |
Money Market Rate (%)* |
Term Money |
Outstanding |
WADR (%) |
Outstanding |
WADR (%) |
1 |
2 |
3 |
4 |
5 |
6 |
7 |
8 |
9 |
10 |
11 |
Apr-09 |
10,910 |
20,545 |
43,958 |
75,413 |
2.41 |
332 |
52,881 |
6.29 |
2,10,954 |
6.48 |
May-09 |
9,518 |
22,449 |
48,505 |
80,472 |
2.34 |
338 |
60,740 |
5.75 |
2,18,437 |
6.20 |
Jun-09 |
8,960 |
21,694 |
53,553 |
84,207 |
2.69 |
335 |
68,721 |
5.00 |
2,21,491 |
4.90 |
Jul-09 |
7,197 |
20,254 |
46,501 |
73,952 |
2.83 |
389 |
79,582 |
4.71 |
2,40,395 |
4.96 |
Aug-09 |
7,569 |
23,305 |
57,099 |
87,973 |
2.62 |
461 |
83,026 |
5.05 |
2,32,522 |
4.91 |
Sep-09 |
8,059 |
27,978 |
62,388 |
98,425 |
2.73 |
381 |
79,228 |
5.04 |
2,16,691 |
5.30 |
Oct-09 |
7,888 |
23,444 |
58,313 |
89,645 |
2.70 |
225 |
98,835 |
5.06 |
2,27,227 |
4.70 |
Nov-09 |
6,758 |
22,529 |
54,875 |
84,162 |
2.87 |
191 |
1,03,915 |
5.17 |
2,45,101 |
4.86 |
Dec-09 |
6,651 |
20,500 |
55,338 |
82,489 |
2.91 |
289 |
90,305 |
5.40 |
2,48,440 |
4.92 |
Jan-10 |
6,411 |
14,565 |
50,571 |
71,547 |
2.97 |
404 |
91,564 |
4.80 |
2,82,284 |
5.65 |
Feb-10 |
6,809 |
19,821 |
63,645 |
90,275 |
2.95 |
151 |
97,000 |
4.99 |
3,09,390 |
6.15 |
Mar-10 |
8,812 |
19,150 |
60,006 |
87,968 |
3.22 |
393 |
91,025 ^ |
6.41 ^ |
3,39,279 # |
6.21 # |
* : Weighted average rate of call, market repo and CBLO. # : As on March 12, 2010. ^ : As on March 15, 2010.
CBLO: Collateralised Borrowing and Lending Obligation WADR: Weighted Average Discount Rate. |
V.15 With persisting surplus liquidity
conditions, the issuances of CD also
remained substantially higher during
2009-10 than that in the previous year. The
liquidity in the market ensured interest rates
on CD to remain stable with some uptick in
the last quarter. The commercial paper (CP)
market also picked up as corporates
increasingly took recourse to CPs as a means
to financing their working capital
requirements that led to a significant
increase in the share of ‘manufacturing
companies’ in the outstanding amount of
CPs (Table V.6). Despite the sizeable
increase in the issuances of CPs, the
comfortable liquidity in the system led to a
decline of about 340 basis points in the
interest rates between March 2009 and mid-
March 2010.
V.16 The Government mobilised large
amount through issuances or rollover of
treasury bills (TBs) in 2009-10. The yield
on TBs that remained soft during the first
half, reflecting the impact of low policy rate and ample liquidity, however, increased
subsequently on account of expectations of
policy rate hike and rise in inflationary
pressures (Table V.7).
Government Securities Market
V.17 In view of the increase in
government’s borrowing requirements and
the expected pick-up in credit during the
second half, the market borrowing
programme for 2009-10 was front loaded
(Table V.8). In contrast to the low interest
rates that prevailed in money markets, the
yield on government bonds hardened after
Q1 of 2009-10 reflecting the concerns of
stimulus led large fiscal deficit and the
rising inflationary expectations (Chart V.3a).
The Market Stabilisation Scheme (MSS)
buyback auctions and open market
purchases were synchronised with the
Government’s normal market borrowings
coupled with the de-sequestering of MSS
balances. By appropriately releasing
liquidity to the financial system, the
Reserve Bank ensured a relatively smooth
conduct of the Government’s market
borrowing programme in 2009-10. The borrowing programme for State governments
was also completed smoothly; however,
the pressure on interest rates persisted
(Table V.8). The Government will complete
a major part (about 63 per cent) of the gross
market borrowing programme for 2010-11
in the first half of the year to ensure that
there is no crowding out in the latter half
of the year when the private credit demand
is normally strong. Given the prevailing
comfortable liquidity conditions, the frontloading of borrowings would ensure
that the pressure on interest rates could be
managed.
Table V.6: Major Issuers of Commercial Paper |
(Rupees crore) |
Category of Issuer |
End of the period |
Jun 08 |
Sep 08 |
Dec 08 |
Mar 09 |
Jun 09 |
Sep 09 |
Dec 09 |
Mar 15, 2010 |
1 |
2 |
3 |
4 |
5 |
6 |
7 |
8 |
9 |
Leasing and Finance |
34,957 |
39,053 |
27,965 |
27,183 |
34,437 |
31,648 |
36,027 |
41,821 |
| |
(76.6) |
(75.0) |
(73.5) |
(61.5) |
(50.1) |
(40.0) |
(39.9) |
(45.9) |
Manufacturing |
8,150 |
9,925 |
6,833 |
12,738 |
23,454 |
31,509 |
42,443 |
33,154 |
| |
(17.4) |
(19.1) |
(18.0) |
(28.9) |
(34.1) |
(40.0) |
(47.0) |
(36.4) |
Financial Institutions |
3,740 |
3,060 |
3,257 |
4,250 |
10,830 |
16,071 |
11,835 |
16,050 |
| |
(8.0) |
(5.9) |
(8.5) |
(9.6) |
(15.8) |
(20.0) |
(13.1) |
(17.7) |
Total |
46,847 |
52,038 |
38,055 |
44,171 |
68,721 |
79,228 |
90,305 |
91,025 |
Note: Figures in brackets are percentage share in total. |
Table V.7: Treasury Bills in the Primary Market |
Year/ Month |
Notified Amount (Rupees crore) |
Average Implicit Yield at Minimum Cut-off Price (Per cent) |
Average Bid-Cover Ratio |
91-day |
182-day |
364-day |
91-day |
182-day |
364-day |
1 |
2 |
3 |
4 |
5 |
6 |
7 |
8 |
2008-09 |
2,99,000 |
7.10 |
7.22 |
7.15 |
3.43 |
2.91 |
3.47 |
2009-10 |
3,80,000 |
3.57 |
4.00 |
4.37 |
3.08 |
3.35 |
3.67 |
Apr 2009 |
39,000 |
3.81 |
4.11 |
4.07 |
3.22 |
2.79 |
5.07 |
May 2009 |
29,000 |
3.26 |
3.54 |
3.58 |
3.18 |
2.25 |
3.14 |
Jun 2009 |
22,500 |
3.35 |
3.56 |
3.99 |
3.37 |
5.65 |
2.86 |
July 2009 |
40,000 |
3.23 |
3.45 |
3.76 |
3.92 |
2.86 |
3.90 |
Aug 2009 |
28,000 |
3.35 |
3.84 |
4.25 |
3.04 |
2.18 |
3.76 |
Sep 2009 |
32,000 |
3.35 |
3.94 |
4.47 |
3.67 |
4.17 |
4.05 |
Oct 2009 |
36,000 |
3.23 |
4.01 |
4.57 |
3.15 |
3.88 |
2.86 |
Nov 2009 |
30,000 |
3.28 |
3.78 |
4.49 |
3.50 |
3.59 |
3.36 |
Dec 2009 |
26,500 |
3.57 |
4.08 |
4.63 |
3.12 |
2.99 |
4.10 |
Jan 2010 |
33,000 |
3.86 |
4.13 |
4.67 |
1.97 |
3.60 |
4.61 |
Feb 2010 |
31,000 |
4.11 |
4.52 |
4.95 |
2.10 |
2.51 |
2.49 |
Mar 2010 |
33,000 |
4.35 |
4.67 |
5.13 |
2.48 |
3.51 |
3.48 |
V.18 Notwithstanding easy liquidity
conditions in the money market during
2009-10, the yield curve generally
continued to shift upwards indicating
market concerns of fiscal deficit and rising
inflationary pressures (Chart V.3b). While
the medium to long-term bond yields, in
general, moved up during the year, reflecting inflation and fiscal deficit
concerns, the short-term yield softened till
Q3 of 2009-10, reflecting the surplus
liquidity conditions, followed by a
hardening trend in Q4 as the surplus
liquidity reduced and there was a general
shift in the interest rate environment.
During the Q4 of 2009-10, the government
securities market continued to trade with a
hardening bias tracking the impact of the
increase in CRR on liquidity conditions and
the rising WPI inflation.
Table V.8: Issuances of Central and State Government Dated Securities |
| |
2007-08 |
2008-09 |
2009-10 |
1 |
2 |
3 |
4 |
Central Government |
|
|
|
Gross amount raised (Rupees crore) |
1,56,000 |
2,61,000 |
4,18,000 |
Devolvement on Primary Dealers (Rupees crore) |
957 |
10,773 |
7,219 |
Bid-cover ratio (Range) |
1.6-4.8 |
1.2-4.5 |
1.4-4.3 |
Weighted average maturity (years) |
14.9 |
13.80 |
11.2 |
Weighted average yield (per cent) |
8.12 |
7.69 |
7.23 |
State Governments |
|
|
|
Gross amount raised (Rupees crore) |
67,779 |
1,18,138 |
1,31,122 |
Cut-off yield |
7.84-8.90 |
5.80-9.90 |
7.04-8.58 |
Weighted average yield (per cent) |
8.25 |
7.87 |
8.11 |
Credit Market
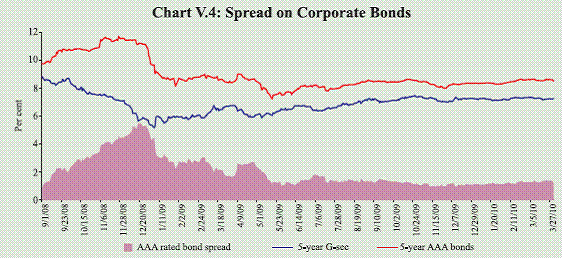
V.19 In tandem with the increase in the
government bond yields, yield on 5-year
AAA-rated corporate bonds, that had
started hardening in Q2, continued the trend
(Chart V.4). Nevertheless, the spreads on
corporate bonds over the government bond
yield declined to the pre-global crisis level,
indicating that the pressure on corporate
borrowings has moderated, which has
significance during the recovery phase.
 V.20 The monetary transmission, which
was a concern when the policy rates were
reduced by the Reserve Bank, has
improved, although with some lags. In
response to the ample market liquidity and
the lower policy interest rate environment,
the banks softened their deposit rates for
various maturities between March and
December 2009 (Table V.9). The deposit
rates, however, moved up in February-
March 2010 by 25-50 basis points,
reflecting not only the competition for
attracting deposits with the pickup in
demand for credit but also a change in the
interest rate environment resulting from
higher policy rates and hardening yield on
Government bonds. The transmission of
lower cost of funds for banks was visible
on the interest rates for private credit as the benchmark prime lending rates (BPLRs)
declined. The sub-BPLR lending of banks
(excluding export credit and small loans)
decreased to 65.8 per cent in December
2009 from 66.9 per cent in March 2009.
The introduction of the base rate is likely
to impart greater transparency to fixation
of lending rates by banks and may also
improve the assessment of the monetary
policy transmission.
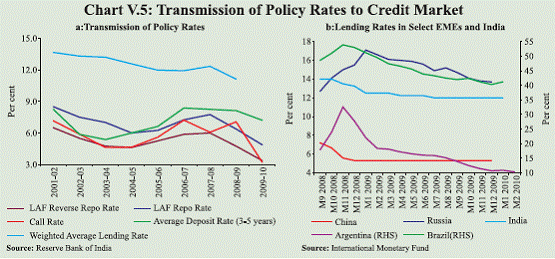
V.21 The monetary policy transmission
is reasonably efficient to the money and
bond markets, though, slower to the credit
market because of existing structural
rigidities (Chart V.5a). The transmission
of lower policy rates to lending rates in
India looks comparable with trends in
other EMEs (Chart V.5b). It is possible that the transmission to credit market may
exhibit an asymmetric response in terms
of speed when the interest rate cycle turns
around.
Table V.9: Deposit and Lending Rates of Scheduled Commercial Banks |
(Per cent) |
| |
Mar-08 |
Mar-09 |
Jun-09 |
Sep-09 |
Dec-09 |
Mar-10 |
1 |
2 |
3 |
4 |
5 |
6 |
7 |
1. |
Domestic Deposit Rate |
|
|
|
|
|
|
| |
Public Sector Banks |
|
|
|
|
|
|
| |
Up to 1 yr. |
2.75-8.50 |
2.75-8.25 |
1.00-7.00 |
1.00-6.75 |
1.00-6.25 |
1.00-6.50 |
| |
1 yr. to 3 yr. |
8.25-9.25 |
8.00-9.25 |
6.50-8.00 |
6.50-7.50 |
6.00-7.25 |
6.00-7.25 |
| |
above 3 yr. |
8.00-9.00 |
7.50-9.00 |
7.00-8.50 |
6.50-8.00 |
6.25-7.75 |
6.50-7.75 |
| |
Private sector banks |
|
|
|
|
|
|
| |
Up to 1 yr. |
2.50-9.25 |
3.00-8.75 |
2.00-7.50 |
2.00-7.00 |
2.00-6.75 |
2.00-6.50 |
| |
1 yr. to 3 yr. |
7.25-9.25 |
7.50-10.25 |
6.00-8.75 |
5.25-8.00 |
5.25-7.50 |
5.25-7.75 |
| |
above 3 yr. |
7.25-9.75 |
7.50-9.75 |
6.00-9.00 |
5.75-8.25 |
5.75-8.00 |
5.75-8.00 |
| |
Foreign banks |
|
|
|
|
|
|
| |
Up to 1 yr. |
2.25-9.25 |
2.50-8.50 |
1.80-8.00 |
1.25-8.00 |
1.25-7.00 |
1.25-7.00 |
| |
1 yr. to 3 yr. |
3.50-9.75 |
2.50-9.50 |
2.25-8.50 |
2.25-8.50 |
2.25-7.75 |
2.25-8.00 |
| |
above 3 yr. |
3.60-9.50 |
2.50-10.00 |
2.25-9.50 |
2.25-8.50 |
2.25-8.50 |
2.25-8.75 |
2. |
BPLR |
|
|
|
|
|
|
| |
1. Public Sector Banks |
12.25-13.50 |
11.50-14.00 |
11.00-13.50 |
11.00-13.50 |
11.00-13.50 |
11.00-13.50 |
| |
2. Private Sector Banks |
13.00-16.50 |
12.75-16.75 |
12.50-16.75 |
12.50-16.75 |
12.50-16.75 |
12.50-16.75 |
| |
3. Foreign Banks |
10.00-15.50 |
10.00-17.00 |
10.50-16.00 |
10.50-16.00 |
10.50-16.00 |
10.50-16.00 |
3. |
Actual Lending Rate@ |
|
|
|
|
|
|
| |
1. Public Sector Banks |
4.00-17.75 |
3.50-18.00 |
3.50-17.50 |
4.25-18.00 |
3.25-18.00 |
|
| |
2. Private Sector Banks |
4.00-24.00 |
4.75-26.00 |
4.10-26.00 |
3.00-29.50 |
3.50-25.84 |
|
| |
3. Foreign Banks |
5.00-28.00 |
5.00-25.50 |
2.76-25.50 |
3.73-21.99 |
3.50-22.00 |
|
Note: @ Interest rate on non-export demand and term loans above Rs.2 lakh, excluding lending rates at the extreme five per cent on
both sides |
 Foreign Exchange Market
V.22 The Indian rupee generally
exhibited strengthening trend against the
US dollar on the back of capital inflows and
positive growth outlook, although marked
by intermittent depreciation pressures
(Chart V.6).
V.23 Reflecting the easing supply
conditions in the market led by capital
inflows, forward premia generally
exhibited declining trend during 2009-10,
with sporadic hardening on account of
underlying demand conditions (Chart V.7).
V.24 A relatively subdued trade growth
seems to have kept the activity in the
merchant segment of the foreign exchange
market at a relatively lower level, although
it is slowly getting back to the pre-global
crisis level. The ratio of inter-bank to merchant turnover, thus, increased
marginally (Chart V.8a). The currency
futures have also grown significantly in
volume as the contracts are cash settled and
unlike their OTC variants, do not require
proof of an underlying that needs hedging
(Chart V.8b).
Equity and Housing Markets
V.25 In the aftermath of the global
financial crisis, the movements in asset
prices and their implications for the financial stability and monetary policy have
been explicitly recognised. During 2009-
10, there was sharp growth in key asset
prices in India; particularly the domestic
equity market registered a phenomenal
increase of 81 per cent in prices,
outperforming many EMEs (Table V.10).
V.26 The slack in the growth of bank
credit to the industry in 2009-10 was offset
to a large extent by higher mobilisation of
resources through IPOs, private placements
and mobilisation by mutual funds. The activity in the primary segment of the
domestic capital market displayed signs of
revival in Q2 and Q3 of 2009-10. The
resources raised through public issues
increased considerably during 2009-10
(Table V.11). Mobilisation of resources
through private placement (Rs.2,44,107
crore) also increased by 61.0 per cent during
April-December 2009. The resource
mobilisation by mutual funds increased
substantially with liquidity conditions
remaining comfortable, deposit interest
rates moderating and stock markets
witnessing considerable gains.
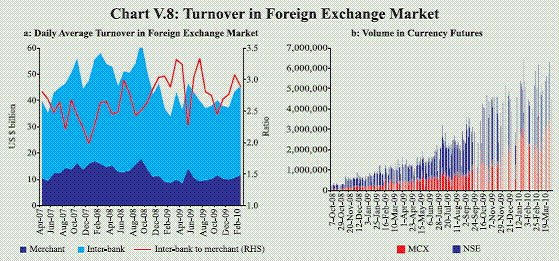
Table V.10: Key Stock Market Indicators |
Indicator |
BSE |
NSE |
2007-08 |
2008-09 |
2009-10 |
2007-08 |
2008-09 |
2009-10 |
1 |
2 |
3 |
4 |
5 |
6 |
7 |
1. |
BSE Sensex/S&PCNX Nifty |
|
|
|
|
|
|
| |
(i) End-period |
15644 |
9709 |
17528 |
4735 |
3021 |
5249 |
| |
(ii) Average |
16569 |
12366 |
15585 |
4897 |
3731 |
4658 |
2. |
Coefficient of Variation |
13.7 |
24.2 |
11.8 |
14.5 |
23.2 |
11.33 |
3. |
Price-Earning Ratio (end-period)* |
20.1 |
13.7 |
21.3 |
20.6 |
14.3 |
22.3 |
4. |
Market Capitalisation (Rupees thousand crore) @ |
5,138 |
3,086 |
6,164 |
4,858 |
2,896 |
6,009 |
5. |
Market Capitalisation to |
|
|
|
|
|
|
| |
GDP Ratio (per cent) |
113.1 |
59.0 |
106.5 |
107.0 |
55.4 |
103.8 |
*: Based on 30 scrips included in the BSE Sensex and 50 scrips included in the S&P CNX Nifty.
@: As at end-period.
Source: Bombay Stock Exchange Ltd. (BSE) and National Stock Exchange of India Ltd. (NSE). |
V.27 Stock prices displayed a continuous
upward momentum throughout the year,
except for some occasional corrections
during the last two quarters caused by
Dubai World default and the Greek
sovereign debt concerns. Following the
optimism on account of measures
announced in the Union Budget 2010-11
such as the roadmap for fiscal consolidation
and PSU divestment, stock prices recorded
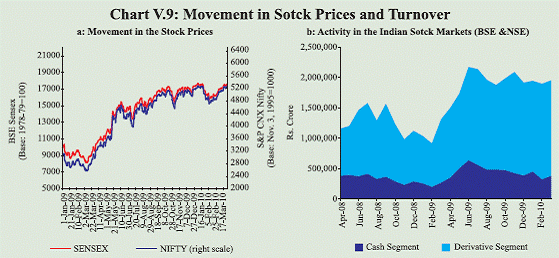
further gains. As at end-March 2010, the
Sensex and the Nifty both registered gains of 81 per cent and 74 per cent, respectively,
over end-March 2009 (Chart V.9a). The
gains in stock prices were associated with
substantial increase in the activity in the derivative segment surpassing the preglobal
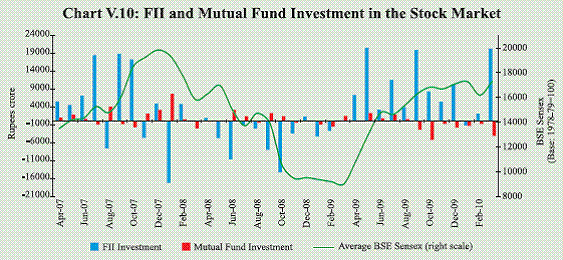
crisis level (Chart V.9b). The gains
in stock prices were also led by the FII
investments, while at the same time mutual
funds turned net sellers. FIIs made net
purchases of US$ 23.7 billion in the Indian
equity market during 2009-10 (net sales
of US$ 10.4 billion in 2008-09), while the
mutual funds’ net sales during
2009-10 amounted to Rs.10,512 crore (net
purchases of Rs.6,985 crore in of 2008-09)
(Chart V.10).
Table V.11: Resource Mobilisation from Capital Market |
(Rupees crore) |
Category |
2008-09 (Apr-Mar) |
2009-10 (Apr-Mar) P |
1 |
2 |
3 |
A. Prospectus and Rights Issues* |
14,671 |
32,607 |
1. Private Sector (a+b) |
14,671 |
25,479 |
a) Financial |
466 |
326 |
b) Non-financial |
14,205 |
25,153 |
2. Public Sector |
– |
7,128 |
a) Financial |
– |
325 |
b) Non-financial |
– |
6,803 |
B. Euro Issues |
4,788 |
15,967 |
C. Mutual Fund Mobilisation (net)@ |
-28,296 |
83,080 |
1. Private Sector |
-34,017 |
54,928 |
2. Public Sector # |
5,721 |
28,152 |
P: Provisional. *: Excluding offer for sale.
@: Net of redemptions.
#: Including UTI Mutual fund.
Note: Data exclude funds mobilised under Fund of Funds Schemes.
Source: Mutual Fund data are sourced from Securities and Exchange Board of India. |
 V.28 Another important segment of asset
prices is the residential housing segment
that has important implications for the
behaviour of general prices and overall
macroeconomic and financial stability.
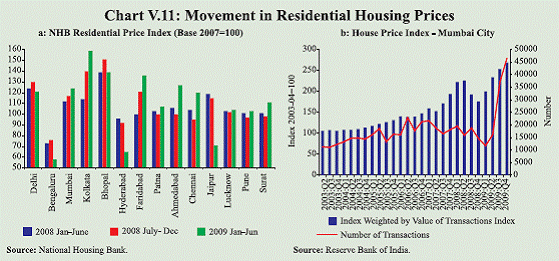
There has been a general upward pressure
on housing prices in the recent period,
which broadly co-terminates with the rise
in stock prices, thus, indicating generalised
asset price pressures (Chart V.11a and b).
V.29 The domestic financial markets
during 2009-10, thus, exhibited reduced volatility with market activity returning to
the pre-global crisis level. The evolution of
interest rates in money and government
bonds markets was different. While money
market interest rates remained low,
reflecting surplus liquidity conditions, there
was persistent pressure on medium to long
term bond yields. Nevertheless, stronger
potential pressure on interest rate on
account of the large size of the government
borrowing programme was managed by the
Reserve Bank through an array of liquidity
management tools such as MSS unwinding,
OMO purchases and shortening the maturity structure of new issues. Going
forward, with the revival of credit demand
from the private sector to normal levels, the
borrowing programme for 2010-11, despite
planned frontloading, could exert some
crowding out pressures. A stronger recovery
in India and the favourable interest rate
differentials in the face of easy global
liquidity conditions could lead to higher
capital inflows, which may influence both
exchange rate and asset prices. The strong
rebound in asset prices needs to be
monitored closely, given their implications
for financial and macroeconomic stability.
 |