During the first half of 2009-10, growth in both broad money (M3) and non-food credit
decelerated. This reversed course during the second half reflecting the pull of economic
recovery. While non-food credit, which had been decelerating since October 2008
reached its inflexion point in November 2009, money growth turned around in March
2010. By the end of the financial year, growth in both M3 and non-food credit exceeded
the Reserve Bank’s indicative projections of growth of 16.5 per cent and 16.0 per cent,
respectively. During the year, there was a slowdown in the pace of deposit mobilisation
by the banking system, mainly due to the gradual decline in interest rates on time deposits
in lagged response to the lower policy rates. With the increasing demand for credit from
the banking system, deposit mobilisation has begun to gain strength, and deposit rates
have also moved up in the recent period. Even after the absorption of Rs.36,000 crore
through the 75 basis points hike in CRR effected in February 2010, liquidity conditions
have remained comfortable, as evident from the reverse repo operations under the LAF
in the recent weeks.
IV.1 During the crisis, maintenance of
ample liquidity and lower policy rates were
used by the Reserve Bank as the key
channels to stimulate private demand and
thereby contain the pace of slowdown in
economic activity. The interest rate
transmission through lower lending rates
started becoming visible with a lag. When
the private demand for credit remained
depressed and decelerated till the middle
of Q3 of 2009-10, the flow of resources
from the non-banking sources to the
commercial sector increased. The recent
upturn in monetary and credit aggregates
provides additional evidence that the
recovery is taking hold.
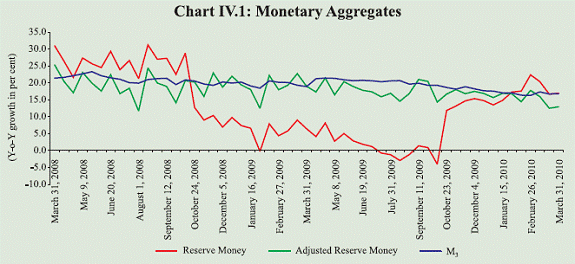
IV.2 In 2009-10, growth in reserve
money decelerated up to October and
thereafter gradually rose back to the growth
rate prevailing in September 2008, i.e.,
before the onset of the global financial crisis.
In contrast, reserve money adjusted for the
first round impact of CRR change, exhibited
less volatility and followed a mildly
decelerating trend for the year.
IV.3 Growth in broad money (M3)
showed deceleration throughout the year,
with a moderate turnaround seen in March
2010 (Chart IV.1 and Table IV.1). This was
on account of deceleration in aggregate
deposits on the components side of M3. On
the sources side of M3, the deceleration was
driven by the relatively weak demand for
credit from the commercial sector during
the first half of 2009-10, combined with
moderation in banking system’s credit to
the Government during the second half of
2009-10. After a phase of deceleration,
there has been a revival in the flow of bank
credit since November 2009, as a result of
which the Reserve Bank’s indicative target
of 16.0 per cent credit growth for the year
was exceeded by mid-March 2010. The
improved flow of credit from the banking
sector in conjunction with higher
availability of resources from the nonbanking
sources (both domestic as well as
foreign) led to a significant increase in total
flow of financial resources to the
commercial sector, thereby financing the activities underpinning the economic
recovery that is underway.
 Reserve Money
IV.4 In 2008-09, the deceleration in the
growth rate of reserve money was primarily on account of decline in bankers’ deposits
with the Reserve Bank on the components
side of reserve money (due to a net reduction
in CRR by 250 basis points during the year)
and decline in foreign currency assets (on
account of capital outflows) on the sources side of reserve money. During 2009-10, the
deceleration continued up to October. This
was mainly due to decline in bankers’
deposits (since growth in banks’ aggregate
deposits decelerated even as the CRR stayed
unchanged at 5.0 per cent) on the
components side of reserve money and
decline in Reserve Bank’s credit to the
Centre, reflecting increased reverse repo
operations1 and increase in Centre’s surplus
on the sources side of reserve money. As the
outstanding reverse repo balances and open
market operations declined October 2009
onwards, net Reserve Bank credit to the
Centre became the important driver of
acceleration in reserve money growth.
Table IV.1: Monetary Indicators |
(Amount in Rupees crore) |
| |
Outstanding as on March 31, 2010 |
Variation (y-o-y) |
2008-09 |
2009-10 |
Absolute |
Per cent |
Absolute |
Per cent |
1 |
2 |
3 |
4 |
5 |
6 |
I. |
Reserve Money |
11,55,281 |
59,698 |
6.4 |
1,67,281 |
16.9 |
| |
(Reserve Money adjusted for CRR changes) |
|
|
(19.0) |
|
(12.9) |
II. |
Broad Money (M3) |
55,79,567 |
7,59,186 |
18.9 |
8,02,498 |
16.8 |
III. |
Components of M3 (a + b + c) |
|
|
|
|
|
| |
a) Currency with the Public |
7,68,048 |
97,866 |
17.2 |
1,01,722 |
15.3 |
| |
b) Aggregate Deposits (i+ii) |
48,07,734 |
6,64,802 |
19.3 |
7,02,514 |
17.1 |
| |
i) Demand Deposits |
7,14,157 |
3,143 |
0.5 |
1,32,643 |
22.8 |
| |
ii) Time Deposits |
40,93,577 |
6,61,660 |
23.1 |
5,69,872 |
16.2 |
| |
c) Other Deposits with RBI |
3,785 |
-3,482 |
-38.5 |
-1,788 |
-32.1 |
IV. |
Sources of M3 (a + b + c + d - e) |
|
|
|
|
|
a) Net Bank Credit to the Government (i+ii) |
16,68,258 |
3,78,207 |
42.0 |
3,90,534 |
30.6 |
i) Net Reserve Bank Credit to the Government |
2,20,218 |
1,74,789 |
– |
1,58,638 |
– |
of which: to the Centre |
2,19,836 |
1,76,397 |
– |
1,58,074 |
– |
ii) Other Banks’ Credit to the Government |
14,48,041 |
2,03,418 |
20.1 |
2,31,897 |
19.1 |
b) Bank Credit to the Commercial Sector |
34,83,253 |
4,41,526 |
17.1 |
4,62,737 |
15.3 |
c) Net Foreign Exchange Assets of the Banking Sector |
12,75,039 |
57,053 |
4.4 |
-77,145 |
-5.7 |
d) Government’s Currency Liabilities to the Public |
10,919 |
831 |
9.0 |
865 |
8.6 |
e) Net Non-Monetary Liabilities of the Banking Sector |
8,57,902 |
1,18,430 |
15.5 |
-25,508 |
-2.9 |
Note: Data are provisional. |
IV.5 For the entire financial year 2009-
10, the decline in MSS balances by
Rs.85,340 crore (through unwinding and
de-sequestering of balances to the
Government) was the largest source of
increase in reserve money, accounting for more than 50 per cent of the Rs.1,67,281
crore increase in reserve money. The other
major source was open market purchases.
LAF operations and Centre’s surplus with
the Reserve Bank played a significant role
in quarter to quarter movements in net
Reserve Bank credit to the Centre and hence
in reserve money.
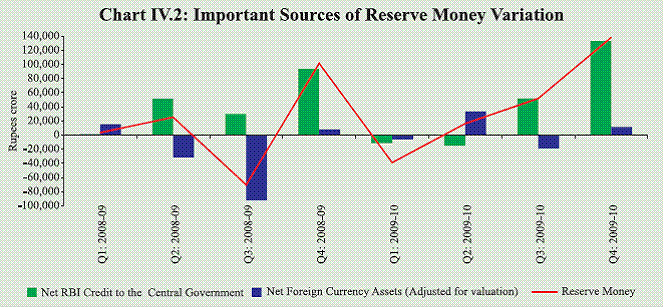
IV.6 The foreign currency assets of the
Reserve Bank (adjusted for valuation) were
the dominant source of variations in reserve
money in the past five years. During 2009-
10, net accretion to foreign currency assets
was the highest during the second quarter
(Chart IV.2). In the last two quarters of
2009-10, however, the expansion in reserve
money was not affected much by the
moderate contraction and the subsequent
expansion in foreign currency assets of the
Reserve Bank. The significant movement
in the net non-monetary liabilities of the
Reserve Bank was mainly on account of the movement in the valuation of foreign
exchange assets of the Reserve Bank.
 IV.7 During the fourth quarter of 2009-
10, reserve money growth on the
components side was led by the increase in
bankers’ deposits with the Reserve Bank.
This was on account of the increase in CRR
by 75 basis points in February 2010.
Currency in circulation also increased in
line with the increased economic activity
in the country (Table IV.2). On the sources side, net Reserve Bank credit to the Centre
accounted for nearly the entire increase in
reserve money (Chart IV.2). The increase
in net Reserve Bank credit to the Centre
was mainly due to the reduction in the
Government’s cash surplus with the
Reserve Bank. The other factor contributing
to increase in net Reserve Bank credit to
the Centre was decline in outstanding
reverse repo balances2, which reflected the
impact of the absorption of part of the excess liquidity in the system by the hike
in the CRR as well as some tightening of
the overall liquidity conditions resulting
from the advance tax payments during the
first fortnight of March 2010. There was
also a reduction in MSS balances with the
Reserve Bank due to unwinding (Rs.11,036
crore in the first week of January 2010) and
de-sequestering (Rs.5,000 crore on March
11, 2010).
Table IV.2: Reserve Money - Variations |
Item |
2008-09 |
2009-10 |
Q1 |
Q2 |
Q3 |
Q4 |
Q1 |
Q2 |
Q3 |
Q4 |
1 |
2 |
3 |
4 |
5 |
6 |
7 |
8 |
9 |
Reserve Money |
3,416 |
25,218 |
-70,454 |
1,01,519 |
-38,932 |
16,219 |
51,786 |
1,38,208 |
Components (1+2+3) |
|
|
|
|
|
|
|
|
1. Currency in Circulation |
36,859 |
-14,516 |
38,277 |
39,733 |
29,692 |
1,081 |
45,351 |
31,921 |
2. Bankers’ Deposits with RBI |
-29,333 |
39,219 |
-1,15,773 |
68,714 |
-72,664 |
20,680 |
5,456 |
1,07,552 |
3. ‘Other’ Deposits with the RBI |
-4,110 |
514 |
7,042 |
-6,928 |
4,040 |
-5,542 |
980 |
-1,266 |
Sources (4+5+6+7-8) |
|
|
|
|
|
|
|
|
4. RBI’s Net Credit to Government |
-13 |
51,360 |
30,230 |
93,212 |
-11,145 |
-14,953 |
51,428 |
1,33,308 |
of which: to Centre |
1,430 |
51,379 |
29,932 |
93,657 |
-11,497 |
-14,968 |
51,597 |
1,32,943 |
5. RBI’s Credit to Banks and Commercial Sector |
-3,358 |
4,963 |
5,032 |
11,163 |
-9,623 |
-3,747 |
-5,926 |
-2,384 |
6. Net Foreign Assets of RBI |
1,03,932 |
10,336 |
-1,56,330 |
86,048 |
-16,750 |
50,120 |
-15,108 |
-66,428 |
of which: Foreign Currency Assets, adjusted for valuation |
15,535 |
-31,641 |
-92,102 |
7,900 |
-6,245 |
33,441 |
-18,985 |
11,390 |
7. Governments’ Currency Liabilities to the Public |
225 |
206 |
186 |
213 |
254 |
302 |
218 |
91 |
8. Net Non-Monetary Liabilities of RBI |
97,369 |
41,648 |
-50,428 |
89,117 |
1,668 |
15,503 |
-21,175 |
-73,621 |
Memo: |
LAF -Repo (+)/Reverse Repo(-) |
-45,350 |
51,480 |
-62,170 |
4,205 |
-1,32,800 |
28,170 |
67,765 |
37,360 |
Net Open Market Sales * |
-8,696 |
-10,535 |
-7,669 |
-67,649 |
-42,001 |
-31,591 |
-1,894 |
17 |
Centre’s Surplus |
-42,427 |
6,199 |
-32,830 |
8,691 |
-13,156 |
77,713 |
17,519 |
-80,112 |
MSS Balances |
6,040 |
-628 |
-53,754 |
-31,973 |
-65,187 |
-4,117 |
0 |
-16,036 |
*: Excludes Treasury Bills.
Note: 1. The sum of the memo items will not add up to the net Reserve Bank credit to the Centre as LAF and OMO transactions are
at face value and also due to margin adjustment for LAF operations.
2. Data are based on March 31 for Q4 and last reporting Friday for all other quarters.
3. Data are provisional. |
IV.8 Since bankers’ deposits with the
Reserve Bank, a key determinant of reserve
money on the components side, change in
response to variations in CRR effected by
the Reserve Bank as part of its monetary
policy actions, it is often useful to analyse
the behaviour of reserve money adjusted
for the policy induced part of the change in
base money. Adjusting the reserve money
series for injection/absorption through CRR
changes gives the adjusted reserve money
series. The reserve money growth for the
last few fortnights of 2009-10 exceeds the
adjusted reserve money growth, reflecting
the impact of the hike in CRR in February
2010 that led to absorption of about Rs.36,000 crore of surplus liquidity from
the system (Chart IV.3).
Money Supply
IV.9 Broad money growth followed the
growth pattern of its largest component –
aggregate deposits. Since there was
gradual deceleration in aggregate
deposits, led primarily by time deposits,
money growth decelerated during the year
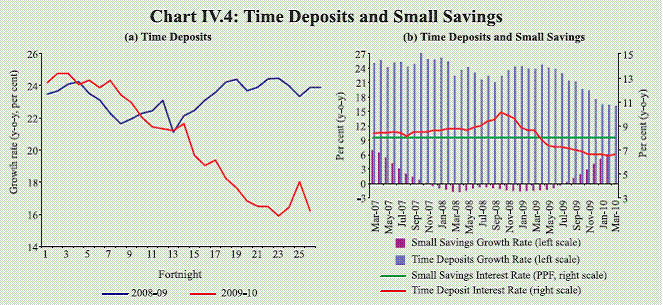
(Table IV.3). Due to the softening of
interest rates, there was deceleration in the
growth of time deposits through the year,
with an erratic pattern in the closing
fortnights of 2009-10 (Chart IV.4 a). Since
April 2009, returns on small savings have
remained higher than that of time deposits,
leading to rising inflows since August
2009, after a period of 20 consecutive
months of outflows. As the interest
differentials over time deposits became
more attractive, the rate of accretion into
the small savings schemes increased in
each successive month up to February
2010, i.e., the latest period for which data
are available (Chart IV.4 b).
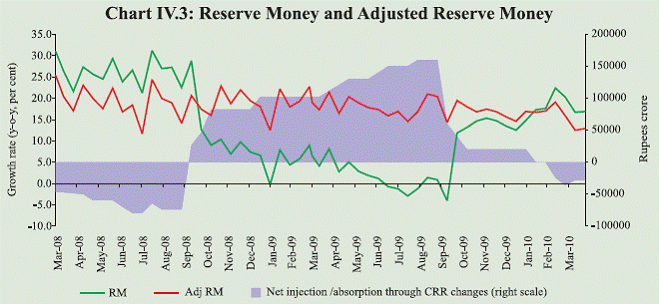
Table IV.3: Monetary Aggregates - Variations |
Item |
2008-09 |
2009-10 |
Q1 |
Q2 |
Q3 |
Q4 |
Q1 |
Q2 |
Q3 |
Q4 |
1 |
2 |
3 |
4 |
5 |
6 |
7 |
8 |
9 |
M3 (1+2+3 = 4+5+6+7-8) |
89,283 |
1,76,379 |
1,60,486 |
3,33,039 |
1,81,527 |
1,49,994 |
1,19,907 |
3,51,070 |
Components |
|
|
|
|
|
|
|
|
1. Currency with the Public |
35,772 |
-18,037 |
40,405 |
39,726 |
24,086 |
2,910 |
44,994 |
29,782 |
2. Aggregate Deposits with Banks |
57,621 |
1,93,902 |
1,13,039 |
3,00,241 |
1,53,401 |
1,52,626 |
73,933 |
3,22,554 |
2.1 Demand Deposits with Banks |
-79,325 |
52,771 |
-62,157 |
91,854 |
-33,738 |
65,288 |
-27,888 |
1,28,980 |
2.2 Time Deposits with Banks |
1,36,946 |
1,41,131 |
1,75,195 |
2,08,389 |
1,87,139 |
87,339 |
1,01,821 |
1,93,573 |
3. ‘Other’ Deposits with RBI |
-4,110 |
514 |
7,042 |
-6,928 |
4,040 |
-5,542 |
980 |
-1,266 |
Sources |
|
|
|
|
|
|
|
|
4. Net Bank Credit to Government |
36,124 |
31,654 |
1,29,335 |
1,81,093 |
1,20,425 |
71,011 |
33,105 |
1,65,994 |
4.1 RBI’s Net Credit to Government |
-13 |
51,360 |
30,230 |
93,212 |
-11,145 |
-14,953 |
51,428 |
1,33,308 |
4.2 Other Banks’ Credit to Government |
36,137 |
-19,706 |
99,106 |
87,881 |
1,31,570 |
85,963 |
-18,323 |
32,686 |
5. Bank Credit to the Commercial Sector |
30,811 |
1,63,138 |
90,616 |
1,56,962 |
-12,855 |
1,13,963 |
60,825 |
3,00,804 |
6. NFA of Banking Sector |
66,858 |
7,271 |
-1,32,461 |
1,15,385 |
-37,923 |
47,908 |
-20,701 |
-66,428 |
7. Government’s Currency Liabilities to the Public |
225 |
206 |
186 |
213 |
254 |
302 |
218 |
91 |
8 Net Non-Monetary Liabilities of the Banking Sector |
44,735 |
25,890 |
-72,809 |
1,20,614 |
-1,11,627 |
83,188 |
-46,460 |
49,390 |
Note: Data are provisional. |
IV.10 On the sources side, the main driver
of M3 has been the banking system’s credit
to the Government, while credit to the
commercial sector also showed revival in
the last quarter of 2009-10. A quarter-wise analysis reveals that incremental credit
extended by scheduled commercial banks
(SCBs) in absolute terms in the fourth
quarter of 2009-10 was the highest in last
two years (Chart IV.5). After showing an absolute decline in the third quarter of
2009-10, SCBs’ credit to the Government
increased during the fourth quarter, when
the Government’s borrowing programme
was completed.
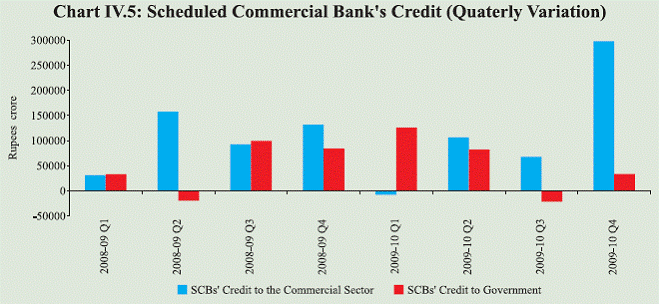 IV.11 Reflecting the revival in flow of
credit from the SCBs, the non-food credit
growth was 16.9 per cent by end-March
2010 as against the Reserve Bank’s
indicative trajectory of growth of 16 per cent
(Chart IV.6 a). In the year up to October 2009, deceleration in non-food credit had
continued and reached the low of 10.3 per
cent. As the economic recovery is
increasingly becoming more broad-based,
with industrial output exhibiting
particularly strong acceleration in recent
months, there is a significant revival in
credit demand since end-November 2009
and the incremental credit deposit ratio has
also risen steadily in the second half of
2009-10 (Chart IV.6 b).
IV.12 Due to the revival in credit demand
for the banking system as a whole, the credit
extended by private banks at end-March
2010 showed some improvement over last
year. The loan portfolio of foreign banks,
however, contracted (Table IV.4).
IV.13 Reflecting the revival in credit
demand from the private sector, SCBs’
investment in SLR securities increased at
a lower rate of 18.5 per cent (y-o-y) as on
March 26, 2010 as compared with 20.0 per
cent a year ago. Commercial banks’
holdings of such securities at 28.8 per cent
of their net demand and time liabilities
(NDTL) were only marginally higher than
28.1 per cent at end-March 2009. Adjusted
for LAF collateral securities on an
outstanding basis, SCBs’ holding of SLR
securities amounted to 28.4 per cent of
NDTL as on March 26, 2010. SCBs
reduced their overseas foreign currency
borrowings as well as their holding of
foreign currency assets during the year
(Table IV.5).
IV.14 Disaggregated data on sectoral
deployment of gross bank credit show
improvement in credit growth (y-o-y) to all major sectors such as agriculture, industry,
services and personal loans from November
2009 onwards. Industry absorbed 52.6 per
cent of incremental non-food credit (yo-
y) in February 2010 as compared with
55.8 per cent in the corresponding month of
the previous year. This expansion was led
by infrastructure and basic metals and metal
products. The share of incremental non-food
credit to services sector was 22.6 per cent in
February 2010. Within services sector, credit
growth (y-o-y) for transport operators,
computer software, tourism, hotels and
restaurants and trade accelerated in February
2010. Also, the share of incremental nonfood
credit to micro and small enterprises
(industry as well as services) increased to
16.4 per cent in February 2010 as compared
with 12.4 per cent in February 2009. Credit
to real estate decelerated sharply mainly on
account of the definitional change to the
concept of “lending to real estate sector”
effected in September 2009. The agricultural
sector absorbed 18.3 per cent of the
incremental non-food bank credit in
February 2010 (12.7 per cent last year).
Share of personal loans in incremental nonfood
credit increased markedly to 6.5 per cent by February 2010, from (-) 0.2 per cent
in October 2009. Within personal loans,
while education loan and housing loan
continued to grow over 30 per cent and 8
per cent, respectively, the contraction in
credit to some sub-sectors such as consumer
durables and advances against shares, bonds,
etc., moderated (Table IV.6).
Table IV.4: Credit Flow from Scheduled Commercial Banks |
(Amount in Rupees crore) |
Item |
Outstanding as on Mar. 26, 2010 |
Variation (Y-on-Y) |
As on Mar. 27, 2009 |
As on Mar. 26, 2010 |
Amount |
Per cent |
Amount |
Per cent |
1 |
2 |
3 |
4 |
5 |
6 |
1. Public Sector Banks |
24,12,508 |
3,48,562 |
20.9 |
3,93,797 |
19.5 |
2. Foreign Banks |
1,66,839 |
6,467 |
4.0 |
-2,496 |
-1.5 |
3. Private Banks |
5,84,703 |
52,013 |
11.0 |
61,211 |
11.7 |
4. All Scheduled Commercial Banks* |
32,40,399 |
4,13,636 |
17.5 |
4,64,849 |
16.7 |
*: including Regional Rural Banks.
Note: Data are provisional. |
Table IV.5.: Scheduled Commercial Banks - Sources and Uses of Funds |
(Amount in Rupees crore) |
Item |
Outstanding as on March 26, 2010 |
Variation (year-on-year) |
As on March 27,2009 |
As on March 26, 2010 |
Amount |
Per cent |
Amount |
Per cent |
1 |
2 |
3 |
4 |
5 |
6 |
Sources of Funds |
|
|
|
|
|
1. Aggregate Deposits |
44,21,639 |
6,26,838 |
20.0 |
6,54,798 |
17.4 |
2. Call/Term Funding from Financial Institutions |
1,04,501 |
7,432 |
7.0 |
-9,435 |
-8.3 |
3. Overseas Foreign Currency Borrowings |
35,217 |
-3,047 |
-6.9 |
-6,187 |
-14.9 |
4. Capital |
59,486 |
3,601 |
8.2 |
12,115 |
25.6 |
5. Reserves |
3,26,870 |
56,221 |
24.6 |
41,797 |
14.7 |
Uses of Funds |
|
|
|
|
|
1. Bank Credit |
32,40,399 |
4,13,636 |
17.5 |
4,64,849 |
16.7 |
of which: Non-food Credit |
31,91,909 |
4,11,824 |
17.8 |
4,62,571 |
16.9 |
2. Investments in Government and Other Approved Securities |
13,82,684 |
1,94,695 |
20.0 |
2,16,273 |
18.5 |
a) Investments in Government Securities |
13,75,704 |
1,97,124 |
20.6 |
2,19,918 |
19.0 |
b) Investments in Other Approved Securities |
6,980 |
-2,429 |
-18.6 |
-3,645 |
-34.3 |
3. Investments in non-SLR Securities |
2,34,114 |
36,907 |
21.6 |
26,597 |
12.8 |
4. Foreign Currency Assets |
43,788 |
24,123 |
77.3 |
-11,524 |
-20.8 |
5. Balances with the RBI |
2,81,390 |
-18,927 |
-7.4 |
43,195 |
18.1 |
Note: Data are provisional. |
IV.15 In 2009-10, part of the impact of
the deceleration in credit to the private
sector was offset by higher availability of
resources from non-banking sources,
particularly in the first three quarters. While
non-banking domestic sources such as
issuance of commercial papers (CPs),
private placements and initial public offerings (IPOs) have shown significant
increase; financing from foreign sources in
the form of FDI and issuance of American
Depository Receipts (ADRs)/Global
Depository Receipts (GDRs) also improved
(Table IV.7).
Table IV.6: Deployment of Gross Bank Credit by Major Sectors |
(Amount in Rupees crore) |
Sector |
Outstanding as on February 26, 2010 |
Variation (year-on-year) |
February 27, 2009 |
February 26, 2010 |
Absolute |
Per cent |
Absolute |
Per cent |
1 |
2 |
3 |
4 |
5 |
6 |
Non-Food Gross Bank Credit (1 to 4) |
28,89,737 |
4,09,191 |
19.6 |
3,97,052 |
15.9 |
1. Agriculture and Allied Activities |
3,70,407 |
52,126 |
21.2 |
72,654 |
24.4 |
2. Industry |
12,48,507 |
2,28,286 |
28.1 |
2,08,686 |
20.1 |
3. Personal Loans |
5,81,357 |
34,218 |
6.6 |
25,965 |
4.7 |
Housing |
2,97,203 |
16,431 |
6.4 |
22,880 |
8.3 |
Advances against Fixed Deposits |
46,529 |
2,927 |
6.8 |
750 |
1.6 |
Credit Card Outstanding |
20,737 |
2,122 |
7.9 |
-8,189 |
-28.3 |
Education |
36,522 |
7,033 |
33.8 |
8,690 |
31.2 |
Consumer Durables |
8,102 |
-2,399 |
-22.6 |
-109 |
-1.3 |
4. Services |
6,89,466 |
94,561 |
18.7 |
89,747 |
15.0 |
Transport Operators |
46,165 |
5,616 |
17.0 |
7,527 |
19.5 |
Professional Services |
12,599 |
1,686 |
22.4 |
3,399 |
36.9 |
Trade |
1,65,046 |
17,379 |
14.4 |
26,859 |
19.4 |
Real Estate Loans |
91,607 |
33,617 |
58.8 |
842 |
0.9 |
Non-Banking Financial Companies |
1,13,834 |
24,469 |
37.0 |
23,313 |
25.8 |
Memo: |
|
|
|
|
|
Priority Sector |
10,32,454 |
1,34,477 |
18.9 |
1,87,879 |
22.2 |
Small Enterprises |
3,60,859 |
50,932 |
20.8 |
65,033 |
22.0 |
Industry |
12,48,507 |
2,28,286 |
28.1 |
2,08,686 |
20.1 |
Food Processing |
60,489 |
6,622 |
14.0 |
6,634 |
12.3 |
Textiles |
1,16,926 |
11,555 |
12.5 |
13,194 |
12.7 |
Paper and Paper Products |
18,626 |
3,295 |
25.0 |
2,135 |
12.9 |
Petroleum, Coal Products and Nuclear Fuels |
65,626 |
31,739 |
77.4 |
-7,136 |
-9.8 |
Chemicals and Chemical Products |
79,543 |
13,391 |
22.4 |
6,274 |
8.6 |
Rubber, Plastic and their Products |
14,977 |
2,814 |
26.9 |
1,708 |
12.9 |
Iron and Steel |
1,24,367 |
25,774 |
34.5 |
23,984 |
23.9 |
Other Metals and Metal Products |
34,238 |
6,129 |
25.6 |
4,127 |
13.7 |
Engineering |
71,637 |
14,614 |
28.0 |
4,769 |
7.1 |
Vehicles, Vehicle Parts and Transport Equipments |
37,724 |
7,018 |
24.6 |
2,219 |
6.2 |
Gems and Jewellery |
30,135 |
2,618 |
10.6 |
2,893 |
10.6 |
Construction |
41,294 |
14,637 |
62.1 |
3,087 |
8.1 |
Infrastructure |
3,65,617 |
65,711 |
34.4 |
1,08,757 |
42.3 |
Note: Data are provisional and relate to select banks. Data also include the effects of mergers of Bharat Overseas Bank with Indian Overseas Bank, American Express Bank with Standard Chartered Bank and State Bank of Saurashtra with State Bank of India. |
Table IV.7: Flow of Financial Resources to the Commercial Sector |
(Rupees crore) |
Item |
April-March |
2008-09 |
2009-10 |
1 |
2 |
3 |
A. Adjusted Non-food Bank Credit |
4,21,091 |
4,73,819 |
i) Non-food Credit |
4,11,824 |
4,62,571 |
ii) Non-SLR Investment by SCBs |
9,267 |
11,248 |
B. Flow from Non-banks (B1+B2) |
4,12,864 |
4,96,937 |
B1. Domestic Sources |
2,28,491 |
2,93,142 |
1. Public issues by non-financial entities |
13,583 |
27,165 # |
2. Gross private placements by non-financial entities |
66,980 |
1,10,404 ^ |
3. Net issuance of CPs subscribed by non-banks |
10,718 |
41,667 $ |
4. Net credit from housing finance companies |
17,627 |
16,051 # |
5. Total gross accommodation by the four RBI regulated all India financial
institutions - NABARD, NHB, SIDBI and EXIM bank |
16,502 |
13,260 # |
6. Systemically important non-deposit taking NBFCs
(net of bank credit) |
28,858 |
37,962 # |
7. LIC’s gross investment in corporate debt, infrastructure and social sector |
74,223 |
46,633 # |
B2. Foreign Sources |
1,84,373 |
2,03,795 |
1. External commercial borrowings/foreign currency convertible bonds |
35,277 |
12,699 # |
2. ADR/GDR issues excluding banks and financial institutions |
4,686 |
14,669 # |
3. Short-term credit from abroad |
-927 |
15,921 ## |
4. FDI in India |
1,45,337 |
1,60,506 ## |
C. Total Flow of Resources (A+B) |
8,33,955 |
9,70,756 |
Memo Item: |
Net resource mobilisation by mutual funds through debt (non-Gilt) schemes |
30,214 |
2,61,065 # |
$ : Up to March 15. # : April-February. ## : April-January. ^ : April-December. |
IV.16 The emerging trends in monetary
and credit aggregates in recent months, thus,
corroborate the momentum seen in real
activities. While elevated headline inflation
and the recovery in growth could increase
the demand for money, policy driven
increase in CRR could contribute to
containing the growth in broad money.
Given the size of the Government’s
borrowing programme for 2010-11, if the recovery in demand for credit from the
private sector firms up further and capital
flows also increase, then monetary
expansion could be driven by all three main factors on the sources side, i.e., banking
system’s credit to the Government, credit to
the commercial sector and increase in net
foreign assets.
1 The increased recourse to reverse repo offset to a large extent the increase in Reserve Bank credit to the Central Government stemming from unwinding of MSS balances and open market purchases during the first half of the year.
2 The Reserve Bank’s credit to the Centre is affected by LAF operations, OMO, MSS balances and
Government’s cash surplus with the Reserve Bank. Increase in repo/OMO purchases and decline in reverse
repo/MSS balances/Government’s surplus balances with Reserve Bank lead to increase in net Reserve Bank
credit to the Centre, and vice versa. |