A detailed State-wise analysis of various fiscal indicators shows that most of the States are faced with a
deterioration in revenue balance and an increase in the level of GFD in 2008-09 (RE) and 2009-10
(BE) as compared to the earlier period of 2005-08. An analysis of the States’ budget documents indicates
inadequate fiscal transparency across the States. The States need to resume the process of fiscal correction
and consolidation at the earliest through the adoption of revenue augmentation and expenditure
rationalisation measures.
1. Introduction
4.1 This Chapter provides a State-wise
assessment of the fiscal situation, primarily
focusing on revised estimates of 2008-09 vis-a-vis
2005-08 (Average). State-wise assessment with
regard to the emerging picture out of the budget
estimates for 2009-10 has also been set out. The
analysis focuses on three major categories which
can be broadly classified as: (i) deficit indicators;
(ii) revenue augmentation; and (iii) expenditure
management. Most of the fiscal indicators are
expressed in terms of GSDP6 at current prices as
provided by the Central Statistical Organization
(CSO). State-wise GSDP data were not available
for three States for 2007-08, eight States for 2008-09
and ten States for 2009-10; GSDP for these States
have been worked out on the basis of the respective
average GSDP growth rates for the previous three
years. States are segregated into non-special
category and special category States. Data with
regard to two Union Territories with Legislature,
viz., NCT Delhi and Puducherry, are also provided
in the tables as a memo item. The detailed Statewise
data on various fiscal indicators are set out in
Statements 1 to 57.
4.2 With regard to the fiscal performance, both the Central and State governments have been able
to significantly reduce their fiscal and revenue deficits in recent years. The States’ finances
recorded a significant improvement and seemed
to have an edge over the Central Government as
far as the process of fiscal correction and
consolidation is concerned. However, the process
of fiscal correction and consolidation suffered some
setback on account of the economic slowdown in
2008-09 and 2009-10. The impact of the economic
slowdown on State finances appears to vary across
States. As per an analysis of the State-wise budgets
for 2009-10, some States have proposed to cross
their targets of key fiscal indicators while others
are expected to stick to their FRL targets. Against
this backdrop, this Chapter attempts a State-wise
analysis to examine the impact of the economic
slowdown on their fiscal position. The focus of the
Chapter is to undertake an inter-temporal
comparison of States in terms of key fiscal indicators
with reference to the targets prescribed by the TwFC.
2. Deficit Indicators of the State Governments
4.3 This Chapter analyses the State-wise
movement of key deficit indicators, viz., Revenue
Deficit (RD), Gross Fiscal Deficit (GFD) and Primary
Deficit (PD) during the period 2005-08 (Average)
to 2008-09 (RE). State-wise progress during this
period is presented in Table IV.1 (also see
Statements 1 to 5).
Table IV.1: Deficit Indicators of State Governments |
(Per cent) |
State |
2005-08 (Avg.) |
2008-09 (RE) |
RD/ GSDP |
GFD/ GSDP |
PD/ GSDP |
PRB/ GSDP |
RD/ GSDP |
GFD/ GSDP |
PD/ GSDP |
PRB/ GSDP |
1 |
2 |
3 |
4 |
5 |
6 |
7 |
8 |
9 |
I. |
Non-Special Category |
|
|
|
|
|
|
|
|
|
1. |
Andhra Pradesh |
-0.4 |
2.8 |
0.1 |
-3.1 |
-0.6 |
2.8 |
0.6 |
-2.8 |
|
2. |
Bihar |
-2.2 |
3.1 |
-0.7 |
-6.0 |
-3.0 |
6.5 |
3.2 |
-6.3 |
|
3. |
Chhattisgarh |
-3.9 |
0.3 |
-1.5 |
-5.7 |
-1.3 |
2.8 |
1.4 |
-2.7 |
|
4. |
Goa |
-0.6 |
3.6 |
0.8 |
-3.4 |
-0.4 |
4.5 |
1.8 |
-3.2 |
|
5. |
Gujarat |
-0.4 |
2.2 |
-0.4 |
-3.1 |
-0.1 |
2.9 |
0.7 |
-2.3 |
|
6. |
Haryana |
-1.3 |
0.1 |
-1.7 |
-3.0 |
- |
2.0 |
0.7 |
-1.3 |
|
7. |
Jharkhand |
2.2 |
8.8 |
7.0 |
0.4 |
-0.8 |
4.9 |
2.1 |
-3.6 |
|
8. |
Karnataka |
-1.6 |
2.2 |
0.2 |
-3.7 |
-0.3 |
3.5 |
1.7 |
-2.1 |
|
9. |
Kerala |
2.2 |
3.3 |
0.4 |
-0.7 |
2.0 |
3.5 |
0.8 |
-0.6 |
|
10. |
Madhya Pradesh |
-2.1 |
2.7 |
-0.3 |
-5.0 |
-2.0 |
3.5 |
0.6 |
-4.9 |
|
11. |
Maharashtra |
-0.6 |
1.9 |
-0.2 |
-2.8 |
-0.6 |
2.3 |
0.6 |
-2.4 |
|
12. |
Orissa |
-2.3 |
-0.6 |
-4.3 |
-6.0 |
-0.6 |
2.1 |
-1.4 |
-4.2 |
|
13. |
Punjab |
1.8 |
3.1 |
-0.2 |
-1.6 |
2.5 |
4.5 |
1.3 |
-0.7 |
|
14. |
Rajasthan |
-0.3 |
2.9 |
-0.9 |
-4.1 |
0.1 |
3.4 |
0.2 |
-3.1 |
|
15. |
Tamil Nadu |
-1.1 |
1.2 |
-0.8 |
-3.1 |
- |
2.7 |
0.9 |
-1.7 |
|
16. |
Uttar Pradesh |
-0.7 |
3.6 |
0.3 |
-4.0 |
-1.1 |
5.3 |
2.4 |
-4.0 |
|
17. |
West Bengal |
3.0 |
4.1 |
- |
-1.0 |
3.7 |
3.7 |
0.1 |
0.1 |
II. |
Special Category |
|
|
|
|
|
|
|
|
|
1. |
Arunachal Pradesh |
-15.6 |
1.7 |
-3.3 |
-20.6 |
-18.6 |
24.5 |
19.0 |
-24.1 |
|
2. |
Assam |
-3.2 |
-1.0 |
-3.3 |
-5.6 |
-2.4 |
2.8 |
0.3 |
-4.9 |
|
3. |
Himachal Pradesh |
-1.2 |
2.6 |
-3.2 |
-7.0 |
-0.9 |
5.0 |
-0.1 |
-6.0 |
|
4. |
Jammu and Kashmir |
-6.8 |
6.4 |
1.3 |
-11.9 |
-9.7 |
6.7 |
2.1 |
-14.3 |
|
5. |
Manipur |
-12.6 |
4.2 |
-1.0 |
-17.7 |
-18.4 |
7.7 |
2.6 |
-23.5 |
|
6. |
Meghalaya |
-2.3 |
2.2 |
-0.6 |
-5.1 |
-6.2 |
1.5 |
-1.3 |
-9.0 |
|
7. |
Mizoram |
-4.9 |
10.9 |
4.0 |
-11.8 |
-6.5 |
10.1 |
3.9 |
-12.8 |
|
8. |
Nagaland |
-6.1 |
4.5 |
0.3 |
-10.3 |
-4.5 |
8.9 |
4.8 |
-8.6 |
|
9. |
Sikkim |
-12.2 |
5.2 |
-0.2 |
-17.6 |
-22.1 |
12.9 |
7.6 |
-27.4 |
|
10. |
Tripura |
-7.7 |
- |
-3.7 |
-11.4 |
-6.0 |
6.1 |
2.9 |
-9.2 |
|
11. |
Uttarakhand |
-1.5 |
5.0 |
1.9 |
-4.6 |
-1.5 |
3.9 |
0.7 |
-4.7 |
All States# |
-0.4 |
1.9 |
-0.2 |
-2.6 |
-0.2 |
2.6 |
0.7 |
-2.1 |
Memo Item: |
|
|
|
|
|
|
|
|
|
1. |
NCT Delhi |
-3.7 |
0.5 |
-1.2 |
-5.4 |
-2.2 |
2.5 |
1.0 |
-3.7 |
|
2. |
Puducherry |
0.4 |
4.7 |
2.0 |
-2.3 |
7.6 |
11.8 |
9.0 |
4.8 |
Avg. : Average. RE : Revised Estimates.
RD : Revenue Deficit. GFD : Gross Fiscal Deficit.
PD : Primary Deficit. PRB : Primary Revenue Balance.
GSDP : Gross State Domestic Product.
# : Data for All States are as per cent to GDP.
Note : Negative (-) sign indicates surplus .
Source : Based on Budget Documents of the State Governments. |
Non-Special Category States
4.4 Adoption of a rule based fiscal correction and
consolidation process has provided the impetus to
State governments in the process of attaining fiscal
sustainability. The enactment of FRLs by all the State governments (except Sikkim and West Bengal)
ensures fiscal stability, sustainability and improved
efficiency and transparency in the management of
public finances, besides enhancing the availability
of resources and removing the impediments in the
effective conduct of fiscal policy and prudent debt management for improving social and physical
infrastructure and human development in the States.
One of the major objectives of the FRLs of various
State governments is to affect a shift in the
composition of total expenditure by increasing the
share of capital expenditure that will help to achieve
a higher growth trajectory. Progress in fiscal
consolidation and implementation of FRL targets was
found to be satisfactory. In addition to prescribing
targets on various fiscal parameters, FRLs also
envisaged to enhance transparency in budgetary
operations by providing the Medium Term Fiscal
Plans of the States. However, there still exist a
number of issues with regard to fiscal transparency
at the State level (Box IV.1).
4.5 Suggesting the restructuring of public
finance at the State level, the TwFC had
recommended that the States achieve revenue
balance by 2008-09 and reduce GFD to 3 per cent
of GSDP by 2009-10. Most of the States were
following the fiscal reform path until 2007-08.
During 2008-09, State-wise performance with
regard to key deficit indicators deteriorated
somewhat as their level of revenue surplus declined
as compared with recent past. However, the
revenue deficit (RD)-GSDP ratio in most of the
States was well within the target of zero revenue
balance. Out of seventeen non-special category
States, thirteen States recorded revenue surplus
in 2008-09 (RE) albeit at a lower level as compared
with 2005-08 (Average).
4.6 During 2008-09 (RE), four States, viz., West
Bengal, Punjab, Kerala and Rajasthan recorded
revenue deficit. Rajasthan was the new entrant in
the list of revenue deficit States during 2008-09,
while Jharkhand turned from a revenue deficit to a
revenue surplus State. West Bengal, Kerala and
Punjab remained revenue deficit States during the
period. However, Kerala and Punjab albeit
continued to be in deficit but recorded a decline in
their revenue deficits.
4.7 The level of revenue surplus as a ratio to
GSDP declined sharply in the case of Chhattisgarh
(2.6 per cent), Orissa (1.7 per cent), Karnataka (1.4
per cent) and Haryana (1.2 per cent) in 2008-09(RE) as compared with 2005-08 (Average).
Notwithstanding the slowdown, Jharkhand,
followed by Bihar and Uttar Pradesh witnessed a
noticeable improvement in their RD-GSDP ratio in
2008-09 (RE) over 2005-08 (Average) (Table IV.1
and Statement 2).
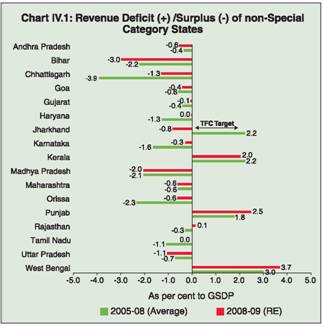
4.8 During 2008-09, Bihar registered the
highest revenue surplus of 3.0 per cent of GSDP,
followed by Madhya Pradesh (2.0 per cent of
GSDP), Chhattisgarh (1.3 per cent of GSDP) and
Uttar Pradesh (1.1 per cent of GSDP) (Chart IV.1).
The revenue surplus of higher order in these States
would help them to finance their investment projects
without accelerating their outstanding liabilities. On
the other hand, West Bengal registered the highest
revenue deficit of 3.7 per cent of GSDP, followed
by Punjab (2.5 per cent of GSDP) and Kerala (2.0
per cent of GSDP) in 2008-09 (RE). RD formed a
significant portion of GFD in these States,
especially in West Bengal (99.9 per cent), followed
by Kerala (59.1 per cent) and Punjab (55.6 per
cent). Ideally, the borrowings should be utilised to
generate assets to ensure income for the State
governments. However, the perpetual deficit in the
revenue account compelled these State
governments to divert the funds from capital
account to finance revenue deficit. However, during
the recent years there have been sincere efforts
by States to reduce their revenue deficits. The
reduction in the level of borrowings to meet the
revenue deficit has created fiscal space for the
State governments to enhance expenditure on
developmental activities. However, the
implementation of the Sixth Central/State Pay
Commission during 2008-09 and 2009-10 may put
pressure on some State governments as revenue
deficit will pre-empt borrowed funds for revenue
expenditure (Table IV.1 and Statements 4 and 5).
4.9 During 2009-10, Tamil Nadu, Jharkhand,
Rajasthan, Maharashtra, Gujarat, Kerala, Goa,
Haryana, Orissa, Punjab and West Bengal will not
be able to meet the target of revenue balance on
account of the impact of revised pays and pensions,
higher need for public spending and a decrease in
the flow of revenue receipts in view of the economic slowdown.
Box IV.1: Fiscal Transparency in State Budgets
Enhanced fiscal transparency leads to sound economic
management and effective policy formulation, strengthens
accountability of the budgetary policies and enhances credibility.
The recent turmoil in the financial markets has brought to the fore
the importance of enhanced transparency and disclosure of
information. In this regard, fiscal transparency at the State
government level is very crucial on account of States’ increased
reliance on market borrowings for financing their GFD. Thus, in
order to attract investments, more information is needed by the
investors to base their appropriate investment decisions.
Furthermore, improved transparency and disclosure would help the
credit rating agencies to develop a credible credit rating system.
Even though the level of fiscal transparency in the State budgets
has increased in recent years, particularly during the post-FRL
period, there are still a range of transparency issues that need to
be addressed. The issues of fiscal transparency may be classified
into three broad areas:, viz., lack of availability of information,
inconsistency in the available information and lack of uniformity in
data reporting across the States. A related issue in the context of a
number of variables is the mismatch of data provided by the State
governments, the Union Government, the Controller General of
Accounts (CGA) and the Comptroller and Auditor General (CAG)
on a number of common fiscal variables.
Lack of Information in the State Governments Budget
Documents
Budget documents of the State governments do not provide
information on GFD financing with a detailed break-up. This
information is important to understand how the State governments
are financing their resource gaps. A few State governments viz.,
Arunachal Pradesh and Jammu and Kashmir do not provide
detailed information on ‘Discharge of Internal Debt’ in their budgets.
This makes it difficult to compile information on item-wise net
borrowings of State governments and present a true picture of their
GFD financing pattern. Many of the State governments do not
publish data on outstanding liabilities in their budget documents.
Some of the State governments publish this information in their
budget documents, but not in the detailed format prescribed by the
Working Group on the Methodology and Compilation of the State
Government Liabilities. Budget documents of most of the State
governments lack information on: i) wages and salaries; ii)
operations and maintenance, iii) subsidies; and iv) interest rates
and maturity profile of negotiated loans. There is vast divergence
in terms of presentation of facts and figures stated in the budget
documents across States. For instance, West Bengal, Nagaland,
Kerala, Manipur (for the Accounts year) and Tamil Nadu do not
provide code-wise and Plan/non-Plan-wise summary of all grants
in their Annual Financial Statements (AFS) while the same is
available in budget documents of Andhra Pradesh, Arunachal
Pradesh, Chhattisgarh, Haryana, Jammu and Kashmir, Madhya
Pradesh, Manipur, Punjab, Rajasthan, Sikkim, Tripura, Uttarakhand
and Uttar Pradesh. Similarly, some State governments do not
provide detailed code-wise summary of internal debt (Code 6003)
from all the demands and interest payments (Code 2049) in a single
budget document as is the practice followed by other State
governments. While a break-up of interest payments is not available
in budget documents of Arunachal Pradesh, interest payments on
NSSF are not available for Andhra Pradesh and Himachal Pradesh
(except Accounts years). Further, details of off-budget borrowings,
if any, are not disclosed in the budget documents. The present status of the disclosure of information by State governments is
presented in Table 1.
Present Status - Disclosure of information by the State Governments# |
S. No States |
Information available on web |
Budget at a Glance |
Outstanding Liabilities |
Outstanding Guarantees |
Non-SpecialCategory States |
|
|
|
|
1. |
Andhra Pradesh |
√ |
√ |
√^ |
√$ |
2. |
Bihar |
√ |
√ |
– |
√$ |
3. |
Chhattisgarh |
√ |
√ |
√ |
√ |
4. |
Goa |
√ |
√ |
^^ |
– |
5. |
Gujarat |
√ |
√ |
– |
– |
6. |
Haryana |
√ |
√ |
√ |
√ |
7. |
Jharkhand |
√ |
X |
– |
– |
8. |
Karnataka |
√ |
√ |
^^ |
√$ |
9. |
Kerala |
√ |
√ |
^^ |
√$ |
10. |
Madhya Pradesh |
√ |
√ |
√ |
√ |
11. |
Maharashtra |
√ |
√ |
√ |
√ |
12. |
Orissa |
√ |
√ |
– |
– |
13. |
Punjab |
√ |
√ |
^^ |
√$ |
14. |
Rajasthan |
√ |
√ |
√ |
√ |
15. |
Tamil Nadu |
√ |
√ |
√ |
√ |
16. |
Uttar Pradesh |
√ |
√ |
^^ |
√$ |
17. |
West Bengal |
√ |
√ |
– |
– |
Special Category States |
1. |
Arunachal Pradesh |
X |
√ |
– |
– |
2. |
Assam |
X |
√ |
– |
√ |
3. |
Himachal Pradesh |
√ |
X |
^^ |
√$ |
4. |
Jammu and Kashmir |
√ |
√ |
– |
– |
5. |
Manipur |
√ |
√ |
– |
– |
6. |
Meghalaya |
√ |
√ |
√ |
– |
7. |
Mizoram |
√ |
√ |
√ |
√ |
8. |
Nagaland |
√ |
√ |
√ |
√ |
9. |
Sikkim |
√ |
√ |
– |
– |
10. |
Tripura |
√ |
√
|
√ |
√ |
11. |
Uttarakhand |
√ |
√ |
– |
√$ |
# : As on February 11, 2010. ‘–’ : Not available.
√^ : Not as per the prescribed format suggested by the Working Group
on State Governments Liabilities. √$ : Not as per the prescribed format suggested by the Working Group
to assess the fiscal risk of State Government Guarantees.
Source: Budget documents of the State Governments. |
Inconsistency in Available Information
In many of the State budgets a change in cash balance does not
match with the difference between total expenditure and total receipts
of all three accounts, viz., consolidated fund, contingency fund and
public account (overall surplus/deficit). Wide discrepancies have been
observed in data provided in the Annual Financial Statement (AFS), ‘Budget at a Glance’ and details of receipts and expenditure
documents, which impedes data reconciliation and uniformity.
Lack of Uniformity in Data Reporting
Except for the Annual Financial Statement there is no uniformity in
the nature and contents of the documents presented across the States. ‘Budget at a Glance’ published by the State governments
do not have a uniform format across States. One of the important
issues at the State government level relates to lack of uniformity in
the accounting practices. One example is the accounting of power
bonds in the budget, where States have been following diverse
practices. Some states like Himachal Pradesh provide power bonds
under loans from other institutions (Code 6003(109)) while States
like Uttarakhand provide power bonds under market loans (Code
6003(101)) and some other States such as Bihar, Chhattisgarh
and Haryana provide power bonds under compensation and other
bonds (Code 6003(106)). Another example is the accounting of
loans from NSSF. After the change in accounting practice in 1999-
2000, the securities issued to NSSF were to be shown under internal
debt. However, Assam, Goa, Rajasthan and West Bengal continue
to show a part of the repayments/payments on account of small
savings collections under loans and advances from the Central
Government (Code 6004-102) whereas Andhra Pradesh shows the
entire transactions of NSSF under public account (Code 8007).
Accounting of debt relief in the budget is unclear. In Andhra
Pradesh, debt relief is accounted under Miscellaneous Capital
Receipts (Code – 4000-01-800-06).The accounting practice
regarding sale of land and property is also not uniform. For example,
in the Andhra Pradesh budget, sale of land and property is included
under Miscellaneous General Services (Code – 0075-105-01) while
Karnataka covers the same under Miscellaneous Capital Receipts
(Code – 4000-01-800-01). Himachal Pradesh and Maharashtra
reports data on VAT collection under two different codes, i.e., 0040-800 (other receipts) and 0040-102 respectively, while other
States reported this figure under the code 0040-110 (trade tax).
Mismatch of Data Published by Different Organisations
Data on share in Central taxes and grants-in-aid as per the State
budgets and the Union Budget do not match. Further, the data on
securities issued to NSSF budgeted in the State budgets are at
variance from the figures available in the Union Budget and the figures
available with the Ministry of Finance. Data on loans to the State
governments as per the Union Finance Accounts, the CAG Report,
State budgets and the figures available in the Union Budget do not
match. With regard to market borrowings of the State governments,
the figure budgeted in the State budgets and the figures as per the
RBI record do not match.
All these issues pose serious problems in the compilation of a
consolidated fiscal position of State governments. Some of these
transparency issues at the State government level have also been
discussed in the Report of Committee on Financial Sector
Assessment (Chairman: Dr. Rakesh Mohan) released in March 2009.
References:
1. Budget Documents of State Governments.
2. Reserve Bank of India (2009), ‘Report of the Committee on
Financial Sector Assessment’, March 2009.
 |
4.10 The Central Government allowed the States
to raise additional market borrowings to the extent
of 0.5 per cent of GSDP in 2008-09 for undertaking
capital investments thereby permitting the GFDGSDP
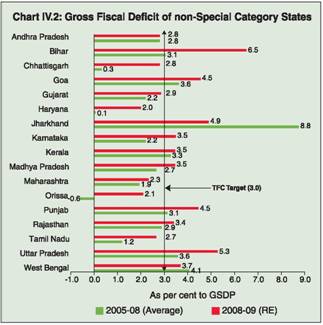
ratio to the level of 3.5 per cent. In 2008-09 (RE), only seven States viz., Haryana, Orissa,
Maharashtra, Tamil Nadu, Chhattisgarh, Andhra
Pradesh and Gujarat could adhere to the TwFC
target of reducing the GFD-GSDP ratio to 3.0 per
cent, as compared to ten States in 2005-08
(Average). The GFD-GSDP ratio has increased to
more than 3.0 per cent in case of ten States such
as Bihar, Uttar Pradesh, Jharkhand, Goa, Punjab,
West Bengal, Karnataka, Kerala, Madhya Pradesh
and Rajasthan in 2008-09 (RE). Barring Jharkhand
and West Bengal, all the non-special category
States registered an increase in the GFD-GSDP
ratio in 2008-09 (RE) as compared with 2005-08
(Average). However, the position of Andhra
Pradesh remained the same at 2.8 per cent of
GSDP during the period. Among the States which
have witnessed an increase in the GFD-GSDP ratio
over the same period, Bihar, Orissa, Chhattisgarh,
Haryana and Uttar Pradesh registered the highest
increase. Bihar registered the highest GFD-GSDP
ratio of 6.5 per cent of GSDP in 2008-09 (RE),
followed by Uttar Pradesh (5.3 per cent of GSDP)
and Jharkhand (4.9 per cent of GSDP) (Chart IV.2)
(Table IV.1).
 |
4.11 With the global melt-down in economic
activities, there is an increasing need for the revival
of the growth momentum through increased public
investment and Plan expenditure, especially capital
outlay. The Central Government allowed the States
a GFD-GSDP ratio to the level of 4.0 per cent in
2009-10. GFD is estimated to exceed 3 per cent of
GSDP during 2009-10 (BE) in States like
Maharashtra, Madhya Pradesh, Andhra Pradesh,
Rajasthan, Haryana, Orissa, Jharkhand, Uttar
Pradesh, Punjab, West Bengal and Goa. However,
despite the slowing down of revenue and the need
for increased expenditure on account of the
economic slowdown, States like Kerala, Bihar,
Karnataka, Chhattisgarh, Gujarat and Tamil Nadu have been successful in limiting their fiscal deficit
within the TwFC target of 3.0 per cent of their GSDP
during 2009-10.
4.12 In 2008-09 (RE), all the non-special
category States (except West Bengal) recorded
primary revenue surplus (PRS). However, the coexistence
of PRS and RD in the three States, viz.,
Kerala, Punjab and Rajasthan implies that PRS is
not enough to finance the interest payment
obligations in these States in 2008-09 (RE). PRS
financed 21.5 per cent, 22.6 per cent and 95.5 per
cent of interest payments in Punjab, Kerala and
Rajasthan respectively in 2008-09 (RE) (Chart IV.3).
4.13 Out of the seventeen non-special category
States, only Orissa recorded primary surplus in
2008-09 (RE) as compared to ten States in 2005-
08 (Average). In 2008-09, Bihar registered the
highest primary deficit of 3.2 per cent of GSDP,
followed by Uttar Pradesh (2.4 per cent) and
Jharkhand (2.1 per cent) (Table IV.1).
Special Category States
4.14 Special category States deserve special
attention as the development efforts in these States
remain mainly dependent upon transfers from the
Central Government. Given the lack of private
investments, low level of education and health,
infrastructure bottlenecks and lack of PPP for
infrastructure development, State government have
to undertake high levels of public investment. This
is reflected in the fact that these States are in
revenue surplus coupled with very high levels of GFD as compared to the non-special category
States. The process of fiscal correction that took
place in special category States was largely on
account of higher devolution and transfers from the
Centre and the incentive based reform process
initiated by TwFC. The special category States have
initiated a number of measures to institutionalise
the path of fiscal correction. Measures such as
rationalisation of the tax structure, ceiling on
guarantees, introduction of VAT and new pension
schemes have led to better fiscal management.
4.15 During 2008-09 (RE) all the eleven special
category States registered revenue surplus. Despite
the slowdown, six States, viz., Sikkim, Manipur,
Meghalaya, Arunachal Pradesh, Jammu and Kashmir
and Mizoram registered an increase in revenue
surplus over 2005-08 (Average). Sikkim registered
the highest revenue surplus of 22.1 per cent of GSDP
in 2008-09 (RE), followed by Arunachal Pradesh (18.6
per cent), Manipur (18.4 per cent) and Jammu and
Kashmir (9.7 per cent). Other special category States,
viz., Tripura, Nagaland, Assam and Himachal
Pradesh, however, remain in revenue surplus
although at a lower level as compared with 2005-08
(Average) (Table IV.1 and Chart IV.4).
.4.16 During 2009-10, three special category
States have budgeted revenue deficits. Among
these, the revenue deficit as percentage to GSDP is budgeted to be the highest in Arunachal Pradesh
(7.6 per cent), followed by Assam (7.3 per cent)
and Uttarakhand (0.5 per cent).
4.17 In contrast to the improvement observed in
terms of revenue account correction, the special
category States are far behind the non-special
category States with regard to correction in GFD.
In 2008-09 (RE), except Meghalaya and Assam,
all other special category States recorded a GFDGSDP
ratio of more than 3 per cent (Chart IV.5).
Among the eleven special category States, eight
States recorded a higher GFD-GSDP ratio during
2008-09 (RE) as compared with their respective
positions during 2005-08 (Average). Arunachal
Pradesh registered the highest GFD-GSDP ratio
of 24.5 per cent followed by Sikkim (12.9 per cent)
and Mizoram (10.1 per cent). All these States,
except Assam and Meghalaya, are still far away
from the TwFC target of a GFD-GSDP of 3 per cent.
However, the co-existence of large revenue surplus
and large GFD indicates that borrowings are
directed towards capital outlay (Table IV.1). During
2009-10 (BE), in all the special category States, deficit
indicators are likely to remain at an elevated level.
4.18 In 2008-09 (RE), all the special category
States recorded primary revenue surplus. In all
special category States, the primary revenue surplus
is enough to meet interest payments (Chart IV.6).
However, as many as nine States recorded primary
deficit in 2008-09 (RE) as compared with four
States in 2005-08 (Average) (Table IV.1).
3. Revenue Account of the State Governments
4.19 The focus of State governments’ taxation
policy has been on streamlining the tax structure and
better tax administration for better tax compliance and
greater transparency. Measures towards
simplification, rationalisation and modernisation of the
tax administration with IT intervention and
strengthening enforcement measures have been
initiated by various State governments. Financial
delegation of certain taxation powers by some of the
State governments to the local bodies has led to better
resource mobilisation. A number of States propose
to undertake steps to further increase collections from
VAT, excise and other tax and non-tax sources
through rationalisation, better tax compliance and by
strengthening the enforcement machinery. In this
Chapter the focus is to evaluate both the
augmentation of receipts and expenditure
management measures in order to understand the
process of revenue account correction. Various
indicators pertaining to the revenue receipts of the
State governments are presented in Table IV.2, while
those pertaining to revenue expenditure of the State
governments are set out in Table IV.3.
Non-special Category States
4.20 The taxation policy of State governments is
in general aimed at moderating levels of taxation with emphasis on an efficient and effective tax
administration. The desirable path of fiscal
correction lies through fiscal empowerment, i.e., by
expanding the scope and size of revenue flows into
the budget. In general, State governments’ strategy
for revenue augmentation is through improvement
of the tax administration, facilitation of revenue
buoyancy, minimising of transaction costs and
rationalisation of the tax structure. The focus is on
streamlining and strengthening existing tax and
non-tax collection mechanisms and plugging of
revenue leakages.
Revenue Receipts
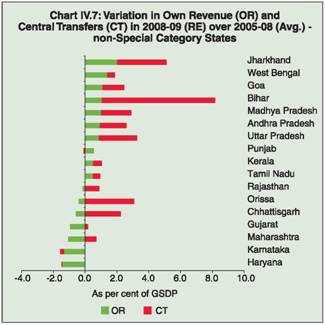
4.21 The total revenue receipts of all the nonspecial
category States increased in 2008-09 (RE)
over 2005-08 (Average) in terms of GSDP except
Karnataka, Haryana, Gujarat and Maharashtra.
However, in a majority of the States the increase
is more due to Central transfers and less due to
their own efforts. Only West Bengal is the
exception, where the increase is more due to own
efforts and less due to Central transfers. In some
States such as Haryana, Karnataka, Maharashtra,
Gujarat, Chhattisgarh, Orissa and Rajasthan own
revenue collections (as per cent to GSDP)
decreased in 2008-09 (RE) over 2005-08
(Average). Jharkhand recorded the highest
improvement in own revenue effort in 2008-09 (RE)
over 2005-08 (Average), followed by West Bengal,
Goa, Bihar and Madhya Pradesh (Table IV.2 and
Chart IV.7).
Table IV.2: Revenue Receipts of the State Governments |
(Per cent) |
State |
2005-08 (Avg.) |
2008-09 (RE) |
RR/ GSDP |
OTR/ GSDP |
ONTR/ GSDP |
CT/ GSDP |
RR/ GSDP |
OTR/ GSDP |
ONTR/ GSDP |
CT/ GSDP |
1 |
2 |
3 |
4 |
5 |
6 |
7 |
|
8 |
I. |
Non-Special Category |
|
|
|
|
|
|
|
|
1. |
Andhra Pradesh |
16.2 |
8.7 |
2.2 |
5.2 |
18.8 |
9.6 |
2.3 |
6.9 |
2. |
Bihar |
23.4 |
4.3 |
0.5 |
18.5 |
31.6 |
5.5 |
0.4 |
25.7 |
3. |
Chhattisgarh |
19.2 |
8.3 |
2.6 |
8.2 |
20.8 |
7.9 |
2.5 |
10.5 |
4. |
Goa |
16.9 |
8.2 |
5.9 |
2.7 |
19.3 |
8.8 |
6.4 |
4.1 |
5. |
Gujarat |
11.7 |
7.2 |
1.7 |
2.9 |
11.0 |
6.7 |
1.2 |
3.1 |
6. |
Haryana |
13.2 |
8.2 |
3.1 |
2.0 |
11.7 |
7.7 |
2.1 |
2.0 |
7. |
Jharkhand |
15.9 |
5.1 |
2.4 |
8.4 |
21.0 |
6.6 |
2.9 |
11.5 |
8. |
Karnataka |
17.5 |
10.9 |
1.9 |
4.8 |
16.0 |
10.7 |
0.7 |
4.5 |
9. |
Kerala |
12.7 |
8.2 |
0.7 |
3.7 |
13.7 |
8.7 |
0.7 |
4.3 |
10. |
Madhya Pradesh |
19.6 |
8.1 |
1.9 |
9.6 |
22.5 |
9.0 |
2.0 |
11.5 |
11. |
Maharashtra |
12.2 |
7.9 |
1.9 |
2.5 |
11.9 |
7.2 |
1.5 |
3.2 |
12. |
Orissa |
19.3 |
6.4 |
2.4 |
10.4 |
21.9 |
6.3 |
2.1 |
13.5 |
13. |
Punjab |
14.5 |
7.6 |
3.7 |
3.1 |
14.9 |
7.5 |
4.4 |
3.0 |
14. |
Rajasthan |
17.2 |
7.8 |
2.3 |
7.1 |
17.9 |
7.9 |
2.0 |
8.0 |
15. |
Tamil Nadu |
14.9 |
9.9 |
1.1 |
3.9 |
15.9 |
9.9 |
1.6 |
4.4 |
16. |
Uttar Pradesh |
18.6 |
7.2 |
1.6 |
9.8 |
21.9 |
7.5 |
2.1 |
12.2 |
17. |
West Bengal |
10.0 |
4.4 |
0.5 |
5.1 |
11.9 |
4.7 |
1.6 |
5.6 |
II. |
Special Category |
|
|
|
|
|
|
|
|
1. |
Arunachal Pradesh |
73.7 |
2.4 |
11.2 |
60.2 |
88.8 |
2.4 |
7.3 |
79.1 |
2. |
Assam |
21.3 |
5.3 |
2.8 |
13.2 |
30.1 |
5.2 |
2.9 |
22.0 |
3. |
Himachal Pradesh |
27.1 |
5.9 |
4.3 |
16.9 |
27.2 |
6.2 |
3.9 |
17.1 |
4. |
Jammu and Kashmir |
42.8 |
6.7 |
2.6 |
33.5 |
45.4 |
7.7 |
3.2 |
34.5 |
5. |
Manipur |
54.2 |
2.2 |
2.6 |
49.4 |
64.3 |
2.6 |
3.2 |
58.5 |
6. |
Meghalaya |
30.2 |
4.2 |
2.5 |
23.5 |
44.2 |
4.6 |
2.4 |
37.2 |
7. |
Mizoram |
62.7 |
2.2 |
4.3 |
56.3 |
73.8 |
2.6 |
4.4 |
66.8 |
8. |
Nagaland |
41.7 |
1.9 |
1.6 |
38.2 |
42.5 |
1.8 |
2.0 |
38.6 |
9. |
Sikkim |
108.1 |
8.3 |
55.5 |
44.3 |
111.1 |
6.0 |
44.4 |
60.7 |
10. |
Tripura |
32.5 |
3.3 |
0.9 |
28.4 |
34.1 |
3.7 |
1.1 |
29.3 |
11. |
Uttarakhand |
22.7 |
7.7 |
2.2 |
12.9 |
21.8 |
7.6 |
1.6 |
12.6 |
All States# |
12.2 |
5.8 |
1.4 |
5.0 |
13.2 |
5.9 |
1.4 |
5.9 |
Memo Item: |
|
|
|
|
|
|
|
|
1. |
NCT Delhi |
10.1 |
8.2 |
1.3 |
0.6 |
9.6 |
7.5 |
1.3 |
0.8 |
2. |
Puducherry |
27.2 |
7.9 |
7.9 |
11.4 |
25.8 |
7.7 |
6.2 |
11.9 |
Avg. : Average. RE : Revised Estimates.
RR : Revenue Receipts. OTR : Own Tax Revenue.
ONTR : Own Non-Tax Revenue. CT : Current Transfers.
GSDP : Gross State Domestic Product.
# : Data for All States are as per cent to GDP.
Source: Based on Budget Documents of the State Governments. |
4.22 Bihar registered the highest revenue receipts
(RR)-GSDP ratio of 31.6 per cent in 2008-09 (RE),
mainly backed by the highest current transfers (CT)-
GSDP ratio. Bihar was followed by Madhya Pradesh
(22.5 per cent), Orissa (21.9 per cent), Uttar Pradesh (21.9 per cent), Jharkhand (21.0 per cent) and
Chhattisgarh (20.8 per cent). In all these States,
Central transfers contributed significantly to the
improvement in revenue receipts (Table IV.2 and
Statements 22, 23 and 25).
Table IV.3: Revenue Expenditure of the State Governments |
(Per cent) |
State |
2005-08 (Avg.) |
2008-09 (RE) |
RE/ GSDP |
DRE/ GSDP |
NDRE/ GSDP |
IP/ GSDP |
PN/ GSDP |
RE/ GSDP |
DRE/ GSDP |
NDRE/ GSDP |
IP/ GSDP |
PN/ GSDP |
1 |
2 |
3 |
4 |
5 |
6 |
7 |
8 |
9 |
10 |
11 |
I. |
Non-Special Category |
|
|
|
|
|
|
|
|
|
|
1. |
Andhra Pradesh |
15.8 |
10.0 |
5.7 |
2.7 |
1.5 |
18.2 |
12.9 |
5.2 |
2.2 |
1.5 |
2. |
Bihar |
21.2 |
12.0 |
9.1 |
3.7 |
2.7 |
28.6 |
18.7 |
9.9 |
3.3 |
3.0 |
3. |
Chhattisgarh |
15.3 |
10.1 |
4.4 |
1.8 |
1.0 |
19.5 |
14.0 |
4.9 |
1.4 |
1.1 |
4. |
Goa |
16.3 |
11.1 |
5.2 |
2.8 |
1.0 |
18.9 |
12.9 |
6.0 |
2.8 |
1.4 |
5. |
Gujarat |
11.3 |
6.5 |
4.8 |
2.7 |
1.0 |
10.9 |
7.0 |
3.8 |
2.2 |
0.8 |
6. |
Haryana |
12.0 |
7.9 |
3.8 |
1.7 |
0.9 |
11.7 |
8.3 |
3.3 |
1.3 |
0.9 |
7. |
Jharkhand |
18.2 |
11.9 |
6.2 |
1.8 |
1.2 |
20.2 |
12.9 |
7.2 |
2.8 |
1.5 |
8. |
Karnataka |
15.9 |
10.1 |
5.1 |
2.0 |
1.3 |
15.7 |
9.6 |
5.2 |
1.8 |
1.6 |
9. |
Kerala |
14.9 |
6.9 |
7.1 |
2.9 |
2.5 |
15.8 |
7.5 |
7.1 |
2.6 |
2.6 |
10. |
Madhya Pradesh |
17.6 |
10.0 |
6.5 |
3.0 |
1.4 |
20.5 |
12.4 |
7.0 |
2.9 |
1.7 |
11. |
Maharashtra |
11.6 |
6.8 |
4.6 |
2.2 |
0.7 |
11.3 |
7.2 |
3.9 |
1.8 |
0.7 |
12. |
Orissa |
16.9 |
8.8 |
7.8 |
3.7 |
1.7 |
21.3 |
13.3 |
7.7 |
3.5 |
2.3 |
13. |
Punjab |
16.2 |
6.8 |
9.2 |
3.4 |
1.6 |
17.4 |
7.7 |
9.1 |
3.2 |
1.6 |
14. |
Rajasthan |
16.9 |
10.1 |
6.7 |
3.8 |
1.4 |
18.1 |
11.0 |
7.0 |
3.3 |
2.0 |
15. |
Tamil Nadu |
13.8 |
7.5 |
5.4 |
2.0 |
1.9 |
15.9 |
9.1 |
5.6 |
1.7 |
2.3 |
16. |
Uttar Pradesh |
17.9 |
9.3 |
7.7 |
3.3 |
1.6 |
20.8 |
12.2 |
7.7 |
2.9 |
1.7 |
17. |
West Bengal |
13.0 |
6.2 |
6.7 |
4.0 |
1.4 |
15.5 |
9.3 |
6.1 |
3.6 |
1.3 |
II. |
Special Category |
|
|
|
|
|
|
|
|
|
|
1. |
Arunachal Pradesh |
58.1 |
41.4 |
6.7 |
5.0 |
2.6 |
70.2 |
50.5 |
19.7 |
5.5 |
3.2 |
2. |
Assam |
18.1 |
11.1 |
7.0 |
2.4 |
1.8 |
27.6 |
16.1 |
9.2 |
2.5 |
2.0 |
3. |
Himachal Pradesh |
25.9 |
14.8 |
1.1 |
5.7 |
2.9 |
26.3 |
15.4 |
10.9 |
5.1 |
3.3 |
4. |
Jammu and Kashmir |
36.0 |
21.0 |
5.0 |
5.1 |
3.2 |
35.8 |
20.4 |
15.4 |
4.6 |
3.3 |
5. |
Manipur |
41.7 |
26.0 |
5.6 |
5.1 |
3.8 |
45.9 |
27.8 |
18.1 |
5.1 |
4.1 |
6. |
Meghalaya |
27.8 |
17.8 |
0.1 |
2.8 |
1.6 |
38.0 |
27.3 |
10.7 |
2.8 |
1.5 |
7. |
Mizoram |
57.8 |
37.8 |
20.0 |
6.9 |
2.9 |
67.2 |
45.3 |
21.9 |
6.3 |
2.9 |
8. |
Nagaland |
35.6 |
19.3 |
16.4 |
4.2 |
3.3 |
37.9 |
20.6 |
17.3 |
4.1 |
3.4 |
9. |
Sikkim |
95.9 |
32.1 |
63.8 |
5.4 |
2.3 |
89.0 |
37.9 |
51.1 |
5.3 |
2.2 |
10. |
Tripura |
24.8 |
12.8 |
1.5 |
3.7 |
2.7 |
28.0 |
15.6 |
11.9 |
3.2 |
3.1 |
11. |
Uttarakhand |
21.2 |
12.7 |
7.7 |
3.1 |
1.8 |
20.3 |
11.3 |
8.3 |
3.2 |
2.1 |
All States# |
11.8 |
6.7 |
4.8 |
2.2 |
1.1 |
13.0 |
8.0 |
4.7 |
1.9 |
1.2 |
Memo Item: |
|
|
|
|
|
|
|
|
|
|
1. |
NCT Delhi |
6.4 |
3.8 |
2.2 |
1.7 |
- |
7.4 |
5.0 |
2.1 |
1.5 |
- |
2. |
Puducherry |
27.6 |
21.1 |
6.4 |
2.7 |
1.4 |
33.4 |
26.1 |
7.2 |
2.8 |
1.8 |
Avg. : Average. RE : Revised Estimates.
RE : Revenue Expenditure. DRE : Development Revenue Expenditure.
NDRE : Non-development Revenue Expenditure. IP : Interest Payment.
PN : Pension. GSDP : Gross State Domestic Product.
# : Data for All States are as per cent to GDP.
Source : Based on Budget Documents of the State Governments. |
4.23 Karnataka registered the highest own tax
revenue (OTR)-GSDP ratio of 10.7 per cent in
2008-09 (RE), followed by Tamil Nadu (9.9 per
cent), Andhra Pradesh (9.6 per cent) and Madhya
Pradesh (9.0 per cent). It may be noted that the
OTR-GSDP ratio of West Bengal (4.7 per cent) was
one of the lowest in the non-special category
States, followed by Bihar (5.5 per cent), Orissa (6.3
per cent) Jharkhand (6.6 per cent) and Gujarat (6.7
per cent) in 2008-09 (RE). These five States are still below the TwFC target of the OTR-GSDP ratio
of 6.8 per cent (Chart IV.8, Table IV.2 and
Statements 18 and 19). State governments like
Bihar need to improve their OTR-GSDP ratio as
their level is quite low as compared to the TwFC
target of 6.8 per cent.
 |
4.24 Own non-tax revenue played a significant role in Goa (ONTR-GSDP of 6.4 per cent) and Jharkhand (ONTR-GSDP of 2.9 per cent) in bringing down the deficit indicators. Some States such as Bihar (ONTR-GSDP of 0.4 per cent), Karnataka (ONTR-GSDP of 0.7 per cent), Kerala (ONTR-GSDP of 0.7 per cent) and Gujarat (ONTR-GSDP of 1.2 per cent) displayed dismal performances in own non-tax revenue efforts and these four States are below the TwFC target of the own non-tax revenue (ONTR)-GSDP ratio of 1.4 per cent (Chart IV.9, Table IV.2 and Statements 20 and 21). It is important to mention here that the expenditure on economic, social and general services by State governments is very high but the recovery from these services is insignificant. This is mainly on account of low cost recovery from publicly provided economic and social services, low profitability of Public Sector Undertakings (PSUs), low interest recovery from local bodies, cooperatives and others.
4.25 During the recent past, tax collections had
increased due to a robust growth of States’
economies and reforms in tax administration.
However, considering the effect of the economic
slowdown on the economy, the same pace of tax
collections may not be achievable during 2009-10.
4.26 The adoption of State level VAT has been
one of the biggest tax reforms undertaken by the
State governments so far. The government intends
to expand the scope of taxation of services not only
by bringing in new services within the tax net but also by increasing the rates of tax and non-tax
revenues. In the long run, this will be beneficial for
State finances. VAT is the most important tax
revenue of the States, contributing almost half of
their total own tax receipts. Despite a slowdown,
all the non-special category States, except Gujarat
and Maharashtra, registered an increase in VAT
collections during 2008-09 (RE) as compared with
2007-08 (Accounts) (Chart IV.10). Andhra Pradesh
registered the highest VAT-GSDP ratio of 6.1 per
cent in 2008-09 (RE), followed by Kerala (5.9 per
cent), Tamil Nadu (5.7 per cent) and Karnataka (5.5
per cent). Other important tax revenues of the
States are state excise, stamps and registration
fees and motor vehicle tax (Statement 49).
4.27 The effect of the slowdown on growth
became perceptible only in the later part of 2008-
09 and its full effect is likely to be seen in 2009-10.
Specifically, the pace of collections under VAT and
stamp duties and registration fees are likely to be
subdued as compared to what was experienced in
recent years.
Revenue Expenditure
4.28 The State governments’ strategy with
regard to revenue expenditure is to control nondevelopment
expenditure, mostly administrative services and debt services expenditure, so as to
enhance development expenditure in social
sectors.
4.29 The total revenue expenditure in terms of
GSDP registered an increase in all the non-special
category States except Gujarat, Haryana,
Karnataka and Maharashtra in 2008-09 (RE) over
2005-08 (Average). Increase in development
revenue expenditure is a major factor behind the
increase in the total revenue expenditure in most
of the States in 2008-09 (RE) over 2005-08
(Average). Non-development revenue expenditure
in the eight States viz., Gujarat, Maharashtra, West
Bengal, Andhra Pradesh, Haryana, Orissa, Kerala
and Punjab came down during the same period,
despite an increasing pressure from salaries and
pension hikes on account of the implementation of
the Sixth Central Pay Commission/ States’ own Pay
Commissions (Table IV.3, Chart IV.11 and
Statements 12 and 13).
4.30 In 2008-09 (RE), Bihar with the highest
development revenue expenditure (DRE)-GSDP
ratio of 18.7 per cent and the highest nondevelopment
revenue expenditure (NDRE)-GSDP
ratio of 9.9 per cent, recorded the highest revised
estimates (RE)-GSDP ratio of 28.6 per cent. Orissa
registered the second highest RE-GSDP ratio of 21.3 per cent, followed by Uttar Pradesh (20.8 per
cent) and Madhya Pradesh (20.5 per cent). The
DRE-GSDP ratio remained relatively higher in
States, viz., Bihar (18.7 per cent), Chhattisgarh
(14.0 per cent), Orissa (13.3 per cent) and Jharkhand
(12.9 per cent). Haryana recorded the lowest NDREGSDP
ratio of 3.3 per cent in 2008-09 (RE). Gujarat
(3.8 per cent), Maharashtra (3.9 per cent) and
Chhattisgarh (4.9 per cent) also displayed
comparatively lower NDRE-GSDP ratios in 2008-
09 (RE). All the States, except West Bengal and
Gujarat, registered an increase in pensions in the
revised estimates of 2008-09 following the
implementation of the Sixth Central Pay
Commission/States’ own Pay Commissions, Bihar
registered the highest increase in pension as a ratio
to GSDP (3.0 per cent), followed by Kerala (2.6
per cent) and Tamil Nadu (2.3 per cent).
4.31 The revision of salaries consequent to the
award of the Sixth Pay Commission has caused
an upward shift in the revenue expenditure
trajectory. Revenue surplus dried up in 2009-10 and
all the States at the consolidated level would be in
deficit of 0.5 per cent of GDP. The immediate task
before State governments is to ensure that ongoing
development and capital work does not get delayed
because of a squeeze on resources. In the
immediate future, this would require additional
revenue mobilisation and also possibly a higher
reliance on borrowings.
4.32 The lowest interest payments (IP)-GSDP
ratio was registered by Haryana (1.3 per cent),
followed by Chhattisgarh (1.4 per cent), Tamil Nadu
(1.7 per cent) and Maharashtra (1.8 per cent) in
2008-09 (RE) (Table IV.3). The IP-GSDP ratio
came down in all the States, except Jharkhand, and
it remained at the previous year’s level in Goa.
4.33 The moderation in the interest payments of
the States reflects the impact of the Debt Swap
Scheme and the Debt Consolidation and Relief
Facility (DCRF) recommended by the Eleventh and
TwFC, respectively. However, it may be noted that
interest payments on special securities issued to
NSSF, which is kept out of the purview of DCRF,
constituted more than half the total interest
payments obligations in a number of States suchas Maharashtra (57.9 per cent) and Gujarat (55.1
per cent), and it accounted for more than 40 per
cent in other States such as West Bengal (49.1 per
cent), Goa (47.4 per cent), Karnataka (45.4 per
cent), Punjab (44.7 per cent), Haryana (44.1 per
cent) and Chhattisgarh (43.3 per cent) in 2008-09
(RE). Further, interest payments on market loans
constituted more than one-fourth of the total interest
payments in some States such as Andhra Pradesh,
Kerala, Goa, Tamil Nadu, Rajasthan and Uttar
Pradesh in 2008-09 (RE). Despite the initiation of
DCRF, interest payment on account of loans from
the Centre is quite high in States such as Orissa
(29.4 per cent), Madhya Pradesh (16.7 per cent),
Karnataka (16.3 per cent) Bihar (16.1 per cent) and
Chhattisgarh (15.7 per cent) in 2008-09 (RE) as
compared to States like Punjab (0.9 per cent),
Maharashtra (5.5 per cent), Haryana (7.0 per cent),
Goa (7.6 per cent) and Tamil Nadu (8.6 per cent)
(Chart IV.12 and Statement 17). As per the
recommendations of the TwFC, the States need
not compulsorily avail of the loan portion of the
Normal Central Assistance.
4.34 In West Bengal, interest payments preempted
30.3 per cent of revenue receipts in 2008-
09 (RE), followed by Punjab (21.2 per cent), Gujarat
(19.9 per cent), Kerala (19.2 per cent), Rajasthan
(18.2 per cent) and Orissa (16.1 per cent). All these non-special category States are yet to achieve the
TwFC target with respect to interest paymentsrevenue
receipts (IP-RR) (15.0 per cent) in 2008-
09 (RE). A higher share of the IP-RR ratio makes
the expenditure management of State governments
less flexible as a bulk of the resources cannot be
used to finance the priority sectors, i.e., social
sector expenditure and development expenditure
(Chart IV.13 and Statements 36 and 37).
Special Category States
4.35 In general, the taxable resource base in
special category States is narrow as the percentage
of BPL families is higher in these States.
Considering this, these State governments have
decided to augment tax collections by expanding
the tax payer base under existing Acts and Rules,
strengthening infrastructure, ensuring better
compliance and making the tax administration more
efficient.
Revenue Receipts
4.36 Similar to the trend observed among the
non-special category States, the total revenue
receipts in terms of GSDP increased in all the
special category States, except Uttarakhand, in
2008-09 (RE) over 2005-08 (Average). The increase in revenue receipts in 2008-09 (RE) in all
the special category States, except Jammu and
Kashmir, was mainly on account of current transfers
rather than their own efforts. Sikkim registered the
highest increase in CT followed by Arunachal
Pradesh, Meghalaya, Mizoram, Assam and
Manipur in 2008-09 (RE) as compared to 2005-08
(Average). During 2008-09 (RE), only Uttarakhand
witnessed a decline in the current transfers (CT)-
GSDP ratio over 2005-08 (Average). This implies
that CT played a significant role in the higher
revenue surplus recorded by the special category
States in 2008-09 (RE) over 2005-08 (Average).
Thus, the fiscal stability of the special category
States is predominantly dependent on Central
transfers (Chart IV.14 and Statements 18-23).
4.37 Sikkim recorded the highest revenue receipts
(RR)-GSDP ratio of 111.1 per cent in 2008-09 (RE),
followed by Arunachal Pradesh (88.8 per cent),
Mizoram (73.8 per cent) and Manipur (64.3 per
cent). Transfers and devolution from the Centre
constitute a major portion of the total revenue
receipts in all the special category States, except
Sikkim. In contrast to the trend observed in other
special category States, in Sikkim own-non tax
revenue, mainly State lotteries, constitutes a major
portion of the State’s total revenue receipts. Sikkim
displays the highest own non-tax effort (44.4 per cent of GSDP) among the special category States,
followed by Arunachal Pradesh (7.3 per cent).
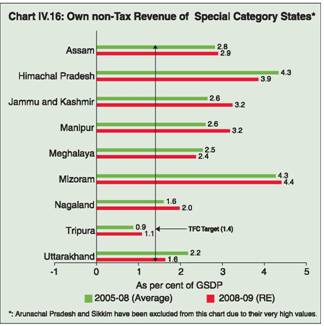
Jammu and Kashmir registered the highest own
tax effort of 7.7 per cent in 2008-09 (RE), followed
by Uttarakhand (7.6 per cent) and Himachal
Pradesh (6.2 per cent) (Charts IV.15, 16 and
Statement 19).
4.38 State governments have been initiating
measures to make the VAT system more user
friendly. At the same time they also propose to
strengthen the audit and enforcement mechanisms
to check evasion of taxes and to mobilise additional
revenue. Despite the economic slowdown, the VATGSDP
ratio in all the special category States,
except in Uttarakhand and Arunachal Pradesh,
registered an improvement in 2008-09 (RE) over
2007-08 (Accounts). During 2008-09 (RE), the
VAT-GSDP ratio was the highest in Jammu and
Kashmir (4.4 per cent), followed by Assam and
Uttarakhand (3.3 per cent each). Among the tax
revenue sources, state excise is next in order of
importance after VAT among the special category
States (Table IV.2 and Chart IV.17 ).
Revenue Expenditure
4.39 Revenue expenditure in terms of GSDP
increased in the nine special category States, viz., Meghalaya, Arunachal Pradesh, Himachal
Pradesh, Manipur, Assam, Mizoram, Nagaland and
Tripura in 2008-09 (RE) over 2005-08 (Average).
Except the two States of Jammu and Kashmir and
Uttarakhand, the development component of
revenue expenditure in terms of GSDP increased
during 2008-09 (RE) over 2005-08 (Average).
Meghalaya registered the highest increase in
development revenue expenditure to GSDP ratio
in 2008-09 (RE) over 2005-08 (Average), followed by Arunachal Pradesh, Mizoram and Sikkim. During
the same period, Sikkim witnessed the highest
decline of 12.7 per cent in the non-development
component of revenue expenditure (NDRE) as
percentage to GSDP followed by Himachal Pradesh
(decline by 0.2 per cent) (Chart IV.18). Arunachal
Pradesh registered the highest increase in the
NDRE-GSDP ratio in 2008-09 (RE) over 2005-08
(Average), followed by Manipur and Assam.
 |
4.40 In the seven special category States, viz.,Jammu and Kashmir, Meghalaya, Himachal
Pradesh, Mizoram, Nagaland, Sikkim and Tripura,
the interest payments as ratio to GSDP came down
in 2008-09 (RE) over 2005-08 (Average). However,
pension as a per cent of GSDP increased in all the
special category States, except in Meghalaya and
Sikkim, during the same period (Table IV.3 and
Statements 12 and 13).
4.41 Sikkim displayed the highest RE-GSDP ratio
of 89.0 per cent, followed by Arunachal Pradesh
(70.2 per cent) and Mizoram (67.2 per cent).
Development revenue expenditure constitutes a
major portion of the total revenue expenditure in
all the special category States. The level of
development revenue expenditure is as high as
50.5 per cent in the case of Arunachal Pradesh,
followed by Mizoram, Manipur and Sikkim. Despite a significant decline of 12.7 per cent in terms of the NDRE-GSDP ratio in 2008-09 (RE) over 2005-08 (Average), Sikkim stood out with a NDRE-GSDP ratio of 51.1 per cent in 2008-09 (RE), followed by Mizoram and Arunachal Pradesh.
4.42 The interest payments on loans from Centre
contributed a small portion of total interest
payments in all the special category States, except
Manipur, in 2008-09 (RE). Interest payment on
NSSF was the highest in the case of Uttarakhand
(41.1 per cent), followed by Assam (26.3 per cent)
and Tripura (22.0 per cent). On the other hand, in
case of Nagaland it was only 4.0 per cent. Nagaland
registered the highest interest payment on market
loans (53.3 per cent), followed by Mizoram (51.9 per
cent) and Meghalaya (48.5 per cent) (Chart IV.19).
4.43 Mizoram registered the highest IP-GSDP
ratio of 6.3 per cent, followed by Arunachal Pradesh
(5.5 per cent) and Sikkim (5.3 per cent) in 2008-09
(RE). Manipur, Nagaland and Jammu and Kashmir
registered the highest pension-GSDP ratio of 4.1
per cent, 3.4 per cent and 3.3 per cent respectively
in 2008-09 (RE) (Table IV.3). The TwFC had
envisaged that the States’ interest payments should
be brought down to 15 per cent of revenue receipts.
All the special category States, except Himachal
Pradesh, achieved the TwFC target with respect to IP-RR (15.0 per cent) in 2008-09 (RE). The IPRR
ratio was the lowest in the case of Sikkim (4.7
per cent), followed by Arunachal Pradesh and
Meghalaya (6.2 per cent each) (Chart IV.20 and
Statements 17, 36 and 37).
4. Expenditure Pattern of State Governments
4.44 Public expenditure signifies the quantum of
government spending on social and physical
infrastructure for the development of States. The
size, composition and productivity of public
expenditure are important parameters to assess the
effectiveness of public expenditure in accelerating
the growth impulse of the economy. Expenditure
management policies of State governments link
expenditure to monitorable, quantifiable physical
outputs and outcomes with greater emphasis on
increasing the capital outlay. Priorities have been
accorded to complete incomplete projects by
adequate funding and close monitoring in some of
the special category States.
4.45 An analysis of some of the qualitative
categories of expenditure, viz., capital outlay7,
development expenditure8 and social sector
expenditure9 is attempted here. The data on these
expenditure categories for the period 2005-08
(Average) and 2008-09 (RE) for both the nonspecial
and special category States are presented
in Table IV.4.
Non-special Category States
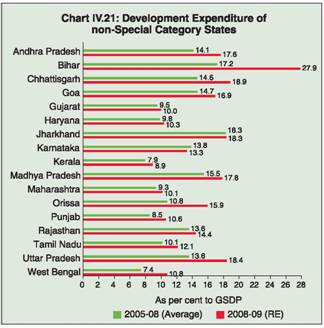
4.46 The development expenditure as a ratio to
GSDP witnessed an increase in all the non-special
category States, except Karnataka, in 2008-09 (RE)
over 2005-08 (Average). Bihar registered the
highest increase in development expenditure to
GSDP ratio in 2008-09 (RE) over 2005-08
(Average), followed by Orissa, Uttar Pradesh and
Chhattisgarh. Bihar recorded the highest
development expenditure to GSDP ratio (27.9 per
cent), followed by Chhattisgarh (18.9 per cent),
Uttar Pradesh (18.4 per cent) and Jharkhand (18.3
per cent) in 2008-09 (RE) (Table IV.4, Chart IV.21 and Statement 12).
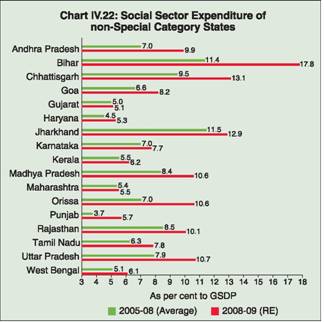
4.47 All the non-special category States
experienced an increase in social sector
expenditure (SSE) to GSDP ratio in 2008-09 (RE)
over 2005-08 (Average). Bihar registered the
highest increase in social sector expenditure to
GSDP ratio, followed by Chhattisgarh, Orissa and
Andhra Pradesh. Bihar recorded the highest SSEGSDP
ratio of 17.8 per cent, followed by
Chhattisgarh (13.1 per cent) and Jharkhand (12.9
per cent) in 2008-09 (RE) (Table IV.4 and Chart
IV.22) (also see Statements 41, 42, 46 and 47).
4.48 All the non-special category States, except
Madhya Pradesh, Rajasthan and Karnataka,
registered an increase in the capital outlay (CO)-
GSDP ratio in 2008-09 (RE) over 2005-08
(Average). Bihar registered the highest increase in the CO-GSDP ratio, followed by Uttar Pradesh,
Punjab and Orissa during the same period. Bihar
registered the highest CO-GSDP ratio of 8.9 per cent,
followed by Uttar Pradesh (6.3 per cent) and
Jharkhand (5.1 per cent) in 2008-09 (RE). However, the level of the CO-GSDP ratio was quite low in
States like Kerala, West Bengal, Haryana, Tamil
Nadu, Orissa and Maharashtra in 2008-09 (RE)
(Table IV.4 and Chart IV.23).
Table IV.4: Expenditure Pattern of State Governments |
(Per cent) |
State |
2005-08 (Avg.) |
2008-09 (RE) |
DEV/ GSDP |
SSE/ GSDP |
CO/ GSDP |
DEV/ GSDP |
SSE/ GSDP |
CO/ GSDP |
1 |
2 |
3 |
4 |
5 |
6 |
7 |
I. |
Non-Special Category |
|
|
|
|
|
|
1 |
Andhra Pradesh |
14.1 |
7.0 |
3.7 |
17.6 |
9.9 |
3.7 |
2 |
Bihar |
17.2 |
11.4 |
4.4 |
27.9 |
17.8 |
8.9 |
3 |
Chhattisgarh |
14.6 |
9.5 |
3.8 |
18.9 |
13.1 |
4.3 |
4 |
Goa |
14.7 |
6.6 |
4.2 |
16.9 |
8.2 |
4.9 |
5 |
Gujarat |
9.5 |
5.0 |
2.8 |
10.0 |
5.1 |
2.9 |
6 |
Haryana |
9.8 |
4.5 |
1.9 |
10.3 |
5.3 |
2.0 |
7 |
Jharkhand |
18.3 |
11.5 |
4.6 |
18.3 |
12.9 |
5.1 |
8 |
Karnataka |
13.8 |
7.0 |
3.7 |
13.3 |
7.7 |
3.5 |
9 |
Kerala |
7.9 |
5.5 |
0.7 |
8.9 |
6.2 |
0.9 |
10 |
Madhya Pradesh |
15.5 |
8.4 |
4.8 |
17.8 |
10.6 |
4.3 |
11 |
Maharashtra |
9.3 |
5.4 |
2.1 |
10.1 |
5.5 |
2.8 |
12 |
Orissa |
10.8 |
7.0 |
1.8 |
15.9 |
10.6 |
2.7 |
13 |
Punjab |
8.5 |
3.7 |
1.7 |
10.6 |
5.7 |
3.0 |
14 |
Rajasthan |
13.6 |
8.5 |
3.5 |
14.4 |
10.1 |
3.1 |
15 |
Tamil Nadu |
10.1 |
6.3 |
2.1 |
12.1 |
7.8 |
2.6 |
16 |
Uttar Pradesh |
13.6 |
7.9 |
4.2 |
18.4 |
10.7 |
6.3 |
17 |
West Bengal |
7.4 |
5.1 |
0.8 |
10.8 |
6.1 |
1.2 |
II. |
Special Category |
|
|
|
|
|
|
1 |
Arunachal Pradesh |
58.2 |
25.4 |
17.3 |
91.4 |
32.3 |
42.4 |
2 |
Assam |
13.4 |
8.2 |
2.2 |
21.3 |
12.8 |
5.1 |
3 |
Himachal Pradesh |
18.5 |
11.4 |
3.8 |
21.2 |
13.1 |
5.7 |
4 |
Jammu and Kashmir |
32.5 |
15.4 |
13.1 |
34.3 |
16.1 |
16.3 |
5 |
Manipur |
40.0 |
19.6 |
15.9 |
52.9 |
24.7 |
26.0 |
6 |
Meghalaya |
22.3 |
12.8 |
4.6 |
34.7 |
17.7 |
7.3 |
7 |
Mizoram |
53.9 |
27.2 |
16.2 |
62.0 |
36.9 |
17.0 |
8 |
Nagaland |
28.5 |
14.4 |
10.6 |
32.3 |
16.1 |
13.4 |
9 |
Sikkim |
48.3 |
27.3 |
17.4 |
69.6 |
35.1 |
34.9 |
10 |
Tripura |
19.7 |
12.0 |
7.7 |
25.9 |
15.7 |
11.9 |
11 |
Uttarakhand |
18.8 |
10.7 |
6.2 |
16.6 |
9.2 |
5.6 |
All States# |
9.1 |
5.2 |
2.3 |
11.0 |
6.5 |
2.8 |
Memo Item: |
|
|
|
|
|
|
1 |
NCT Delhi |
7.4 |
4.5 |
1.8 |
9.2 |
5.7 |
2.4 |
2 |
Puducherry |
25.1 |
11.9 |
4.3 |
30.0 |
14.4 |
4.3 |
Avg. : Average.
RE : Revised Estimates.
DEV : Development Expenditure.
SSE : Social Sector Expenditure.
CO : Capital Outlay.
GSDP : Gross State Domestic Product.
# : Data for All States are as per cent to GDP.
Source: Based on Budget Documents of the State Governments. |
 |
Special Category States
4.49 Special category States highlighted the
need of improving the quality of expenditure by devoting higher expenditure to capital
investments. All the special category States,
except Uttarakhand, witnessed an increase in
development expenditure to GSDP ratio in 2008-09
(RE) over 2005-08 (Average). Arunachal Pradesh
witnessed the highest increase in the development
expenditure to GSDP ratio, followed by Sikkim and
Manipur during the same period. Among the
special category States, Arunachal Pradesh
registered the highest development expenditure
to GSDP ratio of 91.4 per cent, followed by Sikkim
(69.6 per cent) and Mizoram (62.0 per cent) in
2008-09 (RE) (Table IV.4, Chart IV.24 and
Statement 12).
 |
4.50 The SSE-GSDP ratio witnessed an increase
in all the special category States, except
Uttarakhand in 2008-09 (RE) over 2005-08
(Average). Among the special category States,
Mizoram recorded the highest increase in social
sector expenditure to GSDP ratio (36.9 per cent),
followed by Sikkim (35.1 per cent) and Arunachal
Pradesh (32.3 per cent) during the same period
(Table IV.4, Chart IV.25 and Statements 41, 42,
46 and 47).
4.51 All the special category States, except
Uttarakhand, witnessed an increase in the COGSDP ratio in 2008-09 (RE) over 2005-08 (Average). Arunachal Pradesh registered the highest increase in the CO-GSDP ratio during the same period, followed by Sikkim and Manipur. Among the special category States, the highest CO-GSDP ratio was registered by Arunachal Pradesh (42.4 per cent), Sikkim (34.9 per cent) and Manipur (26.0 per cent) in 2008-09 (RE) (Table IV.4 and Chart IV.26).
5. Conclusion
4.52 The significant turnaround in State finances
in the recent past as reflected in the improved level
of deficit indicators till 2007-08 provided the
necessary cushion to State governments to face
the negative impact of the slowdown and also to
absorb the increased pressure on account of the
Sixth Pay Commission/State’s own Pay
Commissions during 2008-09, which was not the
case during the implementation of the Fifth Pay
Commission. The State-wise position shows that
during 2008-09 (RE), a majority of the States were able to maintain their surplus positions albeit at
lower levels (except Kerala, West Bengal, Punjab
and Haryana). Despite the slowdown, Meghalaya,
Haryana, Orissa, Maharashtra, Tamil Nadu,
Chhattisgarh, Assam, Andhra Pradesh and
Gujarat were able to keep their GFD-GSDP ratio
below 3.0 per cent.
4.53 However, the impact of the slowdown is
evident in 2009-10 as the number of revenue
surplus States has declined sharply to 14 States
as compared with 24 States in 2008-09 (RE). This
is mainly on account of higher growth in revenue
expenditure vis-à-vis revenue receipts. As an
outcome of this, all States at the consolidated level
budgeted a revenue deficit of 0.5 per cent of GDP
in 2009-10. In line with the decline in the revenue
account, the surge in GFD was also seen across
all the States except in the six States viz., Kerala,
Bihar, Karnataka, Chhattisgarh, Gujarat and Tamil
Nadu. Non-special category States appear to be
mainly responsible for the deterioration in deficit
indicators during 2009-10 (BE). Non-special
category States would account for 77.5 per cent of
the total deterioration in the revenue account of
States and 81.5 per cent of the increase in GFD in
2009-10 (BE) over 2008-09 (RE). There also exists
a wide variation across States in terms of the OTRGSDP
ratio. Karnataka had the highest OTRGSDP
ratio of 10.7 per cent in 2008-09 (RE) while
States like West Bengal and Bihar were at the lower
level with 4.7 to 5.5 per cent.
6 The data on Gross State Domestic Product (GSDP) at current prices used in the Study are mainly sourced from the Central Statistical
Organisation (CSO). Wherever data were not available with CSO, the projections of the respective State governments, as given in their
budget documents as also forwarded by them to RBI, have been used. Further, data have been projected based on three year annual
average growth rate, wherever it was not available from the respective State governments.
7 Capital outlay includes both development and non-development capital outlay of State governments.
8 Development expenditure includes the development components of revenue expenditure, capital outlay and loans and advances by the
State governments.
9 Social sector expenditure includes expenditure on social services, expenditure on food storage and warehousing and rural development
under revenue expenditure, capital outlay and loans and advances of the State governments. |