With the unfolding of the global financial crisis and its consequent impact on the Indian economyand the implementation of the Sixth Central/States’ Own Pay Commissions, some incipient signs offiscal stress were evident in the finances of the State governments in 2008-09 (RE). Growth in revenue receipts was lower than the growth in revenue expenditure leading to a decline in revenue surplus atthe consolidated level. As a result, GFD-GDP ratio surged by 1.1 percentage points in 2008-09 (RE)over 2007-08. On the positive side, the capital outlay increased by 32 per cent reflecting the commitment of the States to sustain the growth momentum. As per the State budgets, the impact of the slowdow non major deficit indicators is estimated to be more pronounced in 2009-10(BE). Re-emergence ofrevenue deficit after three years and the widening of GFD in 2009-10 show that it would be desirableto return to the path of fiscal consolidation.
1. Introduction
3.1 The consolidated fiscal position of the State governments witnessed significant improvement inthe recent years as reflected in major deficit indicators,viz., revenue deficit (RD), gross fiscal deficit (GFD) and primary deficit (PD) as a ratio to GDP. An improvement in the fiscal situation in recent years has been achieved by pursuing thefiscal correction and consolidation process undera rule-based fiscal framework. The efforts of theState governments towards reducing fiscalimbalances were aided by larger devolution and transfer by the Twelfth Finance Commission (TwFC) through shareable Central taxes (higherbuoyancy of Central taxes aided higher devolution)and grants. Higher GDP growth for the period extending to 2007-08 facilitated higher revenuemobilisation. Consequent upon thesedevelopments, the State governments achievedrevenue surplus for the second successive yearduring 2007-08 (Accounts). The revenue surplusas per cent of GDP was higher at 0.9 per cent in2007-08 (Accounts) as compared with 0.6 per centin 2006-07. Reflecting the improvement in therevenue account, the GFD-GDP ratio also declinedto 1.5 per cent in 2007-08 (Accounts) from 1.8 percent in 2006-07. However, due to the moderationin economic growth during 2008-09, the revenuebuoyancy suffered a setback and aggregateexpenditure shot up. As a result the level of revenuesurplus declined and the GFD-GDP ratio increasedsignificantly. The key fiscal indicators are estimatedto deteriorate further in 2009-10 (Table III.1). In short, the pace of fiscal correction and consolidationappears to have taken a pause in 2008-09 (RE) and2009-10 (BE). This Chapter provides a consolidatedpicture of State finances during 2007-08 (Accounts),2008-09 (RE) and 2009-10 (BE).
Table III.1: Major Deficit Indicators of State Governments |
(Amount in Rs. crore) |
Item |
1990-95 |
1995-00 |
2000-05 |
2005-06 |
2006-07 |
2007-08 |
2008-09
(BE) |
2008-09
(RE) |
2009-10
(BE) |
Average |
1 |
2 |
3 |
4 |
5 |
6 |
7 |
8 |
9 |
10 |
Gross Fiscal Deficit |
|
|
|
90,084 |
77,508 |
75,455 |
1,12,653 |
1,46,349 |
1,99,510 |
|
(2.8) |
(3.4) |
(4.0) |
(2.4) |
(1.8) |
(1.5) |
(2.0) |
(2.6) |
(3.2) |
Revenue Deficit |
|
|
|
7,013 |
-24,857 |
-42,943 |
-28,426 |
-10,701 |
32,295 |
|
(0.7) |
(1.7) |
(2.2) |
(0.2) |
-(0.6) |
-(0.9) |
-(0.5) |
-(0.2) |
(0.5) |
Primary Deficit |
|
|
|
6,060 |
-15,672 |
-24,376 |
4,270 |
40,128 |
83,083 |
|
(1.1) |
(1.4) |
(1.3) |
(0.2) |
-(0.4) |
-(0.5) |
(0.1) |
(0.7) |
(1.3) |
BE: Budget Estimates. RE: Revised Estimates.
Note: 1. Negative (–) sign indicates surplus.
2. Figures in parentheses are percentages to GDP.
3. The ratios to GDP at current market prices starting with 2004-05 are based on CSO’s National Accounts 2004-05 series. Data on GDP for
earlier year relate to 1999-2000 series. The ratio for the year 2009-10 is based on CSO’s Advanced Estimates released on February 8, 2010.
Source: Budget Documents of the State Governments. |
2. Accounts: 2007-08
3.2 At the consolidated level, the State switnessed a marked improvement in key deficit indicators when the revised estimates of 2007-08
translated into accounts. While the surplus on the
revenue account almost doubled in absolute terms,
GFD declined by around 30 per cent than the
revised estimates. The consolidated revenue surplus
increased from 0.5 per cent of GDP in 2007-08 (RE)
to 0.9 per cent of GDP in 2007-08 (Accounts) (Table
III.2 and Appendix 1). The improvement in 2007-
08 (Accounts) over 2007-08 (RE) was mainly due
to a decline in revenue expenditure by 0.5 per cent of GDP. The decline in developmental expenditurein 2007-08 (Accounts) over 2007-08 (RE) by Rs.17,762 crore accounted for around 70 per cent ofthe total decline in revenue expenditure. Reductionin expenditure on education, sports and art andculture by 5.4 per cent mainly contributed to thedecline in development expenditure. Furthermore,around 28 per cent of the decline in revenue expenditure in 2007-08 (Accounts) over 2007-08(RE) was contributed by the decline in non-development expenditure. Within non-development expenditure, committed expenditure comprising administrative services, pension and interest payments declined by 2.8 per cent in 2007-08(Accounts) over 2007-08 (RE), contributing around22.7 per cent of the total decline in revenue expenditure.
Table III.2: Variation in Major Items – 2007-08 (Accounts) over 2007-08 (RE) |
(Amount in Rs. crore) |
Item |
2007-08
(RE) |
2007-08
(Accounts) |
Variation |
Contribution* (Per cent) |
Amount |
Per cen |
1 |
2 |
3 |
4 |
5 |
6 |
I. Revenue Receipts (i+ii) |
6,28,742 |
6,23,748 |
-4,994 |
-0.8 |
100.0 |
(i) Tax Revenue (a+b) |
4,41,526 |
4,37,948 |
-3,578 |
-0.8 |
71.6 |
(a) Own Tax Revenue |
2,93,392 |
2,86,546 |
-6,846 |
-2.3 |
137.1 |
of which: Sales Tax |
1,78,198 |
1,73,422 |
-4,776 |
-2.7 |
95.6 |
(b) Share in Central Taxes |
1,48,134 |
1,51,402 |
3,268 |
2.2 |
-65.4 |
(ii) Non-Tax Revenue |
1,87,216 |
1,85,799 |
-1,417 |
-0.8 |
28.4 |
(a) States’ Own Non-Tax Revenue |
62,578 |
77,178 |
14,600 |
23.3 |
-292.3 |
(b) Grants from Centre |
1,24,638 |
1,08,622 |
-16,016 |
-12.9 |
320.7 |
II. Revenue Expenditure |
6,06,216 |
5,80,805 |
-25,411 |
-4.2 |
100.0 |
of which: |
|
|
|
|
|
(i) Development Expenditure |
3,55,099 |
337,337 |
-17,762 |
-5.0 |
69.9 |
Education, Sports, Art and Culture |
1,06,474 |
100,775 |
-5,699 |
-5.4 |
22.4 |
Power |
28,599 |
30,729 |
2,130 |
7.4 |
-8.4 |
(ii) Non-Development Expenditure |
2,34,386 |
2,27,235 |
-7,151 |
-3.1 |
28.1 |
of which: |
|
|
|
|
|
Administrative Services |
47,694 |
44,866 |
-2,828 |
-5.9 |
11.1 |
Pension |
56,002 |
56,098 |
96 |
0.2 |
-0.4 |
Interest Payments |
1,02,878 |
99,831 |
-3,047 |
-3.0 |
12.0 |
III. Capital Receipts |
1,34,635 |
1,41,987 |
7,352 |
5.5 |
100.0 |
of which: |
|
|
|
|
|
Non-Debt Capital Receipts |
8,400 |
6,955 |
-1,445 |
-17.2 |
-19.7 |
IV. Capital Expenditure |
1,81,273 |
1,71,520 |
-9,753 |
-5.4 |
100.0 |
of which: |
|
|
|
|
|
Capital Outlay |
1,28,331 |
1,18,862 |
-9,469 |
-7.4 |
97.1 |
of which: |
|
|
|
|
|
Capital Outlay on Irrigation & Flood Control |
39,128 |
37,005 |
-2,123 |
-5.4 |
21.8 |
Capital Outlay on Transport |
25,275 |
23,767 |
-1,508 |
-6.0 |
15.5 |
Memo Item: |
|
|
|
|
|
Revenue Deficit |
-22,526 |
-42,943 |
-20,417 |
90.6 |
|
Gross Fiscal Deficit |
107,958 |
75,455 |
-32,503 |
-30.1 |
|
Primary Deficit |
5,080 |
-24,376 |
-29,456 |
-579.8 |
|
RE : Revised Estimates. * : Denotes percentage share in relevant total.
Note : 1. Negative (–) sign in deficit indicators indicates surplus.
2. Capital receipts include public accounts on a net basis while capital expenditure excludes public accounts.
3. Also see Notes to Appendices.
Source : Budget Documents of the State Governments. |
3.3 On the revenue receipt side, there was a
decline of 0.8 per cent in 2007-08 (Accounts) over
the revised estimates which is attributed to a fall in
own tax revenue and a fall in grants from the
Centre. Although own tax revenue (OTR) declined
by 2.3 per cent in 2007-08 (Accounts) over revised
estimates, it was partly compensated for by an
increase of 2.2 per cent in States’ share in Central
taxes. Under non-tax revenue, grants from the
Centre were significantly lower by 12.9 per cent
than the revised estimates. However, as per
2007-08 (Accounts), States’ performances in terms
of collection of own non-tax revenues (ONTRs)
recorded a substantial improvement of 23.3 per
cent over the revised estimates.
3.4 As mentioned above, there was
improvement not only in terms of increase in
revenue surplus as percentage to GDP but also in
the GFD-GDP ratio during 2007-08 (Accounts) over
the revised estimates mainly due to an
improvement in revenue surplus along with a
decline in capital outlay. Capital outlay in 2007-08
(Accounts) was lower to the extent of 7.4 per cent
over the revised estimates. As a result of the
increase in revenue surplus and decline in capital
outlay, the consolidated GFD of the States declined
from Rs.1,07,958 crore in 2007-08 (RE) to
Rs.75,455 crore in 2007-08 (Accounts). As a ratio
to GDP, GFD declined to 1.5 per cent of GDP in 2007-08 (Account) from 2.2 per cent of GDP in therevised estimates. As a result of significant declinein GFD, the States were able to generate a primarysurplus of Rs. 24,376 crore in 2007-08 (Accounts)for the second successive year.
3. Revised Estimates: 2008-09
3.5 State finances in 2008-09 (RE) were impacted by the overall macroeconomic slowdown and revenue expenditure obligations arising out ofthe implementation of the Sixth CPC/SPCs forsome State governments. As a result, increase inrevenue expenditure (5.2 per cent) in 2008-09 (RE)over 2008-09 (BE) outstripped the increase inrevenue receipts (2.5 per cent) which led to adecline in revenue surplus by 62.4 per cent in 2008-09(RE) over the budget estimates. The revenue surplusas percentage to GDP squeezed from 0.5 per cent in2008-09 (BE) to 0.2 per cent in 2008-09 (RE).
3.6 On the revenue account, decline in States’own tax revenue (OTR) by 1.9 per cent in 2008-09(RE) over 2008-09 (BE) mainly affected the revenue receipts of State governments. This decline was mainly because the States could not realise the budget estimates of stamp duty and registration fees, sales tax/VAT and taxes on vehicles, State excise duties and taxes on passengers and goods in 2008-09 (RE). On the contrary, States’collections under own non-tax revenues (ONTRs) recorded an increase of 19.1 per cent in 2008-09(RE) over 2008-09 (BE). Increase in revenue expenditure by Rs. 35,756 crore over 2008-09 (BE)could be entirely attributed to an increase in development expenditure pertaining to power;education, sports and art and culture; relief on account of natural calamities; and transport and communication. The States were able to containtheir non-development expenditure mainly committed expenditure by Rs. 7,765 crore in 2008-09 (RE) over the budget estimates. As per 2008-09 (RE), administrative services and interest payments were lower to the extent of Rs.5,761crore and Rs.2,163 crore respectively than their budget estimates. Most States had apparently taken into account the imminent increase in wages and salaries on account of the Sixth CPC/SPCs while presenting their budget estimates for 2008-09. As a result, an increase in expenditure on administrative services in 2008-09 (RE) appears to be more pronounced over 2007-08 (Accounts) rather than over 2008-09 (BE) (Table III.3).
3.7 Capital outlay rose by 8.3 per cent over thebudget estimates of 2008-09. Accordingly, capital outlay as percentage to GDP stood at 2.8 per centin 2008-09 (RE) as compared with the budget estimate of 2.6 per cent. Increase in capital outlay was largely due to higher capital spending onirrigation and flood control and the transport sector.As a result of a decline in revenue surplus and an increase in capital outlay, consolidated GFD roseby 29.9 per cent in 2008-09 (RE) over the budgetestimates. As a ratio to GDP, GFD moved up to 2.6per cent in 2008-09 (RE) from 2.0 per cent in the budget estimates. The primary deficit re-emergedat 0.7 per cent of GDP in 2008-09 (RE) as compared with budget estimates of 0.1 per cent after remaining in surplus during the previous two years.
Table III.3: Variation in Major Items – 2008-09 (RE) over 2008-09 (BE) |
(Amount in Rs. crore) |
Item |
2008-09
(BE) |
2008-09
(RE) |
Variation |
Contribution* (Per cent) |
Amount |
Per cent |
1 |
2 |
3 |
4 |
5 |
6 |
I. Revenue Receipts (i+ii) |
7,19,835 |
7,37,865 |
18,030 |
2.5 |
100.0 |
(i) Tax Revenue (a+b) |
5,09,957 |
5,03,878 |
-6,079 |
-1.2 |
-33.7 |
(a) Own Tax Revenue |
3,36,810 |
3,30,405 |
-6,405 |
-1.9 |
-35.5 |
of which: Sales Tax |
2,03,623 |
2,02,610 |
-1,013 |
-0.5 |
-5.6 |
(b) Share in Central Taxes |
1,73,147 |
1,73,473 |
326 |
0.2 |
1.8 |
(ii) Non-Tax Revenue |
2,09,878 |
2,33,987 |
24,109 |
11.5 |
133.7 |
(a) States Own Non-Tax Revenue |
66,848 |
79,614 |
12,765 |
19.1 |
70.8 |
(b) Grants from Centre |
1,43,030 |
1,54,373 |
11,343 |
7.9 |
62.9 |
II. Revenue Expenditure |
6,91,409 |
7,27,165 |
35,756 |
5.2 |
100.0 |
of which: |
|
|
|
|
|
(i) Development Expenditure |
4,02,810 |
4,45,889 |
43,080 |
10.7 |
120.5 |
of which: |
|
|
|
|
|
Education, Sports, Art and Culture |
1,22,072 |
1,29,706 |
7,634 |
6.3 |
21.4 |
Transport and Communication |
18,525 |
19,975 |
1,451 |
7.8 |
4.1 |
Power |
26,270 |
36,715 |
10,445 |
39.8 |
29.2 |
Relief on account of Natural Calamities |
5,491 |
10,076 |
4,585 |
83.5 |
12.8 |
(ii) Non-Development Expenditure |
2,68,665 |
2,60,899 |
-7,765 |
-2.9 |
-21.7 |
of which: |
|
|
|
|
|
Administrative Services |
62,905 |
57,144 |
-5,761 |
-9.2 |
-16.1 |
Pension |
62,729 |
66,938 |
4,210 |
6.7 |
11.8 |
Interest Payments |
1,08,383 |
1,06,220 |
-2,163 |
-2.0 |
-6.0 |
III. Capital Receipts |
1,75,306 |
1,86,201 |
10,894 |
6.2 |
100.0 |
of which: |
|
|
|
|
|
Non-Debt Capital Receipts |
15,000 |
5,314 |
-9,686 |
-64.6 |
-88.9 |
IV. Capital Expenditure |
2,01,374 |
2,13,259 |
11,885 |
5.9 |
100.0 |
of which: |
|
|
|
|
|
Capital Outlay |
1,45,159 |
1,57,254 |
12,095 |
8.3 |
101.8 |
of which: |
|
|
|
|
|
Capital Outlay on Irrigation and Flood Control |
44,525 |
48,727 |
4,202 |
9.4 |
35.4 |
Capital Outlay on Transport |
27,618 |
29,614 |
1,996 |
7.2 |
16.8 |
Memo Item: |
|
|
|
|
|
Revenue Deficit |
-28,426 |
-10,701 |
17,725 |
-62.4 |
|
Gross Fiscal Deficit |
1,12,653 |
1,46,349 |
33,695 |
29.9 |
|
Primary Deficit |
4,270 |
40,128 |
35,858 |
839.7 |
|
BE: Budget Estimates. RE: Revised Estimates. * : Denotes percentage share in relevant total.
Note: See Notes to Table III.2.
Source: Budget Documents of the State Governments. |
3.8 As discussed earlier, the process of fiscal correction and consolidation at the State level experienced a slippage in 2008-09 on account ofthe overall macroeconomic slowdown following the global financial crisis. Furthermore, many of the State governments started implementing recommendations of the Sixth CPC/SPCs for their employees whichhad implications on their revenue expenditure.Consequently, the key deficit indicators deteriorated in 2008-09 (RE) as compared with 2008-09 (BE) aswell as 2007-08 (Accounts). In order to address theoverall macroeconomic slowdown, the Central Government allowed the States to increase the limitof fiscal deficit to 3.5 per cent of GDP during 2008-09 (as stated in the interim Union Budget 2009-10).Thus, the States were allowed to raise additional market borrowings to the extent of 0.5 per cent ofGSDP. This additional fiscal space was to be utilised for undertaking capital investments.
4. Budget Estimates: 2009-10
3.9 Setback to States’ fiscal position witnessed during 2008-09 is estimated to worsen further in2009-10 as is evident from budget estimates of key deficit indicators. During the period of subdued growth,it is generally perceived that governments attempt toraise public investment to generate aggregate demand. In the Indian context, while such efforts are discernible at the Central Government level, there are no definitive signs of such high public spending atthe State level except in the case of a few Stategovernments. In fact, a discretionary fiscal policybecomes more important for countries like India where efficacy of automatic stabilisers is found to be loweras compared with advanced economies (Box III.1).
3.10 With the global economy experiencing a severe slowdown, many advanced and emerging economies announced fiscal stimulus measures in order to boost domestic demand and revive economic activities.Although fiscal stimulus measures have been largely undertaken by the national governments, in some countries there have been fiscal stimulus packages atthe sub-national/provincial levels as well (Box III.2).
Box III.1: Role of Automatic Fiscal Stabilisers at the State level
Fiscal policy tools comprise of government spending and taxation.On occasions, governments have to undertake some explicit fiscalmeasures to fine-tune the economic activities which are termed asdiscretionary fiscal policy. In contrast, automatic stabilisers refer toprogrammes that automatically expand fiscal policy during a recessionand contract it during a boom and by nature are one form of acountercyclical fiscal policy. For instance, unemployment insuranceor benefits on which governments, particularly in advancedeconomies, spend more during recession when the unemploymentrate is high, is an example of an automatic stabiliser. These taxes,transfers and government purchases are automatic stabilisers of theeconomy. Similarly, the progressive taxes drop even faster thanincome and this decrease in taxes has a multiplier effect, partlyoffsetting the drop in autonomous consumption, so that equilibriumincome does not drop as far or as fast as it could. As transfers to andservices for the poor increase, which also have multiplier effects,they tend to offset the drop in autonomous consumption. Thus, inthe presence of automatic stabilisers, fall in aggregate demand isgenerally less than it would have been solely because of the fall inautonomous consumption.
If automatic stabilisers work well, they facilitate in making the economymore stable. However, the effect of the automatic stabilisers dependson the size of the government and also on how responsive taxes andexpenditures are to cyclical changes. In addition, it would depend onthe degree of progressivity of the taxation system and the extent towhich arrangements in the form of social benefits and unemploymentinsurance exist. Unemployment insurance programmes are animportant part of a government’s fiscal policy in advanced economieswhile they are much less widespread in developing economies and sois the effect of automatic stabilisers. Given these, the automaticstabilisers tend to be relatively small in EMEs (reflecting a smallerpublic sector and less extensive social transfers, as well as lessprogressive income taxes), so that a discretionary policy response,where feasible, will likely be necessary (Ghosh et al., 2009).
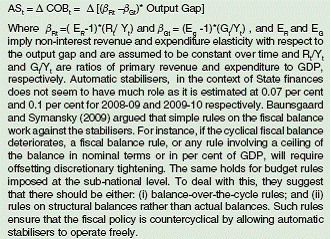
Automatic stabilisers widen the budget deficit when the output gapincreases, and vice versa. Thus, automatic stabilisers provide an appropriate fiscal response when the output gap is caused by demandshocks. In the Indian context, the coefficient of automatic stabiliserswas estimated to be around 0.5 per cent based on the data on Centralfinances (RBI, 2009). Since States account for nearly 60 per cent ofthe total Government expenditure (both Centre and States) in India,it is important to estimate the effect of automatic stabilisers using theState finances data as well. Following the methodology used by RBI(2009), automatic stabilisers can be described as a change in thecyclical deficit of States:
 |
References:
1.Ghosh, Atish R., M. Chamon, C. Crowe, J.I. Kim and J.D. Ostry(2009), ‘Coping with the Crisis: Policy Options for EmergingMarket Countries’, IMF Staff Position Note No. SPN/09/08.
2. Baunsgaard, Thomas and Steven A. Symansky (2009), ‘AutomaticStabilisers’,IMF Staff Note No. SPN/09/23, September.
3. Reserve Bank of India (2009), Annual Report 2008-09.
Box III.2: Fiscal Stimulus Measures at the Sub-National level: A Cross-Country Perspective
Fiscal policies have an important role to play in containing the adverseimpact of a financial and economic crisis. The measures adopted inresponse to the current financial crisis consist of various types offinancial assistance including government guarantees for inter-banklending, recapitalisation of financial institutions, increased coverageof retail deposit insurance, tax reliefs, enhanced public expenditureand asset relief schemes. Discretionary fiscal stimulus is playing animportant role as a policy response to boost demand in the wake ofthe financial crisis. Many countries have undertaken discretionaryfiscal stimulus measures which inter alia include a mix of tax cuts andnew expenditures, with the latter representing about two-third of thetotal. In addition to the stimulus measures at the federal level, in somecountries state and local governments have also followed discretionaryfiscal policies to accelerate economic growth. When sub-nationalgovernments hold the key due to a large share of spending, the Centreis less able to conduct a stabilisation through fiscal policy. In casefiscal adjustment is needed, the Centre may have only a limited roomto carry it out when it only controls a small share of the spending.Many countries, for instance in Latin America, have experienced suchdifficulties. Similarly, when a significant share of the revenue ismanaged by sub-national governments, the Centre may not havesufficient resources for stabilisation and redistribution purposes oreven to carry out its own spending responsibilities. This is happening,for instance, in some industrial countries which are facing rapidlyrising aging-related spending needs, but in which existing revenue-sharing formulas do not take into account differential dynamics inspending responsibilities of the central and sub-national governments.
At the State level, fiscal stimulus proposals have taken various forms.In the United States, the American Recovery and Reinvestment Act isa powerful mix of investments and tax cuts to create jobs and strengthenthe long term growth potential. The initial phase of the Act through taxcuts and transfers is intended to help stabilise state budgets and spureconomic growth. Some American states viz., Connecticut, Illinois,and Pennsylvania which proposed tax rebates are closely modelledon the federal stimulus package. In other states such as Alabamaand Arizona, the tax cuts are linked to the federal package. The stimulusbill also includes a number of different programmes that provide fundingfor local government initiatives. The stimulus package provides aboutUS$330 billion in federal funds-in-aid to states to supplant or offsetStates’ general fund spending, to supplement or increase statespending on a wide variety of programmes and States and discretionarygrants for other entities (such as local governments).
The Economic Action Plan of Canada aimed to reduce taxespermanently, enhance the employment insurance and trainingprogramme, enhance employment insurance work-sharingprogrammesand a massive injection of infrastructure spending for jobs. Federaltransfers to provinces were brought to an all-time high and theEconomic Action Plan encouraged the provinces and territories inthe country to reduce their corporate tax rates to 10 per cent by 2012,and most of the provinces are moving in that direction. So by 2012–13 most of Canada will be subject to a joint federal-provincial-territorialcorporate tax rate of about 25 per cent,15 per cent federally and 10per cent provincially. Important elements of the Action Plan involvecooperation with partners in provincial and territorial governments toensure that stimulus is provided in a timely manner and where it ismost needed. According to an estimate, provincial commitments willboost stimulus dollars pumped into Canada’s economy to $30 billion,or more than 2 per cent of its GDP in the current fiscal year.
In China’s stimulus package of ¥4 trillion (US$585 billion) about ¥1.18trillion (US$263 billion) is slated to come directly from the centralgovernment, while the remaining funds will be provided by provincialand local governments, state-owned and private enterprises andpolicy and commercial bank loans. About ¥100 billion(US$14.6billion)of the stimulus funds would go into local government projects forimplementation. However, local ministry and provincial officials willhave the final say in project implementation and execution. Provincialgovernments have announced their own stimulus packages. In orderto boost demand, the Home Electronics to the CountrysideProgramme, which provides cash subsidies of 13 per cent for ruralresidents’ purchasing home appliances, has been expanded to coverthe entire country. The list of products on which provincialgovernments provide subsidies, has been expanded to includemotorcycles, water heaters, computers and air conditioners. In orderto facilitate the provincial governments to raise resources for stimuluspackages, the Central government sold bonds amounting to 111.8billion Yuan on behalf of 23 provinces and autonomous regions inMarch 2009. In addition, a host of measures to boost the fiscalcapacity of local governments such as lower registered capitalrequirement have been introduced.
In Germany, out of the federal government’s package of 14 billioneuros in 2009 and 2010 for investment in education and infrastructure,10 billion euros will go to a municipal investment programme for themodernisation of municipal infrastructure particularly hospitals, urbandevelopment, rural infrastructure and noise mitigation measures formunicipal roads. The federal government has also provided a 20 percent tax cut on expenditure as also tax deductions to health and longterm care insurance.
In Russia, along with a reduction in oil export duties and the federalcorporate profit tax rate from 24 to 20 per cent, provincial authoritieswere allowed to set local tax rates of 5 to 15 per cent depending onthe economic situation in the region. Since January 1, 2009, all excisetaxes collected by state authorities goes towards regional budgetsinstead of only two-third of this tax as per practice.
Brazil’s stimulus focuses on investment in infrastructure projects thathave the participation of both the federal and municipal governmentsto fight the international crisis and there would be no cut in anyspending that has been designated for the Growth Acceleration Plan.Further, payment of unemployment insurance has been extended tosectors facing high levels of unemployment with a benefit of five toseven months.
Australia’s stimulus plan of AU$42 billion is to support jobs and investment in schools, housing and community infrastructure. Ofthese, AU$800 million has been allocated to the Regional and LocalCommunity Infrastructure Programme to fund local governments tobuild and renew local infrastructure such as community centers, townhalls, parks and playgrounds, pools and sports facilities. This rapidinjection of funds into local communities will support local jobs forspecific communities over the short and long term. The Regionaland Local Community Infrastructure Programme funding is beingdelivered to local communities through the local government.
References:
1.IMF (2009), The State of Public Finances: Outlook andMedium-Term Policies after the 2008 Crisis.
2.Websites of various Governments.
3.11 In India also a few State governmentsannounced fiscal stimulus packages envisaginghigher spending and lower tax rates for certain sectors in order to boost aggregate demand (Box III.3).An additional factor likely to influence Statefinances during 2009-10 but with positive implications for aggregate demand is theimplementation of the Sixth CPC/SPCs.
Box III.3: Fiscal Stimulus Measures at State Government Level in India
The recent global financial crisis and the consequent ongoingmacroeconomic global downturn necessitated many countries bothadvanced and emerging market to undertake fiscal stimulusmeasures to cushion the impact on domestic economy. Manycountries have already introduced/announced fiscal stimuluspackages. It is generally perceived that governments at the sub-national level lack the flexibility of deficit spending accorded to thefederal government, and therefore have a more limited set of toolsto deal with downside of the business cycle. However, in countrieswhere sub-national governments account for a significant portion ofaggregate government expenditure (both Centre and States), the fiscalpolicy at the sub-national level can play a counter-cyclical role byboosting aggregate demand through an increase in public expenditure.
In the Indian context, in keeping with the larger responsibilitiesassigned to the States, the consolidated State governmentexpenditure accounts for a substantial portion of the totalgovernment sector expenditure (Centre andStates) , which standshigher than in several other countries such as Australia, Denmark,Argentina, USA and Germany (World Bank, 2005). The Stategovernments account for about 60 per cent of the combinedexpenditure of the Centre and the States reflecting the States’ vitalrole in the growth and development of the economy. While the Stategovernments collect about one-third of the total government sectorreceipts, they incur more than three-fourth of the total expenditureon social services and more than half of that on economic services.Thus, State governments have a major responsibility with regard tothe provision of economic and socialinfrastructure. Given the relativeimportance of State governments in public finances, fiscal stimulusmeasures by States can supplement the Centre’s fiscal stimulusmeasures and facilitate the recovery process of the Indian economy.
It is generally perceived that fiscal authorities can best meet thischallenge by adopting a counter-cyclical fiscal policy. In the Indiancontext, the consolidated fiscal position of the State governmentswitnessed significant improvement in recent years reflecting thehigher share in Central transfers as a follow-up of therecommendations of the TwFC, States’ own efforts at revenueaugmentation, rationalisation of revenue expenditure and thecyclical upturn in the global economy that had a ripple effect onState finances (Gopinath, 2009). Thus, with a commitment towardsthe process of fiscal correction and consolidation in line with theirFRLs, most of the States were able to improve their overall fiscalposition considerably in the past few years. As a result, there wassome fiscal room available to the States to undertake counter-cyclical fiscal measures in order to insulate the State economiesfrom the overall macroeconomic slowdown.
Most of the counter-cyclical measures pertain to the expenditureside of State finances. Importantly, the Centre allowed the Statesto raise additional market borrowings, thus increasing the limit ofGFD to 3.5 per cent of GSDP during 2008-09 and 4.0 per cent ofGSDP during 2009-10. The consolidated expenditure of Stategovernments rose by 25.0 per cent during 2008-09 (RE) ascompared with 14.8 per cent during 2007-08 (Accounts). For 2009-10, the States have budgeted an increase of 12.2 per cent in theiraggregate expenditure over 2008-09 (RE). However, an increasein aggregate expenditure of the State governments is largely onaccount of revenue expenditure in 2008-09 (RE) and 2009-10 (BE).
An increase in revenue expenditure during 2008-09 and 2009-10could be partly due to the implementation of the Sixth CPC/SPCs bymany State governments which would also work as a counter-cyclicalmeasure by boosting demand. However, there is little evidence ofexplicit counter-cyclical fiscal measures at the sub-national level for2009-10 as only a few State governments have announced dedicatedfiscal stimulus packages. These States include Kerala, West Bengaland Haryana. The Kerala government announced a stimulus packageof Rs.10,000 crore to be spent directly by the government and quasi-government organisations over two years for infrastructuredevelopment through loans or grants. A major portion of theexpenditure under the stimulus package amounting to Rs. 5,034 croreis expected to be incurred during 2009-10, of which, around 89 percent is budgeted as capital expenditure. Announcing the budget for2009-10, the Haryana government proposed to launch a dedicatedeconomic stimulus package under which it proposes to spend aroundRs. 1,500 crore during the next two years in a focused manner byundertaking specific projects in the infrastructure sector. Similarly,the West Bengal government announced a stimulus package of Rs.5,106 crore on February 23, 2009, focusing on spending on housing,rural power supply, healthcare and education. However, unlike Keralaand Haryana, the stimulus package by West Bengal governmentappears to focus on boosting demand through revenue expenditurerather than capital expenditure.
Although no major stimulus-related tax measures have beenannounced at the State- level, some States have announced certaintax exemptions/reductions. Under the stimulus measuresannounced by the Rajasthan government, Micro, Small and MediumEnterprises (MSMEs) have been provided exemption from entrytax on inputs like raw materials, processing materials and packagingmaterials. Other major fiscal measures include: (i) reduction in CSTrate; and (ii) exemption of 75 per cent of electricity duty for unitslocated in rural areas. Keeping in view the slowdown in the economy,the Punjab government announced a stimulus package to boostthe affordable housing and real estate sector in the state. InKarnataka, VAT exemption available on food grain items like paddy,rice, wheat and pulses has been extended for another year, i.e.,2009-10. The present rate of 4 per cent will be reduced to 2 percent with respect to agriculture and forest produce like tamarindand shika-kai, coconut and desiccated coconut powder and arca-nut. Tax on certain other items has been abolished. Other tax relatedmeasures include: (i) sales tax exemption for diesel up to 75,000KL for use by fisher men in their boats; and (ii) some relaxation inluxury tax for boosting the tourism industry in Karnataka. TheChhattisgarh government has announced various pro-poor stimulusschemes and proposed many measures for trade and industry. Forinstance, small traders with annual turnovers of less than Rs.10lakh have been exempted from professional tax, and stamp dutyon sales deeds of immovable properties has been reduced from7.0 per cent to 6.5 per cent. In Chhattisgarh, the government hasannounced exemption from professional tax for traders with annualturnovers of less than Rs. ten lakh. In addition, stamp duty on saledeeds is proposed to be reduced by 0.5 percentages points.
Overall, the aggregate capital outlay of the State governments isbudgeted to rise marginally by 1.9 per cent during 2009-10 as compared with 32.3 per cent in 2008-09 (RE). Although some States,viz., Andhra Pradesh, Rajasthan, Karnataka and Jammu andKashmir have not announced dedicated fiscal stimulus packagesas counter-cyclical measures, they have budgeted a significantlyhigher capital outlay in 2009-10 as compared with that in 2008-09(RE). In contrast, a number of States, viz., Gujarat, Maharashtra,Punjab, Bihar, Orissa, Assam, West Bengal, Jharkhand, ArunachalPradesh, Himachal Pradesh, Manipur, Mizoram and Sikkim havebudgeted a decline in their capital outlay during 2009-10. Althoughsome States have adequate fiscal space for undertaking extraexpenditure, they appear to have taken a circumspect view bybudgeting only a moderate rise in their expenditure during 2009-10. Given the expected sluggishness in tax and non-tax revenue collections and lower devolutions from the Centre, the States haveapparently planned not to deviate much from their commitmentunder FRLs by proposing big spending plans as counter-cyclicalfiscal measures.
References:
1.Budget Documents of the State Governments.
2.Gopinath, Shyamala (2009), ‘Sub-national Fiscal Reforms andDebt Management—Indian Experience’, RBI Monthly Bulletin,August.
3.World Bank (2005), State Fiscal Reforms in India, Progressand Prospects, MacMillan India Ltd.
Budget Estimates 2009-10 – Key Deficit Indicators
3.12 The consolidated revenue account of State
governments for 2009-10 is budgeted to turn into
deficit after remaining in surplus over the previous
three years on account of a higher budgeted
increase in revenue expenditure in relation to
revenue receipts. The consolidated revenue deficit
is budgeted at Rs.32,295 crore in 2009-10
compared to the revenue surplus of Rs.10,701
crore in 2008-09 (RE). As a ratio to GDP, at the
consolidated level the revenue surplus of 0.2 per
cent in 2008-09 (RE) is budgeted to turn down to a
deficit of 0.5 per cent of GDP in 2009-10. The
deterioration in the revenue account of State
governments during 2009-10 (BE) reflects the
combined impact of sluggishness in tax revenue
along with higher expenditure on: (i) administrative
services (ii) pensions; and (iii) interest payments.
Consequent upon the revenue account turning from
surplus to deficit and the higher net lending in 2009-
10 (BE), the GFD at the consolidated level is
budgeted to increase to 3.2 per cent of GDP as
compared with 2.6 per cent of GDP in 2008-09
(RE). In absolute terms, the size of GFD is
budgeted to expand by 36.3 per cent in 2009-10
(BE) over 2008-09 (RE). In line with the surging
GFD, primary deficit is also likely to double from
Rs. 40,128 crore in 2008-09 (RE) to Rs. 83,083
crore in 2009-10 (BE). As percentage to GDP,
consolidated primary deficit has been budgeted at 1.3 per cent in 2009-10 (BE) as compared with 0.7per cent in 2008-09 (RE) (Table III.4 and Chart III.1).
3.13 Re-emergence of revenue deficit after three
years and the increasing size of the gross fiscal
deficit indicate that borrowed resources would be
used for current expenditures rather than capital
investment during 2009-10. In 2009-10 (BE),
around 16 per cent of the GFD would be used for
undertaking revenue expenditure. This raises the
issue of the quality of fiscal deficit and shows that
this proportion of government borrowing would not
lead to the creation of assets, which would have
given returns in the future to service States’ debts.
However, the revenue deficit (RD)-GFD ratio of 16
per cent is significantly lower than what prevailed at around 60 per cent during 1998-99 to 2002-03.
Nonetheless, this underlies a weakness that
emerged in the profile of State government finances
during 2009-10 albeit due to subdued
macroeconomic conditions and the implementation
of revised wages and salaries. However, this may
prove to be a temporary aberration once the growth
momentum in the economy accelerates and
revenue buoyancy improves further.
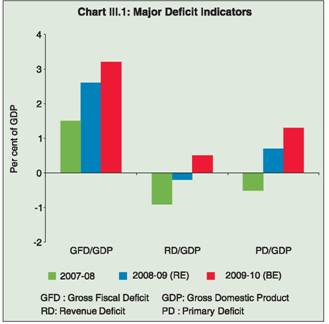 |
Table III.4: Variation in Major Items – 2009-10 (BE) over 2008-09 (RE) |
(Amount in Rs. crore) |
Item |
2008-09 (RE) |
2009-10 (BE) |
Variation |
Contribution* (Per cent) |
Amount |
Per cent |
1 |
2 |
3 |
4 |
5 |
6 |
I. Revenue Receipts (i+ii) |
7,37,865 |
8,04,943 |
67,078 |
9.1 |
100.0 |
(i) Tax Revenue (a+b) |
5,03,878 |
5,52,243 |
48,365 |
9.6 |
72.1 |
(a) Own Tax Revenue |
3,30,405 |
3,66,523 |
36,118 |
10.9 |
53.8 |
of which: Sales Tax |
2,02,610 |
2,25,009 |
22,399 |
11.1 |
33.4 |
(b) Share in Central Taxes |
1,73,473 |
1,85,720 |
12,247 |
7.1 |
18.3 |
(ii) Non-Tax Revenue |
2,33,987 |
2,52,701 |
18,713 |
8.0 |
27.9 |
(a) States Own Non-Tax Revenue |
79,614 |
84,017 |
4,403 |
5.5 |
6.6 |
(b) Grants from Centre |
1,54,373 |
1,68,683 |
14,310 |
9.3 |
21.3 |
II. Revenue Expenditure |
7,27,165 |
8,37,238 |
1,10,074 |
15.1 |
100.0 |
of which: |
|
|
|
|
|
(i) Development Expenditure |
4,45,889 |
4,92,443 |
46,553 |
10.4 |
42.3 |
of which: |
|
|
|
|
|
Education, Sports, Art and Culture |
1,29,706 |
1,54,781 |
25,075 |
19.3 |
22.8 |
Power |
36,715 |
32,020 |
-4,695 |
-12.8 |
-4.3 |
Rural Development |
30,040 |
43,147 |
13,107 |
43.6 |
11.9 |
(ii) Non-Development Expenditure |
2,60,899 |
3,21,907 |
61,008 |
23.4 |
55.4 |
of which: |
|
|
|
|
|
Administrative Services |
57,144 |
74,389 |
17,245 |
30.2 |
15.7 |
Pension |
66,938 |
87,220 |
20,282 |
30.3 |
18.4 |
Interest Payments |
1,06,220 |
1,16,427 |
10,207 |
9.6 |
9.3 |
III. Capital Receipts |
1,86,201 |
2,25,114 |
38,914 |
20.9 |
100.0 |
of which: |
|
|
|
|
|
Non-Debt Capital Receipts |
5,314 |
2,216 |
-3,098 |
-58.3 |
-8.0 |
IV. Capital Expenditure |
2,13,259 |
2,18,540 |
5,281 |
2.5 |
100.0 |
of which: |
|
|
|
|
|
Capital Outlay |
1,57,254 |
1,60,247 |
2,993 |
1.9 |
56.7 |
of which: |
|
|
|
|
|
Capital Outlay on Irrigation & Flood Control |
48,727 |
45,905 |
-2,821 |
-5.8 |
-53.4 |
Capital Outlay on Energy |
18,728 |
15,478 |
-3,251 |
-17.4 |
-61.6 |
Capital Outlay on Transport |
29,614 |
28,859 |
-755 |
-2.5 |
-14.3 |
Memo Item: |
|
|
|
|
|
Revenue Deficit |
-10,701 |
32,295 |
42,996 |
-401.8 |
|
Gross Fiscal Deficit |
1,46,349 |
1,99,510 |
53,161 |
36.3 |
|
Primary Deficit |
40,128 |
83,083 |
42,954 |
107.0 |
|
RE: Revised Estimates. BE: Budget Estimates. * : Denotes percentage share in relevant total.
Note: See Notes to Table III.2.
Source: Budget Documents of the State Governments. |
Revenue Receipts
3.14 The impact of the macroeconomic
slowdown can be gauged from the fact that the
States have budgeted only a moderate rise of 9.1
per cent in revenue receipts in 2009-10 (BE) as
compared with an 18.3 per cent rise recorded in
2008-09 (RE). Growth in all sources of revenue
receipts (except States’ ONTRs) is estimated to be moderate in 2009-10 (BE) as compared with
the previous year. For instance, States’ OTR is
budgeted to rise by 10.9 per cent in 2009-10 as
compared with 15.3 per cent in 2008-09 (RE) while
their share in central taxes is estimated to increase
by 7.1 per cent as compared with a 14.6 per cent
increase in the previous year. The moderate rise
in States’ share in central taxes is in line with the
lower growth in gross tax revenue budgeted at the
Central level. Growth in the consolidated non-tax
revenue of the States is budgeted to decelerate
during 2009-10 mainly on account of grants from
the Centre. Grants from the Centre to the States
are budgeted to increase by 9.3 per cent in 2009-10
as against the rapid increase of 42.1 per cent in
2008-09 (RE). However, growth in States’ ONTR
is budgeted to be marginally higher at 5.5 per cent
during 2009-10 as compared with 3.2 per cent growth in 2008-09 (RE) (Table III.5 and Appendix Table 3).
3.15 Revenue receipts as percentage to GDP
(RR-GDP) are budgeted to marginally decline from
13.2 per cent in 2008-09 (RE) to 13.1 per cent in
2009-10. The slowdown has affected the statutory
transfer of tax revenues from the Centre to the
States. States’ share in Central taxes as
percentage to GDP is estimated to fall from 3.1 per
cent in 2008-09 (RE) to 3.0 per cent in 2009-10
(BE). However, grants-in-aid from the Centre to the
States – a discretionary component of central
transfers—as ratio to GDP are budgeted to decline
from 2.8 per cent in 2008-09 (RE) to 2.7 per cent in
2009-10 (BE). Overall, Central transfers to the
States are budgeted to fall from 5.9 per cent of GDP
in 2008-09 (RE) to 5.7 per cent in 2009-10. On the
States’ own revenue collection front, the ratio of their OTR to GDP is budgeted to remain stagnant
at 5.9 per cent during the same period (Table III.5
and Appendix Table 3). In 2009-10 (BE), revenue
receipts from sales tax/VAT and land revenue as
percentage to GDP are budgeted to remain the
same while the same from stamp duty and
registration fees and State excise duty as
percentage to GDP are estimated to be lower than
2008-09 (RE). Further, the own non-tax revenue
(ONTR)-GDP ratio is budgeted to remain constant
at 1.4 per cent during the same period.
Table III.5: Aggregate Receipts of State Governments |
(Amount in Rs. crore) |
Item |
1990-95 |
1995-00 |
2000-05 |
2005-06 |
2006-07 |
2007-08 |
2008-09
(RE) |
2009-10
(BE) |
Variation (Per cent) |
(Average) |
Col.8/7 |
Col.9/8 |
1 |
2 |
3 |
4 |
5 |
6 |
7 |
8 |
9 |
10 |
11 |
Aggregate Receipts (1+2) |
1,23,415 |
2,31,618 |
4,40,076 |
5,95,627 |
6,73,605 |
7,65,735 |
9,24,066 |
10,30,057 |
20.7 |
11.5 |
|
(16.0) |
(14.8) |
(17.1) |
(16.1) |
(15.7) |
(15.5) |
(16.6) |
(16.7) |
|
|
1. Revenue Receipts (a+b) |
92,679 |
1,65,416 |
2,85,662 |
4,31,020 |
5,30,556 |
6,23,748 |
7,37,865 |
8,04,943 |
18.3 |
9.1 |
|
(12.0) |
(10.7) |
(11.1) |
(11.6) |
(12.4) |
(12.6) |
(13.2) |
(13.1) |
|
|
a. States’ Own Revenue (i+ii) |
55,546 |
1,03,542 |
1,78,171 |
2,60,246 |
3,15,812 |
3,63,723 |
4,10,019 |
4,50,540 |
12.7 |
9.9 |
|
(7.2) |
(6.7) |
(6.9) |
(7.0) |
(7.4) |
(7.4) |
(7.4) |
(7.3) |
|
|
i. States’ Own Tax |
41,158 |
78,733 |
1,41,933 |
2,12,307 |
2,52,548 |
2,86,546 |
3,30,405 |
3,66,523 |
15.3 |
10.9 |
|
(5.3) |
(5.1) |
(5.5) |
(5.7) |
(5.9) |
(5.8) |
(5.9) |
(5.9) |
|
|
ii. States’ Own Non-Tax |
14,388 |
24,809 |
36,238 |
47,939 |
63,263 |
77,178 |
79,614 |
84,017 |
3.2 |
5.5 |
|
(1.8) |
(1.6) |
(1.4) |
(1.3) |
(1.5) |
(1.6) |
(1.4) |
(1.4) |
|
|
b. Central Transfers (i+ii) |
37,133 |
61,874 |
1,07,491 |
1,70,774 |
2,14,744 |
2,60,024 |
3,27,846 |
3,54,403 |
26.1 |
8.1 |
|
(4.8) |
(4.0) |
(4.2) |
(4.6) |
(5.0) |
(5.3) |
(5.9) |
(5.7) |
|
|
i. Shareable Taxes |
19,790 |
37,607 |
61,047 |
94,024 |
1,20,293 |
1,51,402 |
1,73,473 |
1,85,720 |
14.6 |
7.1 |
|
(2.6) |
(2.4) |
(2.4) |
(2.5) |
(2.8) |
(3.1) |
(3.1) |
(3.0) |
|
|
ii. Grants-in Aid |
17,343 |
24,267 |
46,444 |
76,750 |
94,451 |
1,08,622 |
1,54,373 |
1,68,683 |
42.1 |
9.3 |
|
(2.3) |
(1.6) |
(1.8) |
(2.1) |
(2.2) |
(2.2) |
(2.8) |
(2.7) |
|
|
2. Capital Receipts (a+b) |
30,737 |
66,202 |
1,54,415 |
1,64,607 |
1,43,049 |
1,41,987 |
1,86,201 |
2,25,114 |
31.1 |
20.9 |
|
(4.0) |
(4.1) |
(5.9) |
(4.4) |
(3.3) |
(2.9) |
(3.3) |
(3.7) |
|
|
a. Loans from Centre@ |
14,632 |
26,440 |
24,337 |
8,097 |
5,717 |
7,252 |
9,786 |
17,284 |
35.0 |
76.6 |
|
(1.9) |
(1.7) |
(1.0) |
(0.2) |
(0.1) |
(0.1) |
(0.2) |
(0.3) |
|
|
b. Other Capital Receipts |
16,104 |
39,762 |
1,30,078 |
1,56,510 |
1,37,331 |
1,34,736 |
1,76,414 |
2,07,830 |
30.9 |
17.8 |
|
(2.1) |
(2.4) |
(4.9) |
(4.2) |
(3.2) |
(2.7) |
(3.2) |
(3.4) |
|
|
RE: Revised Estimates. BE: Budget Estimates.
@ With the change in the system of accounting with effect from 1999-2000, States’ share in small savings which was included earlier under loans from
Centre is included under internal debt and shown as special securities issued to National Small Savings Fund (NSSF) of the Central Government. The
data for the years prior to 1999-2000 as reported in this Table, however, exclude loans against small savings, for the purpose of camparability.
Note: 1. The 5-year averages have been provided for a more meaningful comparison across periods.
2. Figures in parentheses are percentages to GDP.
3. Capital Receipts include public accounts on a net basis. Also see Notes to Appendices.
Source: Budget Documents of the State Governments. |
3.16 Implementation of VAT across most of the
States has helped them to augment their sales tax/
VAT-GDP ratio in recent years. During 2009-10,
sales tax/VAT are budgeted to contribute around
61 per cent of the total own tax revenue collections
of States. Although sales tax/VAT as a ratio to GDP
is budgeted to increase marginally from 3.6 per cent
in 2008-09 (RE) to 3.7 per cent in 2009-10 (BE),
growth in sales tax/VAT is estimated to decelerate
from 16.8 per cent in 2008-09 (RE) to 11.1 per cent
in 2009-10 reflecting the possible impact of a
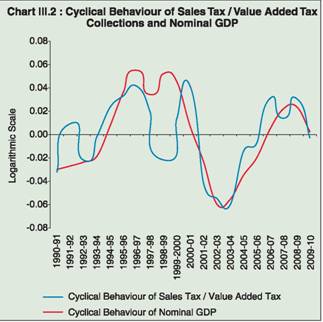
perceived subdued growth. In fact, correlation
between the cyclical behavior of sales tax/VAT
collections and nominal GDP is found to be
statistically significant3 (Chart III.2).
 |
3.17 Goods and services tax (GST) has been
proposed to be implemented from April 1, 2010. The
implementation of GST is however, likely to be
postponed to a future date. Implementation of GST
would be a significant step towards tax reforms. GST
will replace excise duty and service tax at the Centre
and VAT at the state level. The Empowered
Committee of State Finance Ministers has been
entrusted with the task of preparing a model and a
roadmap for GST in India. A well-designed GST is
supposed to lower manufacturing costs and make
businesses more efficient. It is also expected that
the introduction of GST would introduce buoyancy
in revenues both by widening the tax base and by
stimulating economic growth due to lower
compliance costs and lower effective tax rates on a
wider base (Box III.4).
3.18 Within non-tax revenues, interest receipts by
State governments are budgeted to decline by 21.5
per cent in 2009-10 as compared with an increase of
31.1 per cent in 2008-09 (RE) while non-tax revenue
on account of economic services is budgeted to rise
marginally by 4.4 per cent in 2009-10 as compared
with 18.6 per cent in 2008-09 (RE) (Appendix Table
3). At present, States’ own non-tax revenues account
for 10 per cent of the total revenue receipts of the
State governments which appears to be low by
international standards. The States need to increase
their reliance on non-tax revenues by levying
appropriate user charges. This is essential for two
reasons. First, the States depend mainly on their own
tax revenues and Central transfers in the form of
share in Central taxes and grants for their revenue
receipts which are potentially vulnerable to a
slowdown in economic growth. Furthermore, the
capacity of States to generate their own resources is
also subject to their ability and mandate to raise taxes.
Thus, in order to have a more durable source of
revenue, the States need to expand their non-tax
revenue bases by levying appropriate user charges.
Second, appropriate user charges help to provide
market-based incentives to encourage or discourage
the use of public resources. Thus, user charges based
on the cost recovery principle would help in achieving
more responsible use of economic services.
Box III.4: Goods and Services Tax in India - The Present Status
The world over, goods and services attract the same rate of tax
and that is the foundation of a Goods and Services Tax (GST).
GST is basically a comprehensive value added tax (VAT) on goods
and services levied and collected on the value added at each stage
of sale and purchase wherein the manufacturers and dealers claim
credit for an ‘input tax’, while the final consumer bears the incidence
of the full tax. GST is being very commonly used in a large number
of advanced countries. Value addition in the production and sale of
many products requires inputs of both goods and services which
may be packaged indistinctly and a ‘unified rate of tax’ levied on
goods and services. GST, thus, removes the infirmities of a tax
system and allows the industries and the economy to function
efficiently and smoothly.
Literature reveals that among the federal countries, there are three
models of GST: viz., a) collection at the federal level; b) collection
at the sub-national level; and c) dual level of GST. The third model
in turn has three variants: 1) collected by the federal government
though the constitutional authority is vested with both tiers of
governments; 2) independent GST collected by the two tiers of
governments; and 3) a single harmonised rate on a common base
administered by the States. Although by definition, a centralized
GST provides harmonization of tax rates and exemptions, divergent
views are expressed by fiscal experts in contemporary literature.
According to one view, a dual-VAT, a variant of the Québec Service
Tax-GST model of Canada, seems to be the most promising
alternative in India (Poddar, 2009). It is viewed that centralization
of sales taxation is not essential as evidenced in the experiences
of Canada with VAT and of the US with income taxes; Central and
State taxes can exist side by side.
In India, beginning with the early 1990s, there has been tremendous
achievement on the indirect taxes front. However, the
implementation of GST would be a ‘landmark’ tax reform. The basic
objective of indirect tax reforms is to have a comprehensive VAT in
the form of a harmonised GST. It is expected that GST would result
in a major rationalization and simplification of the consumption tax
structure at both the Centre and the State levels. It is believed that
the GST regime will bring about a phased change on the tax
firmament by redistributing the burden of taxation equitably between
manufacturing and services (Kelkar, 2009).
The Union Budget 2007-08 announced that India should move towards a
national level GST by April 1, 2010, and an Empowered Committee of
State Ministries with Central Government would prepare a roadmap for
the introduction of GST in India. Accordingly, the Government of India
released a Discussion Paper on GST on November 10, 2009. In a federal
system like India, a mechanism for upholding the States’ autonomy is
given priority while working out a harmonious structure. The salient features
of the proposed GST model are:
i) A dual GST structure (one for Central GST and State GST
statute for every State) with defined functions and
responsibilities of the Centre and the States, to be binding on
both the Centre and the States.
ii) Provision for a collectively agreed Constitutional amendment,
if necessary, is also being worked out.
iii) Basic features of law such as chargeability, definition of a
taxable event and taxable person, measure of levy including
valuation provisions and basis of classification would be uniform
across these statutes as far as practicable.
iv) All transactions of goods and services will attract both Central
GST and the State GST except on those exempted.
v) Cross-utilization of Input Tax Credit (ITC) between the Central
GST and the State GST would not be allowed except in the
case of inter-State supply of goods and services. To the extent
feasible, a uniform procedure for collection of both Central GST
and State GST would be prescribed in the respective legislations
for Central GST and State GST.
vi) The various Central, State and local levies, which are in the
nature of indirect taxes, are to be identified for being subsumed
under GST. However, the taxes, levies and fees that are not
specifically related to supply of goods and services should not
be subsumed under GST.
vii) On exports, zero rating is proposed, while imports will attract
CGST and SGST, on a destination principle and no benefit to
sales from an SEZ to Domestic Tariff Area (DTA) will be allowed.
viii) The Thirteenth Finance Commission to take up the issue of
providing adequate compensation for any loss that might
emerge during the process of implementation of GST for the
next five years.
ix) A threshold of gross annual turnover of Rs.10 lakh both for
goods and services for all the States and Union Territories may
be adopted with adequate compensation for the States (the
States in the North-Eastern region and Special Category
States).
x) In the case of Inter-State Transactions of Goods and Services,
the Working Group recommended the adoption of the IGST
model, wherein the Centre would levy IGST which would be
CGST plus SGST on all inter-State transactions of taxable
goods and services. The inter-State seller will pay IGST on
value addition after adjusting available credit of IGST, CGST,
and SGST on his purchases. The exporting State will transfer
to the Centre the credit of SGST and the importing dealer will
claim credit of IGST.
xi) Adopting a two-rate structure (for both CGST and SGST), viz.,
a lower rate for necessary items and goods of basic importance and a standard rate for goods in general and a special rate for
precious metals and a list of exempted items.
xii) For taxation of services, however, there may be a single rate for
both CGST and SGST. The exact value of the SGST and CGST
rates, including the rate for services, is being worked out.
Internationally, the highest GST rates are in Sweden and Denmark
at 25 per cent. Countries at the higher end of the tax rate are Iceland
at 24.5 per cent and Finland at 22 per cent. At the lower end,
Switzerland, Japan, Thailand and Singapore have GST/VAT rates
at 5 per cent or marginally above. Most countries have GST/VAT
rates that are less than 20 per cent. For example, in the UK the
VAT rate is 17.5 per cent, it is 16 per cent in Spain, 18 per cent in
Russia, 19.6 per cent in France and 19 per cent in Germany. Canada
is a federal country where both federal and provincial GST rates
are charged. The combined incidence of federal and provincial rates
varies between 6 per cent and 14 per cent.
Subsequently, a Task Force appointed by the Thirteenth Finance
Commission recommended inter alia, for the transformation of the
Empowered Committee of State Finance Ministers into a permanent
constitutional body known as the ‘Council of Finance Ministers’
comprising of Union Minister and all State Finance Ministers. This
is to ensure that neither Center nor the State unilaterally make any
change in the agreed design of GST. However, incase of any exigencies, member state or the Center may take immediate steps
subject to ex-post de facto approval by the Council within one month.
Further, as the GST is primarily intended as an exercise in
reforming the consumption tax in India and not an exercise for
additional resource mobilization through discretionary changes, the
CGST and SGST rates should be of ‘revenue neutral rate’ (RNR)
so as to yield same revenue collected as before.
References:
1. Bagchi, Amaresh (2006), ‘Towards GST: Choices and Trade-
Offs’, Economic and Political Weekly April 8.
2. Government of India (2007), ‘Finance Minister Budget Speech’,
February 28.
3. Government of India, (2009), ‘First Discussion Paper on Goods
and Service Tax in India’, The Empowered Committee of State
Finance Ministers, New Delhi, November 10.
5. Kelkar, Vijay (2009), ‘GST for Accelerated Economic Growth
and Competitiveness’, Special Address at III National
Conference New Delhi.
6. Poddar, S. and Ehtisham Ahmed (2009), ‘GST Reforms and
Intergovernmental Considerations in India’, Working Paper ,
DoE, Ministry of Finance, Government of India, March.
7. Srivastava, D.K (2007), ‘A Roadmap to Goods and Services
Tax’, The Hindu Business Line, August 13.
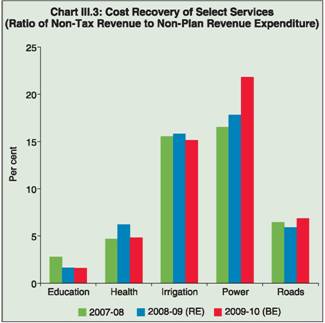
3.19 As far as the cost recovery aspect at the
State level is concerned, it is estimated to be lower
in 2009-10 in case of social services as compared
with 2007-08. Among economic services, there has
been substantial improvement in the power sector
in recent years which is likely to continue in 2009-10
(BE). Similarly, the recovery rate in the road sector
is also estimated to improve in 2009-10 (BE). Cost
recovery in the irrigation sector recorded a steady
improvement during 2006-07 to 2008-09 (RE)
which, however, is likely to witness a slippage in
2009-10 (BE) (Table III.6 and Chart III.3). (Table III.6 and Chart III.3).
Revenue Expenditure
3.20 Growth in the consolidated revenue
expenditure of State governments is budgeted to
decelerate from 25.2 per cent in 2008-09 (RE) to
15.1 per cent in 2009-10 (BE). However, as a ratio
to GDP, revenue expenditure is budgeted to
increase from 13.0 per cent to 13.6 per cent during
the same period. While development revenue
expenditure is budgeted to increase by 10.4 per
cent in 2009-10 (BE), non-development revenue
expenditure would increase by 23.4 per cent. In 2009-10 (BE), increase in development revenue
expenditure is budgeted to grow mainly on account
of social services comprising education, sports, art
and culture and medical, public health and family
welfare. However, revenue expenditure on housing
is budgeted to decline by 30.8 per cent in 2009-10
(BE). Among the economic services, the States
have budgeted significantly higher expenditure on
rural development, irrigation and flood control. Rise
in non-development expenditure would contribute
around 55.4 per cent of the increase in revenue expenditure in 2009-10 (BE). Increase in budgeted
expenditure on committed expenditure comprising
pensions, administrative services and interest
payments would contribute 78.2 per cent of the total
increase in the non-development expenditure.
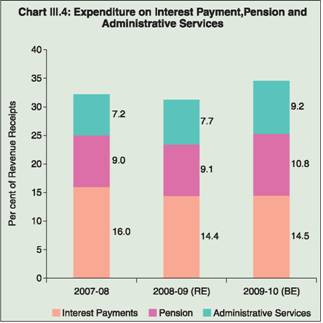
Committed expenditure as a ratio to revenue
receipts is also budgeted to increase from 31.2 per
cent in 2008-09 (RE) to 34.5 per cent in 2009-10
(BE) (Chart III.4).
Table III.6: Cost Recovery of Select Services
(Ratio of Non-Tax Revenue to Non-Plan Revenue Expenditure) |
(Per cent) |
Item |
2000-01 |
2001-02 |
2002-03 |
2003-04 |
2004-05 |
2005-06 |
2006-07 |
2007-08 |
2008-09
(RE) |
2009-10
(BE) |
1 |
2 |
3 |
4 |
5 |
6 |
7 |
8 |
9 |
10 |
11 |
A. Social Services |
|
|
|
|
|
|
|
|
|
|
of which: |
|
|
|
|
|
|
|
|
|
|
(a) Education $ |
1.2 |
1.3 |
1.6 |
1.8 |
2.1 |
2.8 |
2.6 |
2.8 |
1.6 |
1.6 |
(b) Health * |
4.6 |
6.2 |
5.4 |
4.7 |
6.2 |
4.7 |
5.1 |
4.7 |
6.2 |
4.8 |
B. Economic Services |
|
|
|
|
|
|
|
|
|
|
of which: |
|
|
|
|
|
|
|
|
|
|
(a) Irrigation # |
8.1 |
7.5 |
8.4 |
15.3 |
16.4 |
14.5 |
15.0 |
15.5 |
15.8 |
15.2 |
(b) Power |
6.5 |
6.5 |
9.7 |
2.8 |
11.7 |
12.3 |
16.7 |
16.5 |
17.8 |
21.8 |
(c) Roads @ |
16.3 |
19.6 |
15.6 |
21.5 |
14.6 |
11.6 |
7.6 |
6.5 |
5.9 |
6.9 |
RE: Revised Estimates. BE: Budget Estimates.
$ : Also includes expenditure on sports, art and culture.
* : Includes expenditure on medical and public health and family welfare.
# : Relates to irrigation and flood control for non-plan revenue expenditure while it pertains to major, medium and minor irrigation for non-tax revenue.
@ : Relates to roads and bridges for non-plan revenue expenditure while it pertains to road transport for non-tax revenue.
Note: Accounting in respect of power sector has not been uniform across the States which has, at times, resulted in adjustment across years. Hence, the
ratios may show fluctuations. Moreover, States have had one-time non-tax receipts under power, such as Rs.2,749 crore grants received by Madhya
Pradesh State Electricity Board (SEB) as per the Ahluwalia Committee recommendation during 2003-04 that was returned to the Government of
Madhya Pradesh in 2004-05, have been excluded. Further, receipts from Rural Electrification Corporation (REC) that are not in the nature of non-
tax such as Rs.240 crore in 2004-05, in case of Government of Uttar Pradesh and Rs.134 crore in 2004-05 for the Government of Uttarakhand, have
been excluded.
Source: Compiled from the Budget Documents of the State Governments. |
 |
 |
Capital Receipts
3.21 At a consolidated level, the States have
budgeted an increase of 20.9 per cent in capital
receipts for 2009-10 as compared with a 31.1 per
cent increase in 2008-09 (RE) mainly on account of
market loans and special securities issue to National
Small Savings Fund (NSSF), loans from the Centre
and small saving and provident funds. During 2009-
10, the States have budgeted loans from the Centre
to the extent of Rs. 17,284 crore [an increase of 76.6
per cent over 2008-09 (RE)] as compared with Rs.
9,786 crore (an increase of 35.0 per cent) in the
previous year. Similarly, NSSF receipts are budgeted
to increase by 85.0 per cent in 2009-10 (BE). Small
savings and provident fund are also estimated to
increase by 48.0 per cent in 2009-10 (BE) over the
previous year. However, capital receipts with respect
to the recovery of loans and advances are budgeted
to decline sharply by 60.2 per cent as compared with
an increase of 48.9 per cent in the previous year (Table III.5 and Appendix Table 5).
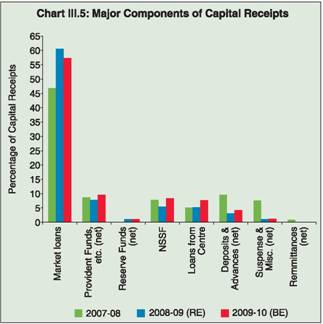
3.22 With States’ increasing dependence on
market borrowings for financing their GFD in recent
years in line with the recommendations of the
TwFC, there are signs of the declining share of
NSSF and loans from the Centre in the States’ total
capital receipts. However, their respective share
is estimated to be higher, albeit marginally, in 2009-
10 (Chart III.5). Deposits and advances (net), which include deposits bearing interest as well as those not bearing interest, are also budgeted to increase by 65.1 per cent in 2009-10 over 2008-09 (RE) contributing about 10 per cent to the total capital receipts. In addition, the three States of Karnataka,Uttarakhand and Haryana have budgeted to mobilise capital receipts by sale of land (disinvestment). In 2008-09, two States, which had proposed to mobilise Rs.15,000 crore throughdis investment (sale of land), were able to realise only one-third of the total budgeted amount. Non-debt capital receipts are budgeted to be lower by 58.3 per cent than 2008-09 (RE).
 |
Capital Expenditure
3.23 As mentioned in the foregoing discussion,
the scope of a counter-cyclical fiscal measure
increases during the phase of an economic
slowdown as governments try to revive the
economies by relaxing tax rates and enhancing
public expenditure. During the current phase of the
global slowdown, according to an estimate by the
International Monetary Fund (IMF), the fiscal
stimulus measures announced so far consist of
one-third revenue measures and two-third
expenditure measures. In the Indian case, given
the subdued growth prospects, the Centre allowed
State governments to raise additional market
borrowings to the extent of 0.5 per cent of GSDP
in 2008-09 and further 0.5 per cent in 2009-10. The
purpose of this was to encourage the States to
undertake additional capital investments and boost
domestic aggregate demand. However, budget
estimates for 2009-10 for capital expenditure do
not seem to reflect these developments. During 2009-10 (BE), States’ capital expenditure is
budgeted to grow by 2.5 per cent, as compared
with the sharp rise of 24.3 per cent in 2008-09 (RE).
Capital expenditure as a ratio to GDP is budgeted
to decline from 3.8 per cent in 2008-09 (RE) to 3.5
per cent in 2009-10 (BE). The growth in capital
outlay is budgeted to decelerate to 1.9 per cent in
2009-10 as compared with 32.3 per cent in 2008-09
(RE). Capital outlay as a ratio to GDP is budgeted
to fall from 2.8 per cent in 2008-09 (RE) to 2.6 per
cent in 2009-10. In absolute terms, while capital
outlay on economic services is budgeted to grow
by 2.2 per cent as compared with 28.9 per cent
growth in 2008-09 (RE), the same on social
services is budgeted to decline by 0.3 per cent in
2009-10 as against the 49.1 per cent rise in 2008-
09 (RE). Similarly, loans and advances by the State
governments for developmental purposes are
budgeted to decline by 17.3 per cent in 2009-10 as
compared with an increase of 16.9 per cent in 2008-
09 (RE). The amount that the States have budgeted
for repaying internal debt during 2009-10 is higher
by 16.0 per cent over the previous year. Thus, the
proposed capital outlay pattern of State
governments during 2009-10 does not show any
explicit counter-cyclical effort by the State
governments to attenuate the concerns of the
slowdown (Table III.7 and Appendix Table 6). In
fact, during 2009-10, the consolidated capital
expenditure of State governments in absolute terms
is budgeted to be lower than the capital receipts.
Thus, unlike in the previous three years, capital
receipts are budgeted to be used for meeting
revenue deficit in 2009-10. Given the fact that
budget estimates are subject to substantial
revisions, the situation that evolves in the revised
estimates may be different, provided the economy
picks up rapidly and tax collections accelerate and
improve the revenue account position of the States.
Devolution and Transfer of Resources from the Centre
3.24 The impact of the overall macroeconomic
slowdown would have implications for resource
transfers from the Centre to the States. This is
evident from the gross devolution and transfers of
resources from the Centre (i.e., sharable taxes,
grants and loans and advances) that are budgeted to increase by 10.1 per cent in 2009-10 as
compared with 26.3 per cent in 2008-09 (RE)
(Appendix Table 7). Deceleration in growth of
grants from the Centre is budgeted to be more
pronounced as compared to the share in Central
taxes. As a ratio to GDP, gross devolution and
transfers from the Centre decline marginally from
6.1 per cent in 2008-09 (RE) to 6.0 per cent in 2009-
10 (BE). In 2009-10 (BE), gross devolution and
transfers from the Centre would finance 35.2 per
cent of the aggregate disbursements of the States
as compared with 35.9 per cent in 2008-09 (RE).
Table III.7: Expenditure Pattern of State Governments |
(Amount in Rs. crore) |
Item |
1990-95 |
1995-00 |
2000-05 |
2005-06 |
2006-07 |
2007-08 |
2008-09(RE) |
2009-10(BE) |
Variation (Per cent) |
(Average) |
Col.8/7 |
Col.9/8 |
1 |
2 |
3 |
4 |
5 |
6 |
7 |
8 |
9 |
10 |
11 |
Aggregate Expenditure (1+2 = 3+4+5) |
1,22,270 |
2,33,441 |
4,37,299 |
5,61,682 |
6,57,280 |
7,52,324 |
9,40,423 |
10,55,778 |
25.0 |
12.3 |
(15.9) |
(14.9) |
(17.0) |
(15.2) |
(15.3) |
(15.2) |
(16.9) |
(17.1) |
|
|
1. |
Revenue Expenditure |
98,009 |
1,93,816 |
3,40,752 |
4,38,034 |
5,05,699 |
5,80,805 |
7,27,165 |
8,37,238 |
25.2 |
15.1 |
|
of which: |
(12.7) |
(12.4) |
(13.3) |
(11.8) |
(11.8) |
(11.7) |
(13.0) |
(13.6) |
|
|
|
Interest payments |
13,605 |
31,421 |
69,685 |
84,024 |
93,180 |
99,831 |
1,06,220 |
1,16,427 |
6.4 |
9.6 |
|
|
(1.7) |
(2.0) |
(2.7) |
(2.3) |
(2.2) |
(2.0) |
(1.9) |
(1.9) |
|
|
2. |
Capital Expenditure |
24,261 |
39,625 |
96,547 |
1,23,648 |
1,51,582 |
1,71,520 |
2,13,259 |
2,18,540 |
24.3 |
2.5 |
|
of which: |
(3.2) |
(2.5) |
(3.6) |
(3.3) |
(3.5) |
(3.5) |
(3.8) |
(3.5) |
|
|
|
Capital outlay |
11893 |
21,044 |
41856 |
77,559 |
98063 |
1,18,862 |
1,57,254 |
1,60,247 |
32.3 |
1.9 |
|
|
(1.5) |
(1.4) |
(1.6) |
(2.1) |
(2.3) |
(2.4) |
(2.8) |
(2.6) |
|
|
3. |
Development Expenditure |
81,989 |
1,45,852 |
2,39,576 |
3,30,044 |
3,92,165 |
4,64,462 |
6,13,011 |
6,59,075 |
32.0 |
7.5 |
|
|
(10.7) |
(9.4) |
(9.4) |
(8.9) |
(9.2) |
(9.4) |
(11.0) |
(10.7) |
|
|
4. |
Non-Development Expenditure |
33,734 |
76,035 |
1,50,715 |
1,90,021 |
2,11,872 |
2,33,233 |
2,67,709 |
3,29,315 |
14.8 |
23.0 |
|
|
(4.3) |
(4.8) |
(5.9) |
(5.1) |
(4.9) |
(4.7) |
(4.8) |
(5.3) |
|
|
5. |
Others* |
6547 |
11,554 |
47,009 |
41,617 |
53,243 |
54,630 |
59,703 |
67,388 |
9.3 |
12.9 |
|
|
(0.9) |
(0.7) |
(1.7) |
(1.1) |
(1.2) |
(1.1) |
(1.1) |
(1.1) |
|
|
Avg.: Average. RE: Revised Estimates. BE: Budget Estimates.
*: Includes repayment of loans to Centre, discharge of internal debt, grants-in-aid and contributions (compensation and assignments to local bodies).
Note: 1. The 5-year averages have been provided for a more meaningful comparison across periods.
2. Figures in brackets are percent to GDP.
3. Capital Expenditure is given exclusive of Public Accounts. Also see Notes to Appendices.
Source: Budget Documents of the State Governments. |
Developmental and Non-Developmental Expenditure4
3.25Aggregate development expenditure (both revenue and capital) as a ratio to GDP is budgeted to be lower at 10.7 per cent in 2009-10 as compared with 11.0 per cent in 2008-09 (RE) (Chart III.6).Aggregate development expenditure is budgeted to rise by 7.5 per cent in 2009-10 as compared with 32.0 per cent in 2008-09 (RE) (Appendix Table 8).Further more, the share of development expenditure in aggregate disbursements of the States isestimated to decline from 65.2 per cent in 2008-09 (RE) to 62.4 per cent in 2009-10 (BE) (Table III.8).
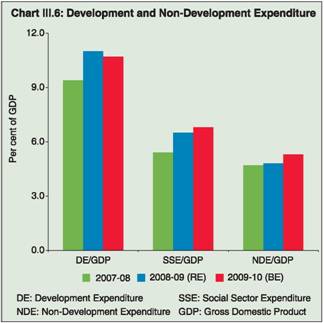 |
Table III.8: Development Expenditure
vis-à-vis Total Expenditure |
(Amount in Rs. crore) |
Year |
Develop-
ment
Revenue
Expenditure |
Develop-
ment
Capital
Outlay |
Develop-
ment
Loans &
Advances |
Total
Development
Expenditure |
1 |
2 |
3 |
4 |
5 |
2007-08 |
3,37,337 |
1,13,584 |
13,540 |
4,64,462 |
|
(44.8) |
(15.1) |
(1.8) |
(61.7) |
2008-09 (RE) |
4,45,889 |
1,51,074 |
16,048 |
6,13,011 |
|
(47.4) |
(16.1) |
(1.7) |
(65.2) |
2009-10 (BE) |
4,92,443 |
1,53,526 |
13,106 |
6,59,075 |
|
(46.6) |
(14.5) |
(1.2) |
(62.4) |
RE: Revised Estimates.
BE: Budget Estimates.
Note: Figures in brackets
are percent to aggregate expendiutre.
Source: Budget Documents of the State Governments. |
3.26 The growth rate in all major heads under
developmental expenditure, except rural
development, is budgeted to decline in 2009-10.
While non-developmental revenue expenditure is
budgeted to increase at an accelerated growth of
23.4 per cent in 2009-10 as compared with 14.8 per
cent in 2008-09 (RE), the same on capital account
is proposed to decline from 13.5 per cent in 2008-09
(RE) to 8.8 per cent in 2009-10 (BE). Committed
expenditure as a ratio to total revenue expenditure
is also estimated to be marginally higher at 33.2 per
cent in 2009-10 (BE) as compared with 31.7 per cent
in 2008-09 (RE). Committed expenditure, accounting
for about 87.0 per cent in total non-plan nondevelopmental
expenditure, is budgeted to rise by
20.7 per cent in 2009-10 as compared with 14.7 per
cent in 2008-09 (RE) (Appendix Tables 9 to 14).
Social Sector Expenditure5
3.27 There has been a steady increase in social sector expenditure (SSE) at the State level,particularly since 2003-04. Although SSE is budgeted to grow at a modest rate of 15.7 per cent in 2009-10 as compared with 35.6 per cent in 2008-09 (RE), the SSE-GDP ratio will increase from 6.5 per cent to 6.8 per cent during the same period. Similarly, the share of SSE in total expenditure (TE)is budgeted to be marginally higher at 39.4 per cent in 2009-10 as against 38.3 per cent in 2008-09 (RE) which is substantially higher than the average of the first half of the 2000s (Chart III.7 and Table III.9).
3.28 It may be seen from Table III.10 that around 85.6 per cent of the total SSE would be spent in the form of revenue expenditure in 2009-10 as compared with 86.0 per cent in 2008-09 (RE) while the share of capital outlay in total SSE would be marginally higher during the same period. However, the share of loans and advances provided for social sector expenditure is budgeted to decline from 2.4 per centin 2008-09 (RE) to 1.7 per cent in 2009-10 (Table III.10). Both revenue as well capital account components of SSE are budgeted to rise at a mode strate in 2009-10 as compared with the previous year.The growth in all major categories of social service sunder SSE is estimated to decelerate or decline in2009-10 (BE) (Appendix Table 15). Aggregate social services (including revenue, capital outlay and loans and advances of the State governments) are estimated to record a modest growth of 10.1 per centin 2009-10 (BE) as against a 36.4 per cent growth in 2008-09 (RE). In contrast, growth in economic services (including revenue, capital outlay and loans and advances of the State governments) is budgeted to double from 29.5 per cent in 2008-09 (RE) to 57.7per cent in 2009-10 mainly due to a sharp increase in budgeted expenditure for rural development.
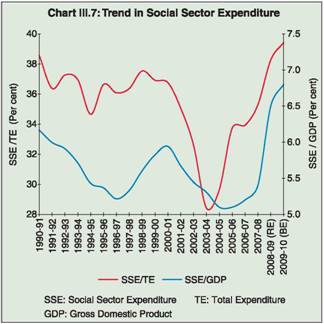 |
Table III.9: Trend in Aggregate Social Sector Expenditure of State Governments |
(Per cent) |
Item |
1990-95 |
1995-00 |
2000-05 |
2005-06 |
2006-07 |
2007-08 |
2008-09
(RE) |
2009-10
(BE) |
(Average) |
1 |
2 |
3 |
4 |
5 |
6 |
7 |
8 |
9 |
TE/GDP |
15.9 |
14.9 |
17.0 |
15.2 |
15.3 |
15.2 |
16.9 |
17.1 |
SSE/GDP |
5.8 |
5.5 |
5.5 |
5.1 |
5.2 |
5.4 |
6.5 |
6.8 |
SSE/TE |
36.8 |
36.7 |
32.5 |
33.7 |
33.9 |
35.3 |
38.3 |
39.4 |
RE: Revised Estimates. BE: Budget Estimates.
GDP: Gross Domestic Product.
TE: Total Expenditure. SSE: Social Sector Expenditure.
Source: Budget Documents of the State Governments. |
3.29 The composition of social services shows
that education, sports and art and culture would continue to dominate with 45.5 per cent share,followed by medical and public health, social security and welfare. Among the major categoriesof social services, the respective shares ofeducation, sports and art and culture; medical andpublic health; and social security and welfare are budgeted to increase in the total social servicesexpenditure during 2009-10, while the share ofurban development, water supply and sanitation;welfare of SCs, ST and OBCs; housing andexpenditure on natural calamities are estimated torecord a decline (Table III.11).
Table III.10: Trend in Composition of Social Sector Expenditure |
(Per cent to SSE) |
Item |
Revenue Expenditure |
Capital Outlay |
Loans
and
Advances |
Total (2+3+4) |
Item |
Revenue Expenditure |
Capital Outlay |
Loans
and
Advances |
Total (2+3+4) |
1 |
2 |
3 |
4 |
5 |
1 |
2 |
3 |
4 |
5 |
1990-91 to 1994-95 |
|
|
|
|
2006-07 |
|
|
|
|
(Average) |
|
|
|
|
Social Services |
78.3 |
7.8 |
1.6 |
87.7 |
Social Services |
78.9 |
3.8 |
2.4 |
85.1 |
|
|
|
|
|
Rural Development |
13.6 |
0.4 |
|
14.0 |
Rural Development |
8.7 |
2.4 |
- |
11.1 |
| Food Storage and Warehousing |
0.7 |
0.1 |
|
0.9 |
Food Storage and Warehousing |
0.8 |
-0.1 |
0.5 |
1.2 |
Total |
93.3 |
4.3 |
2.4 |
100.0 |
Total |
87.7 |
10.1 |
2.1 |
100.0 |
1995-96 to 1999-00 |
|
|
|
|
2007-08 |
|
|
|
|
(Average) |
|
|
|
|
Social Services |
76.8 |
8.7 |
2.3 |
87.7 |
Social Services |
82.2 |
4.0 |
2.0 |
88.2 |
Rural Development |
8.4 |
2.2 |
- |
10.5 |
Rural Development |
10.2 |
0.4 |
- |
10.6 |
Food Storage and Warehousing |
0.8 |
0.4 |
0.5 |
1.7 |
| Food Storage and Warehousing |
1.1 |
0.1 |
0.1 |
1.2 |
|
|
|
|
|
Total 2000-01 to 2004-05 |
93.4 |
4.5 |
2.1 |
100.0 |
Total 2008-09 (RE) |
85.9 |
11.2 |
2.8 |
100.0 |
(Average) |
|
|
|
|
Social Services |
76.7 |
9.5 |
2.1 |
88.3 |
Social Services |
80.8 |
5.5 |
2.0 |
88.3 |
Rural Development |
8.3 |
1.8 |
- |
10.2 |
Rural Development |
8.7 |
1.6 |
- |
10.2 |
Food Storage and Warehousing |
0.9 |
0.3 |
0.4 |
1.5 |
Food Storage and Warehousing |
0.8 |
0.5 |
0.1 |
1.4 |
|
|
|
|
|
|
|
|
|
|
Total |
86.0 |
11.6 |
2.4 |
100.0 |
Total |
90.3 |
7.6 |
2.1 |
100.0 |
2009-10 (BE) |
|
|
|
|
Social Services |
78.4 |
7.5 |
1.6 |
87.5 |
Social Services |
74.4 |
8.2 |
1.4 |
84.0 |
Rural Development |
9.3 |
2.1 |
- |
11.4 |
Rural Development |
10.4 |
4.4 |
- |
14.8 |
|
|
|
|
|
Food Storage and Warehousing |
0.8 |
- |
0.3 |
1.2 |
Food Storage and Warehousing |
0.9 |
0.1 |
0.2 |
1.1 |
|
|
|
|
|
Total |
88.6 |
9.6 |
1.8 |
100.0 |
Total |
85.6 |
12.7 |
1.7 |
100.0 |
SSE: Social Sector Expenditure. ‘–’ : Nil/Negligible. RE: Revised Estimates. BE: Budget Estimates.
Note: Totals may not add up due to rounding off of figures.
Source: Budget Documents of the State Governments. |
Table III.11: Expenditure on Social Services (Revenue and Capital Accounts) – Composition |
(Per cent to expenditure on social services) |
Item |
1990-95 |
1995-00 |
2000-05 |
2005-06 |
2006-07 |
2007-08 |
2008-09 |
2009-10 |
(Average) |
|
|
|
(RE) |
(BE) |
1 |
2 |
3 |
4 |
5 |
6 |
7 |
8 |
9 |
Expenditure on Social Services (a to l) |
100.0 |
100.0 |
100.0 |
100.0 |
100.0 |
100.0 |
100.0 |
100.0 |
(a) Education, Sports, Art and Culture |
52.2 |
52.4 |
51.4 |
48.2 |
47.0 |
44.7 |
42.6 |
45.5 |
(b) Medical and Public Health |
16.0 |
12.6 |
11.7 |
11.6 |
11.4 |
10.9 |
10.6 |
10.8 |
(c) Family Welfare |
- |
2.5 |
2.0 |
1.7 |
1.6 |
1.5 |
1.6 |
1.7 |
(d) Water Supply and Sanitation |
7.3 |
7.5 |
7.7 |
8.2 |
7.9 |
8.2 |
7.0 |
6.6 |
(e) Housing |
2.9 |
2.9 |
2.9 |
2.3 |
2.7 |
3.8 |
4.2 |
2.4 |
(f) Urban Development |
2.3 |
2.6 |
3.7 |
4.2 |
5.7 |
7.2 |
8.9 |
8.6 |
(g) Welfare of SCs, ST and OBCs |
6.6 |
6.5 |
6.5 |
7.1 |
6.9 |
7.1 |
7.3 |
6.3 |
(h) Labour and Labour Welfare |
1.4 |
1.3 |
1.0 |
1.0 |
1.3 |
1.0 |
1.0 |
1.0 |
(i) Social Security and Welfare |
4.5 |
4.2 |
5.1 |
5.7 |
6.7 |
7.8 |
8.9 |
9.3 |
(j) Nutrition |
1.7 |
2.8 |
2.1 |
2.4 |
2.5 |
2.7 |
2.9 |
3.9 |
(k) Expenditure on Natural Calamities |
2.6 |
2.9 |
3.8 |
5.2 |
4.0 |
2.9 |
3.2 |
1.6 |
(l) Others |
2.5 |
2.0 |
2.1 |
2.3 |
2.3 |
2.4 |
2.0 |
2.2 |
RE: Revised Estimates. BE: Budget Estimates. ‘–’: Not available.
Source: Budget Documents of the State Governments. |
Expenditure on Operations and Maintenance and Wages and Salaries
3.30 State governments generally incurexpenses on the administration, supervision,operation, maintenance, preservation and protection of physical assets. Although the TwFC had emphasised on increasing the level of expenditure on the maintenance of assets and also recommended specific grants for this purpose, the proportion of operations and maintenance expenditure in the total revenue expenditure would continue to decline to 6.8 per cent in 2009-10 from 9.3 per cent each in 2007-08 (Accounts) and 2008-09 (RE). However, the share of wages and salaries in revenue expenditure of State governments is budgeted to increase from 29.3 per cent in 2008-09 (RE) to 32.6 per cent in 2009-10 (Table III.12). A significant rise in wages and salaries as percentage to GDP in 2008-09 (RE) as well as in 2009-10 (BE) ison account of the implementation of the Sixth CPC/SPCs by most of the major State governments.
3.31 The recommendations of the Fifth Pay Commission had entailed total additional expenditure of about 1.2 per cent of GDP at the State level. At present, despite the full/partial implementation of the Sixth CPC/SPCs in a few States in 2008-09, the States recorded a revenue surplus of about 0.2 per cent in the year, unlike inthe late 1990s, when the States’ own revenues were stagnant, central transfers were declining and interest payments were increasing steadily.According to the Economic Advisory Council to the Prime Minister (July 2008), States are, there fore,much better placed to absorb the fiscal impact of apay revision. Recognising the improved States financial position in recent years, the Sixth CPC/SPCs also observed that most of the States would be in a position to meet the additional expenditure (SPC Report, March 2008). However, given the expected deterioration in State finances in 2009-10, perhaps temporarily, due to the slowdown, the States may have to focus on better expenditure management by compressing the wasteful revenue expenditure wherever possible and explore further sources of revenues. Furthermore, the award of the ThFC for the period 2010-15 would also have implications for the capacity of the States to absorb the increase in expenditure on account of there commendations of the Sixth CPC/SPCs.
Table III.12: Administrative Expenditure of State Governments –
Wages and Salaries and Operations and Maintenance |
Year |
Wages and Salaries |
Operations and Maintenance |
Amount
(Rs. crore) |
Per cent of
Revenue
Expenditure |
Per cent of
GDP |
Amount
(Rs. crore) |
Per cent of
Revenue
Expenditure |
Per cent of
GDP |
1 |
2 |
3 |
4 |
5 |
6 |
7 |
1990-91 |
18,515 |
37.3 |
3.3 |
6,922 |
16.5 |
1.2 |
1991-92 |
23,042 |
35.2 |
3.5 |
7,302 |
12.9 |
1.1 |
1992-93 |
26,234 |
35.5 |
3.5 |
9,281 |
14.6 |
1.2 |
1993-94 |
29,431 |
35.6 |
3.4 |
9,037 |
12.7 |
1.0 |
1994-95 |
33,317 |
34.3 |
3.3 |
10,585 |
12.5 |
1.0 |
1995-96 |
37,673 |
34.4 |
3.2 |
11,368 |
11.9 |
1.0 |
1996-97 |
45,746 |
33.3 |
3.3 |
12,642 |
11.1 |
0.9 |
1997-98 |
58,282 |
34.4 |
3.8 |
14,872 |
9.5 |
1.0 |
1998-99 |
71,234 |
35.6 |
4.1 |
17,710 |
9.6 |
1.0 |
1999-00 |
86,285 |
36.4 |
4.4 |
17,522 |
8.2 |
0.9 |
2000-01 |
94,507 |
39.1 |
4.5 |
19,529 |
8.1 |
0.9 |
2001-02 |
93,009 |
36.3 |
4.1 |
19,591 |
7.6 |
0.9 |
2002-03 |
94,717 |
35.1 |
3.9 |
22,438 |
8.3 |
0.9 |
2003-04 |
98,741 |
32.0 |
3.6 |
25,464 |
8.3 |
0.9 |
2004-05 |
1,03,924 |
31.1 |
3.2 |
29,164 |
8.8 |
0.9 |
2005-06 |
1,04,158 |
29.1 |
2.8 |
33,976 |
9.5 |
0.9 |
2006-07 |
1,16,431 |
27.5 |
2.7 |
41,807 |
9.8 |
1.0 |
2007-08 |
1,16,983 |
28.4 |
2.4 |
38,439 |
9.3 |
0.8 |
2008-09 (RE) |
1,51,272 |
29.3 |
2.7 |
47,851 |
9.3 |
0.9 |
2009-10 (BE) |
1,92,568 |
32.6 |
3.1 |
40,132 |
6.8 |
0.7 |
RE: Revised Estimates. BE: Budget Estimates.
Note : 1. Statements 44 and 45 provide State-wise details. The number of States included in each year differ.
2. Data as per cent of revenue expenditure (Col. 3 and 6) are based on the number of States included in that year.
Source : Based on information received from State Governments. |
3.32 The fiscal stress, which had peaked in the
aftermath of the implementation of the Fifth Central
Pay Commission, eased subsequently mainly due
to an improvement in tax collection and a softening
of interest rates. In an attempt to remove the fiscal
drag on the economy, the government has been
trying to increase the tax base as well as raising
tax and non-tax rates. However, due to the decision
of a number of State governments to implement
the recommendations of the Sixth CPC/SPCs and
agreeing to pay arrears, State finances seem to have
come under stress in 2008-09 (RE) and 2009-10 (BE)
(Box III.5).
Plan Outlay of State Governments
3.33 As far as the approved Plan outlay of theState governments for 2009-10 is concerned, it wasplaced at Rs. 2,53,615 crore which comes to around4.1 per cent of GDP as compared with 5.0 per centin 2008-09. Non-special categories continue toaccount for more than around 90 per cent of thetotal approved capital outlay. Among the non-special category States, Uttar Pradesh followed by Karnataka, Gujarat, Tamil Nadu and Rajasthanaccount for nearly 50 per cent of the total Planoutlay of the State governments. The State-wisedetails of Plan outlays are set out in Statement 30.
5. Assessment
Consolidated Position
3.34 The overall financial position of the Stateshad shown tremendous improvement till 2007-08 (Accounts) as is evident from the key fiscal indicators (Table III.13 and Chart III.8). The enactment of FRLs aided the process of fiscal consolidation at the State level. In addition, fiscal consolidation at the State level was achieved onthe back of growing own revenues and higher resource transfers from the Central Government enabled by an overall robust growth of the economy, and falling interest rate payments of States’ due to the Debt Swap Scheme and the Debt Consolidation and Relief Facility as recommendedby the TwFC. However, there appears to be atemporary halt in the fiscal consolidation process in 2008-09 (RE) and 2009-10 (BE) due to subdued economic conditions in the economy.
Box III.5: Implementation of Sixth Central Pay Commission (CPC)/States' Pay Commissions (SPCs) Recommendations and State Governments' Finances
The Union Government constituted the Sixth Pay Commission in the mid-2006 and the recommendations of the Sixth Central Pay Commission (CPC) have been implemented by the Central Government with an estimated impact of Rs.28,505 crore (0.53 percent of GDP) in 2008-09. Similar estimates for State governments at a consolidated level are not available. Several States have already announced the implementation of the Sixth Central Pay Commission/State’s own Pay Commission (SPC) for their employees as well.Rajasthan was the first State government to announce the implementation of the recommendations of the Sixth CPC followed by Arunachal Pradesh, Bihar, Chhattisgarh, Gujarat, Haryana, Jammuand Kashmir, Jharkhand, Madhya Pradesh, Maharashtra and Orissa.The other States, viz., Andhra Pradesh, Assam, Uttar Pradesh and Uttarakhand have constituted their own Pay Commissions; West Bengal will be implementing the recommendations of its own Pay Commission, while Karnataka and Punjab have already implemented the recommendations of their own Pay Commissions.
Status of Implementation of the Recommendations of Sixth Central Pay
Commission (CPC)/States' Own Pay Commissions (SPCs)
States Implementing
the recommendations
of Sixth CPC. |
State's Own Pay
Commission |
Remarks |
Arunachal Pradesh,
Bihar, Chhattisgarh,
Gujarat, Goa, Haryana,
Jammu and Kashmir,
Jharkhand, Madhya
Pradesh, Maharashtra,
Orissa, Rajasthan and
Kerala |
Andhra Pradesh,
Assam, Punjab, West
Bengal, Uttar Pradesh,
Uttarakhand and
Karnataka |
Tamil Nadu constituted
a committee to examine
the recommendations
of the Sixth CPC, while
Himachal Pradesh
offered an interim relief
before the full
implementation |
Provisioning for pay revisions in line with the recommendations of the Sixth CPC/SPC has created additional burden for the States.The estimates on total salaries and pensions commitments at a consolidated level are not yet available. The full impact of CPC is estimated to be felt by the State governments’ budgets beginning 2009-10. There fore, as of now, it is difficult to gauge the precise impact of the Sixth CPC/SPC award on States’ finances as its implementation has neither been uniform across the States nor is it complete. However, the share of wages and salaries in revenue expenditure is budgeted to increase from 29.3 per cent in 2008-09 (RE) to 32.6 per cent in 2009-10. According to the available information as furnished by a few States, viz., Andhra Pradesh,Gujarat, Haryana, Madhya Pradesh, Maharashtra, Orissa, Rajasthan and West Bengal, with respect to the implementation of the Sixth CPC/SPC award at the State government level, the estimates for 2009-10 work out to around 0.85 per cent of GDP in that year on account ofincrease in salaries and pensions, arrears and interim relief.
In this context it needs to be mentioned that the recommendations of the Fifth CPC had entailed an additional expenditure of about1.2 per cent of GDP at the State level. The TwFC, keeping in view the persistent imbalances due to substantial increase in the levelof salary and pension payments, particularly for the States in thewake of the Fifth CPC, had recommended that there was no need to appoint a pay commission every ten years and also fixed a target ratio of salary expenditure to revenue expenditure net of interest payments and pensions at 35 per cent consistent with its average level in 1996-97. At present, it is perceived that the States aremuch better placed to absorb the fiscal impact of a pay revision due to a revenue surplus in the previous three years. Given the estimated slippage in State finances in 2009-10, the States may have to focus on compressing wasteful expenditure as well as explore revenue enhancement strategies.
References:
1.Government of India (2004), the Twelfth Finance Commission Report.
2.Budget Documents of respective State Governments, 2009-10.
3.35 An analysis shows that deterioration in the revenue account between 2007-08 (Accounts) and 2009-10 (BE) is entirely due to rise in the revenue expenditure (RE)-GDP ratio from 11.7 per cent to13.6 per cent. As far as deterioration in the revenue account in 2009-10 over 2008-09 (RE) is concerned, around 75 per cent of the deteriorationis estimated to be on account of increase in revenueexpenditure as a ratio to GDP while fall in Central transfers (in terms of GDP) would account 25 percent of the total deterioration in the revenue account. As stated in the foregoing discussion, atthe consolidated level the States have budgeted arevenue deficit of Rs. 32,295 crore during 2009-10 as compared with a surplus of Rs.10,701 crore in 2008-09 (RE). The re-emergence of the revenue deficit along with a marginal rise in capital outlayand a substantial decline in non-debt capital receipts would result in an increase of GFD to Rs. 1,99,510 crore in 2009-10 (BE) which turns out to be 3.2 percent of GDP (2.6 per cent of GDP in 2008-09 (RE)).
State-wise Position of Deficits
3.36 The impact of the macroeconomic slowdownon State finances appears to be across the States.Out of the 28 States, the number of States which have budgeted revenue deficit in 2009-10 has increased to 14 (4 States in 2008-09) with 10 more States turning from revenue surplus to revenue deficit in 2009-10 (BE). Furthermore, nine other States have budgeted a lower revenue surplus ascompared with 2008-09 (RE). As far as GFD is concerned, 18 States were able to contain their GFD-GSDP ratio below 3.0 per cent in 2007-08.However, the number of States with the GFD-GSDP ratio less than 3.0 per cent decreased to 9 in 2008-09 (RE) and 6 in 2009-10 (BE). In short, out of the 28 States, 22 States have budgeted a GFD-GSDP ratio above the FRL target of 3 per cent.
Table III.13: Trends in Major Deficit Indicators of State Governments |
(Amount in Rs. crore) |
Year |
Revenue Deficit |
Gross Fiscal Deficit |
Primary Revenue Balance |
Primary Deficit |
1 |
2 |
3 |
4 |
5 |
1999-00 |
54,549 |
(2.8) |
90,099 |
(4.6) |
9,907 |
(0.5) |
45,458 |
(2.3) |
2000-01 |
55,316 |
(2.6) |
87,923 |
(4.2) |
4,331 |
(0.2) |
36,937 |
(1.8) |
2001-02 |
60,398 |
(2.7) |
94,260 |
(4.1) |
-1,198 |
(-0.1) |
32,665 |
(1.4) |
2002-03 |
57,179 |
(2.3) |
99,726 |
(4.1) |
-11,848 |
(-0.5) |
30,699 |
(1.3) |
2003-04 |
63,407 |
(2.3) |
120,631 |
(4.4) |
-16,989 |
(-0.6) |
40,235 |
(1.5) |
(Net of Power Bonds) |
|
|
94,086 |
(3.4) |
|
|
|
|
2004-05 |
39,158 |
(1.2) |
1,07,774 |
(3.3) |
-47,263 |
(-1.5) |
21,353 |
(0.7) |
2005-06 |
7,013 |
(0.2) |
90,084 |
(2.4) |
-77,011 |
(-2.1) |
6,060 |
(0.2) |
2006-07 |
-24,857 |
(-0.6) |
77,508 |
(1.8) |
-1,18,037 |
(-2.8) |
-15,672 |
(-0.4) |
2007-08 |
-42,943 |
(-0.9) |
75,455 |
(1.5) |
-1,42,773 |
(-2.9) |
-24,376 |
(-0.5) |
2008-09 (RE) |
-10,701 |
(-0.2) |
1,46,349 |
(2.6) |
-1,16,921 |
(-2.1) |
40,128 |
(0.7) |
2009-10 (BE) |
32,295 |
(0.5) |
1,99,510 |
(3.2) |
-84,132 |
(-1.4) |
83,083 |
(1.3) |
RE : Revised Estimates. BE : Budget Estimates.
Note : 1. Negative (–) sign indicates surplus.
2. Figures in parentheses are percentages to GDP.
3. State Governments had issued power bonds amounting to Rs.28,984 crore during 2003-04 to CPSUs under one-time settlement
scheme for dues of State Electricity Boards.
Source: Budget Documents of the State Governments. |
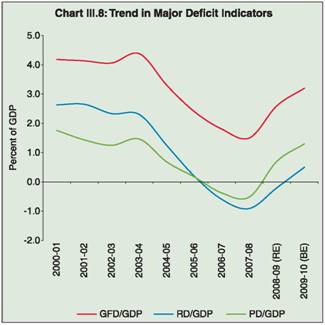 |
3.37 Non-special category States appear to bemainly responsible for the deterioration in deficit indicators during 2009-10 (BE). Non-special category States accounted for 77.7 per cent of the total deterioration in the revenue account of the States and 81.8 per cent of the increase in GFD in2009-10 (BE) over 2008-09 (RE). Among the non-special category States Maharashtra, West Bengal,Gujarat, Haryana, Orissa, Uttar Pradesh and Punjab account for 89.2 per cent of the totaldeterioration in revenue account. However, onlytwo States, viz., Assam and Arunachal Pradesh are budgeted to account for 95 per cent of the total deterioration in the revenue deficit of special category States. Among the non-special category States, the sharp increase in GFD by Rs. 43,481crore in 2009-10 is estimated to be contributed byrise in GFD of Maharashtra (Rs. 10,342 crore),West Bengal (Rs. 10,290 crore), Andhra Pradesh (Rs. 5,724 crore) and Haryana (Rs.4,849 crore).However, in the case of special category States, Assam is a major contributor with an increase in GFD by Rs. 8,687 crore which is 89.7 per cent of the total increase in GFD of special category States(Table III.14).
Table III.14 : State-wise Correction of RD and
GFD – 2009-10 (BE) over 2008-09 (RE) |
State |
Revenue Deficit |
Gross
Fiscal Deficit |
Correction
over 2008-09
(RE) (Rs. crore) |
Per-
centage
to Total |
Correction
over 2008-09
(RE) (Rs. crore) |
Per-
centage
to Total |
1 |
2 |
3 |
4 |
5 |
A. Non-Special Category |
|
|
|
|
1. Andhra Pradesh |
-340 |
-1.0 |
5,724 |
13.2 |
2. Bihar |
-2,688 |
-8.0 |
-3,798 |
-8.7 |
3. Chhattisgarh |
242 |
0.7 |
309 |
0.7 |
4. Goa |
431 |
1.3 |
493 |
1.1 |
5. Gujarat |
4,182 |
12.5 |
1,788 |
4.1 |
6. Haryana |
3,439 |
10.3 |
4,849 |
11.2 |
7 Jharkhand |
905 |
2.7 |
481 |
1.1 |
8. Karnataka |
-384 |
-1.1 |
-863 |
-2.0 |
9. Kerala |
-721 |
-2.2 |
-634 |
-1.5 |
10. Madhya Pradesh |
1,471 |
4.4 |
1,065 |
2.4 |
11. Maharashtra |
11,386 |
34.1 |
10,342 |
23.8 |
12. Orissa |
3,129 |
9.4 |
3,443 |
7.9 |
13. Punjab |
2,422 |
7.2 |
2,804 |
6.4 |
14. Rajasthan |
1,126 |
3.4 |
1,871 |
4.3 |
15. Tamil Nadu |
1,032 |
3.1 |
2,575 |
5.9 |
16. Uttar Pradesh |
2,532 |
7.6 |
2,742 |
6.3 |
17. West Bengal |
5,262 |
15.7 |
10,290 |
23.7 |
Total (A) |
33,429 |
100.0 |
43,481 |
100.0 |
B. Special Category |
|
|
|
|
1. Arunachal Pradesh |
1,120 |
11.7 |
103 |
1.1 |
2. Assam |
8,092 |
84.6 |
8,687 |
89.7 |
3. Himachal Pradesh |
74 |
0.8 |
-272 |
-2.8 |
4. Jammu and Kashmir |
-1,272 |
-13.3 |
-120 |
-1.2 |
5. Manipur |
180 |
1.9 |
-66 |
-0.7 |
6. Meghalaya |
304 |
3.2 |
489 |
5.1 |
7 Mizoram |
61 |
0.6 |
-160 |
-1.7 |
8. Nagaland |
-372 |
-3.9 |
-130 |
-1.3 |
9. Sikkim |
170 |
1.8 |
112 |
1.2 |
10. Tripura |
396 |
4.1 |
522 |
5.4 |
11. Uttarakhand |
813 |
8.5 |
514 |
5.3 |
Total (B) |
9,567 |
100.0 |
9,680 |
100.0 |
Grand Total (A + B) |
42,996 |
100.0 |
53,161 |
100.0 |
Memo item: |
|
|
|
|
1. |
NCT Delhi |
-1,784 |
– |
-1345 |
– |
2. |
Puducherry |
-587 |
– |
-213 |
– |
RE : Revised Estimates. BE : Budget Estimates.
‘–’ : Not applicable.
Note : Negative (–) sign indicates improvement in deficit indicators.
Source : Budget Documents of the State Governments. |
Decomposition and Financing of Gross Fiscal Deficit
3.38 With revenue account turning from surplus todeficit in 2009-10 (BE), there would be a compositional shift in GFD in 2009-10. While in 2008-09 (RE),surplus in the revenue account financed the GFD to the extent of 7.3 per cent, such comfort would cease to exist in 2009-10. The re-emergence of revenue deficit in 2009-10 would contribute 16.2 per cent of GFD. In 2009-10, while capital outlay would continue to dominate as a major component of GFD, its sharein GFD is budgeted to decline. Increase in net lending and decline in non-debt capital receipts would also aggravate the size of GFD in 2009-10 (BE) (Table III.15 and Appendix Table 16).
3.39 The financing pattern of gross fiscal deficit atthe State level in recent years has undergone asignificant change mainly on account of: (i) the recommendations of TwFC for phasing out loans fromthe Centre to the State governments; and(ii) decline in collections under NSSF. As a result,market borrowings have emerged as a major financing item of GFD since 2007-08 as compared with dominance of borrowings from NSSF and loans from the Centre in previous years. Market borrowings, which financed more than two-third of the GFD in 2008-09(RE), would finance around 57.9 per cent of the totalGFD in 2009-10 (BE). The States have budgeted consolidated market borrowings of Rs.1,15,484 crorein 2009-10 as compared with Rs.1,00,452 crore in 2008-09 (RE). Despite the fact that the TwFC had emphasised the phasing out of loans from the Centre,they are budgeted to be higher at Rs. 9,291 crore in 2009-10 as compared with Rs. 1,921 crore in 2008-09(RE). Loans from the Centre would account for 4.7per cent of the total GFD in 2009-10 as against 1.3per cent in 2008-09 (RE). The share of small savings,provident fund and special securities issued to NSSFis also budgeted to rise marginally in 2009-10 (Appendix Tables 17 and 18).
Table III.15: Decomposition and Financing Pattern of Gross Fiscal Deficit –2007-08 (Accounts) to 2009-10 (BE) |
(Per cent to GFD) |
Item |
2007-08 |
2008-09
(RE) |
2009-10
(BE) |
1 |
2 |
3 |
4 |
Decomposition (1+2+3-4) |
100.0 |
100.0 |
100.0 |
1. Revenue Deficit |
-56.9 |
-7.3 |
16.2 |
2. Capital Outlay |
157.5 |
107.5 |
80.3 |
3. Net Lending |
8.6 |
3.5 |
4.6 |
4. Non-debt Capital Receipts |
9.2 |
3.6 |
1.1 |
Financing (1 to 11) |
100.0 |
100.0 |
100.0 |
1. Market Borrowings |
71.5 |
68.6 |
57.9 |
2. Loans from Centre |
-1.2 |
1.3 |
4.7 |
3. Special Securities issued to |
7.8 |
2.1 |
4.5 |
NSSF/Small Savings |
|
|
|
4. Loans from LIC, NABARD, |
8.3 |
6.2 |
4.2 |
NCDC, SBI and Other Banks |
|
|
|
5. Small Savings, P.F., etc. |
16.4 |
10.0 |
10.8 |
6. Reserve Funds |
-7.8 |
1.4 |
1.3 |
7. Deposits and Advances |
18.0 |
3.9 |
4.7 |
8. Suspense and Miscellaneous |
5.0 |
-2.2 |
0.2 |
9. Remittances |
1.7 |
0.1 |
– |
|
|
|
|
10.Others |
-1.7 |
-2.5 |
-1.2 |
11.Overall Surplus (–) / Deficit (+) |
-17.8 |
11.2 |
12.9 |
BE : Budget Estimates. RE : Revised Estimates.
Note : 1. See Notes to Appendix Table 17.
2. ‘Others’ include Compensation and Other Bonds, Loans
from Other Institutions, Appropriation to Contingency
Fund, Inter-State Settlement and Contingency Fund.
Source : Budget Documents of the State Governments. |
Budgetary Data Variations – State Budget vis-àvis
Union Budget
3.40 The budgetary data provided by the Union Budget and the State budgets continue to show wide variations. In general, States over-estimategrants-in-aid and loans from the Centre and flows from NSSF, while they under estimate the share in Central taxes. In 2009-10 (BE), the State budget showever, have underestimated flows from the NSSF. In contrast, State governments seem to beexpecting more on account of share in Central taxes than what the Union Budget (2009-10) has proposed (Table III.16).
3.41 The extent of over-estimation of aggregate
resources to be received from the Centre appears
to be significantly higher than the previous years.
For instance, if an over-estimated amount of
Rs. 50,194 crore (0.8 per cent of GDP) on account
of share in Central taxes and grants-in-aid, remains
unrealised from the Centre, this would increase the
States’ consolidated revenue deficit to that extent
during 2009-10 under a ceteris paribus condition.
This will place the consolidated revenue deficit at
Rs. 82,489 crore in 2009-10. Such wide variations
between budget estimates of the Centre and State
governments would have implications for State
finances. Experience of the past two years,
however, shows that the receipts on account of
share in Central taxes turned out to be
underestimated in 2007-08 (Accounts) and 2008-09
(RE) as compared with the State’s budget estimates, while the same on account of grants-inaid
from the Centre turned out to be over-estimated.
Given this, the total resources received from the
Centre in the form of share in Central taxes and
grants-in-aid were only marginally lower than their
budgetary estimates during 2007-08 (Accounts)
and 2008-09 (RE). If the same pattern continues
in 2009-10, there may not be much implication for
the overall revenue receipts of State governments.
However, it would depend on the revenue collections
of the Centre and the overall macroeconomic
conditions in the economy.
Table III.16: Budgetary Data Variation- State Budgets and Union Budget |
(Amount in Rs. crore) |
Item |
2007-08 (BE) |
2008-09 (BE) |
2009-10 (BE) |
State
Budgets |
Union
Budget |
Diffe-
rence* |
State
Budgets |
Union
Budget |
Diffe-
rence* |
State
Budgets |
Union
Budget |
Diffe-
rence* |
1 |
2 |
3 |
4 |
5 |
6 |
7 |
8 |
9 |
10 |
1. Shareable Taxes from Centre |
1,36,184 |
1,42,450 |
-6,267 |
1,73,147 |
1,78,765 |
-5,618 |
1,85,720 |
1,64,362 |
21,358 |
|
|
|
(-4.4) |
|
|
(-3.1) |
|
|
(13.0) |
2. Grants-in-Aid |
1,17,320 |
99,583 |
17,737 |
1,43,030 |
1,18,901 |
24,129 |
1,68,683 |
1,39,847 |
28,836 |
|
|
|
(17.8) |
|
|
(20.3) |
|
|
(20.6) |
3. Loans from Centre (Net) |
6,485 |
2,984 |
3,501 |
6,942 |
1,479 |
5,463 |
9,291 |
3,093 |
6,199 |
|
|
|
(117.3) |
|
|
(369.3) |
|
|
(200.4) |
4. NSSF (Net) |
53,679 |
46,990 |
6,689 |
22,044 |
18,626 |
3,418 |
9,026 |
11,744 |
-2,718 |
|
|
|
(14.2) |
|
|
(18.4) |
|
|
(-23.1) |
BE: Budget Estimates.
*: Negative (–)/Positive (+) sign implies underestimation/overestimation in State budgets in comparison with Union Budget.
Note: Figures in brackets are percentage variation over Union Budget.
Source: Budget Documents of the State Governments and the Union Government. |
3.42 Adjusting for the data of Union Budget 2009-
10, GFD would be placed higher at Rs.2,49,704 crore
(4.1 per cent of GDP) in 2009-10. With regard to financing of GFD during 2009-10 (BE), loans from
the Centre and market borrowings have been overestimated
by Rs. 6,199 crore (66.7 per cent) and
Rs.13,025 crore (11.3 per cent), respectively, while
loans against special securities have been
underestimated by Rs. 2,718 crore (30.1 per cent).
An assessment of State budgets in conjunction with
the Union Budget shows that the level of overall deficit
would be placed higher at Rs. 75,915 crore mainly
due to rise in revenue deficit(Table III.17).
Table III.17: Financing of Gross Fiscal Deficit (GFD) – 2009-10 (Adjusted) |
(Amount in Rs. crore) |
Item |
2009-10 (BE) |
Variation |
State Budgets |
Adjusted |
Amount |
Per cent |
1 |
2 |
3 |
4 |
5 |
Gross Fiscal Deficit (GFD) |
1,99,510 |
2,49,704 |
50,194 |
25.2 |
|
(100.0) |
(100.0) |
|
|
1. Market Borrowings* |
1,15,484 |
1,02,459 |
-13,025 |
-11.3 |
|
(57.9) |
(41.0) |
|
|
2. Loans from Centre@ |
9,291 |
3,093 |
-6,199 |
-66.7 |
|
(4.7) |
(1.2) |
|
|
3. Special Securities issued to NSSF@ |
9,026 |
11,744 |
2,718 |
30.1 |
|
(4.5) |
(4.7) |
|
|
4. Loans from LIC, NABARD, NCDC, SBI and other Banks |
8,462 |
8,462 |
– |
– |
|
(4.2) |
(3.4) |
|
|
5. Small Savings and Provident Fund, etc. |
21,617 |
21,617 |
– |
– |
|
(10.8) |
(8.7) |
|
|
6. Reserve Funds |
2,554 |
2,554 |
– |
– |
|
(1.3) |
(1.0) |
|
|
7. Deposits and Advances |
9,354 |
9,354 |
– |
– |
|
(4.7) |
(3.7) |
|
|
8. Suspense and Miscellaneous |
433 |
433 |
– |
– |
|
(0.2) |
(0.2) |
|
|
9. Remittances |
3 |
3 |
– |
– |
|
(0.0) |
(0.0) |
|
|
10. Others |
-2,435 |
-2,435 |
– |
– |
|
-(1.2) |
-(1.0) |
|
|
11. Overall Surplus (–)/Deficit (+) |
25,721 |
75,915 |
50,194 |
195.2 |
|
(12.9) |
(30.4) |
|
|
*: Data are adjusted as per the allocation under market borrowing programme for the State Governments during 2009-10.
BE: Budget Estimates. ‘–’ : Nil.
@: Data are adjusted as per the Union Budget 2009-10.
Note: 1. Figures in brackets are percentages to GFD.
2. ‘Others’ include Compensation and Other Bonds, Loans from Other Institutions, Appropriation to Contingency Fund, Inter-state Settlement and
Contingency Fund.
Source: Budget Documents of the State Governments, Union Government and Reserve Bank records. |
6. Conclusion
3.43 At the consolidated level, the States
witnessed a marked improvement in key deficit
indicators when the revised estimates of 2007-08
translated into accounts. While the surplus on the
revenue account almost doubled in absolute terms,
the GFD declined by around 30 per cent vis-a-vis
the revised estimates. However, the fiscal
correction and consolidation witnessed in State
finances have suffered a setback in 2008-09 (RE)
and 2009-10 due to the economic slowdown and
the accompanying moderation in the pace of
revenue growth. It is evident that the tax revenue
buoyancy achieved till 2007-08 could not be
realised during 2008-09 (RE). As a result, revenue
surplus as a percentage of GDP declined from 0.9
per cent in 2007-08 (Accounts) to 0.2 per cent in
2008-09 (RE) and the GFD-GDP ratio increased
significantly from 1.5 per cent to 2.6 per cent.
Setback to the States’ fiscal position witnessed
during 2008-09 (RE) is estimated to deteriorate further in 2009-10 as is evident from the budget
estimates. While the revenue account is budgeted
to turn into a deficit, the GFD-GDP ratio is estimated
to be at 3.2 per cent. Revenue receipts as
percentage to GDP (RR-GDP) are budgeted to
decline from 13.2 per cent in 2008-09 (RE) to 13.1
per cent in 2009-10. Growth in States’ own revenue
collections is also budgeted to decelerate in 2009-10.
Overall, the Central transfers to States are budgeted
to fall from 5.9 per cent of GDP in 2008-09 (RE) to
5.7 per cent in 2009-10. In order to revive demand,
a few States have announced dedicated stimulus
packages to undertake investments, but there is
no sign of an increase in the consolidated capital
outlay of State governments in 2009-10 (BE). The
aggregate development expenditure-GDP ratio is
budgeted to be lower at 10.7 per cent in 2009-10 as
compared with 11.0 per cent in 2008-09 (RE). As far
as financing of GFD is concerned, market
borrowings which financed more than two-third of
the GFD in 2008-09 (RE), would finance around
57.9 per cent of the total GFD in 2009-10 (BE).
3 In order to compute cyclical component of nominal GDP and Sales Tax/VAT collections, Hodrick-Prescott filtering technique has been used
4 Refer to explanatory note on data sources and methodology.
5 Social sector expenditure includes expenditure on social services, rural development and food, storage and warehousing under revenue expenditure, capital outlay and loans and advances given by the State governments. |