V.1
The crisis in global financial markets deepened since mid-September 2008, triggered
by the collapse of Lehman Brothers followed by the failure of a number of other
financial firms across countries. With the counter-party concerns mounting in
the context of asset sales driven by the large-scale redemptions, there was a
new wave of write-offs of Lehman related investments by the money market funds
and other investors, affecting the key players in global financial system. Inter-bank
markets froze on valuation concerns. In the wake of credit and money markets witnessing
a squeeze and equity prices plummeting, banks and other financial institutions
experienced erosion in their access to funding and capital base, owing to accumulating
mark to market losses. The pressure on financial markets mounted with the credit
spreads widening to record levels and equity prices crashing to historic lows
leading to widespread volatility across the market spectrum. The turmoil transcended
from credit and money markets to the global financial system more broadly. The
contagion also spilled over to the emerging markets, which saw broad-based asset
price declines amidst depressed levels of risk appetite. V.2
In consonance with the instability of global financial system, there was a significant
deterioration in the global economic outlook reflected in the downward revision
of forecasts for both major and emerging market economies. While the government
bond yields plummeted in the wake of recession concerns, the yield curves steepened
at the short end, mirroring repeated bouts of downward adjustments in policy rates.
As a result, authorities in several countries embarked upon an unprecedented wave
of policy initiatives to contain systemic risk, arrest the plunge in asset prices
and shore up the confidence in the international banking system. V.3
Mounting financial sector problems forced the authorities in a large number of
countries to take decisive actions in support of key financial institutions. The
central banks took several initiatives to revive money markets which included,
inter alia, substantial easing of monetary policy and provision of term
funding to a wide range of institutions and against wider collateral list than
in the past through introduction of new facilities. In some cases, they provided
direct lending to distressed institutions and took other exceptional measures
to improve funding conditions in credit markets. The central banks also adopted
a co-operative approach to address the problem of foreign currency shortages faced
by banks through inter-central bank swap lines. The governments in virtually all
advanced economies also announced more comprehensive initiatives to stabilise
banking system. While one set of measures was aimed at ensuring bank funding through
explicit guarantees on retail deposits, the other set of measures sought to reduce
bank leverage through government purchases of distressed assets or capital injections.
While these initiatives did help in restoring some level of stability, the financial
market conditions remained far from normal during the period October-December
2008. V.4 Financial markets in India came under pressure
in mid-September 2008, mainly reflecting the knock-on effects of the disruptions
in the major financial centres following the collapse of Lehman Brothers. Liquidity
conditions became unduly tight as the period of quarterly tax outflows coincided
with the market turmoil and necessitated forex operations by the Reserve Bank
to curb excessive volatility. Mirroring the liquidity pressures in the inter-bank
market, the rates in the money market rose above the upper bound of the corridor.
However, except on a few days, the transactions were not impeded on account of
counterparty concerns since the Indian banking system is prudently regulated,
well capitalised and free from ';toxic'; assets. In the foreign exchange
market, the Indian rupee generally depreciated against major currencies. Indian
equity markets witnessed downswings quite in line with trends in major international
equity markets. The series of measures swiftly initiated by the Reserve Bank helped
to assuage liquidity conditions, while reassuring the market that the Indian banking
system continued to be safe and sound, well capitalised and well regulated. International
Financial Markets V.5 The developments in the financial
markets since the mid-September 2008 could be seen in three phases. The first
phase was marked by the takeover of two major US housing finance agencies by the
US government and the Lehman bankruptcy. During the second phase, the global financial
market turmoil deepened further rapidly as there was widespread crisis of confidence,
leading to unprecedented global policy responses that were more broad based and
increasingly fast-paced in nature. The final phase began with mid-October 2008,
when price patterns started reflecting recession fears amidst markets grappling
with uncertainties revolving around new policy initiatives. Money
Markets V.6 During September 2008, the funding pressures
were particularly evident in respect of cross-currency swap markets where the
implied rates for US dollars spiked sharply. The benchmark US investment grade
CDX credit default swap index spread jumped by 42 basis points on September 15,
2008 alone, while US high yield spreads rose by 118 basis points. During October
2008, the spread of three-month US dollar Libor over expected future short-term
interest rates climbed to a record high of around 370 basis points, mirroring
a combination of counter party credit risk and liquidity factors. V.7
Moreover, US markets for other short-term bank debt remained stressed. Commercial
paper markets suffered due to redemptions/ reallocations and illiquid secondary
markets for these securities. Another source of funding for banks, the market
for asset-backed securities became more or less defunct, in turn, affecting banks’
ability to provide new lending. Added to this were widespread redemptions from
‘Prime’ funds, which invest in bank securities. In view of soaring demand for
liquid funds in the wake of the contraction in the money market mutual fund sector,
global inter-bank markets came under pressure, squeezing banks’ access to short-term
funding. Money markets, which were already strained, failed to recuperate, despite
massive central bank liquidity injections. As a result, interbank rates spiked
to historic highs. The movements in other major markets such as those for euro
and sterling funds also showed similar signs, albeit, moderately. Credit
spreads in other major markets followed suit and continued to move in tandem with
the US markets. V.8 US authorities initiated several measures
during October and November 2008. For instance, announcement of temporary guarantee
for money market fund investors obviated redemption pressures on money market
funds with total assets gradually rising back to their levels before the Lehman
breakdown, reaching US$3.6 trillion by early November. Similarly, introduction
of Commercial Paper Funding Facility (CPFF), which purchased around US$270 billion
helped the US money market funds through turbulence. V.9
With the series of coordinated policy moves by the major central banks, the financial
sector spreads rallied back from the peaks reached earlier during the period.
Credit spreads came down with recovery in the credit markets. The signs of ease
also started reflecting in other markets. After recording a peak at 364 basis
points on October 10, 2008, the three-month US dollar Libor-OIS spread witnessed
a steady downward trend into November 2008, with spreads reaching around 170 basis
points. The euro and sterling Libor-OIS spreads came to see similar pricing movements,
indicating a return of stability to the inter-bank markets. However, after an
initial decline, spreads on agency debt and MBS soared beyond their peak levels
reached in early September. Collateralised lending markets, especially those for
repurchase agreements came to witness similar movements. The spreads in the CDS
markets widened on increased demand for credit protection, while the corresponding
spreads in the financial sector were tightened. While the efforts of the governments
and the central banks appeared to be successful in restoring the confidence in
global financial markets, the gains across most asset classes turned out to be
short-lived. However, the short-term funding markets continued to recover, as
the US money market fund assets started stabilising and Libor-OIS spreads began
declining, albeit, at levels higher than those prior to the credit crisis. V.10
By mid-October, with the reports of recession, credit markets began anchoring
their expectations on ensuing global recession and the associated increase in
default related losses. The contraction in bond issuance and bank lending got
reflected in the lack of availability of credit for households and non-finance
companies. With the release of weak macroeconomic data for the US on October 16,
2008, credit spreads started reverting back to their upward levels. Credit spreads
moved to their new highs with the announcement of reallocation of funds under
the Troubled Assets Relief Programme for consumer sector in mid-November. It was
in late November, that credit spreads started recovering, following the announcement
of a support package for Citigroup and measures aimed at supporting the markets
for asset backed securities and US agency debt. However, strains persisted with
the continued widening of spreads in the troubled sectors such as commercial estate. V.11
As the outlook for economic activity weakened further and inflationary pressures
dissipated, on December 10, 2008, the US Federal Reserve
cut its Fed Funds rate to a target range of 0 to ¼ per cent. Similarly, Bank of
England further cut its official bank rate by 100 basis points in December 2008
and again by 50 basis points to 1.5 per cent on January 8, 2009. Other central
banks such as ECB including some EMEs such as China followed suit.
Short-term
Interest Rates V.12 During the third quarter of 2008-09,
short-term interest rates in advanced economies witnessed an easing trend, moving
broadly in tandem with cuts in the policy rates on the back of recession concerns
(Table 36). In the US, short-term interest rates declined,
reflecting liquidity injections and reduction in the fed funds target rate in
October and December 2008.
| Table
36: Short-term Interest Rates | |
(Per cent) | |
Country |
March |
March |
March |
June |
September |
December |
January | | |
2006 |
2007 |
2008 |
2008 |
2008 |
2008 |
2009* | |
1 |
2 |
3 |
4 |
5 |
6 |
7 |
8 | |
Advanced Economies | | | | | | | |
| Euro
area | 2.80 |
3.91 |
4.72 |
4.96 |
5.07 |
2.97 |
2.65 | |
Japan |
0.04 |
0.57 |
0.75 |
0.75 |
0.75 |
0.62 |
0.62 | |
UK |
4.58 |
5.55 |
6.01 |
5.93 |
6.25 |
2.73 |
2.23 | |
US |
4.77 |
5.23 |
2.26 |
2.29 |
2.04 |
0.44 |
0.29 | |
Emerging Market Economies | | | | | | | |
| Argentina |
9.63 |
9.63 |
10.44 |
16.50 |
13.81 |
19.56 |
18.56 | |
Brazil |
16.54 |
12.68 |
11.18 |
12.17 |
13.66 |
13.66 |
13.66 | |
China |
2.40 |
2.86 |
4.50 |
4.48 |
4.31 |
1.86 |
1.48 | |
Hong Kong |
4.47 |
4.17 |
1.83 |
2.33 |
3.66 |
1.00 |
0.80 | |
India |
6.11 |
7.98 |
7.23 |
8.73 |
8.56 |
4.71 |
4.58 | |
Malaysia |
3.51 |
3.64 |
3.62 |
3.69 |
3.70 |
3.40 |
3.37 | |
Philippines |
7.38 |
5.31 |
6.44 |
6.00 |
4.00 |
5.25 |
5.06 | |
Singapore |
3.44 |
3.00 |
1.38 |
1.25 |
1.78 |
0.91 |
0.77 | |
South Korea |
4.26 |
4.94 |
5.32 |
5.36 |
5.78 |
3.98 |
3.16 | |
Thailand |
5.10 |
4.45 |
3.25 |
3.65 |
3.85 |
3.85 |
3.85 | |
*: As on January 14, 2009.
Note
: Data for India refer to 91-day Treasury Bills rate and for other countries
3-month money market rates.
Source : The Economist. |
In the
UK, short-term interest rates declined, following cuts in the policy rate thrice
during October-December 2008 and again on January 8, 2009. Similar trends were
witnessed in the Euro area with cuts in ECB policy rate thrice between October-December
2008. Among the EMEs, short-term interest rates generally softened in China, Hong
Kong, Malaysia, Singapore and South Korea, hardened in Argentina and Philippines
and remained stable in Brazil and Thailand. The central banks in the EMEs - People’s
Bank of China, Bank of Korea, Bank of Thailand, etc., effected cuts in
the policy rates during the above period. Government
Bond Yields V.13 Long-term government bond yields in
major advanced economies, which had hardened during the first quarter of 2008-09
declined over the second quarter, reflecting worsening growth expectations and
improved near- term inflation outlook. The decline got accentuated during the
third quarter. The 10-year government bond yield in the US declined by 156 basis
points between October 1, 2008 and January 14, 2009. During the same period, yields
on 10-year government papers declined by 105 basis points in UK, 104 basis points
in the Euro area and 23 basis points in Japan (Chart 17). Foreign
Exchange Markets V.14 While movements in exchange rates
partly reflected developments in the interest rates, a combination of three factors
illustrates the perceived exchange rate movements in the recent period. First,
a general retrenchment from risky assets as part of the ongoing deleveraging
process in the financial markets, second, unwinding of currency carry trades
with the elevated market volatilities, and third, repatriation of investments,
particularly in the US and Japan. The accumulated gains were eroded as the low-yielding 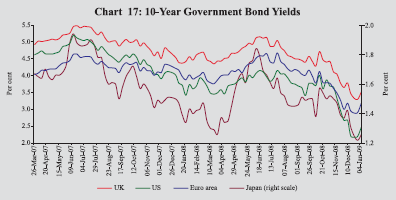
currencies
appreciated and carry trade returns turned negative. V.15
The widening credit spreads and mounting demand for US dollar funds was reflected
in the market for foreign exchange swaps, which witnessed historic high spreads
for various countries including emerging market currencies vis-à-vis
the US dollar. There were increasing pressures in obtaining US dollar funding
in both uncollateralised and collateralised markets. Confronted with the foreign
currency shortages, central banks responded by providing foreign currency funding
to their counterparties. Alongside, major central banks came to respond with a
new round of coordinated measures to address squeeze in the US dollar short-term
funding. They signed enlarged currency swap facilities worth US $ 180 billion
during October 2008. The use of inter-central bank swap lines, particularly those
with the Federal Reserve expanded considerably in both scale and scope. V.16
The US dollar, generally, appreciated against most of the currencies as the US
investors were liquidating their positions in overseas equity and bond markets
and repatriating the money back to the US. Between end-March 2008 and January
13, 2009, the US dollar appreciated against the euro and Pound sterling. However,
the US dollar depreciated largely against the Japanese yen, as a result of unwinding
carry trades. Amongst Asian currencies also, the US dollar appreciated against
Korean won, Thai Baht, Malaysian ringgit, Indonesian rupiah and Indian rupee but
depreciated against Chinese Yuan (Table 37).
| Table
37: Appreciation (+) / | |
Depreciation (-) of the US dollar |
| vis-à-vis
other Currencies | |
(Per cent) | |
Currency |
End- March
2007 @ |
End- March
2008 @ |
January
13, 2009 * |
| 1 |
2 |
3 |
4 | |
Euro |
-9.1 |
-15.8 |
19.2 | |
Pound Sterling |
-11.4 |
-1.5 |
36.3 | |
Japanese Yen |
0.2 |
-14.9 |
-10.7 | |
Chinese Yuan |
-3.4 |
-9.3 |
-2.6 | |
Russian Rubble |
-6.1 |
-9.7 |
32.9 | |
Turkish Lira |
3.2 |
-5.8 |
21.9 | |
Indian Rupee |
-2.5 |
-8.3 |
22.4 | |
Indonesian Rupiah |
0.5 |
1.1 |
21.7 | |
Malaysian Ringgit |
-6.2 |
-7.8 |
12.2 | |
South Korean Won |
-3.7 |
5.5 |
37.2 | |
Thai Baht |
-9.9 |
-10.2 |
11.1 | |
Argentine Peso |
0.7 |
2.1 |
9.0 | |
Brazilian Peso |
-6.4 |
-17.0 |
34.1 | |
Mexican Peso |
1.3 |
-3.5 |
29.2 | |
South African Rand |
17.2 |
11.3 |
24.8 | |
@ : Year-on-year variation.
* : Variation over
end-March 2008. |
Equity
Markets V.17 Equity prices plummeted across the major
economies, affecting broadly all the major industrial sectors, with volatility
soaring across the markets. With the intensification of funding pressures in the
global banking system, fall in the share prices was particularly sharp during
the early October 2008. Part of the price falls was linked to the hedge funds
liquidating positions to meet the increased margin calls. V.18
The recession concerns, which surfaced in late October and November, were reflected
in the equity markets with the plunge in global equity markets being the highest
than any of the crisis since the 1930s. News relating to negative earnings, tightening
lending standards and subdued consumer confidence came to weigh heavily on the
major indices. Investment analysts came to lower their forecasts for earnings
growth in 2008 and 2009 as the news about worsening macroeconomic outlook stepped
in. The corporate prospects worsened with the price of dividend swaps declining
sharply, particularly during October. Alongside fall in equity prices, corporate
credit spreads also widened further. Falling asset prices also affected the asset
portfolios of long-term investors such as pension funds and insurance companies.
Notwithstanding further monetary easing by several central banks, global equity
markets were down by around 40 per cent by mid-January 2009. Equity markets in
most of the developed and emerging economies declined due to concerns over economic
slowdown in the US, Europe and Asia and dip in the profit outlook of companies
(Table 38). Emerging Markets V.19
Banks in emerging markets, which had been relatively less affected by the strains
in the dollar money markets till mid-September 2008, also came to witness funding
shortages. During mid-October 2008, emerging markets debt and equities came to
witness significant outflows, weakening the equity markets, on the back of concerns
about the availability of trade finance and falling risk appetite. Amidst the
sharp depreciations in the value of EME
| Table
38: International Stock Markets | |
(Per cent) | |
Country/Index |
Percentage
Variation
(year-on-year) |
Percentage Variation |
| |
End-
March
2007 |
End- March
2008 |
January 19,
2009 over
end-March
2008 |
| 1 |
2 |
3 |
4 | |
Developed Markets | | | |
| US
(Dow Jones) | 11.2 |
-0.7 |
-32.5* | |
US (NASDAQ) |
3.5 |
-5.9 |
-33.0* | |
FTSE UK 100 |
5.8 |
-9.6 |
-28.0 | |
Euro area (FTSE 100) |
7.5 |
-15.7 |
-35.4 | |
Japan (Nikkei 225) |
1.3 |
-27.6 |
-34.1 | |
Hong Kong (Hang Seng) |
25.3 |
15.4 |
-41.6 | |
Emerging Markets | | | |
| Russia |
34.9 |
6.1 |
-74.1 | |
Brazil |
20.7 |
33.1 |
-36.3 | |
Colombia |
-3.7 |
-16.0 |
-15.6 | |
South Africa |
34.3 |
11.5 |
-32.3 | |
South Korea |
6.8 |
17.3 |
-32.5 | |
Hungary |
1.6 |
-7.3 |
-44.6 | |
Singapore |
28.2 |
-4.9 |
-41.9 | |
Malaysia |
34.6 |
0.1 |
-28.6 | |
Argentina |
16.8 |
0.0 |
-47.3 | |
Turkey |
1.8 |
-10.6 |
-35.8 | |
Indonesia |
38.4 |
33.7 |
-44.8 | |
India |
15.9 |
19.7 |
-40.4 | |
Thailand |
-8.1 |
21.3 |
-46.7 | |
China |
145.2 |
9.1 |
-42.8 | |
Memo: | | | |
| World
(MSCI) | 13.4 |
-5.1 |
-40.2 | |
EMEs (MSCI) |
17.9 |
18.9 |
-51.7 | |
Source:
Bloomberg.
* As on 16th Jan 2009 as the markets were closed on 19th Jan 2009. |
currencies
against the US dollar, spreads on sovereign and corporate bonds widened. The asset
prices in these countries partly reflected the subdued global macroeconomic prospects,
leading to the expectations of lower returns on EME assets. The decline in commodity
prices also appeared to have put further pressure on EME commodity exporters.
V.20 Central banks in most of the emerging markets conducted
outright sales of foreign reserves to cater to their domestic demand for foreign
currency funding. Some central banks sought to offer foreign reserves to counterparties
under repurchase agreements, while others either modified their existing forex
swap facilities or set up new swap facilities. By end-November 2008, emerging
credit and equity markets came to recover from late-October levels. However, the
adjustments in price/earnings multiples were sharp than those in the major markets,
with relative valuations broadly back in line with the historical levels. V.21
Central banks have engaged in continuous close consultation and have cooperated
in unprecedented joint actions to reduce strains in financial markets. In order
to arrest the rapid erosion of market confidence, ease the funding pressures,
restore liquidity in the markets and stablise the banking system, the governments
and the central banks in virtually all advanced economies responded with a new
array of comprehensive initiatives in quick succession during October and November
2008. These initiatives came in the following forms. First, monetary policy
easing by both individual central banks and coordinated international response
by the major central banks in the form of an unprecedented rounds of policy rate
cuts. Second, provision of cross-border liquidity through swap arrangements
by the co-ordination of major central banks. Third, extending the list
of eligible collaterals and counterparties and auctioning of term funds through
new channels. Fourth, explicit government guarantees on retail deposits
and other bank liabilities. Fifth, reducing bank leverage through government
purchases of distressed assets or capital injections. Sixth, decisive actions
to combat market manipulation and stabilise financial markets, including a temporary
ban on short selling of financial stocks. Seventh, measures aimed at facilitating
lending to consumer and small business sectors. Finally, rescue packages
for restructuring and recapitalisation - guarantees and equity injections aimed
at restarting inter-bank lending and replenishing banks’ capital positions. These
coordinated moves by the major central banks have been critical in addressing
disruptions in the global financial markets and were successful in driving modest
improvement in the market sentiments and easing the acute instability across the
global banking system (Table 39). V.22
The recent episode of global financial market distress was unprecedented in terms
of its magnitude and scale, which has brought several difficult issues to the
fore. First, it has raised the issue of appropriateness of structured products
and derivatives in the credit markets and their financial stability implications,
thereby underscoring a need for eliminating the shortcomings.
| |
Table 39: Recent
Global Response to Finance Market Turmoil | |
Country |
Key Measures |
| 1 | |
2 | |
United States | |
Monetary Policy Easing |
| | • |
Federal funds rate target was reduced
by 50 basis points (bps) each on October 8 and October 29, 2008 to 1.0 per cent. |
| | • |
It was further reduced to a target
range of 0 to 0.25 per cent on December 16, 2008. | | |
Liquidity Provision |
| | • |
Term funds were auctioned through
new channels (TAF, TSLF and PDSLF). | | |
• |
Eligible list of collaterals and
counterparties (including investment banks) was expanded. | | |
• |
Foreign exchange swaps were established
with major central banks for infusing dollar liquidity. | | |
• |
The duration of liquidity support
and provision of cross-border liquidity through swap arrangements was extended. |
| | • |
Commercial Paper (CP) Funding Facility
(CPFF) was created to provide liquidity backstop to CP issuers. |
| | • |
Temporary Liquidity Guarantee Program
(TLGP) was created on October 14, 2008, to help restore market confidence. |
| | • |
Money Market Investor Funding Facility
(MMIFF) was authorised to support a private-sector initiative designed to provide
liquidity to U.S. money market investors. | | |
• |
Term Asset-Backed Securities Loan
Facility (TALF) was created to facilitate credit flow to households and small
businesses. | | |
• |
Three liquidity facilities: the Primary
Dealer Credit Facility (PDCF), the Asset-Backed Commercial Paper Money Market
Fund Liquidity Facility (AMLF), and the Term Securities Lending Facility (TSLF)
were extended up to April 30, 2009. | | |
Financial Restructuring |
| |
• |
Write downs were made by financial
institutions approximating US$ 635 billion. | | |
• |
Top investment banks- Bear Stearns,
Merrill Lynch and Lehman Brothers ceased to exist; Goldman Sachs and Morgan Stanley
were converted into bank holding companies. | | |
• |
15 banks declared bankruptcy - Washington
Mutual Inc. filed for biggest ever bankruptcy after sale of assets of its banking
unit to JP Morgan. | | |
• |
Wachovia, the 6th largest US bank
was taken over by Wells Fargo & Co. | | |
• |
American Express Company and American
Express Travel Related Services Company were allowed to convert into bank holding
companies. | | |
• |
Bank of America Corporation was permitted
to acquire Merrill Lynch & Company. | | |
Recapitalisation of the Financial
System | | |
• |
Fannie Mae and Freddie Mac and AIG
were taken over by the US Government. | | |
• |
Emergency Economic Stabilisation
Act was passed on October 3, 2008. | | |
• |
Troubled Assets Relief Program, authorising
the US Government to purchase troubled assets of US$ 700 | | | |
billion was introduced. |
| |
• |
Limit on deposit insurance was raised
at banks and credit unions from US$ 100,000 to US$ 250,000 per account. |
| |
• |
The US Treasury Department of the
Treasury announced voluntary Capital Purchase Program. Under the |
| | |
program, the US Treasury would purchase
up to US$ 250 billion of senior preferred shares on standardised terms as described
in the program’s term sheet. | | |
• |
Restructuring of Government’s financial support to
the American International Group (AIG) was announced. | | |
• |
The U.S. government entered into
an agreement with Citigroup to provide a package of guarantees, liquidity access,
and capital. | | |
• |
A program to purchase the direct obligations of housing-related
government-sponsored enterprises and mortgage-backed securities (MBS) was initiated. |
| | |
(Contd...) |
| Table
39: Recent Global Response to Finance Market Turmoil (Concld.) |
| Country |
Key Measures |
| 1 | |
2 | | |
Other Measures |
| | • |
Short selling in specific stocks
in stock exchanges was temporary banned and mark-to-market rules were eased. |
| United
Kingdom | |
Monetary Policy Easing |
| | • |
Official bank rate was cut thrice
by 300 bps during October- December, 2008 and further by 50 bps to 1.5 per |
| | |
cent on January 8, 2009. |
| | • |
The collateral eligible for the long-term
repo operations was extended on October 3, 2008. | | |
Recapitalisation of the Financial
System | | |
• |
After Northern Rock, Bradford and
Bingley became the second mortgage lender to get nationalised |
| | • |
Government rescue plan of UK£400
billion for financial institutions was introduced. | | |
• |
The Government invested £50 billion
in the banking industry, offered guarantees over £250 billion of new bank debt
and further added £100 billion to the existing Bank of England short-term loan
scheme. | | |
• |
The Government took control of Royal
Bank of Scotland (RBS) and Halifax Bank of Scotland (HBOS). | | |
Other Measures |
| | • |
Short selling in specific stocks
in stock exchanges was temporary banned. | | |
• |
Reciprocal currency arrangements
(swap lines) were established with major central banks on September 18 and 26,
2008. | | Other
Countries | |
Monetary Policy Easing |
| | • |
ECB decided to conduct a special
term refinancing operation . | | |
• |
Central banks in the Euro area, Canada,
Sweden and Switzerland reduced their policy rates by 50 bps on October 8, 2008. |
| | • |
ECB announced measures to further
expand the list eligible for collateral, enhance the provision of liquidity through
long-term refinancing and to provide US dollar liquidity through foreign exchange
swaps. | | |
• |
ECB cut its policy rate thrice by
a total of 225 bps between October-December 2008 to 2.0 per cent. |
| | • |
Bank of Japan reduced its policy
rate by 20 bps each on October 31, 2008 and December 19, 2008 to0.1 per cent. |
| | • |
Reserve Bank of Australia (RBA) relaxed
the collateral norms and reduced four times its policy rate by 300 bps to 4.25
per cent during September-December 2008. | | |
• |
RBA announced a foreign exchange
swap facility with the Federal Reserve and a domestic term deposit facility to
further enhance the domestic liquidity. | | |
• |
Bank of Canada lowered its policy
rate by a total of 200 bps since October 2008 to 1.0 per cent. |
| | • |
China cut its benchmark 1-year lending
rate by a total of 216 basis points to 5.31 per cent and CRR by a total of 300
bps since September 2008. | | |
• |
The Hong Kong Monetary Authority
and People’s Bank of China signed a currency swap arrangement. |
| | • |
Bank of Korea reduced its policy
rate by 275 bps since October 2008 to 2.5 per cent. | | |
• |
Bank of Thailand lowered its policy
rate by 100 bps on December 3, 2008 and further by 75 bps to 2 per cent on January
14, 2009. | | |
Recapitalisation of the Financial
System | | |
• |
Germany bailed out IKB Deutsche Industriebank
AG after losses on the US sub-prime investments in June 2008. |
| | • |
Danish central bank rescued Roskilde
Bank and Ebh bank in July and September 2008, respectively. | | |
• |
German Government rescued Hypo Real
Estate Holding AG. | | |
• |
France and Belgium Governments announced
measures to support Dexia SA, the world’s largest lender to local governments. |
| | • |
Governments of Belgium, the Netherlands
and Luxembourg rescued Fortis, a Belgo Dutch banking and insurance group. |
| |
Other Measures |
| | • |
Short-selling in specific stocks
in France, Australia, Ireland, Portugal and Korea was banned/restricted. |
| | • |
Irish government guaranteed deposits
from the six major banks. | | |
• |
Germany guaranteed bank deposits
of private savers. | | |
• |
Australia guaranteed all bank deposits
for three years. | | |
• |
New Zealand guaranteed all deposits
for two years. | |
Source: Websites
of respective central banks. |
Second,
there is a need to address regulatory arbitrage, which had encouraged loose practices,
hunt for quick yields and non-transparent and risky financial products among private
equity funds, structured investment vehicles/ conduits and money market funds,
which were highly leveraged and had nexus with the banking system. Third,
the emerging lesson undeniably remains that regulations have to keep pace with
the innovations and they need to be ahead of the curve, while ensuring concomitantly
that such regulations do not throttle innovation. Fourth, it has also raised
the issue of suitability of universal banking model that has been adopted widely
in recent years. Fifth, the above issues also call for close coordination
among various agencies in which the role of banks, regulators, supervisors and
fiscal authorities with regard to financial stability needs to be relooked.
Sixth, in the wake of unprecedented crisis in the US financial sector and
consequent erosion in the confidence, it cannot be inferred that markets and competition
do not work, but they do need to be managed and regulated appropriately. The right
lesson to draw is that markets and institutions do succumb occasionally to excesses
and regulators have to be vigilant, constantly finding the right balance between
attenuating risk-taking and inhibiting growth. Seventh, notwithstanding
the recent use of innovative and unconventional measures, a more systematic approach
would be required to deal with disposition of distressed assets, the degree of
protection offered to depositors, and the scale and scope of liquidity support
that is offered to institutions and markets. Finally, the recent dip in
the global macro economic outlook has further added to the unstable global financial
market conditions, thus, reiterating that financial sector has no standing of
its own, it derives its strength and resilience from the real economy.
V.23 As
indicated in its Mid-Term Review of Monetary Policy on October 24, 2008, the Reserve
Bank has been closely and consistently monitoring the liquidity and monetary situation
to respond swiftly and effectively to the impact of the global developments on
Indian financial markets. In response to emerging global developments, the Reserve
Bank has taken a number of measures since mid-September 2008. These measures were
aimed at augmenting domestic and foreign exchange liquidity and enabling banks
to continue to lend for productive purposes while maintaining credit quality so
as to sustain the growth momentum (Annex).
Domestic
Financial Markets V.24 The Indian financial markets
came under pressure from mid-September 2008 reflecting the knock-on effects of
the global crises through the monetary, financial and real channels. The contagion
was initially felt in the equity market due to reversal of foreign institutional
portfolio flows and the concomitant effects on the domestic foreign exchange market
and liquidity conditions. The liquidity pressure faced by the mutual funds in
the wake of redemption demands affected banks and other segments of the financial
sector. Thus, all the segments of the financial market came under pressure which
necessitated the Reserve Bank to undertake several measures to augment domestic
and foreign exchange liquidity (Annex). The pressure on money markets was reflected
in call rates breaching the upper bound of LAF corridor till end-October 2008.
In the foreign exchange market, the Indian rupee generally depreciated against
major currencies. In the credit market, lending rates of scheduled commercial
banks, which witnessed a hardening trend initially, declined during December 2008.
Yields softened in the government securities market during the third quarter 2008-09.
Following the trends in major international equity markets, Indian equity markets
saw a decline during the same period (Table 40). Liquidity
Conditions V.25 During 2008-09 so far, liquidity management
operations had to swiftly change beginning mid-September 2008 in order to address
the sharp changes in the financial environment brought about by the knock-on effects
of the severe disruptions in international financial
| Table
40: Domestic Financial Markets at a Glance | |
Year/ Month |
Call Money |
Government Securities |
Foreign Exchange |
Liquidity Management |
Equity | | |
Aver
age Daily Turn
over
(Rs. crore) |
Ave
rage
Call Rates*
(Per
cent) |
Aver
age
Turn
over
in
Govt. Securi
ties
(Rs. crore)+ | Aver
age
10-
Year
Yield
@
(Per
cent) |
Aver
age Daily Inter-bank Turn
over
(US $ million) | Aver
age
Ex
change Rate
(Rs. per
US $) |
RBI’s
net
Foreign Currency Sales
(-)/ Purc
hases
(+)
(US $ million) |
Aver
age 3-month Forward Premia
(Per cent) | Aver
age
MSS Out- standing
# (Rs.
crore) |
Aver
age
Daily Reverse Repo
(LAF)
Out- Standing
(Rs.
crore)
|
Aver
age
Daily BSE Turn
over (Rs.
crore) |
Aver
age Daily NSE Turn
over (Rs.
crore) | Aver
age
BSE Sen
sex** | Aver
age
S&P CNX Nifty** | |
1 |
2 |
3 |
4 |
5 |
6 |
7 |
8 |
9 |
10 |
11 |
12 |
13 |
14 |
15 | |
2006-07 |
21,725 |
7.22 |
4,863 |
7.78 |
18,540 |
45.28 |
26,824
## |
2.14 |
37,698 |
21,973 |
3,832 |
7,812 |
12277 |
3572 | |
2007-08 |
21,393 |
6.07 |
8,104 |
7.91 |
33,672 |
40.24 |
78,203
## |
2.16 |
1,28,684 |
4,677 |
6,275 |
14,148 |
16569 |
4897 | |
Apr 2008 |
19,516 |
6.11 |
6,657 |
8.10 |
36,710 P |
40.02 |
4,325 |
2.68 |
1,70,726 |
26,359 |
5,773 |
13,561 |
16291 |
4902 | |
May 2008 |
19,481 |
6.62 |
6,780 |
8.04 |
31,868 P |
42.13 |
148 |
2.45 |
1,75,565 |
11,841 |
6,084 |
13,896 |
16946 |
5029 | |
Jun 2008 |
21,707 |
7.75 |
6,835 |
8.43 |
38,108 P |
42.82 |
-5,229 |
3.78 |
1,74,433 |
-8,622 |
5,410 |
12,592 |
14997 |
4464 | |
Jul 2008 |
24,736 |
8.76 |
5,474 |
9.18 |
37,163 P |
42.84 |
-6,320 |
6.04 |
1,72,169 |
-27,961 |
5,388 |
12,862 |
13716 |
4125 | |
Aug 2008 |
23,408 |
9.10 |
7,498 |
9.06 |
38,002P |
42.94 |
1,210 |
4.71 |
1,71,944 |
-22,560 |
4,996 |
11,713 |
14722 |
4417 | |
Sep 2008 |
23,379 |
10.52 |
10,418 |
8.45 |
44,032P |
45.56 |
-3,784 |
2.35 |
1,75,666 |
-42,591 |
5,147 |
12,489 |
13943 |
4207 | |
Oct
2008 |
28,995 |
9.9 |
4,321 |
7.85 |
36,662P |
48.66 |
-18,666 |
1.13 |
1,69,123 |
-45,612 |
3,911 |
10,810 |
10550 |
3210 | |
Nov 2008 |
21,812 |
7.57 |
5,866 |
7.41 |
30,938P |
49.00 |
-3,101 |
4.20 |
1,47,648 |
-8,017 |
3,539 |
9,618 |
9454 |
2835 | |
Dec.2008 |
21,641 |
5.92 |
11,451 |
5.88 |
– |
48.63 |
– |
4.59 |
1,24,848 |
22,294 |
3,850 |
10,141 |
9514 |
2896 | |
* : Average of daily weighted call money borrowing
rates. + : Average of daily outright turnover in Central Government dated securities.
@ : Average of daily closing rates. # : Average of weekly outstanding MSS.
** : Average of daily closing indices. ## : Cumulative for the financial year.
LAF : Liquidity Adjustment Facility. BSE : Bombay Stock Exchange Limited.
MSS : Market Stabilisation Scheme. – : Not available.
NSE : National Stock
Exchange of India Ltd. P : Provisional.
Note : In column 11, (-) indicates
injection of liquidity, while (+) indicates absorption of liquidity. |
markets. A holistic
account of liquidity management operations is given in Box 1. Cash
Management of the Central Government V.26 Commencing
the year with a surplus cash balance of Rs.76,686 crore (end-March 2008), built
primarily from surplus balances of State Governments which were invested in Treasury
Bills, the Central Government used up these balances to meet its expenditure needs
and resorted to WMA between August 4, 2008 and August 6, 2008. With inflow of
indirect taxes and surplus transferred from the Reserve Bank, the cash balances
turned into surplus between August 7, 2008 and September 1, 2008. The Central
Government again resorted to WMA during September 2-14, 2008 to meet the mismatches
in receipts and expenditure. Surpluses built by advance tax flows in the latter
half of September 2008 were utilised to meet the increased expenditure requirement
of the Central Government. During the second half of 2008-09 (up to January 19,
2009), the Central Government resorted to WMA on three occasions, viz., November
4-7, 2008, December 1-16, 2008 and December 29, 2008-January 19, 2009. The daily
average utilisation of WMA by the Central Government (up to January 19, 2009)
was Rs.1,623 crore as compared with Rs.3,196 crore a year ago. Due to additional
funding requirements, the Central Government also availed of overdraft (OD) for
the first time in the current financial year, during December 5-14, 2008, January
1-11, 2009 and January 16-19, 2009. The daily average of OD was Rs.1,088 crore
as compared with Rs.425 crore a year ago (Chart 18). Box
1: Liquidity Management Operations during 2008-09 During
most part of the first half of the current fiscal year 2008-09, liquidity management
operations were essentially geared towards mopping up of excess domestic liquidity,
mainly through CRR hikes, with a view to containing inflationary pressures largely
emanating from rising crude and commodity prices. In conjunction, the foreign
exchange market operations of the Reserve Bank to contain excessive volatility
in the exchange rate also absorbed domestic liquidity and obviated the need for
issuing dated securities under MSS. Overnight rates were maintained at the upper
end of the corridor during July to mid-September 2008 and the frictional liquidity
requirements of the banking system were met through LAF. Beginning mid- September
2008, domestic money and foreign exchange markets came under pressure from the
indirect effects of the global financial turmoil. The Reserve Bank’s operations
to contain volatility in the foreign exchange market coupled with transient factors
like advance tax payments exacerbated the pressure on rupee liquidity. Consequently,
overnight rates moved above the upper bound of the LAF corridor. With the abatement
of inflationary pressures, rupee liquidity was augmented through, inter alia,
reduction in the CRR and a slew of special facilities as detailed in the Annex.
The availment under LAF also increased substantially. These apart, MSS buyback
auctions were timed to alleviate domestic liquidity pressures. 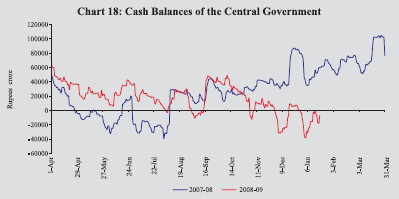
Liquidity
Management V.27 During the period April to mid-September
2008, the drying up of capital inflows and the consequent turnaround in the foreign
exchange operations of the Reserve Bank from net spot purchases up to May 2008
to net spot sales thereafter (barring August 2008) reduced the generation of domestic
liquidity (Table 41). Consequently, the MSS auctions of dated securities were
kept in abeyance since end-April 2008 (Chart 19). At the same
time, however, the general decline in the cash balances of the Central Government
eased systemic liquidity conditions except during advance tax collections around
mid-June 2008. On the other hand, against the backdrop of inflationary pressures,
CRR was increased (in April, May, July and August) cumulatively by 150 basis points
to 9.0 per cent effective August 30, 2008 and the repo rate was raised cumulatively
by 125 basis points (in June and July 2008) to 9.0 per cent effective July 30,
2008. Reflecting the impact of these developments, the LAF turned from absorption
mode to injection mode after the first week of June 2008.
V.28
Beginning mid-September 2008, the bankruptcy/sell out/ restructuring of some of
the world’s largest financial institutions brought pressures on the domestic money
and foreign exchange markets, in conjunction with temporary local factors such
as advance tax outflows. In order to alleviate these pressures, the Reserve Bank
initiated a series of measures beginning mid-September 2008 to augment rupee and
dollar liquidity (Annex). The average daily net outstanding
liquidity injection under LAF was Rs.42,591 crore during September 2008 as compared
with Rs. 22,560 crore in the previous month. There were no fresh issuances under
the MSS after September 2, 2008 and the actual balances under the MSS was Rs.1,73,804
crore as on September 26, 2008 (Table 42).
| Table
41: Reserve Bank’s Liquidity Management Operations | |
(Rupees crore) | |
Item |
2007-08 |
2007-08 |
2008-09 | | | |
Q1 |
Q2 |
Q3 |
Q4 |
Q1 |
Q2 |
Oct. |
Nov. | |
1 |
2 |
3 |
4 |
5 |
6 |
7 |
8 |
9 |
10 | |
A. |
Drivers of Liquidity | | | | | | | | | |
| | (1+2+3+4+5) |
2,04,026 |
51,146 |
1,11,169 |
-1,694 |
43,405 |
28,489 |
-13,572 |
-82,724 |
-4,821 | |
1. |
RBI’s net purchases from | | | | | | | | | |
| | Authorised
Dealers | 3,12,054 |
39,791 |
1,00,896 |
88,545 |
82,822 |
-8,555 |
-40,249 |
-91,403 |
-16,253 | |
2. |
Currency with the Public |
-84,571 |
-12,946 |
9,565 |
-47,131 |
-34,058 |
-30,623 |
11,894 |
-34,422 |
5,103 | |
3. |
Surplus cash balances of the | | | | | | | | | |
| | Centre
with the Reserve Bank | -26,594 |
49,992 |
-30,771 |
-49,820 |
4,005 |
40,073 |
-3,845 |
25,975 |
6,402 | |
4. |
WMA and OD |
0 |
15,159 |
-15,159 |
0 |
0 |
0 |
0 |
0 |
0 | |
5. |
Others (residual) |
3,137 |
-40,850 |
46,639 |
6,712 |
-9,364 |
27,595 |
18,629 |
17,126 |
-73 | |
B. |
Management of Liquidity | | | | | | | | | |
| | (6+7+8+9) |
-1,17,743 |
-53,943 |
-68,621 |
-11,189 |
16,010 |
-51,239 |
1,472 |
1,26,355 |
9,073 | |
6. |
Liquidity impact of LAF |
21,165 |
-20,290 |
-2,825 |
27,795 |
16,485 |
-18,260 |
24,390 |
17,110 |
-63,710 | |
7. |
Liquidity impact of OMO (Net) * |
13,510 |
10 |
40 |
5,260 |
8,200 |
1,062 |
6,204 |
628 |
127 | |
8. |
Liquidity impact of MSS |
-1,05,418 |
-18,163 |
-50,336 |
-28,244 |
-8,675 |
-6,041 |
628 |
8,617 |
32,656 | |
9. |
First round liquidity | | | | | | | | | |
| | impact
due to CRR change | -47,000 |
-15,500 |
-15,500 |
-16,000 |
0 |
-28,000 |
-29,750 |
1,00,000 |
40,000 | |
C. Bank Reserves (A+B) # |
86,283 |
-2,797 |
42,548 |
-12,883 |
59,415 |
-22,750 |
-12,100 |
43,631 |
4,252 | |
(+) : Indicates injection of liquidity into the banking
system.
(-) : Indicates absorption of liquidity from the banking system.
# : Includes vault cash with banks and adjusted for first round liquidity impact
due to CRR change.
* : Adjusted for Consolidated Sinking Funds (CSF) and Oil
bonds.
Note : Data pertain to March 31 and last Friday for all other
months. |
V.29
In October 2008, as part of the various measures to augment rupee liquidity, the
CRR was reduced by 250 basis points to 6.50 per cent effective from the fortnight
beginning October 11, 2008. Deficit liquidity conditions, however, 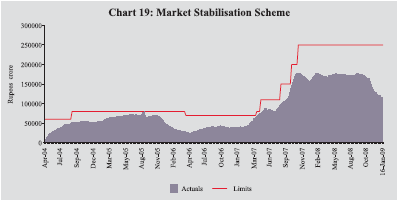
| Table
42: Liquidity Management | |
(Rupees crore) | |
Outstanding
as on
Last
Friday | LAF |
MSS |
Centre’s Surplus
with the
RBI
@ | Total (2
to 4) | Outstanding
as
on
Last Friday | LAF |
MSS |
Centre’s Surplus
with the
RBI
@ | Total
(2 to 4) | | 1 |
2 |
3 |
4 |
5 |
1 |
2 |
3 |
4 |
5 | |
2007 | | | | |
2008 | | | | |
| January |
-11,445 |
39,375 |
42,494 |
70,424 |
January |
985 |
1,66,739 |
70,657 |
2,38,381 | |
February |
6,940 |
42,807 |
53,115 |
1,02,862 |
February |
8,085 |
1,75,089 |
68,538 |
2,51,712 | |
March * |
-29,185 |
62,974 |
49,992 |
83,781 |
March* |
-50,350 |
1,68,392 |
76,586 |
1,94,628 | |
April |
-9,996 |
75,924 |
-980 |
64,948 |
April |
32,765 |
1,72,444 |
36,549 |
2,41,758 | |
May |
-4,690 |
87,319 |
-7,753 |
74,876 |
May | -9,600 |
1,75,362 |
17,102 |
1,82,864 | |
June |
-8,895 |
81,137 |
-15,159 |
57,083 |
June | -32,090 |
1,74,433 |
36,513 |
1,78,856 | |
July |
2,992 |
88,010 |
-20,199 |
70,803 |
July | -43,260 |
1,71,327 |
15,043 |
1,43,110 | |
August |
16,855 |
1,06,434 |
20,807 |
1,44,096 |
August |
-7,600 |
1,73,658 |
17,393 |
1,83,451 | |
September |
-6,070 |
1,31,473 |
30,771 |
1,56,174 |
September |
-56480 |
1,73,804 |
40,358 |
1,57,682 | |
October |
18,135 |
1,74,277 |
23,735 |
2,16,147 |
October |
-73,590 |
1,65,187 |
14,383 |
1,05,980 | |
November |
-1,320 |
1,71,468 |
36,668 |
2,06,816 |
November |
-9,880 |
1,32,531 |
7,981 |
1,30,632 | |
December |
-33,865 |
1,59,717 |
80,591 |
2,06,443 |
December |
14,630 |
1,20,050 |
3,804 |
1,38,484 | | | | | | |
2009 | | | | |
| | | | | |
January 16 |
31,795 |
1,13,651 |
-9,263 |
1,36,183 | |
@ : Excludes minimum cash balances with the Reserve
Bank in case of surplus.
* : Data pertain to March 31.
Note :
1. Negative sign in column 2 indicates net injection of liquidity through
LAF.
2. Between March 5 and August 5, 2007, daily reverse repo absorptions
were restricted to a maximum of Rs.3,000 crore comprising Rs.2,000 crore in the
First LAF and Rs.1,000 crore in the Second LAF. The Second LAF that was discontinued
from August 6, 2007 was reintroduced from August 1, 2008 on Reporting Fridays
and from September 17, 2008 on daily basis.
3. Negative sign in column 4 indicates
injection of liquidity through WMA/overdraft. |
persisted
during October 2008 mainly due to sharp increase in bank credit and festive season
currency demand. V.30 On November 1, 2008, another set of
monetary measures were announced in view of then prevailing financial conditions,
which included: (i) further reduction in CRR by 100 basis points in two stages
viz., to 6.0 per cent retrospectively with effect from October 25 and to
5.5 per cent with effect from November 8, 2008; (ii) introduction of a special
refinance facility under Section 17 (3B) of the Reserve Bank of India Act to provide
further comfort on liquidity and to impart flexibility in liquidity management
to banks; (iii) permanent reduction of 100 basis points in SLR to 24 per cent
from November 8, 2008 (as against a temporary reduction to the same extent announced
on September 16, 2008); and (iv) enhancement of the relaxation in SLR maintenance
in the context of the term repo facility from 0.5 per cent to 1.5 per cent of
the banks’ NDTL with effect from November 1, 2008. Furthermore, between April
1, 2008-December 31, 2008, the outstanding balances under MSS fell by Rs.49,201
crore to Rs.1,21,353 crore, notwithstanding fresh issuances of Rs.43,500 crore
till September 2008. This fall was on account of redemption to the tune of Rs.54,737
crore and buy-backs (during November-December 2008) of Rs.37,964 crore (Chart
20). Reflecting the impact of the various monetary measures, the average daily
net outstanding liquidity injection under LAF declined significantly to Rs.8,017
crore during November 2008 from that of Rs.45,612 crore during October 2008. V.31
Liquidity conditions continued to ease during December 2008. The LAF shifted from
net injection mode to net absorption mode with effect from December 1, 2008. The
average daily net outstanding liquidity absorption under LAF was Rs.22,294 crore
during December 2008. V.32 On a review of the prevailing
global and domestic macroeconomic situation, the Reserve Bank reduced (a) the
CRR by a further 50 basis points to 5.0 per cent effective from the fortnight
beginning January 17, 2009, (b) the repo rate by a further 100 basis points to
5.5 per cent and (c) the reverse repo rate by 100 basis points to 4.0 per cent
effective from January 5, 2009. The liquidity absorption under LAF on January
22, 2009 was at Rs.54,750 crore. The outstanding balances under the MSS declined
further to Rs.1,10,651 crore as on January 19, 2009, mainly reflecting buy-back
of Rs.6,580 crore. Money Market V.33
Money market remained, by and large orderly, with call rates remaining generally
within the informal corridor of reverse repo and repo rates during the first quarter
of 2008-09. The weighted average daily call rate was 6.83 per cent in the first
quarter. As detailed in previous section, monetary policy was tightened on the
back of inflationary pressues in stages till August 2008 and the call rates hovered
around the upper bound of the corridor during the second quarter (upto mid-September
2008). In mid-September, the failure of Lehman Brothers and some 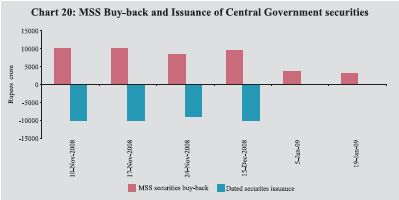
other
global financial institutions led to freezing of money market activities in major
financial centres. The Indian markets were also indirectly affected and the impact
on money market rates was magnified as it concided with the period of advance
tax outflows from the banking system. Reflecting the tight liquidity conditions,
the call money rate moved above the repo rate till the end of September 2008.
The weighted average daily call rate was 9.46 per cent in the second quarter. V.34
The pressure on money markets continued to prevail in the beginning of the third
quarter of 2008-09, partly on account of the foreign exchange operations of the
Reserve Bank undertaken to contain excess volatility. Consequently, the call rate
continued to remain above the informal corridor in the first half of October 2008.
Subsequently, the call rate declined under the impact of the reduction in the
cash reserve ratio (CRR) by 250 basis points to 6.50 per cent with effect from
the fortnight beginning October 11, 2008. The call rate again crossed the upper
bound of the LAF corridor in the last week of October 2008, partly reflecting
the festive season increase in demand for currency. V.35
During the period of market stress, i.e., during mid-September to end-October
2008, out of a total of 47 days, the daily weighted average call rate and the
overnight weighted average money market rate (OWAR) crossed the upper bound of
the LAF corridor on 36 days and 31 days, respectively (Chart 21).
During the same period the call rate averaged 10.56 per cent, while the OWAR averaged
lower at 8.98 per cent. V.36 As the demand for currency
receded and as the series of measures initiated by the Reserve Bank, including
the reduction in the repo rate by a cumulative 150 basis points to 7.5 per cent
with effect from November 3, 2008, began to take effect, the weighted average
call 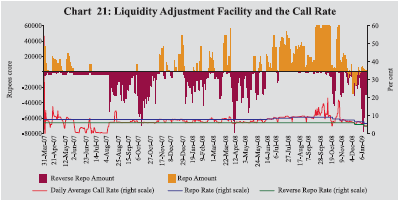
money
rate declined from a high of 19.7 per cent (on October 10, 2008) and mostly remained
within the LAF corridor from November 3, 2008 onwards. V.37
Liquidity conditions continued to improve from December 2008 onwards following
the reduction of 100 basis points each in repo rate and reverse repo rate to 6.5
per cent and 5.0 per cent, respectively with effect from December 8, 2008. The
weighted average daily call rate declined from 9.9 per cent in October 2008 to
7.57 per cent in November 2008. The OWAR has also mostly remained well below the
upper bound of the LAF corridor since November 3, 2008. The weighted average daily
call rate and the OWAR in December 2008 were placed at 5.92 per cent and 5.22
per cent, respectively. The call money rate declined further with the reduction
in the repo rate and reverse repo rate to 5.5 per cent and 4.0 per cent, respectively,
effective from January 5, 2009. On January 22, 2009, the weighted average daily
call rate and the OWAR were placed at 4.21 per cent and 4.01 per cent, respectively
(Chart 22). Interest rates in the collateralised segments of
the money market – the market repo (outside the LAF) and the Collateralised Borrowing
and Lending Obligation (CBLO) – moved in tandem with but remained below the call
rate during the third quarter of 2008-09. V.38 Unlike in
the case of some of the other countries, there were no major disruptions in the
money market in India during post mid-September 2008, primarily because there
was no solvency issue in respect of Indian banks and the prudent SLR prescription
provided adequate leeway to the Reserve Bank for meeting their liquidity needs
through LAF without diluting the collateral quality. V.39
Special Market Operations (SMO) were conducted by the Reserve Bank from June 2008
till August 2008 to improve the access of public sector oil companies to domestic
liquidity and alleviate the lumpy demand in the foreign exchange market in 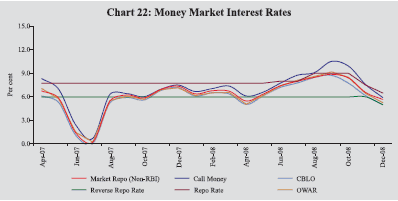
the
context of the unprecedented increase in international oil prices. The SMO was
an exceptional measure for minimising potential adverse consequences for financial
markets in a transparent manner. In this phase, the SMOs were liquidity neutral
since the settlement dates of the foreign exchange transactions and transactions
in oil bonds were synchronised. SMOs were resumed but with calibrated provision
of US dollars from November 24, 2008 and continued till January 2, 2009. Certificates
of Deposit V.40 The outstanding amount of certificates
of deposit (CDs) issued by scheduled commercial banks (SCBs) increased from Rs.1,47,792
crore at end-March 2008 to Rs.1,78,280 crore as on September 12, 2008. Thereafter,
the outstanding amount declined to Rs.1,51,214 crore as on December 19, 2008 reflecting
the pressures on domestic financial markets. The outstanding amount constituted
5.2 per cent of aggregate deposit of CD-issuing banks with a significant inter-bank
variation as on December 19, 2008. During April-December 2008, the average issuance
of CDs was placed at Rs.6,253 crore as compared with Rs.5,780 crore in the corresponding
period of previous year and Rs.6,709 crore during 2007-08 (full year). Most of
the CDs issued were of more than six months duration. The weighted average discount
rate (WADR) of CDs declined from 10.0 per cent at end-March 2008 to 9.16 per cent
at end-June 2008, but increased steadily to 12.57 per cent on October 10, 2008.
Thereafter, the WADR declined to 8.85 per cent as on December 19, 2008 in tandem
with movements in other money market rates (Table 43).
| Table
43: Activity in Money Market Segments | |
(Rupees crore) | |
Year/ Month |
Average Daily Volume (One Leg) |
Commercial Paper |
Certificates of Deposit |
| | Call
Money Market | Repo
Market
(Outside
the LAF) |
Collateralised
Borrowing
and
Lending Obligation
(CBLO) |
Total
(2+3+4) |
Term
Money Market |
Outstanding | |
WADR
(per cent) |
Outstanding | |
WADR
(per cent) |
| 1 |
2 |
3 |
4 |
5 |
6 |
7 | |
8 |
9 | |
10 | |
2006-07 |
10,863 |
8,419 |
16,195 |
35,477 |
506 |
21,329 |
* |
8.08 |
64,821 |
* |
8.24 | |
2007-08 |
10,697 |
13,684 |
27,813 |
52,194 |
352 |
33,813 |
* |
9.20 |
1,16,904 |
* |
8.94 | |
Apr 2008 |
9,758 |
14,966 |
38,828 |
63,552 |
374 |
37,584 | |
8.85 |
1,50,865 | |
8.49 | |
May 2008 |
9,740 |
14,729 |
36,326 |
60,795 |
420 |
42,032 | |
9.02 |
1,56,780 | |
8.95 | |
Jun 2008 |
10,854 |
11,262 |
35,774 |
57,890 |
253 |
46,847 | |
10.03 |
1,63,143 | |
9.16 | |
Jul 2008 |
12,368 |
8,591 |
23,669 |
44,628 |
226 |
51,569 | |
10.95 |
1,64,892 | |
10.23 | |
Aug 2008 |
11,704 |
10,454 |
22,110 |
44,268 |
501 |
55,036 | |
11.48 |
1,71,966 | |
10.98 | |
Sep 2008 |
11,690 |
10,654 |
20,547 |
42,891 |
335 |
52,038- | |
12.28 |
1,75,522 | |
11.56 | |
Oct 2008 |
14,497 |
9,591 |
16,818 |
40,906 |
345 |
48,442 | |
14.17 |
1,58,562 | |
10.00 | |
Nov 2008 |
10,906 |
15,191 |
24,379 |
50,476 |
319 |
44,487 | |
12.42 |
1,51,493 | |
10.36 | |
Dec 2008 |
10,820 |
16,943 |
32,261 |
60,024 |
415 |
38,055 | |
10.98 |
1,51,214 | |
8.85 | |
* : Average for the year.
WADR : Weighted Average
Discount Rate. |
Commercial
Paper V.41 The outstanding amount of commercial paper
issued by corporates increased gradually from Rs.32,592 crore at end-March 2008
to Rs.55,036 crore at end-August 2008 in line with the seasonal pattern observed
in case of CP issuances. The average issuance of CP during April-December 2008
was at Rs.4,643 crore as compared with Rs.4,033 crore in the corresponding period
of previous year and Rs.4,153 crore during 2007-08 (full year). Leasing and Finance
Companies continued to be the major issuers of CP, followed by ‘manufacturing
and other companies’ and financial institutions (Table 44).
As earlier, CP issuance was dominated by the prime-rated companies. The WADR on
CP declined from 10.38 per cent on March 31, 2008 to 8.57 per cent as at mid-May
2008. Thereafter it increased steadily to 14.17 per cent as at end-October 2008
but again declined to 10.98 per cent as at end-December 2008. The most preferred
tenor of CP issuance was ‘more than 180 days’. V.42 Starting
from mid-September 2008, the outstanding amount of CPs declined continuously reflecting
disturbances in financial markets and stood at Rs.38,055 crore as at end-December
2008. Issuing & Paying Agents (IPAs) have reported defaults in repayments
of CPs issued by two realty companies in recent months. Also, the differential
in the WADR of CP vis-a-vis CDs, has widened reflecting preference for
bank CDs in the recent period. Treasury Bills V.43
During the third quarter of 2008-09 primary market yields on Treasury Bills (TBs)
showed a declining trend on account of various measures taken by the Reserve Bank
to enhance liquidity in the system and cuts in policy rates (Table
45 and Chart 23). Thus, movements in Treasury Bill yields
have corresponded to monetary policy changes. The yield spread between 364-day
and 91-day TB was -1 basis point in December 2008 (7 basis points in March 2008).
| Table
44: Commercial Paper - Major Issuers | |
(Rupees crore) | |
Category of Issuer |
March
2007 |
March
2008 |
End of
June
2008 |
September
2008 |
December
2008 |
| 1 |
2 |
3 |
4 |
5 |
6 | |
Leasing and Finance |
12,594 |
24,925 |
34,957 |
39,053 |
27,965 | | |
(70.5) |
(76.5) |
(76.6) |
(75.0) |
(73.5) | |
Manufacturing |
2,754 |
5,687 |
8,150 |
9,925 |
6,833 | | |
(15.4) |
(17.4) |
(17.4) |
(19.1) |
(18.0) | |
Financial Institutions |
2,515 |
1,980 |
3,740 |
3,060 |
3,257 | | |
(14.1) |
(6.1) |
(8.0) |
(5.9) |
(8.5) | |
Total |
17,863 |
32,592 |
46,847 |
52,038 |
38,055 | | |
(100.0) |
(100.0) |
(100.0) |
(100) |
(100) | |
Note :
Figures in parentheses are percentage shares in the total outstanding. |
| Table
45: Treasury Bills in the Primary Market | |
Month |
Notified
Amount
(Rupees
crore) | Average
Implicit Yield
at Minimum Cut-off Price
(Per cent) |
Average Bid-Cover Ratio |
| | |
91-day |
182-day |
364-day |
91-day |
182-day |
364-day | |
1 |
2 |
3 |
4 |
5 |
6 |
7 |
8 | |
2006-07 |
1,86,500@ |
6.64 |
6.91 |
7.01 |
1.97 |
2.00 |
2.66 | |
2007-08 |
2,24,500@ |
7.10 |
7.40 |
7.42 |
2.84 |
2.79 |
3.21 | |
Apr 2008 |
22,000 |
7.28 |
7.41 |
7.53 |
2.63 |
3.17 |
2.36 | |
May 2008 |
21,000 |
7.41 |
7.55 |
7.61 |
2.92 |
2.73 |
3.43 | |
Jun 2008 |
11,500 |
8.01 |
8.42 |
7.93 |
2.45 |
2.76 |
2.80 | |
Jul 2008 |
16,000 |
9.07 |
9.33 |
9.39 |
2.56 |
2.72 |
3.52 | |
Aug 2008 |
23,500 |
9.15 |
9.31 |
9.24 |
2.99 |
2.86 |
4.24 | |
Sep 2008 |
25,000 |
8.74 |
8.92 |
8.83 |
3.06 |
3.04 |
3.57 | |
Oct 2008 |
35,000 |
8.13 |
8.36 |
7.92 |
1.95 |
2.42 |
4.00 | |
Nov 2008 |
28,000 |
7.30 |
7.13 |
7.23 |
7.95 |
2.97 |
3.51 | |
Dec 2008 |
16,500 |
5.49 |
5.35 |
5.48 |
5.36 |
4.67 |
5.59 | |
@: Total for the financial year.
Note :
1. 182-day TBs were reintroduced with effect from April 2005.
2. Notified
amounts are inclusive of issuances under the Market Stabilisation Scheme (MSS). |
Foreign Exchange
Market V.44 The rupee moved in the range of Rs.39.89-50.53
per US dollar during the financial year 2008-09 so far (up to January 20, 2009).
The rupee showed a depreciating trend during the second quarter of 2008-09, which
started in the beginning of current financial year. The rupee remained around
the level of Rs.43 per US dollar during third week of May 2008 to second week
of August 2008, depreciated thereafter sharply mainly on the back of widening
trade deficit, capital outflows and strengthening of US dollar vis-à-vis
other major currencies. The 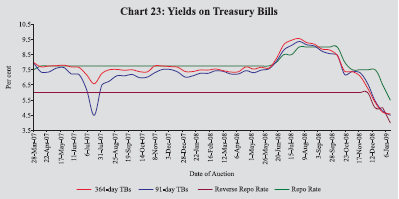
rupee/US
dollar exchange rate, which was Rs. 39.99 per dollar at end-March 2008, fell to
its lowest level at Rs. 50.53 per dollar as on December 02, 2008, before recovering
to Rs. 49.00 per dollar as on January 20, 2009. As on January 20, 2009, the Indian
rupee depreciated by 18.4 per cent over its level on March 31, 2008. Over the
same period, the rupee experienced a depreciation of 1.0 per cent against the
euro, 26.1 per cent against the Japanese yen and 20.5 per cent against the Chinese
yuan. However, the rupee showed an appreciation of 13.9 per cent against Pound
sterling (Chart 24). V.45 After witnessing
appreciation during 2007-08 on account of large capital inflows, the trade weights
based nominal effective exchange rate (NEER) and real effective exchange rate
(REER) of the Indian rupee depreciated during 2008-09 so far. The 36-currency
trade weighted NEER and REER depreciated by 7.8 per cent and 9.4 per cent, respectively,
between March 2008 and October 2008 as against an appreciation of 9.4 per cent
and 5.9 per cent, respectively, during the corresponding period of the previous
year, reflecting widened trade deficit and moderation in capital flows. Over the
same period, the 6-currency trade weighted NEER and REER of the rupee depreciated
by 11.8 per cent and 7.6 per cent, respectively, as against an appreciation of
7.4 per cent and 7.8 per cent, respectively during the corresponding period of
previous year. As on January 20, 2009, the 6-currency trade weighted NEER and
REER of the rupee indicated a depreciation of 10.7 per cent and 10.1 per cent,
respectively, over its end-March 2008 level (Table 46). V.46
Forward premia increased during November-December 2008 on the back of reduced
interest rates in the domestic market and declined hedging requirements by the
exporters as a result of rupee depreciation and decreased export and import performance.
As on January 16, 2009, the one month, three month and six 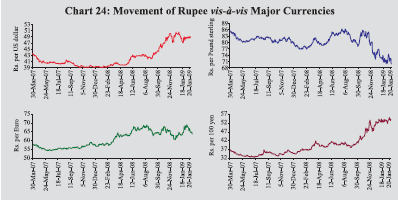
| Table
46: Nominal and Real Effective | |
Exchange Rate of the Indian Rupee
(Trade-Based
Weights) | | Year/Month |
Base : 1993-94 (April-March) =
100 | | |
6-Currency |
36-Currency |
| |
Weights |
Weights | | |
NEER |
REER |
NEER |
REER | |
1 |
2 |
3 |
4 |
5 | |
2006-07 |
69.49 |
105.57 |
85.89 |
98.48 | |
2007-08 (P) |
74.17 |
114.09 |
93.91 |
105.13 | |
Apr 2008 (P) |
70.63 |
112.16 |
93.26 |
102.10 | |
May 2008 (P) |
67.48 |
108.23 |
89.02 |
97.95 | |
Jun 2008 (P) |
66.38 |
108.20 |
87.65 |
98.00 | |
July 2008(P) |
65.83 |
107.94 |
87.04 |
97.67 | |
Aug 2008(P) |
67.22 |
111.30 |
88.60 |
99.93 | |
Sep. 2008(P) |
64.37 |
106.96 |
85.54 |
96.65 | |
Oct 2008(P) |
62.08 |
102.40 |
83.02 |
92.73 | |
Nov 2008(P) |
63.06 |
102.94 |
– |
– | |
Dec 2008(P) |
62.12 |
100.10 |
– |
– | |
Jan 20, 2009 (P) |
62.66 |
99.89 | | |
| NEER
: Nominal Effective Exchange Rate.
REER : Real Effective Exchange Rate.
P : Provisional. – : Not available.
Note :
1. Data from 2007-08
onwards are provisional.
2. Rise in indices indicates appreciation of the rupee
and vice versa. |
month
premia were at 4.1 per cent, 3.0 per cent and 2.3 per cent, respectively (Chart
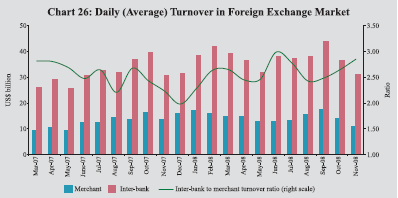
25). V.47 The daily average turnover in the foreign
exchange market has decreased to US $ 46.1 billion during the third quarter of
2008-09 (October-November) as compared with US $ 50.2 billion during the corresponding
quarter of the previous year. The daily average turnover in inter-bank and merchant
segments of the foreign exchange market were US $ 33.8 billion and US $ 12.3 billion,
respectively, during the third quarter of the current financial year. The ratio
of inter-bank to merchant turnover remained at 2.7 during the third quarter of
2008-09 (Chart 26). Credit Market V.48
Benchmark prime lending rates (BPLRs) hardened during October 2008 over the levels
in March 2008. In response to the Reserve Bank’s measures taken since mid-September
2008, most of the PSBs have reduced their BPLRs from November 2008. Accordingly,
the BPLR of PSBs decreased from the range of 13.75-14.75 per cent in September
2008 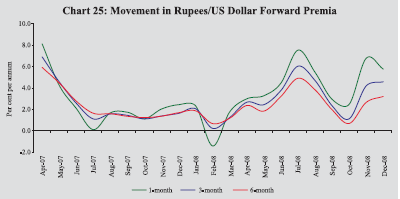
to
a range of 12.00-14.00 per cent in January 2009 (up to January 20, 2009). Similarly,
the private sector banks also reduced their BPLR from the
range of 13.75-17.75 per cent to 13.00-17.25 per cent during the same period (Table
47 and Chart 27).
| Table
47: Deposit and Lending Rates | |
(Per cent) | |
Item |
March 2007 |
March 2008 |
June 2008 |
September 2008 |
December 2008 |
January 2009# |
| 1 |
2 |
3 |
4 |
5 |
6 |
7 | |
1. |
Domestic Deposit Rate | | | | | | |
| |
Public Sector Banks | | | | | | |
| |
Up to 1 year |
2.75-8.75 |
2.75-8.50 |
2.75-9.00 |
2.75-10.25 |
2.75-10.25 |
2.75-9.75 | | |
More than 1 year and up to 3 years |
7.25-9.50 |
8.25-9.25 |
8.25-9.50 |
8.75-10.25 |
8.50-10.75 |
7.50-9.75 | | |
More than 3 years |
7.50-9.50 |
8.00-9.00 |
8.00-9.35 |
8.50-9.75 |
8.50-9.75 |
7.50-9.25 | | |
Private Sector Banks | | | | | | |
| |
Up to 1 year |
3.00-9.00 |
2.50-9.25 |
3.00-8.75 |
3.00-9.75 |
3.00-10.00 |
3.00-10.00 | | |
More than 1 year and up to 3 years |
6.75-9.75 |
7.25-9.25 |
8.00-9.50 |
8.30-10.50 |
9.00-11.00 |
8.25-11.00 | | |
More than 3 years |
7.75-9.60 |
7.25-9.75 |
8.00-10.00 |
8.25-10.25 |
8.50-11.00 |
8.25-10.25 | | |
Foreign Banks | | | | | | |
| |
Up to 1 year |
3.00-9.50 |
2.25-9.25 |
3.00-9.25 |
3.50-9.75 |
3.50-9.75 |
3.00-9.00 | | |
More than 1 year and up to 3 years |
3.50-9.50 |
3.50-9.75 |
3.50-9.75 |
3.50-10.50 |
3.50-11.25 |
3.50-10.25 | | |
More than 3 years |
4.05-9.50 |
3.60-9.50 |
3.60-9.50 |
3.60-11.00 |
3.60.11.00 |
3.60-10.00 | |
2. |
Benchmark Prime Lending Rate | | | | | | |
| |
Public Sector Banks |
12.25-12.75 |
12.25-13.50 |
12.50-14.00 |
13.75-14.75 |
12.50-14.00 |
12.00-14.00 | | |
Private Sector Banks |
12.00-16.50 |
13.00-16.50 |
13.00-17.00 |
13.75-17.75 |
13.00-17.25 |
13.00-17.25 | | |
Foreign Banks |
10.00-15.50 |
10.00-15.50 |
10.00-15.50 |
10.00-16.00 |
10.00-17.00 |
10.00-17.00 | |
3. |
Actual Lending Rate* | | | | | | |
| |
Public Sector Banks |
4.00-17.00 |
4.00-17.75 |
4.00-18.00 |
6.00-18.75 |
– |
– | | |
Private Sector Banks |
3.15-25.50 |
4.00-24.00 |
4.00-25.00 |
5.06-23.00 |
– |
– | | |
Foreign Banks |
5.00-26.50 |
5.00-28.00 |
5.00-25.50 |
5.00-25.50 |
– |
– | |
# : Up to January 20, 2009. – : Not available.
*: Interest rate on non-export demand and term loans above Rs.2 lakh excluding
lending rates at the extreme five per cent on both sides. |
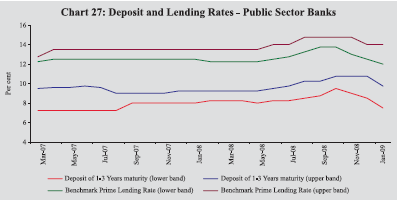
Government
Securities Market Central Government Securities V.49
Gross and net market borrowings (dated securities and 364-day Treasury Bills)
of the Central Government during 2008-09 (up to January 19, 2009) amounted to
Rs.2,22,154 crore and Rs.1,51,697 crore, respectively, accounting for 89.9 per
cent and 89.0 per cent of the estimated market borrowings for the year (Table
48). During the corresponding period of the previous year, gross and net borrowings
accounted for 91.6 per cent and 93.1 per cent, respectively, of the estimated
market borrowing for the year. During the first half of the year, all the issuances
of dated securities were in accordance with the issuance calendar for the first
half of the year, except on two occasions. During the second half of the year,
two auctions scheduled for the month of October for dated securities amounting
to Rs.20,000 crore were cancelled in view of the prevailing liquidity conditions
and cut in repo rate. This amount was raised in the subsequent auctions. The issuance
calendar for dated securities for the second half of 2008-09 (October-March),
which was released on September 26, 2008 in consultation with the Government of
India to raise Rs.39,000 crore, was revised on two occasions in the light of additional
expenditure requirement of the Central Government following passage of the first
and second supplementary demand for grants and the concomitant need to raise additional
resources. Accordingly, two indicative calendars were issued on December 5, 2008
and January 6, 2009 –the latter superseding the former – in consultation with
the Government of India, for raising an additional Rs.70,000 crore over and above
the budgeted amount during the period from December 1, 2008 to March 31, 2009.
All auctions during 2008-09 (up to January 19, 2009) were for reissuance of existing
securities, barring three new issues. There was a devolvement of Rs.4,764 crore
on primary dealers (PDs) during 2008-09 (up to January 19, 2009) as compared with
devolvement of Rs.957 crore during the corresponding period of the previous year.
| Table
48: Central Government Dated Securities Issued during 2008-09 |
| (Amount
in Rupees crore/Maturity in years/Yield in Per cent) | |
Borrowings as per Auction Calendar |
Actual Borrowings |
| Sr.
No. | Period
of auction | Amount |
Residual Maturity |
Date of Auction |
Amount |
Residual Maturity |
Yield | |
1 |
2 |
3 |
4 |
5 |
6 |
7 |
8 | |
1. |
April 4 - 11, 2008 |
6,000 |
5-9 year |
April 11, 2008 |
6,000 |
7.38 |
8.14 | | | |
4,000 |
20-year and above | |
4,000 |
24.37 |
8.67 | |
2. |
April 18 - 25, 2008 |
6,000 |
10-14 year |
April 21, 2008 |
6,000 |
10.00 |
8.24 | | | |
4,000 |
20-year and above | |
4,000 |
28.13 |
8.77 | |
3. |
May 2-9, 2008 |
6,000 |
5-9 year |
May 9, 2008 |
6,000 |
7.92 |
7.96 | | | |
4,000 |
20-year and above | |
4,000 |
24.29 |
8.35 | |
4. |
May 16-23, 2008 |
6,000 |
10-14 year |
May 23, 2008 |
6,000 |
9.91 |
8.07 | | | |
4,000 |
20-year and above | |
4,000 |
23.72 |
8.52 | |
5. |
May 30-June 6, 2008 |
6,000 |
10-14 year |
June 6, 2008 |
6,000 |
9.87 |
8.26 | | | |
4,000 |
20 year and above | |
4,000 |
24.22 |
8.72 | |
6. |
June 13-20, 2008 |
6,000 |
15-19 year security |
June 20, 2008 |
6,000 |
18.64 |
9.25 | |
7. |
July 4-11, 2008 |
6,000 |
10-14 year |
July 4, 2008 |
6,000 |
9.79 |
9.13 | | | |
4,000 |
20 year and above | |
4,000 |
23.60 |
10.02 | |
8. |
July 18-25, 2008 |
6,000 |
15-19 year |
July 24, 2008 |
6,000 |
9.74 |
9.08 | |
9. |
August 1-8, 2008 |
6,000 |
10-14 year |
August 8, 2008 |
6,000 |
9.70 |
9.14 | | | |
4,000 |
20 year and above | |
4,000 |
24.05 |
9.88 | |
10. |
August 14-22, 2008 |
6,000 |
15-19 year |
August 22, 2008 |
6,000 |
18.47 |
9.86 | |
11. |
September 5-12, 2008 |
5,000 |
10-14 year |
September 12, 2008 |
5,000 |
9.60 |
8.30 | | | |
3,000 |
20-year and above | |
3,000 |
23.95 |
8.70 | | | | | |
September 26, 2008 |
6,000 |
12.65 |
9.04 | | | | | | |
4,000 |
23.38 |
9.26 | |
12. |
October 3-10, 2008 |
6,000 |
5-9 year |
Auction Cancelled |
– |
– |
– | | | |
4,000 |
20-year and above |
Auction Cancelled |
– |
– |
– | |
13. |
October 17-24, 2008 |
6,000 |
10-14 year |
Auction Cancelled |
– |
– |
– | | | |
4,000 |
20-year and above |
Auction Cancelled |
– |
– |
– | |
14. |
October 31-November 7, 2008 |
6,000 |
5-9 year |
October 31 , 2008 |
6,000 |
6.00 |
7.56 | | | |
4,000 |
20-year and above | |
4,000 |
23.82 |
8.08 | | | | | |
November 7, 2008 |
6,000 |
9.45 |
7.73 | | | | | | |
4,000 |
23.26 |
8.44 | |
15. |
November 14-21, 2008 |
6,000 |
5-9 year |
November 14, 2008 |
6,000 |
5.96 |
7.38 | | | | | | |
4,000 |
23.78 |
8.21 | | | | | |
November 21, 2008 |
6,000 |
5.94 |
7.16 | | | | | | |
3,000 |
12.50 |
7.42 | |
16. |
December 5-12, 2008 |
3,000@ |
10-14 year |
Preponed to | | | |
| | | | |
November 21, 2008 |
– |
– |
– | | | |
6,000* |
5-9 year |
December 12, 2008 |
6,000 |
4.72 |
6.24 | | | |
4,000* |
20-year and above | |
4,000 |
25.65 |
6.98 | |
17. |
January 2-9, 2009* |
6,000 |
5-9 year |
January 2, 2009 |
6,000 |
8.65 |
5.73 | | | |
4,000 |
20-year and above | |
4,000 |
26.68 |
6.53 | |
18. |
January 5-9, 2009# |
7,000 |
5-9 year |
January 9, 2009 |
7,000 |
7.25 |
6.70 | | | |
4,000 |
15-19 year | |
4,000 |
14.24 |
7.35 | | |
4,000 |
20-year and above | |
4,000 |
25.58 |
7.60 | |
19. |
January 12-16, 2009# |
6,000 |
5-9 year and above |
January 16, 2009 |
4,000 |
5.79 |
5.50 | | | |
4,000 |
20 year and above | |
3,000 |
30.00 |
6.83 | | | | | | |
4,000 |
9.26 |
5.45 | |
@ : As per indicative calendar issued on September
26, 2008.
* : As per indicative calendar issued on December 5, 2008.
#
: As per indicative calendar issued on January 6, 2009. |
The
bid-cover ratio ranged between 1.22 and 3.94. The weighted average maturity of
dated securities issued during 2008-09 (up to January 19, 2009) at 14.59 years
was marginally higher than 14.57 years during the corresponding period of the
previous year. The weighted average yield of dated securities issued during 2008-09
(up to January 19, 2009) at 8.03 per cent was lower than 8.15 per cent during
the corresponding period of last year. V.50 The notified
amounts for 91-day, 182-day and 364-day Treasury Bills were kept unchanged in
the issuance calendar for 2008-09. However, the notified amounts (excluding MSS)
in respect of all three Treasury Bills were raised during the course of the year
to finance the temporary cash mismatch, inter alia, arising from the expenditure
on farmers’ debt waiver scheme. Thus, an additional amount
of Rs.1,19,500 crore (Rs.69,000 crore, net) was raised over and above the notified
amount in the calendar as on January 19, 2009. State
Government Securities V.51 The provisional net allocation
under market borrowing programme of the State Governments and the Union Territory
of Puducherry for 2008-09 is placed at Rs.49,539 crore. Taking into account repayments
of Rs.14,371 crore and additional allocation of Rs.13,859 crore, the gross market
borrowings of the State Governments are estimated at Rs.77,770 crore. During the
current year, so far (up to January 19, 2009), 22 State Governments and the Union
Territory of Puducherry raised a total amount of Rs.52,843 crore through auctions
(Table 49) with cut-off yields in the
| Table
49: Market Borrowings of the State Governments/U.T. 2008-09 |
| Item |
Date |
Cut-off Yield
(Per cent) |
Tenor
Years) |
Amount Raised
(Rupees crore) |
| 1 |
2 |
3 |
4 |
5 | |
Auction | | | | |
| i. |
First |
April 4, 2008 |
8.50-8.60 |
10 |
2,648 | |
ii. |
Second |
May 27, 2008 |
8.39-8.68 |
10 |
3,264 | |
iii. |
Third |
June 27, 2008 |
9.38-9.59 |
10 |
2,300 | |
iv. |
Fourth |
July 10, 2008 |
9.81 |
10 |
500 | |
v. |
Fifth |
August 31,2008 |
9.86-9.90 |
10 |
2,100 | |
vi. |
Sixth |
August 26,2008 |
9.30-9.44 |
10 |
2,060 | |
vii. |
Seventh |
September 9, 2008 |
8.80 |
10 |
1,800 | |
viii. |
Eighth |
September 25, 2008 |
8.81-8.88 |
10 |
1,212 | |
ix. |
Ninth |
October 7,2008 |
8.50-8.89 |
10 |
2,012 | |
x. |
Tenth |
October 22, 2008 |
7.97-8.11 |
10 |
4,300 | |
xi |
Eleventh |
November 11, 2008 |
8.21-8.54 |
10 |
3,595 | |
xii. |
Twelfth |
November 20, 2008 |
7.77-7.86 |
10 |
4,850 | |
xiii. |
Thirteenth |
December 11, 2008 |
6.95-7.10 |
10 |
5,910 | |
xiv. |
Fourteenth |
December 23, 2008 |
6.38-6.45 |
10 |
4,795 | |
xv. |
Fifteenth |
January 6, 2009 |
5.80-6.10 |
10 |
5,702 | |
xvi. |
Sixteenth |
January 13, 2009 |
6.65-6.73 |
10 |
5,795 | |
Grand Total | | | |
52,843 |
range
5.80-9.90 per cent as compared with Rs.39,671 crore by 22 State Governments (cut-off
yields in the range 8.00-8.90 per cent) during the corresponding period of the
previous year. The weighted average interest rate on market loans eased to 7.74
per cent during 2008-09 (up to January 19, 2009) from 8.35 per cent during the
corresponding period of 2007-08. The spreads of State Government securities over
the yields of Central Government securities of corresponding maturity ranged between
21 and 110 basis points as compared with 19 and 90 basis points during the corresponding
period of 2007-08. Secondary Market V.52
Yields in the government securities market hardened at the beginning of the current
financial year with the 10-year yield reaching 8.23 per cent on April 21, 2008
from 7.93 per cent on end-March 2008 in response to higher reading in domestic
inflation (Chart 28). Subsequently, heightened inflationary expectations emanating
from the sharp increase in global commodity prices and concomitant policy responses
in the form of hike in CRR and repo rate, led to further hardening of yields.
The 10-year yield consequently rose to 9.51 per cent on July 15, 2008.
V.53
Yields in the government securities market generally eased from end-July till
around mid-September 2008 following the reduction in inflationary pressures tracking
softening crude oil prices. The yields, however, hardened in the second fortnight
of September 2008 as the liquidity conditions tightened mainly reflecting advance
tax outflows in conjunction with the impact of adverse developments in international
financial markets. The 10-year yield increased from 8.08 per cent to 8.63 per
cent over the second half of end-September 2008. Subsequently, the yields eased
substantially in tandem with the liquidity enhancing measures, including cuts
in CRR, reduction in policy rates and the sharp decline in WPI. The 10-year G-sec
yield stood at 5.87 per cent as at January 23, 2009. 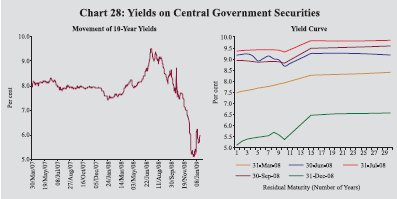
V.54
During the year, the Government securities yield curve moved upwards and peaked
by end-July 2008. Thereafter, the yield curve has moved downwards. The yield curve
remains flat beyond 15 years. A notable feature was the inversion of the yield
curve with the 10-year yield falling below that of the sub-10 year segment. This
is attributable to the concentration of trading around the 10 year tenor as well
as the impact of monetary policy actions at the short end. Resultantly, the spread
between 1-year and 10-year yields was 25 basis points as against the spread of
35 basis points between the 1-year and 5-year yields, and 145 basis points between
1-year and 30-year yields, as at end-December 2008. V.55
The daily turnover in the Central Government securities market averaged Rs.7,213
crore during October-December 2008, which was around 7.0 per cent lower than that
in the preceding quarter (Chart 29). V.56
The yield on 5-year AAA-rated corporate bonds, which witnessed a hardening trend
during the second quarter, came to soften during the third quarter of 2008-09.
The credit spread between the yields on 5-year AAA-rated bonds and 5-year government
securities has narrowed on the back of easing liquidity conditions (Chart
30). Equity Market Primary
Market V.57 The primary market segment of the domestic
capital market witnessed a weak trend during the third quarter of 2008-09 so far.
Cumulatively, resources raised through public issues declined sharply to Rs.14,007
crore during April-December 2008 from Rs.49,215 crore during the corresponding
period of 2007. The number of issues also declined considerably from 91 to 40
(Table 50). Out of 40 issues during April-December 2008, 20
were initial public offerings (IPOs) issued by private sector companies, constituting
14.3 per cent of total resource mobilisation. Furthermore, all the issues 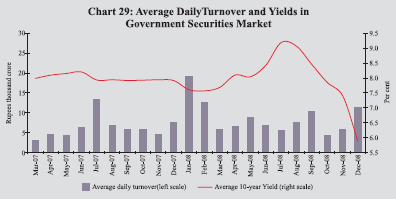
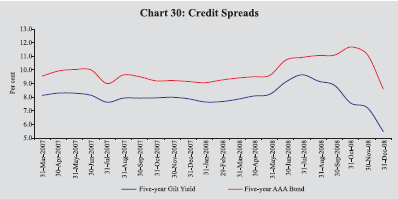
during
April-December 2008 were equity issues by private non-financial companies except
one by private-financial company. The average size of public issues declined considerably
from Rs.540.8 crore during April-December 2007 to Rs.350.2 crore during April-December
2008. V.58 Mobilisation of resources through private placement
declined by 15.7 per cent to Rs. 79,594 crore during April-September 2008 (period
for which latest data are available) as against an increase of 25.6 per cent during
April-September 2007. Public sector entities accounted for 51.5 per cent of total
mobilisation as compared with 38.5 per cent of total mobilisation during the corresponding
period of last year. Resource mobilisation through financial intermediaries (both
from public and private sector) registered a decline of 34.8 per cent over the
corresponding period of last year, accounting for 50.9 per cent of the total mobilisation
during April-September 2008. Resources raised by non-financial intermediaries
also registered a decline of 21.1 per cent (49.1 per cent of total resource mobilisation)
during April-September 2008 over the corresponding period of last year. V.59
During April-December 2008, the resources raised through Euro issues –American
Depository Receipts (ADRs) and Global Depository Receipts (GDRs) – by Indian corporates
declined considerably by 81.2 per cent to Rs.4,686 crore as compared with the
corresponding period of the previous year. All the Euro issues were GDR issues
during April-December 2008. V.60 During April-December 2008,
net resource mobilisation by mutual funds indicated an outflow of Rs.30,432 crore
compared to an inflow of Rs.1,23,993 crore during April-December 2007 (Table
51). Scheme-wise, during April-December 2008, while income/debt-oriented schemes
witnessed a net outflow of Rs.34,601 crore, growth/equity-oriented schemes registered
a net inflow of
| Table
50: Mobilisation of Resources from the Primary Market |
| (Amount
in Rupees crore) | |
Item |
No. of Issues |
Amount |
No. of Issues |
Amount | |
1 |
2 |
3 |
4 |
5 | | |
April-December 2007 |
April-December 2008 |
| A. |
Prospectus and Rights Issues* | | | | |
| | 1. |
Private Sector (a+b) |
88 |
45,882 |
40 |
14.007 | | | |
a) |
Financial |
9 |
13,986 |
1 |
448 | | | |
b) |
Non-financial |
79 |
31,896 |
39 |
13,559 | | |
2. |
Public Sector (a+b+c) |
3 |
3,332 |
– |
– | | | |
a) |
Public Sector Undertakings |
2 |
2,516 |
– |
– | | | |
b) |
Government Companies |
– |
– |
– |
– | | | |
c) |
Banks/Financial Institutions |
1 |
816 |
– |
– | |
3.Total (1+2) |
91 |
49,215 |
40 |
14,007 | | | |
of which: | | | | |
| | |
(i) |
Equity |
90 |
48,715 |
40 |
14,007 | | | |
(ii) |
Debt |
1 |
500 |
– |
– | | | | | |
April-September 2007 |
April-September 2008 |
| B. |
Private Placement | | | | |
| | 1. |
Private Sector (a+b) |
819 |
58,089 |
476 |
38,613 | | | |
a) |
Financial |
426 |
35,061 |
217 |
20,521 | | | |
b) |
Non-financial |
393 |
23,028 |
259 |
18,092 | | |
2. |
Public Sector (a+b) |
59 |
36,322 |
84 |
40,981 | | | |
a) |
Financial |
45 |
27,044 |
42 |
19,960 | | | |
b) |
Non-financial |
14 |
9,278 |
42 |
21,021 | | |
3. |
Total (1+2) |
878 |
94,411 |
560 |
79,594 | | | |
of which: | | | | |
| | |
(i) |
Equity |
– |
– |
– |
– | | | |
(ii) |
Debt |
878 |
94,411 |
560 |
79,594 | |
Memo: | | | | | |
| C. |
Euro Issues (April-December) |
17 |
24,972 |
12 |
4,686 | |
P : Provisional. * : Excluding offers
for sale. – : Nil/Negligible. |
Rs.3,087
crore. The outflow may primarily be attributed to the uncertain conditions in
the stock markets, redemption pressures from banks and corporates due to tight
liquidity conditions since June 2008 and payment of third instalment of advance
corporate tax by mid-December 2008. Secondary Market V.61
The domestic stock markets remained weak and volatile during the third quarter
of 2008-09. The markets recorded substantial losses due to downward trend in international
equity markets on reports of the US, Europe and Japan slipping into recession,
decline in
| Table
51: Resource Mobilisation by Mutual Funds | |
(Rupees crore) | | |
April-March |
April-December |
| Category |
2007-08 |
2007-08 |
2008-09 | | |
Net |
Net |
Net |
Net |
Net |
Net | | |
Mobilisation @ |
Assets # |
Mobilisation@ |
Assets |
Mobilisation @ |
Assets # | |
1 |
2 |
3 |
4 |
5 |
6 |
7 | |
Private Sector |
1,33,304 |
4,15,621 |
1,05,868 |
4,47,174 |
-39,942 |
3,30,730 | |
Public Sector * |
20,497 |
89,531 |
18,125 |
1,02,762 |
9,510 |
82,634 | |
Total |
1,53,801 |
5,05,152 |
1,23,993 |
5,49,936 |
-30,432 |
4,13,365 | |
@ :
Net of redemptions. # : End-period.
* : Including UTI Mutual fund.
Note
: Data exclude funds mobilised under Fund of Funds Schemes.
Source
: Securities and Exchange Board of India. |
commodity
prices, traces of slowdown in Indian economy with reports of decline in exports
for October 2008, lower industrial growth for April-September 2008 and lower indirect
tax collections for October 2008, deceleration in the second quarter corporate
earnings, fall in the value of rupee against the US dollar and substantial net
sales by FIIs in the Indian equity market. Both the BSE Sensex and the S&P
CNX Nifty closed lower at 9101 and 2797 on January 20, 2009, both registering
loss of 40.1 per cent over end-March 2008 (Chart 31). V.62
According to the data released by the Securities and Exchange Board of India (SEBI),
FIIs have made net sales of Rs.43,782 crore (US $ 10.9 billion) in the Indian
equity market during 2008-09 so far (up to January 16, 2009) as against net purchases
of Rs.64,776 crore (US $15.8 billion) during the corresponding period of the previous
year (Chart 32). Mutual funds, on the other hand, have made
net purchases 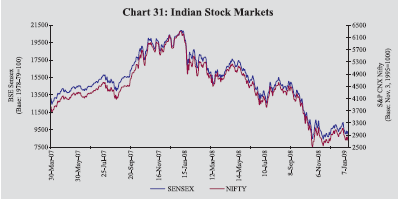
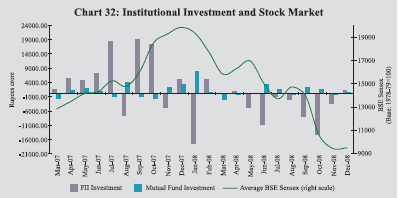
of
Rs.6,043 crore during 2008-09 so far (up to January 16, 2009) as compared with
net purchases of Rs.9,598 crore during the corresponding period of last year.
V.63 The sectoral indices witnessed selling pressure across
the board during the current financial year so far (up to January 20, 2009). The
major losers among the sectoral indices were metal, capital goods, consumer durables,
auto, oil and gas, IT, banking, PSU, healthcare and FMCG (Table
52).
| Table
52: BSE Sectoral Stock Indices | |
(Base: 1978-79=100) |
| Sector |
Variation (per cent) |
| | End-March
2007@ | End-March
2008@ | January
20,
2009 # | | 1 |
2 |
3 |
4 | |
Fast Moving Consumer Goods |
-21.4 |
31.7 |
-14.28 | |
Public Sector Undertakings |
-3.2 |
25.4 |
-30.75 | |
Information Technology |
21.6 |
-27.6 |
-39.51 | |
Auto | -8.5 |
-7.1 |
-45.27 | |
Oil and Gas |
30.5 |
56.0 |
-41.46 | |
Metal |
-4.3 |
65.2 |
-65.08 | |
Health Care |
-5.4 |
5.4 |
-26.93 | |
Bankex |
24.2 |
18.0 |
37.37 | |
Capital Goods |
11.1 |
54.4 |
-53.81 | |
Consumer Durables |
11.1 |
8.8 |
-53.69 | |
BSE 500 |
9.7 |
24.3 |
-45.15 | |
BSE Sensex |
15.9 |
19.7 |
-41.83 | |
@: year-on-year variation.
# : Variation over
end-March 2008.
Source : Bombay Stock Exchange Limited. |
V.64
In line with the downward trend in stock prices, the price-earning (P/E) ratio
of the 30 scrips included in the BSE Sensex declined from 20.1 at end-March 2008
to 12.4 at end-December 2008. The market capitalisation of the BSE also declined
by 38.8 per cent between end-March 2008 and end-December 2008. The turnover of
BSE and NSE in the cash segment during April-December 2008 also declined by 24.4
per cent over that in the corresponding period of 2007. The turnover in the derivative
segment of BSE and NSE also declined by 4.7 per cent during April-December 2008
over the corresponding period of the previous year. The volatility in the stock
market measured as coefficient of variation, also increased during April-December
2008 (Table 53).
| Table
53: Stock Market Indicators | |
Indicator |
BSE |
NSE | | | |
2007-08 |
April-December |
2007-08 |
April-December |
| | | |
2007 |
2008 | | |
2007 |
2008 | |
1 |
2 |
3 |
4 |
5 |
6 |
7 |
8 |
9 | |
1. |
BSE Sensex / S&P CNX Nifty | | | | | | | | |
| | (i)
End-period | |
15644 |
20287 |
9647 | |
4735 |
6139 |
2959 | | |
(ii) Average | |
16569 |
19827 |
9514 | |
4897 |
5964 |
2896 | |
2. |
Coefficient of Variation | |
13.7 |
3.9 |
4.3 | |
14.4 |
4.1 |
4.5 | |
3. |
Price-Earning Ratio | | | | | | | | |
| | (end-period)* | |
20.1 |
27.7 |
12.4 | |
20.6 |
27.6 |
12.8 | |
4. |
Price-Book Value Ratio | | | | | | | | |
| | (end-period)* | |
5.2 |
6.7 |
2.58 | |
5.1 |
6.4 |
2.4 | |
5. |
Yield* (per cent per annum) | | | | | | | | |
| | (end-period) | |
1.0 |
0.83 |
1.84 | |
1.1 |
0.84 |
1.9 | |
6. |
Listed Companies | |
4,887 |
4,887 |
4,821 | |
1,381 |
1,353 |
1,428 | |
7. |
Cash Segment Turnover | | | | | | | | |
| | (Rupees
crore) | |
15,78,856 |
11,60,249 |
9,05,445 | |
35,51,038 |
25,70,712 |
22,08,183 | |
8. |
Derivative Segment | | | | | | | | |
| | Turnover
(Rupees crore) | |
2,42,308 |
1,78,883 |
12,245 | |
1,30,90,478 |
99,16,166 |
84,80,063 | |
9. |
Market Capitalisation | | | | | | | | |
| | (Rupees
crore) @ | |
51,38,015 |
71,69,985 |
31,44,768 | |
48,58,122 |
65,43,272 |
29,16,768 | |
10. |
Market Capitalisation to GDP | |
109.5 |
152.1 |
59.0 | |
103.1 |
138.8 |
55.5 | | |
Ratio (per cent) | | | | | | | | |
| *
: Based on 30 scrips included in the BSE Sensex and 50 scrips included in the
S&P CNX Nifty.
@ : As at end-period.
Source : Bombay Stock
Exchange Ltd. (BSE) and National Stock Exchange of India Ltd. (NSE). |
| |
Annex: Recent
Policy Measures of the Reserve Bank | |
Country |
Key Measures |
| 1 | |
2 | |
Monetary |
• |
Cut in repo rate under the liquidity
adjustment facility (LAF) by a cumulative | |
Measures | |
350 basis points from 9.0 to 5.5
per cent since mid-October 2008. | | |
• |
Cut in reverse repo rate by a cumulative
200 basis points from 6.0 to 4.0 per cent since December 8, 2008. |
| Rupee
Liquidity Credit Delivery / |
• |
Cut in cash reserve ratio (CRR) by
a cumulative 4 percentage points of net demand and time liabilities (NDTL) from
9.0 per cent of NDTL up to October10, 2008 to 5.0 per cent by January 17, 2009. |
| |
• |
Introduction of a special refinance
facility under Section 17(3B) of the Reserve Bank of India Act, 1934 under which
all SCBs (excluding RRBs) are provided refinance from the Reserve Bank equivalent
up to 1.0 per cent of each bank’s NDTL as on October 24, 2008 at the LAF repo
rate up to a maximum period of 90 days. Banks are encouraged to use this facility
for the purpose of extending finance to micro and small enterprises. This facility
will continue up to June 2009. | | |
• |
Institution of a term repo
facility for an amount of Rs.60,000 crore under the LAF to enable banks to ease
liquidity stress faced by mutual funds (MFs), non-banking financial companies
(NBFCs) and housing finance companies (HFCs) with associated SLR exemption of
1.5 per cent of NDTL. This facility has been extended up to June 30, 2009. |
| |
• |
Reduction in statutory liquidity
ratio (SLR) by one percentage points from 25 to 24 per cent of NDTL. |
| |
• |
Introduction of a mechanism to buy
back dated securities issued under the market stabilisation scheme (MSS) so as
to provide another avenue for injecting liquidity of a more durable nature into
the system. | | |
• |
Extension of the period of entitlement
of the first slab of pre-shipment rupee export credit, currently available at
a concessional interest rate ceiling of the benchmark prime lending rate (BPLR)
minus 2.5 percentage points from 180 days to 270 days. | | |
• |
Increase in the eligible limit of
the ECR facility for scheduled banks(excluding RRBs) from 15 to 50 per cent of
the outstanding export credit eligible for refinance at the prevailing repo rate
under the LAF. | | |
• |
To allocate amounts, in advance,
from scheduled commercial banks for contribution to the SIDBI and the NHB to the
extent of Rs.2,000 crore and Rs.1,000 crore, respectively, against banks’ estimated
shortfall in priority sector lending in March 2009. | | | |
(Contd...) |
| Annex:
Recent Policy Measures of the Reserve Bank (Contd.) |
| Country | |
Key Measures |
| 1 | |
2 | | |
• |
Reduction in the provisioning requirements
for all types of standard assets (for residential housing loan beyond Rs.20 lakh,
standard advances in the commercial real estate sector, personal loans including
outstanding credit card receivables, loans and advances qualifying as capital
market exposure and non-deposit taking systemically important NBFCs) to a uniform
level of 0.40 per cent except in case of direct advances to agricultural and SME
sector, which shall continue to attract provisioning of 0.25 per cent, as hitherto. |
| |
• |
Downward revision of risk weights
on banks’ exposures to certain sectors, which had been increased counter cyclically
earlier. All unrated claims on corporates and claims secured by commercial real
estate shall attract a uniform risk weight of 100 per cent as against the risk
weight of 150 per cent prescribed earlier. Claims on rated as well as unrated
non-deposit taking systemically important non-banking financial companies (NBFC-ND-SI)
shall be uniformly risk weighted at 100 per cent. As regards the claims on asset
financing companies (AFCs), there is no change in the risk weights, which would
continue to be governed by the credit rating of the AFCs, except the claims that
attract a risk weight of 150 per cent under the new capital adequacy framework,
stands reduced to a level of 100 per cent. | | |
• |
In order to provide liquidity support
to housing, export and micro and small (MSE) sectors, the Reserve Bank provided
a refinance facility of Rs.4,000 crore to National Housing Bank (NHB), Rs. 5,000
crore to the EXIM Bank and Rs. 7,000 core to the Small Industries Development
Bank of India (SIDBI) upto March 2010. | |
Forex Liquidity/ ECB Norms |
• |
RBI to continue selling foreign exchange
(US dollars) through agent banks to augment supply in the domestic foreign exchange
market or intervene directly to meet any demand-supply gaps. |
| |
• |
RBI to institute special market operations
to meet the foreign exchange requirements of public sector oil marketing companies
against oil bonds. | | |
• |
Enhancing the all-in-cost ceiling
for trade credit less than 3 years to 6 months LIBOR plus 200 basis points. |
| |
• |
Temporarily permitting systemically
Important Non-Deposit taking NBFCs and housing finance companies to raise short-term
foreign currency borrowings under the approval route, subject to their complying
with the prudential requirements of capital adequacy and exposure norms. |
| | |
(Contd...) |
| |
Annex: Recent Policy Measures of
the Reserve Bank (Concld.) | |
Country | |
Key Measures |
| 1 | |
2 | | |
• |
Increase in interest rate ceiling
on FCNR (B) deposits by a 175 basis points, i.e., to Libor/Swap rates plus
100 basis points and on NR(E)RA deposits by a 175 basis points, i.e., to
Libor/Swap rates plus 175 basis points for US dollar of corresponding maturities. |
| |
• |
Proposal from Indian companies to
prematurely buy back their FCCBs to be considered under approval or automatic
route, depending on the extent of discount of the FCCBs and souce of funds, subject
to compliance with certain stipulated conditions. Under the approval route, the
buy back should be financed by the company’s internal accruals and the buy back
under automatic route should be financed by the company’s foreign currency resources
held in India or abroad and/or out of fresh external commercial borrowing (ECB)
raised in conformity with the current norms for ECBs. | | |
• |
ECBs up to US $ 500 million per borrower
per financial year were permitted for rupee expenditure and/or foreign currency
expenditure for permissible end- uses under the automatic route. The requirement
of minimum average maturity period of 7 years for ECB of more than US $ 100 million
for Rupee capital expenditure by the borrowers in infrastructure sector has been
deispensed with. | | |
• |
The requirement of all-in-cost ceiling
for ECBs over average maturity of 3-5 years and more than 5 years, which was increased
to 300 basis points and 500 basis points, respectively, over 6-month LIBOR, was
removed untill June 30, 2009. | | |
• |
The definition of Infrastructure
sector for availing ECB was expanded to include mining, exploration and refinery
sectors. | | |
• |
ECBs up to US $ 500 million per borrower
per financial year were permitted for rupee expenditure and/or foreign currency
expenditure for permissible end-uses under the automatic route. |
| |
• |
Entities in the services sector,
viz., hotels, hospitals and software companies were permitted to avail
ECBs up to US $ 100 million in a financial year under the automatic route for
foreign currency and/or Rupee capital expenditure for permissible end-use. (The
proceeds of the ECBs should not be used for acquisition of land). |
| |
• |
NBFCs exclusively involved in financing of the infrastructure
sector were permitted to avail of ECBs under the approval route from multilateral/regional
financial institutions and Government owned development financial institutions
for onlending to the borrowers in the infrastructure sector, subject to complying
with certain conditions. | |