|
Administered Interest Rates
7.37 As noted above, one of the factors imparting upward rigidity to the interest rate structure in India is the administered nature of interest rates on small savings instruments. In order to provide flexibility to the interest rates on small savings and other administered instruments, the Report of the Expert Committee to Review the System of Administered Interest Rates and Other Related Issues (Chairman: Dr. Y.V. Reddy) (RBI, 2001) recommended that the interest rates on these instruments could be benchmarked to the secondary
|
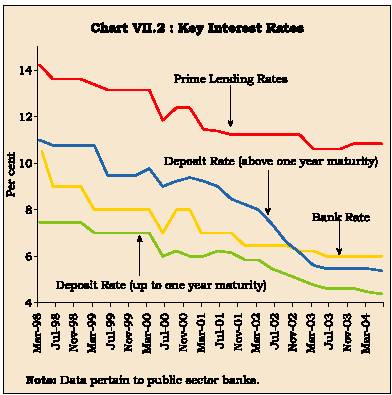
Table 7.6: Outstanding Loans of Scheduled Commercial Banks
by Interest Rate
|
| |
|
|
|
|
|
|
(Per cent to total loans)
|
|
Interest Rate Slab
|
Mar-90
|
Mar-95
|
Mar-97
|
Mar-98
|
Mar-99
|
Mar-00
|
Mar-01
|
Mar-02
|
Mar-03
|
|
1
|
2
|
3
|
4
|
5
|
6
|
7
|
8
|
9
|
10
|
|
<6%
|
2.7
|
2.3
|
1.1
|
1.0
|
0.3
|
0.2
|
0.2
|
0.1
|
0.1
|
|
6-10%
|
6.8
|
2.1
|
0.5
|
0.4
|
3.7
|
1.0
|
0.6
|
3.2
|
5.3
|
|
10-12%
|
4.8
|
2.3
|
1.4
|
2.3
|
3.3
|
7.9
|
17.0
|
24.5
|
22.9
|
|
12-14%
|
21.4
|
10.6
|
10.7
|
13.2
|
20.3
|
26.8
|
28.6
|
22.5
|
25.1
|
|
14-15%
|
4.4
|
6.7
|
10.9
|
14.9
|
9.7
|
11.5
|
12.6
|
14.1
|
19.4
|
|
15-16%
|
11.7
|
20.3
|
9.6
|
11.7
|
14.0
|
17.9
|
15.7
|
15.5
|
12.5
|
|
16-17%
|
32.2
|
17.3
|
8.3
|
13.7
|
20.2
|
17.1
|
14.1
|
12.5
|
8.6
|
|
17-18%
|
10.8
|
15.6
|
17.2
|
14.3
|
13.1
|
8.6
|
5.2
|
3.0
|
1.8
|
|
18-20%
|
4.5
|
14.5
|
26.8
|
20.2
|
10.5
|
6.2
|
4.0
|
3.2
|
3.0
|
|
>20%
|
0.6
|
8.3
|
13.5
|
8.3
|
4.9
|
2.8
|
2.0
|
1.4
|
1.2
|
|
Total
|
100.0
|
100.0
|
100.0
|
100.0
|
100.0
|
100.0
|
100.0
|
100.0
|
100.0
|
|
Source :
Basic Statistical Returns of Scheduled Commercial Banks in India (Various
Issues), Reserve Bank of India.
|
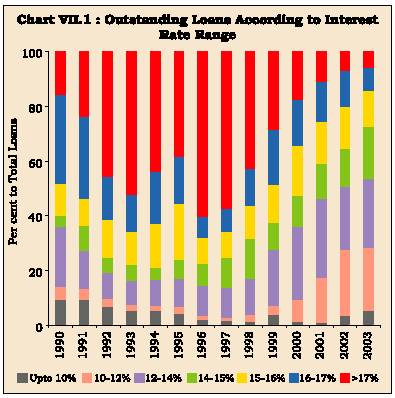
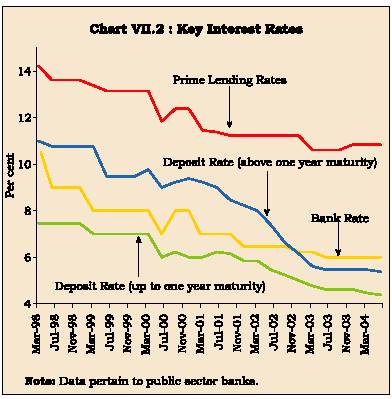
7.36 Between June 2002 and June 2004, the lending rates of the banks (the rates at which at least 60 per cent of lending takes place) have declined further (Table 7.7). The sharpest decline is witnessed in the case of private sector banks. Similarly, interest rates on deposits have seen a further softening since March 2001 (Chart VII.2). In particular, deposits above one-year maturity have exhibited a significant reduction which suggests an enhanced flexibility to the banks in pricing their loans in the future. Empirical evidence confirms that pass-through in India is less than unity although there are signs of an increase in pass-through over time (Box VII.4).
 Administered Interest Rates Administered Interest Rates
7.37 As noted above, one of the factors imparting upward rigidity to the interest rate structure in India is the administered nature of interest rates on small savings instruments. In order to provide flexibility to the interest rates on small savings and other administered instruments, the Report of the Expert Committee to Review the System of Administered Interest Rates and Other Related Issues (Chairman: Dr. Y.V. Reddy) (RBI, 2001) recommended that the interest rates on these instruments could be benchmarked to the secondary
|
Table 7.7: Lending Rates of Scheduled Commercial Banks in India |
|
(Per cent per annum) |
| |
|
|
|
|
|
|
| |
Public Sector Banks |
Foreign Banks |
Private Banks |
| |
Demand Loans |
Term Loans |
Demand Loans |
Term Loans |
Demand Loans |
Term Loans |
| |
|
|
|
|
|
|
| |
2 |
3 |
4 |
5 |
6 |
7 |
|
Jun-02 |
12.75-14.00 |
12.75-14.00 |
13.00-14.75 |
13.00-15.50 |
13.75-16.00 |
14.00-16.00 |
|
Sep-02 |
12.00-14.00 |
12.25-14.00 |
13.00-14.75 |
12.75-14.50 |
14.00-16.00 |
13.50-15.00 |
|
Dec-02 |
11.85-14.00 |
12.25-14.00 |
12.00-14.75 |
11.70-13.63 |
13.50-15.75 |
13.50-15.00 |
|
Mar-03 |
11.50-14.00 |
12.00-14.00 |
10.50-12.75 |
10.25-13.50 |
13.50-15.50 |
13.00-15.00 |
|
Jun-03 |
11.50-14.00 |
11.50-14.00 |
10.00-14.00 |
9.73-13.00 |
13.00-15.00 |
12.50-14.75 |
|
Sep-03 |
11.50-13.50 |
11.00-13.50 |
9.50-12.75 |
9.25-13.50 |
13.00-14.50 |
12.00-14.50 |
|
Dec-03 |
11.50-13.00 |
11.00-13.25 |
7.75-13.65 |
9.00-13.00 |
12.50-14.50 |
11.50-14.50 |
|
Mar-04 |
11.00-12.75 |
11.00-12.75 |
7.50-11.00 |
8.00-11.60 |
12.00-14.00 |
11.25-14.00 |
|
Jun-04 |
10.50-12.50 |
10.75-12.75 |
6.50-11.50 |
7.25-10.95 |
11.50-13.75 |
11.00-14.00 |
|
Note : Lending
rates in this table are the range at which at least 60 per cent business
is contracted.
Source : Reserve Bank of India.
|
market yields of various Government securities of corresponding maturities prevailing in the previous year. The Committee recommended a spread of up to 50 basis points over the yields on Government securities as a compensation for lower liquidity of small savings. Furthermore, provident funds could be offered only on a floating rate basis, while for all other small savings, an option of fixed versus floating rates may be provided
Box VII.4
Interest Rate Pass-through in India
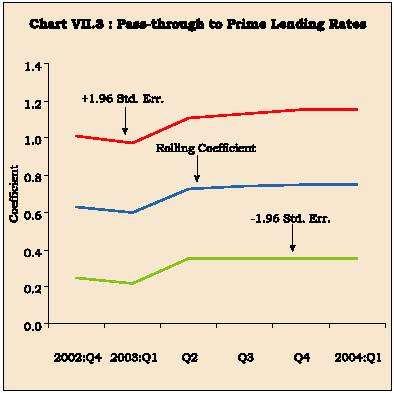
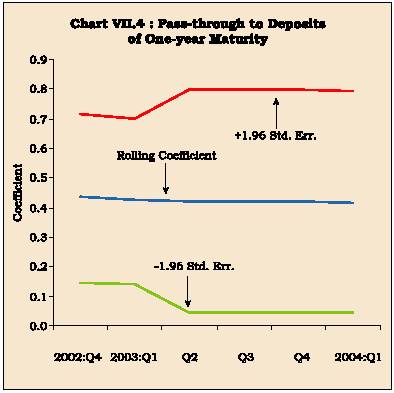
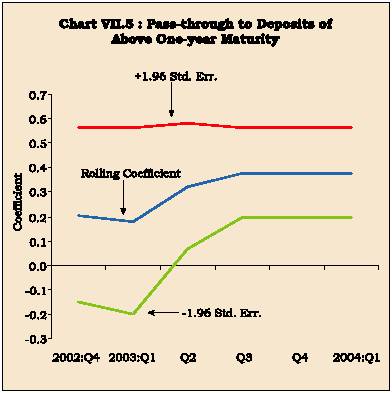
Following the discussion in Section I, the response of market rates of interest to policy rates can be quantified by estimating interest rate pass-through. As the interest rate channel in India was re-activated in 1997, the estimates of pass-through are made for the period since 1998 for both deposit and lending rates to the policy rate (the Bank Rate). For the empirical exercise, the deposit and lending rates of public sector banks (PSBs) are used and these are proxied by the interest rates on deposits of one-year maturity and prime lending rate (PLR), respectively. Estimates suggest that, over the sample period (September 1998-March 2004), the interest rate pass-through was 0.61 and 0.42 for lending and deposit rates, respectively, i.e., a reduction of 100 basis points (bps) in the Bank Rate led to a reduction of almost 40 bps in the banks’ deposit rates and 60 bps in their prime lending rate3 . Thus, the pass-through is less than complete, consistent with cross-country survey discussed earlier. Empirical estimates of pass-through undertaken here are subject to a number of limitations. In view of the relatively small sample size, the estimates must be treated as only indicative of the size of the pass-through. Moreover, the sample period has been one of a secular decline in policy rates. Accordingly, the size and the speed of the pass-through could differ in case of a policy tightening cycle since pass-through, as the review of cross-country studies shows, could be asymmetric. The less than complete pass-through notwithstanding, another key issue is: whether the pass-through has changed over time. To assess possible changes in the pass-through over time, rolling regressions (with a moving sample of 16 quarters) are estimated. Rolling coefficients support the hypothesis of some improvement in pass-through to lending rates in the last 2-3 years (Charts VII.3, VII.4 and VII.5). As regards deposit rates, the evidence is mixed: while pass-through to deposits of one-year maturity appears to be unchanged, that to deposits above one-year maturity exhibits a sharp rise. In case of deposits of more than one-year maturity, estimates suggest that pass-through has almost doubled from 0.2 in the initial part of the sample period to 0.4 in the latter part of the sample period and, moreover, the estimates turn out to be statistically significant in the latter part of the sample. Taken together, the empirical evidence indicates that although pass-through is less than complete, there are signs of an increase in pass-through over time reflecting policy efforts to impart greater flexibility to the interest rate structure in the economy.
|
3 |
As all the interest rates turned out to be non-stationary (based on ADF test), the variables were used in first-difference form to estimate |
| |
the pass-through. The estimated equations are: |
| |
DPLR = - 0.04 + 0.61 DBRATE |
DW = 2.5; |
R2 = 0.43. |
|
|
| |
(0.9) (3.1)* |
|
|
|
|
| |
DDR1 = - 0.08 + 0.42 DBRATE |
DW = 1.6; |
R2 = 0.38. |
|
|
| |
(2.4)* (2.9)* |
|
|
|
|
| |
DPLR, DDR1 and DBRATE are (first-differences of) prime lending rates,
deposit rates (up to one-year maturity)
and the Bank Rate, respectively. Prime lending rate and deposit rate data
pertain to public sector banks.
The equation has been estimated over September1998 to March 2004, using
quarterly data. The figures in brackets are t-values.
*indicates significant at 1 per cent level.
|
| |
| |
at the time of entry. The Committee also recommended abolition of income tax provisions on small savings to ensure a level playing field in the financial market. Pursuant to the recommendations of the Committee, the Union Budget 2002-03 announced that the interest rate on small savings would be linked to the average annual yield on Government securities in the secondary market. Corresponding adjustments in these rates were also announced in the Union Budget 2003-04.
7.38 The issue was revisited by the Advisory Committee to Advise on the Administered Interest Rates and Rationalisation of Saving Instruments (Chairman:
Dr. Rakesh Mohan) (RBI, 2004). The Advisory Committee was constituted, inter alia, to suggest criteria for fixing the spreads on administered interest rates over the benchmark yields recommended by the Expert Committee chaired by Dr. Y. V. Reddy, taking a view on the need to avoid excessive volatility in returns; and, make recommendations on rationalisation of existing savings instruments offered by the Government. The Advisory Committee noted that the yields on these instruments have been higher than that would have prevailed based on the Reddy Committee’s recommendations and this could partly be attributed to the sharp decline in yields on Government securities in recent years. Against this backdrop, benchmarking to previous year yields would lead to an equivalent sharp fall in administered interest rates and this would render financial planning difficult for small savers. Accordingly, in order to avoid excessive volatility in returns, the Advisory Committee recommended that interest rates on small saving instruments could be based on a weighted average of the previous two years rather than previous year alone. In view of tax benefits, effective yields on certain schemes are as high as 14.6-16.0 per cent and this renders the system regressive between taxpayers and non-taxpayers on the one hand and amongst the taxpayers in different brackets. The Committee, therefore, recommended discontinuation of a few such schemes (Box VII.5). The recommendations of the Committee in respect of introduction of a Senior Citizens Savings Scheme and discontinuation of the Deposit Scheme for Retiring Employees and 6.5 per Saving Bonds, 2003 (non-taxable) has been implemented with some modifications.
Box VII.5
Advisory Committee to Advise on the Administered Interest Rates and Rationalisation of Saving Instruments
The recommendations of the Committee covered three broad heads, viz., (a) Benchmarking and Spread Rules, (b) Rationalisation of Existing Savings Schemes and (c) Structure of the Proposed Dada-Dadi Scheme as announced by the Finance Minister. Key recommendations of the Advisory Committee are set out below:
Benchmarking and Spread Rules
- In order to impart more stability, a weighted average of G-sec yields for the previous two years - a weight of 0.67 for the more recent year and 0.33 for the previous year - may be taken to work out the benchmark for administered interest rates.
- The fixed liquidity spread of 50 basis points over the benchmark and the interest rate revision at annual rest may continue in line with the suggestions made by the Reddy Committee.
- The inter-year movement of interest rate fluctuations may be limited to 100 basis points in either direction. The benchmark should be kept under review by appointing another Committee in case its movement exceeds by more than 200 basis points.
Rationalisation of Existing Savings Schemes
The Committee considered the removal of those schemes where investments are primarily motivated to obtain tax benefits available under Sections 88 and 10 of the Income Tax Act. The Committee, therefore, recommended the following rationalisation measures:
- Discontinuance of Kisan Vikas Patra, National Savings Certificates (VIII Issue) and the 6.5 per cent (tax free) GoI Savings Bond 2003.
- As the Public Provident Fund is a longer-term savings scheme providing old age income security, it may be continued in its present form for some time.
- The Deposit Scheme for Retiring Employees (DSRE) - applicable to only retired Government and public sector employees - may be discontinued in view of the proposed Dada-Dadi Scheme.
Structure of the Proposed Dada-Dadi Savings Scheme
- The interest rate on the Dada-Dadi Scheme could be kept at 100 bps higher than the average benchmark for other small savings instruments.
- The tenor of the Scheme may be kept shorter at three years to ensure liquidity; the benchmark rate may be based on Government security with a five-year tenor to make it more attractive.
- The Scheme should be taxable in terms of section 80L of Income Tax Act.
- As the Scheme is meant to provide regular income to senior citizens, the payment of interest income should be on a monthly basis.
- An individual ceiling of Rs. 20 lakh to be placed on investment.
Real Interest Rates
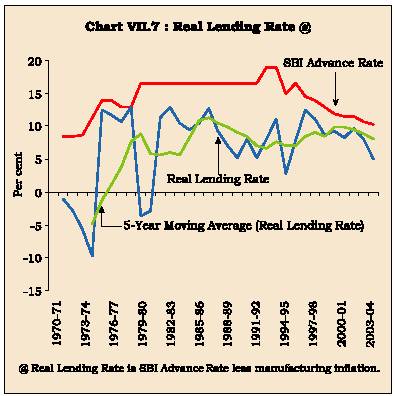
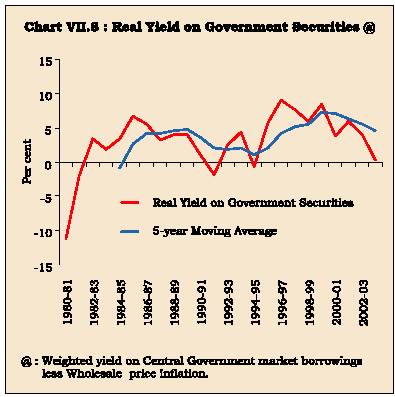
7.39 It is the real rate of interest that matters for investment and consumption decisions of firms and households in an economy. Although there has been some moderation of nominal interest rates since mid-1990s, inflation rates in India underwent an even more conspicuous decline. Illustratively, wholesale price inflation has averaged around five per cent per annum in the period since 1997 as compared with an average of 8-9 per cent per annum in the prior two decades (see Chapter V). Moreover, the moderation in respect of manufactured goods inflation was even more pronounced than that in the overall inflation rate. Accordingly, real interest rates for borrowers exhibited a distinctive hardening in the second half of the 1990s with adverse implications for investment demand in the economy (Table 7.8). The key issue, in terms of the growth objective, is the impact of the structure of real interest rates, especially as the interest cost as a proportion of sales of corporates is much higher in India as compared with many emerging market economies (Mohan, 2002).
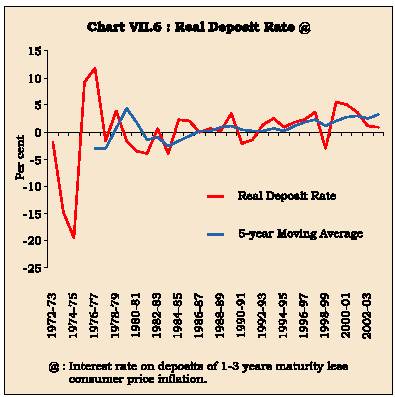
7.40 Apart from a degree of stickiness in banks’ lending rates, the increase in real rates could also be attributed to relatively high long-term inflation expectations, at least in the second half of the 1990s. 'What is more relevant from the policy point of view is the expected or ex ante real interest rate which is measured by the difference between the nominal market interest rate and the expected inflation. An ex post high real interest rate may reveal the difference between the expected and actual inflation rate, rather than the factors which determine the real rate. …To the extent that the mind-set regarding the historical inflation rate in the Indian economy can be addressed, by credible policy measures, the nominal interest rate should decline, in tune with the decline in current inflation rate, thus bringing down the pressure on real interest rate' (Reddy, 1998). With consistently low and stable inflation since 1997-98 onwards, inflation expectations appear to have stabilised and this has enabled a moderation in nominal and hence, ex post real rates for both Government and non-government borrowers during 2000-04 compared to the second half of the 1990s. Real deposit rates, on the other hand, remained positive and, on average, exhibited a marginal increase. In the recent couple of years, however, there has been some moderation in the real deposit rates, concomitant with a moderation in nominal deposit rates (Table 7.8 and Charts VII.6 - VII.8).
7.41 In this context, the appropriate level of real interest rates remains a topic of continuous debate. The Report of the Committee to Review the Working of the Monetary System (Chairman: S. Chakravarty) (RBI, 1985) felt that ‘reasonably high positive real rate of interest’ was needed on savings to deter ‘leakages’ of financial saving in the form of gold, real estate and physical assets. The Committee, therefore, recommended real rates of up to three per cent to depositors depending upon maturity, issuer and instrument: a marginally positive real return on 91-day Treasury Bills; a positive real return of 2 per cent per annum for bank deposits of maturity of 5 years or more; and, a positive real return of 3 per cent per annum on 15-year Government dated securities. Ex post real deposit rates in the period since the mid-1990s have been close to the benchmarks suggested by the Committee.
7.42 A more generalised approach on the level of real interest rates has been elaborated by Reddy (1998) with focus on long-term growth as a key determinant. 'In the context of the economy as a whole, or in macroeconomic policy, the sustainability
| |
Table 7.8: Real Interest Rates |
|
| |
|
(per cent per annum) |
| |
|
|
|
|
Period |
Real Deposit |
Real Lending |
Real Yield |
|
Averages/ |
Rate @ |
Rate $ on Government |
|
Year |
|
|
Securities # |
|
1 |
2 |
3 |
4 |
|
1975-80 |
4.3 |
8.8 (8.7) |
— |
|
1980-85 |
-1.7 |
8.3 (7.3) |
-0.9 |
|
1985-90 |
1.2 |
9.0 (8.4) |
4.7 |
|
1990-95 |
0.3 |
7.1 (6.8) |
1.0 |
|
1995-2000 |
2.1 |
9.9 (7.0) |
7.4 |
|
2000-04 |
2.7 |
7.7 (7.4) |
3.5 |
|
Memo: |
|
|
|
|
2000-01 |
5.0 |
8.2 (7.2) |
3.8 |
|
2001-02 |
3.7 |
9.7 (8.4) |
5.8 |
|
2002-03 |
1.0 |
8.0 (7.3) |
3.9 |
|
2003-04 |
0.9 |
5.0 (6.6) |
0.3 |
|
@ Interest rate on deposits of 1-3 year maturity less consumer price
inflation.
$ SBI Advance Rate less manufacturing inflation.
# Weighted yield on Central Government market borrowings less wholesale
price inflation.
Note : Figures in brackets are real lending rates when GDP deflator
is used as a measure of inflation.
|
of the real interest rate is critical. Ideally, the expected real interest rate
in the economy should reflect the potential rate of return on the capital stock.
If an economy is operating on the maximum attainable efficiency, the rate of
return on capital or the growth rate of real GDP should provide an indicator
of the real interest rate in the economy. In the case of advanced economies,
which are more or less operating on the best attainable efficiency level, the
real growth rate sets the limit for the real interest rate in the economy. It
is interesting, therefore, to observe that the typical real interest rates on
Government paper in some of the
advanced economies vary from 3 to 4 per cent, which is close to their growth
rate of GDP. In the case of developing economies, the typical real interest
rates are higher than those of the developed economies which is perhaps explained
by the higher rates of growth in these economies. It is possible that for a
fast growing and high performing economy, the real rate of interest may in fact
stay higher than the real growth rate, if the potential growth rate is higher
than the actual growth rate and if expectation regarding the future growth rate
is strong' (Reddy, 1998).
7.43 High real interest rates are a cause of concern since
these have an adverse impact on investment demand and output growth. Evidence
for the G-7 countries suggests that a 100 basis points increase in real interest
rate leads to a decline in output of 6-17 basis points in the short-run while
the long-run impact is a decline of 25-69 basis points (Goodhart and Hofmann,
2003). To analyse the impact of real interest rates on output for India, aggregate
demand curve specification on the same lines as Goodhart and Hofmann (op
cit.) is employed, i.e., output gap is regressed on its lags and
real interest rates. As supply shocks can have an adverse effect on output,
fuel prices and agricultural sector output are also included in the equation.
Estimates of this equation over the period 1970-2003 using annual data suggest
that a 100 basis point rise in real interest rates in India depresses real GDP
and hence widens the output gap (actual less trend output) by five basis points
in the short-run4 . The impact increases over time and the long-run
impact is almost 40 basis points.
Monetary Transmission
7.44 With the shifts in instruments and operating procedures of monetary policy
during the 1990s, issues relating to monetary transmission in India continue
to be an active area of research. As discussed in Chapter III, the fiscal dominance
during the 1970s and 1980s changed the contours of the operating framework of
monetary policy - the traditional instruments, the Bank Rate and open market
operations, began to loose their efficacy and gave way to credit planning and
reserve requirements as key instruments of monetary management. In order to
infuse a degree of efficiency, the 1990s witnessed a shift from a planned and
administrated interest rate system to a market-oriented financial system. Measures
were taken to rekindle the process of price discovery in the financial markets.
These measures included :
- deregulation of interest rates, beginning with the removal of restrictions
on the inter-bank market as early as 1989;
- putting the market borrowing programme of the Government through the auction
process in 1992-93;
- a phased deregulation of lending rates in the credit markets;
- the development of short-term money markets through introduction of money
market instruments, such as commercial paper, short-term Treasury Bills and
certificates of deposits;
- phasing out of ad hoc Treasury Bills; l replacing cash credit with
term loans; l reduction in statutory reserve requirements; l institution of
a liquidity adjustment facility (LAF); and,
- development of a repo market outside the Reserve Bank.
|
4 |
YGAP = - 0.05 RLINTWTP(-1) |
– |
0.07 DFUEL + |
0.36 GDPAGRI + 0.87 YGAP(-1) |
| |
(2.6)* |
|
(4.5)* |
(8.6)* (5.6)* |
| |
– |
|
|
|
| |
Durbin’s h = 0.7; R2 = 0.69. |
|
|
|
| |
YGAP, RLINTWTP, DFUEL and GDPAGRI are output gap, real weighted bank lending rate (nominal weighted average less WPI inflation |
| |
rate), fuel inflation and agricultural growth respectively. The equation has been estimated over 1972-73 to 2002-03 using annual data. The |
| |
figures in brackets are t-values. |
|
* denotes significant at 1 per cent level. |
7.45 The various measures enabled a shift from direct instruments
of monetary control to indirect instruments in consonance with the increasing
market orientation of the economy. The Reserve Bank is now able to influence
short-term interest rates by modulating the liquidity in the system through
LAF operations. Accordingly, monetary policy signals are increasingly transmitted
to the real economy through modulations in the Bank Rate as well as the repo
rate (now called the reverse repo rate) in contrast to the earlier reliance
on reserve requirements and credit ceilings/sectoral allocation of credit (see
Chapters III and VI). Against this brief overview, an assessment of the monetary
transmission mechanism in India is attempted here.
7.46 The relationship between money, output and prices has
been extensively analysed in India. With the initiation of reform measures in
the 1990s, more recent studies have also focussed on the role of the interest
rates and exchange rates in the transmission mechanism. Changes in money supply
lead to changes both in output and prices, although the price effects of an
increase in money supply are stronger than the output effects (Rangarajan and
Arif, 1990; Jadhav, 1994). The Working Group on Money Supply (RBI, 1998) found
a strong unidirectional causation running from real output to real money. Besides,
the output response operating through the interest rate channel turned out to
be stronger and more persistent than that of the credit channel.
7.47 In the context of the reforms and their implications for
monetary transmission channels, Ray, Joshi and Saggar (1998) found that interest
rates and exchange rate matter in the conduct of monetary policy in the post-liberalisation
phase (April 1992-March 1997). They found that interest rates and exchange rate
which were exogenous in the pre-reforms period turned out to be endogenous in
the post-liberalisation phase: disequilibria in money market endogenously impacted
the interest rates and the exchange rate. This evidence was interpreted as supportive
of policy shifts in re-defining transmission channels. In the context of this
study, it needs to be noted that the financial markets - money markets, debt
markets and forex markets - have undergone significant shifts mainly from late
1990s onwards. A comparison of monetary impulses transmitted through interest
rate effects and through liquidity effects for the period 1961-2000 indicates
that the interest rate channel has emerged as a significant factor for explaining
the variation in real activity in the 1990s as compared with its negligible
impact in the 1980s (Dhal, 2000). The liquidity effect, although significant,
diminished in terms of magnitude.
7.48 Al-Mashat (2003) analysed the key channels of monetary
transmission for India in a vector error correction framework and found: (i)
the impact of shocks on key macroec onomic variables is larger when the exchange
rate is introduced in the model which suggests the importance of the exchange
rate channel; (ii) little evidence that bank lending channel plays a very important
role; and, (iii) response of interest rates to macroeconomic disturbances is
larger than that during the 1980s.
7.49 A brief survey of these recent studies shows that monetary
policy impulses are beginning to impact output and prices through interest rates
and exchange rate movements in addition to the traditional monetary and credit
aggregates. As discussed in the earlier section, lags of monetary transmission
can vary from one business cycle to another. This may be all the more in case
of countries like India where significant changes in the monetary policy operating
framework as well as financial liberalisation took place during the 1990s. In
particular, it needs to be stressed that most of the refinements in the operating
procedures of monetary policy that have permitted short-term interest rates
to emerge as instruments of signalling monetary policy stance have taken place
only from 1997 onwards when the Bank Rate was re-activated. These efforts were
strengthened with the introduction of a full-fledged LAF in 2000. These refinements
in the operating framework alongwith ongoing measures by the Reserve Bank to
impart greater flexibility to the interest rate structure of the commercial
banking system are expected to increase the efficacy of the monetary policy
signals. An attempt has been made here to extend the recent empirical work on
monetary transmission in India using a vector autoregression (VAR) framework.
Box VII.6
Monetary Transmission in India
In order to explore channels of monetary transmission, a 5-variabe
VAR is estimated (see Annex VII.1 for details). The variables are: index of
industrial production (LIIP), wholesale price index (LWPI), Bank Rate (BRATE),
broad money (LM3) and exchange rate (Rupees per US dollar)(LEXCH).
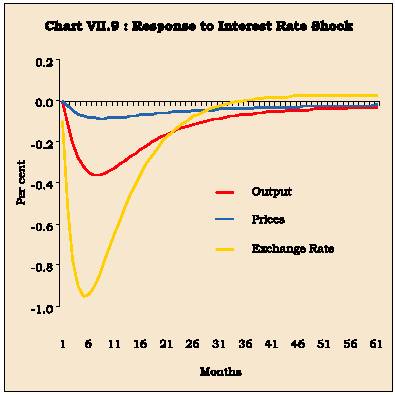
The impulse responses show that a positive shock to the Bank
Rate (i.e., monetary tightening) has the expected negative effect on
output, with the peak effect occurring around six months after the shock. In
the subsequent months, output gradually returns to the baseline. Prices also
decline following a shock to the interest rate. The maximum negative effect
on prices occurs almost six months after the shock and, in the following months,
prices return slowly to the baseline. As regards exchange rate, it appreciates
following a monetary tightening. The peak effect occurs around four months after
the shock and the exchange rate returns to the baseline around three years after
the shock (Chart VII.9).
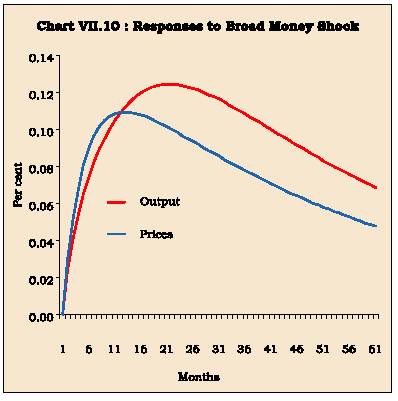
A positive shock to broad money (i.e., monetary expansion)
leads to an increase in output as well as prices. The peak effect on output
occurs almost two years after the shock while that on prices is relatively quick
(almost one year) (Chart VII.10). Qualitatively, the dynamics are broadly the
same as in the case of monetary tightening through the bank rate.
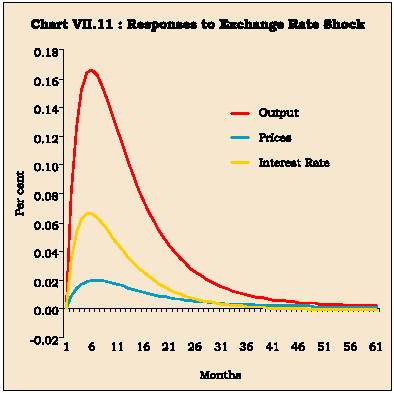
A positive shock to the exchange rate (i.e., depreciation
of the rupee) leads to an increase in prices, with the peak effect taking place
almost six months after the initial shock. As regards output, depreciation has
the expected positive effect. The peak effect occurs nearly six months after
the shock and peters out over time. Finally, a depreciation of the exchange
rate attracts a monetary policy response that leads to an increase in interest
rate. The peak rise in interest rate occurs around six months after the shock.
Subsequently, interest rate starts to fall and returns to baseline
three years after the shock (Chart VII.11). The temporary rise in interest rates
is consistent with the monetary policy response that is aimed at ensuring orderly
conditions in the foreign exchange markets.
Variance decomposition analysis examines the role of monetary
policy and other shocks in contributing to output and price volatility in the
economy. Empirical results show that the proportion of output variance, at 60-months
ahead horizon, due to broad money as well as interest rates shocks is around
1-2 per cent (Table 7.9). In other words, a substantial part of volatility in
output is not on account of monetary policy shocks. Looking at forecast error
variance of prices, shocks to broad money explain almost 25 per cent of volatility
in prices while shocks to interest rates explain less than two per cent of volatility
in prices. Thus, as in case of output, monetary policy shocks are not the key
drivers of volatility in prices and, to that extent, monetary policy in India
can be viewed as contributing to output as well as price stability. Similarly,
innovations to interest rate and broad money explain only a small part -6 per
cent and 11 per cent, respectively - of exchange rate volatility.
Lesser role of monetary policy shocks in output and price volatility,
however, does not suggest that monetary policy does not matter. VAR analysis
focuses on monetary policy shocks, i.e., the non-systematic component
of monetary policy. Monetary policy is mostly characterised by the endogenous
(systematic) response to developments in the economy. Accordingly, the finding
that non-systematic monetary policy is not a major source of fluctuations in
the economy does not deny the proposition that systematic changes in monetary
policy can play a larger role in price and output movements (Christiano et
al., 1999; Boivin and Giannoni, 2002).
7.50 Empirical results show that monetary measures have the
expected effect on output, prices and exchange rate (Box VII.6). Illustratively,
monetary tightening is associated with a reduction in both output and prices.
As regards exchange rate, it appreciates following a monetary tightening. This
shows that monetary tightening measures to ensure orderly conditions in the
foreign exchange market have the desired impact. Turning to the issue of the
lags in transmission, empirical results suggest relatively quick effects. The
peak effect of an interest rate shock on output as well as prices occurs around
six months after the shock. The relatively quick response of prices in response
both to interest rate and broad money shocks appears to be in line with evidence
for EMEs albeit in contrast to the inertial response of prices in the
context of advanced economies where prices are almost unchanged for one year
after a monetary policy shock. As noted earlier, monetary policy lags may be
shorter in emerging economies. Illustratively, Fung (op cit.) found that,
in East Asian economies such as Indonesia, Korea and Malaysia, prices decline
immediately after a monetary policy tightening. He attributes greater price
flexibility in these economies to the labour markets being relatively less rigid.
Thus, the Indian experience in regard to price dynamics appears to resemble
the East Asian economies. In India, shorter transmission lags could perhaps
reflect a variety of factors such as wage/price indexation and concerted policy
efforts to contain inflation. Monetary policy measures are often supplemented
with supply-side measures to contain inflation, given the key role of supply
shocks in the inflation process in India. The public distribution system in
India could also be an important contributory factor. These hypotheses would,
however, need to be explored further.
7.51 In the context of a market-determined exchange rate system
and opening up of the economy, estimates of pass-through from exchange rate
movements to inflation are an important input to monetar y policy formulation.
The dynamic behaviour of prices and exchange rate emerging from the VAR analysis
provides an estimate of
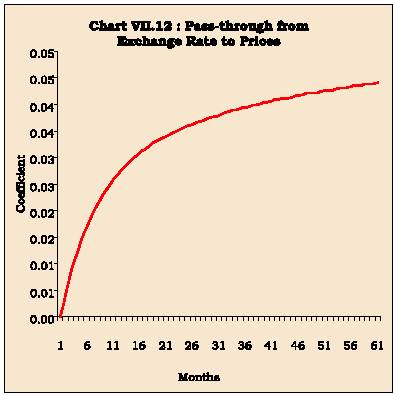
 exchange rate pass-through. According to these impulse responses, exchange rate
pass-through is 0.04, i.e., a 10 per cent depreciation of the exchange
rate increases wholesale prices by 0.4 per cent. Almost 60 per cent of this pass-through
takes place within one year while 80 per cent of pass-through is completed within
two years of a shock to the exchange rate (Chart VII.12). These estimates of the
exchange rate pass-through are subject to a number of caveats. First, the study
period has been characterised by a significant opening up of the economy. Openness
of the Indian economy as measured by the ratio of merchandise imports to
exchange rate pass-through. According to these impulse responses, exchange rate
pass-through is 0.04, i.e., a 10 per cent depreciation of the exchange
rate increases wholesale prices by 0.4 per cent. Almost 60 per cent of this pass-through
takes place within one year while 80 per cent of pass-through is completed within
two years of a shock to the exchange rate (Chart VII.12). These estimates of the
exchange rate pass-through are subject to a number of caveats. First, the study
period has been characterised by a significant opening up of the economy. Openness
of the Indian economy as measured by the ratio of merchandise imports to
GDP has increased from 9.8 per cent in 1993-94 to 13.2 per cent in 2003-04 (see
Chapter V). Second, and more importantly, the substantial decline in tariffs
could have perhaps allowed domestic producers to absorb some part of exchange
rate depreciation without any effect on their profitability. Furthermore, the
increased threat of imports at low impor t duties in an environment of a phased
reduction in non-tariff barriers could have reduced the exchange rate pass-through.
Perhaps, these factors can explain as to why pass-through estimates based on
a longer time-span 1976-2004 (see Chapter V) are almost double of the estimate
emerging from the exercise based on the sample
|
Table 7.9: Variance Decomposition Analysis |
| |
|
|
|
(Per cent) |
| |
|
|
|
|
|
Forecast |
Innovations to |
Proportion of Forecast |
|
Horizon |
|
Error Variance in |
|
|
(months) |
|
|
|
|
| |
|
Output |
Prices |
Exchange |
| |
|
|
|
Rate |
| |
|
|
|
|
|
1 |
2 |
3 |
4 |
5 |
|
1 |
Interest Rate |
0.0 |
0.0 |
1.0 |
| |
Broad Money |
0.0 |
1.4 |
0.8 |
| |
Exchange Rate |
0.1 |
0.0 |
94.0 |
| |
|
|
|
|
|
12 |
Interest Rate |
0.7 |
0.8 |
6.4 |
| |
Broad Money |
0.3 |
8.0 |
7.0 |
| |
Exchange Rate |
2.0 |
0.6 |
62.2 |
| |
|
|
|
|
|
60 |
Interest Rate |
1.0 |
1.4 |
6.4 |
| |
Broad Money |
2.3 |
24.8 |
11.1 |
| |
Exchange Rate |
2.3 |
0.7 |
57.1 |
period of 1993 onwards. At the same time, it must be stressed that the pass-through
estimates from the post-1993 period based on the VAR exercise are rather imprecise.
Thus, the estimates of pass-through would need to be evaluated on an ongoing
basis, before a definitive conclusion is reached.
7.52 The empirical results are illustrative of the evolving
channels of transmission and accord with a priori beliefs. These are,
however, subject to a number of caveats. First, the transmission lags are average
lags and are surrounded by a great deal of uncertainty. In view of the ongoing
structural changes in the real sector as well as financial innovations, the
precise lags may differ in each business cycle. This is all the more as the
period of the study was characterised by the ongoing process of structural reforms
in the Indian economy involving financial deregulation and liberalisation. This
period was also marked by heightened volatility in the international economy,
including developments such as a series of financial crisis beginning with the
Asian crisis. Moreover, as noted earlier, the period under study has been marked
by sharp reductions in customs duties and increasing trade openness which could
have impacted the transmission process. The 1990s was also marked by global
disinflation. Thus, overall the period has been one of substantial ongoing changes
in various spheres of the Indian economy as well as its external environment.
In this context, the observations of the Bank of England (1999) become all the
more relevant: 'the actual outcome of any policy change will depend on
factors such as the extent to which it was anticipated, business and consumer
confidence at home and abroad, the path of fiscal policy, the state of the world
economy, and, the credibility of the monetary policy regime itself'.
7.53 Second, the study period has been characterised by significant
shifts in the monetary policy operating framework from a monetary-targeting
framework to a multiple indicator approach. Third, the study period has been
marked by a sluggish pass-through from policy rates to bank lending rates which
weakens the intended policy impact. The empirical estimates of interest rate
pass-through undertaken in this Chapter suggest that the size of the pass-through
has increased in the recent years, with implications for transmission. Fourth,
in recent years, consumer demand, especially in the form of housing credit and
personal loans, has been an important driver of bank credit. Housing loans which
were only 2.8 per cent of bank credit in March 1995 have more than doubled and
formed 6.5 per cent of bank credit in March 2003. In future, changes in monetary
policy stance could have a stronger effect on private consumption behaviour
with implications for transmission channels and lags. Illustratively, a cut
in policy interest rates will increase cash flow of households and have a positive
impact on private consumption and output and vice versa in case of a
monetary tightening. This might increase the effectiveness of a given change
in monetary policy stance. Finally, the above empirical exercise is constrained
by the use of industrial production as a measure of output in the absence of
a reasonably long quarterly time series on total GDP of the economy. In view
of the significant structural shifts towards the services sector and the inter-linkages
between agriculture, industry and services, the results of this empirical exercise
should be considered as tentative and would need to be ratified with a comprehensive
measure of output, as also by considering alternative techniques.
III. CONCLUDING OBSERVATIONS
7.54 This Chapter addressed key issues relating to the process
through which monetary policy actions affect output and prices. Despite substantial
progress, there is still no unanimity on the precise channels of monetary transmission
and these remain a 'black-box'. A few stylised facts that emerge from
a survey of recent cross-country studies are: (i) pass-through from monetary
policy signals to bank lending rates is only partial in the short-run; (ii)
output displays a hump-shaped response to monetary policy shocks; (iii) prices
are quite sluggish - almost unchanged for one year and it can take almost two
years for monetary policy to have a noticeable effect on prices; and, (iv) in
the case of emerging economies, the lags may be somewhat shorter. The effectiveness
of monetary policy signals depends upon the speed with which the policy rates
are transmitted to market rates of interest. Cross-country evidence suggests
that this pass-through is only partial in the short-term. Although it increases
over time, it still remains usually less than complete. The speed and size of
the pass-through depend upon a number of factors such as volatility in the money
market rates, the extent to which the policy change was anticipated and the
maturity structure of bank balance sheets. Finally, monetary authorities in
future will have to contend with implications of electronic money on the transmission
process. The dominant view is that monetary policy is likely to remain a key
instrument of macroeconomic stabilisation albeit its effectiveness could
be weakened to some extent by the growing use of electronic money.
7.55 With str uctural refor ms and financial liberalisation,
monetary transmission channels in India have undergone a significant transformation.
Monetary policy stance is now being increasingly signalled through variations
in key policy interest rates. Financial prices – interest rates and exchange
rates - are now an important part of the transmission chain. Although rigidities
in the financial system have blunted the pass-through from policy rates to bank’s
lending rates, there is some evidence of an improvement in the pass-through
in recent years. This has been possible through concerted efforts of the Reserve
Bank to impar t greater flexibility to the interest rate structure. Concomitantly,
this has also enabled a moderation in real lending rates for borrowers over
time. This is expected to have a positive impact on investment demand in the
economy.
7.56 Empirical evidence on transmission channels suggests that
monetary policy impulses have the expected effect on output and prices. Furthermore,
monetary policy measures are able to ensure orderly conditions in the foreign
exchange market. The empirical results are, however, subject to a number of
caveats. The transmission lags are average lags and are surrounded by a great
deal of uncertainty. The study period has been one of significant structural
changes in the Indian economy. In view of the ongoing structural changes in
the real sector as well as financial innovations, the size of the effect as
well as the precise transmission lags may differ in each business cycle.
Annex VII.1
Monetary Transmission: Methodological Issues
Notwithstanding recent progress in monetary research, monetary
transmission remains a 'black-box'. The recent research on monetary
transmission has, therefore, largely relied on vector autoregression (VAR) framework.
A VAR framework treats all variables as endogenous in order to avoid infecting
the model with spurious or false identifying restrictions and thus provides
a convincing solution to the 'black-box' problem. Although the VAR
methodology has also been subjected to criticism, the method remains popular
since it offers a straightforward solution to the simultaneity problem and appears
to yield a reasonable characterisation of the economy’s response to monetary
policy (Kuttner and Mosser, 2002). A VAR framework focuses on the responses
of the key macroeconomic variables to exogenous monetary policy shocks rather
than to systematic component of monetary policy. This method also makes the
lag structure and dominance of the channels transparent. In view of lack of
a consensus on the workings of the transmission, the preference for VAR methodology
in the recent literature comes from the minimum restrictions that it places
on as to how the monetary shocks affect the economy. Accordingly, this Chapter
(Box VII.6) uses a VAR framework to explore the monetary transmission dynamics
in India. In view of significant structural changes in the economy, a study
based on a long-period may be subject to the problem of structural breaks and
the results may not fully reflect the current lags in the transmission. The
empirical exercise in this section thus focuses on the post-liberalisation period
(April 1994 to March 2004).
Two key issues in estimating a VAR model are the list of variables
to be included and the identifying assumptions. In India, operating procedures
have undergone significant shifts over the sample period. It is only recently
that interest rates have emerged as signals of monetary policy stance. Moreover,
despite a switch away from a monetary targeting framework, broad money continues
to be an important information variable. Given that the period of empirical
study covers the period 1994 onwards, when these changes to monetary policy
framework have been gradually evolving, the VAR, therefore, includes both interest
rates and broad money. As output stabilisation and price stability are the key
objectives of monetary policy, these variables are included in the VAR. Finally,
reflecting the opening up of the economy, exchange rate is also included in
the VAR. Furthermore, ensuring orderliness in foreign exchange market is a key
policy objective and, towards this objective, monetary policy has been occasionally
tightened through increases in key policy rates over the sample period. This
also provides a strong rationale for inclusion of exchange rate as an endogenous
variable in the VAR. In all, the VAR model includes five endogenous variables.
As regards the identification assumptions, this Chapter estimated
a recursive VAR with short-run restrictions on the contemporaneous effect of
variables (Christiano, Eichenbaum and Evans, 1999). A common identifying assumption
in the VAR literature is that monetary policy can react to output and price
developments contemporaneously (i.e., in the same period) but there is
no contemporaneous output and prices reaction to monetary signals. Accordingly,
output and prices are placed before monetary policy variables in the model.
This ordering appears reasonable, especially given the use of monthly data.
The variables are thus ordered as follows: index of industrial production (LIIP),
wholesale price index (LWPI), Bank Rate (BRATE), broad money (LM3) and exchange
rate (Rupees per US dollar) (LEXCH). Exchange rate, being a financial market
variable, can react to monetary signals contemporaneously and, therefore, is
placed last in the VAR. A sensitivity analysis undertaken on the ordering of
variables indicated that the impulse responses are broadly unchanged whether
exchange rate is placed after or before interest rate and money supply variables.
In addition to the endogenous variables, oil prices (to control for supply shocks)
are included as an exogenous variable. Real world exports and global non-fuel
commodity prices are also included as exogenous variables to account for external
demand and price shocks. Monthly dummies were included to control for seasonality.
All the variables (except interest rate variables) are in logarithmic form.
All the variables in the VAR are found to be non-stationary. As the option of
differencing of series produces no gain in asymptotic efficiency and throws
away information, the VAR is estimated in levels.
The results of the VAR model are typically analysed in terms
of impulse response and variance decomposition. While impulse responses track
the dynamics of key macro variables in response to an exogenous monetary policy
shock, variance decomposition analysis attempts to quantify the role of monetary
policy shocks in the volatility of key macroeconomic aggregates. These results
are presented in Box VII.6.
|