by Deba Prasad Rath, Abhilasha, Monika Sethi and Rashika Arora^ This article examines the export potential of India with respect to key geographies covering significant export destinations, Free Trade Agreement (FTA) partners and hitherto under-tapped export markets, deploying the export similarity index (ESI). The evolution of ESI shows that India’s export structure is increasingly aligning itself with the average world demand. Moreover, India’s merchandise and services exports have recovered from the disruption caused by the COVID-19 pandemic and the ESI can be an effective tool to engage better with trade partners and direct focus on the commodities and services that hasten the path to reach US$ 2 trillion worth of exports by 2030. Introduction In 2022, India leapfrogged to the rank of the fifth largest economy in the world, the same year that India’s exports surged to a record level, which has been bettered in the subsequent year. The four countries ahead of India in terms of economic size are also the largest exporters in the world. Recognising that trade is an essential engine of growth to transition to the developed country status, the Government has set the aim of reaching US$ 1 trillion worth of exports each of goods and services by 2030. While India’s exports stayed buoyant up to H1:2022, the rapid pace of monetary tightening has led to waning of external demand which is posing headwinds to growth in trade. One of the methods chosen by India to expand its export demand is through actualising free trade agreements (FTAs) with key economic partners. It is expected that synergies through FTAs would be the bedrock for rapid acceleration of trade, growth and welfare. For example, the Joint Statement of the 18th India-Australia Joint Ministerial Commission1 noted the complementary nature of the two economies offers scope for enhancing, inter alia, trade between the two countries. Another method has been diversifying India’s export destinations. As the current economic slowdown is more pronounced in the advanced economies (AEs), which are India’s major export markets, Africa can be a “new continent of opportunities”2. India’s exports to Africa stood at US$ 46.4 billion3 during April 2022-February 2023, 15.4 per cent higher than the total exports to the region in 2021-22. The recently launched African Continental Free Trade Agreement (AfCFTA) – the world’s largest free trade area comprising 55 countries – offers huge export potential for India. In this context, this article is to our knowledge the first which examines the changing pattern of India’s exports and competitiveness in relation to the world and select geographies in the 21st century, by computing the export similarity index (ESI). The index, computed for two countries or groups of countries, gives an assessment of whether the export structure of the two are competitive, i.e., whether there is scope for specialisation when the export structures converge and thus reap the benefits of similar-similar trade (Krugman, 2008). Low similarity, on the other hand, portends complementarity or the comparative advantage scope for trade creation. After two consecutive years of slowdown induced by the COVID-19 pandemic, the strong resurgence in exports was a dominant contributor to GDP growth in 2021-22. Our analysis suggests that India has already bridged both the merchandise and services trade gaps that emerged due to the pandemic. The pandemic also heaved a major change in the structure of trade, as noted in an OECD Trade Policy Paper (Arriola et al., 2023). This study finds that the change in India’s export structure brought on by the pandemic, endures even after two years. Over the past two decades, however, India’s economic structure is aligning with the world, reflective of the specialisation that is taking hold in the economy. The rest of the article is organised as follows. Review of the literature discussing the ESI, its significance and related concepts is covered briefly in Section II. Section III describes the data and the methodology that is followed to compute ESI in the article. The examination of the Indian ESI and its evolution, the ESI in relation to the pandemic and the ESI with respect to India’s key FTA partners and with respect to major competitors in the African market is taken up in Section IV. The strengths and policy implications for India’s exports in the face of slowing world demand are enunciated in the concluding Section V. II. Literature Review Finger and Kreinin (1979) [FK] introduced an index of export similarity to understand the relationship between similarity of exports by countries and the trade creating/diverting effect of preferential trade agreements between them. Such an index could also be utilised to assess the convergence/divergence in the economic structure of countries. Several studies in the literature have made use of the FK similarity index to analyse the evolution of export structures of countries vis-à-vis that of other countries (Schott, 2008; Erlat and Ekmen, 2009; Chow, 2012; Wang and Liu, 2015; Nguyen et al., 2017). Some studies have explored dissimilarity (as opposed to similarity) of exports among countries to draw analogous conclusions (Amable, 2000; Parteka and Tamberi, 2013; Bernatonytė, 2015)4. A detailed summary of the literature is presented in the Annex I. The present study uses FK’s ESI to assess the evolution of India’s export pattern, the scope for specialisation, particularly with reference to a few key FTAs and possible new markets, and the impact of COVID-19 on the export structure. III. Data Sources and Methodology The Export Similarity Index (ESI) as proposed5 by Finger and Kreinin (1979), and used in this article, is calculated as: For estimation of India’s ESI, the Harmonised System (HS) of classification6 on merchandise trade data from the International Trade Centre’s (ITC) Trade Map database is used. The World Trade Organization (WTO) database on services based on sixth edition of Balance of Payments and International Investment Position Manual (BPM6) is used for services trade data. India’s ESI for merchandise has been estimated at the HS 2-digit level. The ESI for merchandise trade is analysed from 2002 onwards, while for services, the study starts from 2005, the year from which the data is available, with the latest period as 2021 for both goods and services. The evolution of India’s export structure has been compared with the changing world export structure as also with the G7 countries. A commodity-wise analysis at HS 2-digit and 6-digit has been undertaken to gauge the convergence in the export pattern of India with that of the G7. Further, changes brought about by the COVID-19 in export structure has been analysed. Furthermore, the article analyses the ESI of India vis-à-vis five of its existing FTA partners viz. ASEAN, Japan, South Korea, UAE and Australia. Additionally, India’s merchandise export pattern in the African market is compared with that of its major competitors, and commodities at the HS 4-digit have been identified to ascertain commodities with overlap, and commodities which exhibit export potential for India. IV. The Indian Case IV.1 India’s Changing Export Structure The extant literature suggests that it is not just export growth that provides a boost to economic growth but the pattern of specialisation, i.e., the composition of exports that describes the potential of exports in raising a country’s economic growth. For instance, specialisation brought in through openness that diverts a country from research and/or technology-intensive industries, may lead to lower output growth than in an autarky (Amable, 2000). Therefore, it becomes relevant to analyse the export structure of a country. Linder (1961) hypothesised that there exists stronger trade between countries with similar demand structures. Trade is beneficial to growth when a country specialises in industries where world demand is strong (Amable, 2000 and Bernatonyte, 2015). An analysis of India’s export structure with that of the world demand shows that India’s export structure is moving towards the average pattern of world trade, as observed by the increase in ESI over the years (Chart 1). This shows that India is specialising in those products that have relatively higher international demand. The changing export structure of India is also visible at the commodity level; the share of principal commodities such as engineering goods, chemicals, drugs and pharma, rice, electronics in India’s overall export basket has increased. On the other hand, the share of commodities such as gems and jewellery and other labour-intensive items such as textiles, leather and leather products has declined in the past decade (Chart 2a). This is in line with the shifting pattern in international merchandise trade, characterised by a gradual dip in the shares of textiles and clothing and hides and skins over the decades. 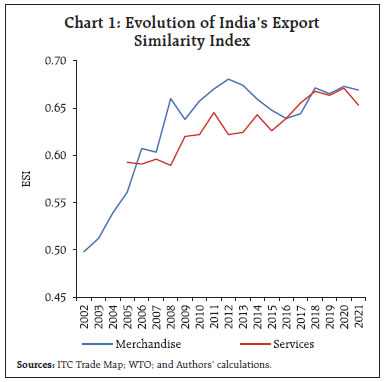
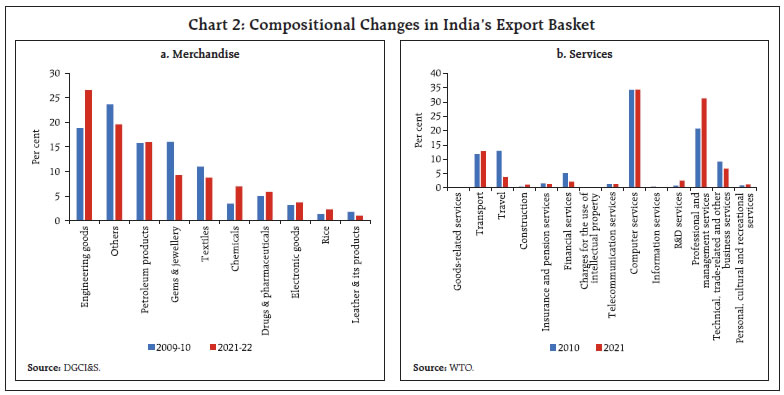 In the case of services also, India’s export structure is converging with that of the world as the ESI is increasing over the years. At the disaggregated level, the share of professional and management consulting services has increased between 2010 and 2021 (Chart 2b). The extent of similarity with the world export structure is almost at the same level for both goods and services in recent years. The effect of COVID-19 on the export structure is, however, visible for both goods and services, which will be analysed in a subsequent sub-section. IV.2 Convergence with the G7 Export Structure If the ESI between the two countries/regions rises over time, it reflects the converging export structure of the two countries/regions and if this convergence is between AEs and emerging market economies (EMEs), then a rise in the ESI reflects that the economic structures of the two are coming closer and, therefore, indicates rapid economic growth in EMEs (Finger and Kreinin, 1979 and Wang and Liu, 2015). Further, the similarity of a country’s export bundle with that of the AEs is considered as a measure of relative sophistication of the country’s exports (Schott, 2008). India’s converging merchandise export structure with the G7 countries, as reflected in the increasing ESI, indicates that India is on the right path in terms of achieving the developed country status, as greater overlap in the export bundle of an EME with that of AEs reflects growing export sophistication. Currently, around 60 per cent of India’s exports are similar to that of the G7, and there exists further scope for convergence (Chart 3). Country-wise, India’s merchandise export structure at the aggregate level is the most similar with that of the US (0.64), followed by the UK (0.62) [Chart 4]. 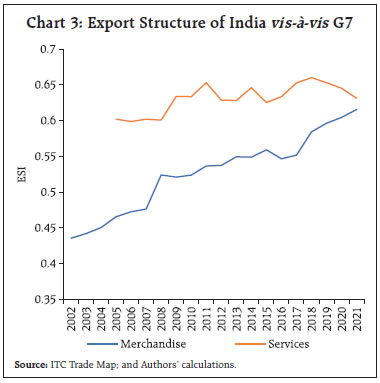 India’s services exports have largely been similar to the G7 services export patterns as its ESI values have hovered around 0.6-0.65 throughout the period under review, witnessing a downward trend in the recent period since COVID-19 when services exports crashed. The rapid growth in services exports has led to their share in India’s total exports increasing to high levels, even higher than the average share in AEs (Anand, Kochhar and Mishra, 2015) [Chart 5]. 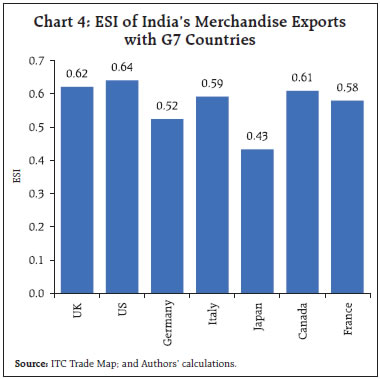 Further, on comparing the export structure of each of the G7 countries with that of the world, it is evident that the export structure of both merchandise and services of G7 countries is similar to that of the world as the ESI is above 0.7 except for Canada and Japan (for merchandise) in 2021. India has progressed remarkably over the years as its index value has improved from 0.50 in 2002 to 0.67 (merchandise), and from 0.6 in 2005 to 0.65 (services) in 2021; however, it is still below the level of many of the G7 countries (Chart 6).
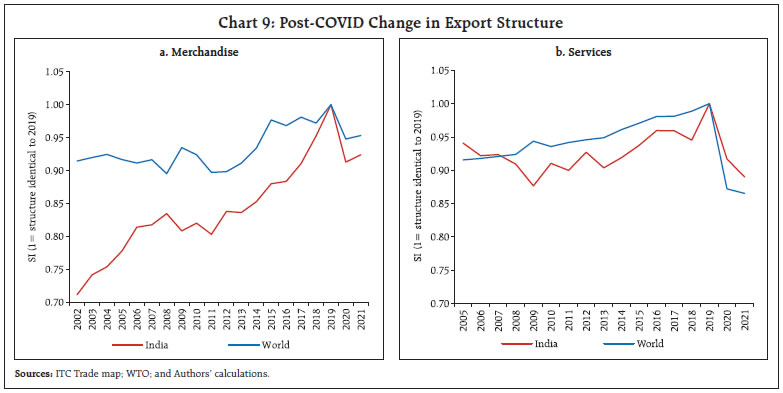
The high ESI of India with that of G7 is visible for commodities such as fuel, machinery, pharmaceutical products, and vehicles etc. (Chart 7). At a further disaggregated level of HS 6-digit, commodities such as medicaments, oils and preparations, parts and accessories for heavy vehicles, motor cars etc. are the items that make the export structures of India and G7 similar. IV.3 Recovery and Structural Changes in the post-COVID Period India’s merchandise exports witnessed a steeper drop in early 2020 as compared to the world and the G7 countries due to the pandemic shock (Chart 8a). Trade gap has been calculated in this study following Arriola et al., 2023, which is the difference between actual trade realisations and the estimated values of exports for the period starting January 2020, based on the pre-pandemic levels (up to December 2019). The estimated export values are derived from the Seasonal Auto-Regressive Integrated Moving Average (SARIMA) model. The details of the model are given in Annex II. World merchandise exports attained a positive trade gap – the actual export values exceeding the estimated export values – sooner than India. In turn, India’s export gap turned positive earlier than the G7 countries. In recent months, India’s merchandise exports have outperformed both the G7 as also the world’s goods exports. The G7 services trade gap (exports) remains negative, staying below the pre-pandemic trend. On the other hand, India’s services exports gap turned positive in the Q4:2021 (Chart 8b). According to Arriola et al. (2023), trade in services which can be digitally delivered has not been negatively affected by the pandemic. Given the large share of computer services and professional and management consulting services in India’s services exports as opposed to contact-intensive services (refer Chart 2b), enabled India to close the services trade gap faster. The COVID-19 pandemic caused a large change in the structure of trade of both goods and services. Arriola et al. (2023) has noted in the context of G7 and China that the change in merchandise trade structure caused by the COVID-19 in a single year is of similar magnitude to changes that are typically seen over a period of five to seven years. The changes to the structure of services trade are even larger. In line with the global trend, India’s export structure in the post-COVID period also differs substantially from that in 2019. This has, however, started reversing for merchandise trade. Comparing the post-COVID services export structure with that which prevailed in 2019, there has been a less sharp structural shift in India’s services export basket as compared to average demand pattern of the world (Chart 9). This is likely due to the preponderance of software exports in India’s services exports, a segment which did not suffer a demand erosion during the pandemic. 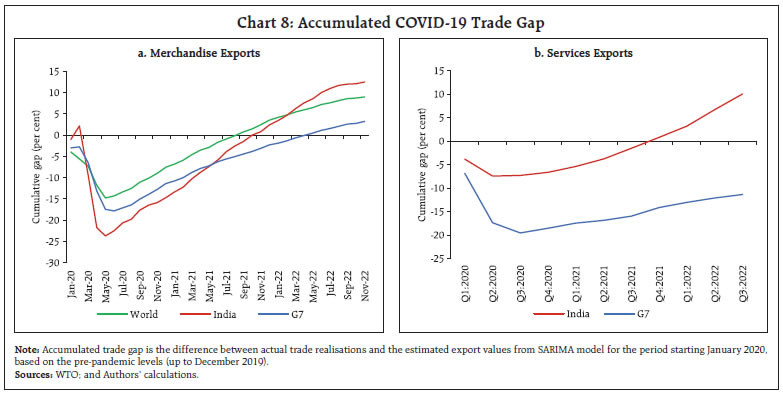
 IV.4 An Analysis of India’s ESI with Five FTA Partners India has accorded a high priority to promote its export growth by leveraging export competitiveness through signing of new FTAs and fine-tuning the existing FTAs. India’s trade agreements with various countries aim at setting India’s export market diversification strategy into motion. In an FTA, the similarity of the export structure of partner countries increases over a period of time with increasing intra-regional trade. While entering an FTA if the potential FTA partner country/ies have high similarity in export structure, the FTA may not yield much benefit in terms of inter-industry trade as partner countries do not have export complementarity (Plummer, Cheong and Hamanaka, 2010). As per the Ricardian/Heckscher-Ohlin model, trade occurs only between industries – inter-industry trade. A country specialises in the production of goods in which it has a comparative advantage derived from its factor endowment and exports the product to rest of the world. Based on comparative advantage, if a partner country of an FTA produces and exports products of a particular industry which are imported by the other partner country, then the trade between the two is complementary in nature. In this case, FTA brings gain in terms of increased inter-industry trade between partner countries or what is known as trade creation. On the other hand, literature also argues that through export similarity, intra-industry trade is expected to increase the intra-regional trade of the FTA countries (Hapsari and Mangunsong, 2006). Intra-industry trade occurs if countries trade in products that belong to the same industry e.g., trade in branded automobiles. Intra-industry trade arises in differentiated products and gains are derived through better exploitation of economies of scale. With growing internationalisation of production processes, intra-industry trade is increasing over the years. Similarity in export structure of FTA countries implies presence of greater potential for intra-industry trade. Further, FTAs have additional positive effect on trade through their hub-and-spoke nature (Alba, Hur and Park, 2010). India has so far signed 14 FTAs with its trading partners. In addition, it has signed 6 limited coverage Preferential Trade Agreements (PTAs)7. Among these, agreements with Mauritius, the UAE and Australia have been signed recently (with Mauritius in 2021 and with the UAE and Australia in 2022). This sub-section analyses the similarity of export structure of India vis-à-vis five of its large FTA partners namely, ASEAN, Japan, South Korea, Australia and the UAE. India’s FTA with ASEAN covers agreement in goods, services, and investment. India’s agreements with ASEAN came into effect in 2010 for goods trade and in 2014 for services and investment. To get an idea about the export similarity of ASEAN, the ESI of individual ASEAN countries in relation to the exports of ASEAN region has been computed. Except for Brunei, Cambodia, Myanmar and Lao, member countries have export structures similar to the ASEAN export structure. Further, within ASEAN, Malaysia is the most competitive country with the highest ESI value displaying high similarity of Malaysian export structure with that of ASEAN export structure. Over the years, competitiveness of Vietnam has also increased as reflected in its increasing ESI values. Further, the progress of Vietnam as a world FTA hub is giving it a competitive edge over other member countries. Almost 55 per cent of India’s export basket is similar to that of the ASEAN region and the export similarity has not changed much over the years (Chart 10). With the objective of enhancing its economic partnership with a few Asian countries, India signed a Comprehensive Economic Partnership Agreement (CEPA) with South Korea in 2009 and with Japan in 2011. Further, India signed a CEPA with the UAE and an Economic Cooperation and Trade Agreement with Australia in 2022. The agreements eliminated tariffs on majority of India’s trade with these countries. 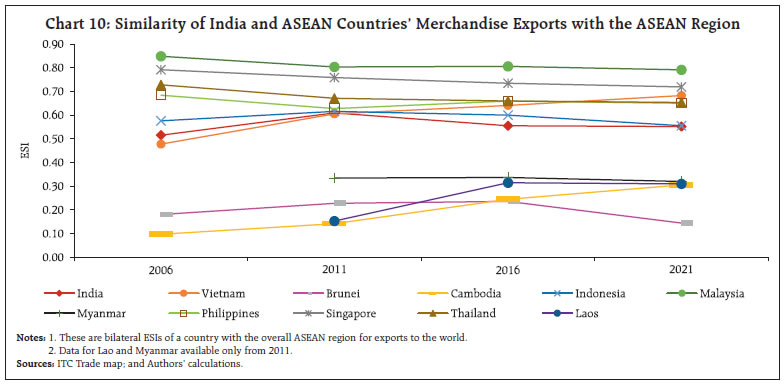
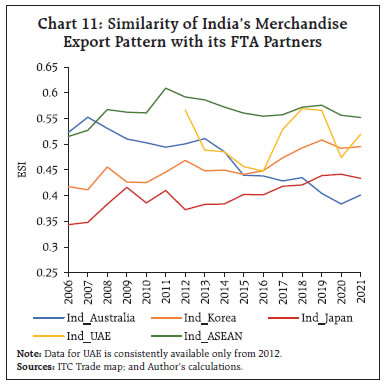 On the basis of the computed ESI values, it can be seen that the export structures of Japan and Australia are quite different from that of India and, therefore, there is huge scope for inter-industry trade expansion of India with these countries. India’s exports have increasingly been getting similar to that of South Korea; however, still the two countries’ index values show complementarity in their exports. On the other hand, India’s export pattern is the most similar with the ASEAN among the selected FTA countries, though the similarity has fallen over the years. Further, the scope for expansion of intra-industry trade by India is more in case of FTA with ASEAN (Chart 11). The UAE is primarily a fuel exporting country with half of its exports comprising ‘mineral fuels, mineral oils and products of their distillation etc’. The vicissitudes in global oil demand affects its exports significantly and therefore, its export structure is showing volatility. Notwithstanding, India has the second highest similarity in merchandise exports with UAE, possibly reflecting similarity on account of petroleum products and pearls, precious and semi-precious stones. 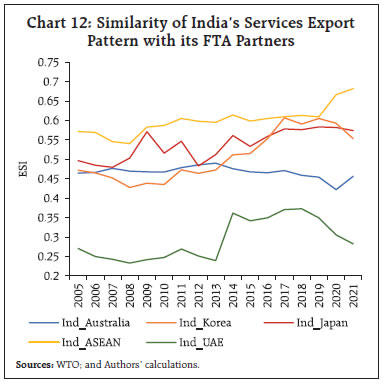 The ESIs of India vis-à-vis its FTA partners in the case of services highlight that India’s export pattern has greater similarity with those of the ASEAN, South Korea and Japan. The similarity in export pattern with Australia has come down over the years, barring the latest period. With Australia, however, there exists complementarity for services akin to merchandise (Chart 12). The complementarity with the UAE is the highest and is growing, reflecting the higher share of travel and transport in the UAE while India’s niche is in telecommunications, computer and information services and other business services. IV.5 An Analysis of India’s ESI with Major Competitors in African Market Africa is a significant potential market for exporting countries. India is increasingly engaging with Africa and strengthening its trade and investment relations with the continent – its share in Africa’s imports increased from around 4 per cent in 2017 to 6 per cent in 2021. In literature, ESI is applied to gauge the extent of competition a country faces in a particular market. For instance, ESI methodology found that Turkey faces strong competition in the EU market, in particular in labour-intensive goods (Erlat and Ekmen, 2009). The estimation of ESI of India with other major merchandise8 exporters to Africa shows that India’s exports to Africa are mostly similar with that of the US and France (Chart 13). Drilling deeper, ESIs at HS 4-digit level indicate petroleum products, motor cars and other vehicles for transport of persons, motor vehicles for goods transport and blood for therapeutic, prophylactic or diagnostic uses are the major commodities with the highest similarity where India faces stiff competition from China, US, France and the UAE. Commodities at HS 4-digit with significant shares in the African import basket, for which the ESI values are lower, indicating trade-creating export potential for India include medicaments consisting of petroleum oils and oils obtained from bituminous minerals, crude; telephone sets; mixed or unmixed products for therapeutic or prophylactic uses; parts and accessories for tractors; automatic data-processing machines and units thereof; magnetic or optical readers; and motor vehicles for the transport of ten or more persons. 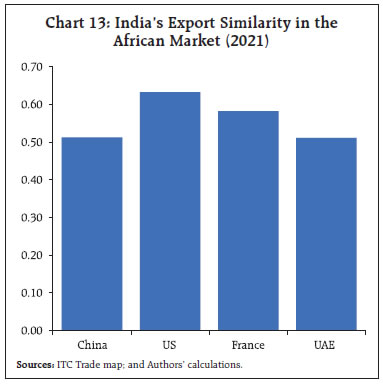 V. Policy Implications and Conclusion This article is possibly the first to undertake an extensive examination of India’s export similarity indices in both merchandise and services exports, its evolution over the years and comparison with key AEs and major FTA partners. This also explores the possibility of expanding into the large African market and the commodities that could spearhead the expansion. The ESI gives a visual representation of the strengths and the evolution of India’s export pattern. The rapid alignment of India’s merchandise export pattern with world exports in the recent years shows that the emphasis given to Make in India and Atmanirbhar Bharat is also helping India become a key supplier to the world – Made in India. Increasing specialisation and competitiveness bode well for India to capitalise on the current trend of diversification of supply chains. Amongst the G7 countries, India’s ESI for merchandise exports, at 0.64, is the highest with the US, which is also India’s top export destination. Growing competitiveness with the world’s largest and most advanced economy is a desirable impetus to advancement. Two caveats are in order. One, the analysis is done at the 2-digit level of commodity classification which may have yielded higher level of indices as higher the level of commodity aggregation, more the intra-industry trade is netted out. The broad trends, however, offer policy implications for taking India to the US$ 2 trillion level of exports by 2030. Two, even as ESI is broadly consistent with economic trends, it may overstate the extent of competitiveness as it does not consider differences in quality and product sophistication (IMF, 2011). At the same time, the ESI provides insight – increasing ESI at the disaggregated commodity level could indicate where investment and R&D need to be directed to reap the benefits of increasing returns to scale and specialisation. Our analysis at the disaggregated level shows high competitiveness for commodities such as medicaments, oils and preparations, parts and accessories for heavy vehicles, motor cars etc. Some of these belong to the sectors that have been given impetus through the Production-Linked Incentive (PLI) scheme introduced by the Government of India in March 2020, with the highest outlay for automobiles and auto components, and the fourth highest outlay for drugs and pharmaceuticals9. This augurs well for furthering competitiveness, specialisation and exports from these industries. In services, in the post-pandemic period, even as India has closed the trade gap faster than the G7 countries, its services ESI with respect to the world is lower than all the G7 countries and has also dipped in the latest year. This shows the need to diversify and achieve niche in areas beyond software and professional services. While the pandemic held India’s main services exports in good stead, going forward, India will have to build expertise in transport and travel. The focus on infrastructure under the aegis of the National Logistics Policy 2022, which envisages reduction in logistics cost in the country to less than 10 per cent of GDP from the current 13-14 per cent, should help in this cause. An analysis of ESIs with India’s main FTA trading partners shows that India’s merchandise ESI in the ASEAN region is lower than the Big-5 ASEAN economies and has been dipping. Vietnam, which is emerging as a manufacturing and export hub, has registered a sharp increase in its ESI value over the past two decades. This shows that India has significant scope for enhancing its competitiveness compared with its ASEAN peers. The ESIs with Japan and South Korea have increased gradually since the FTAs came into effect indicating increasing specialisation of India’s exports in line with the advanced Asian peers. In contrast, the prevailing relatively lower level of ESI with Australia offers scope for expanding exports through complementarity while gradually specialising to enhance trade and competitiveness with the latest entrant to India’s FTA partners list. ESI analysis with major competing countries in the African market throws insights into the commodities where we have an edge and where we need to compete. While this article has done an overview of ESI with select FTA partners, the export similarity index – with simplicity of its concept and broadness of its significance – when computed for granular data and specific markets, can be used as a bellwether for negotiating deals, agreements and concessions in future FTAs. References Alba, J. M., Hur, J., and Park, D. (2010). Do Hub-and-Spoke Free Trade Agreements Increase Trade? A Panel Data Analysis. ADB Working Paper Series on Regional Economic Integration, No. 46, Asian Development Bank. Amable, B. (2000). International Specialisation and Growth. Structural Change and Economic Dynamics, 11(4), 413-431. Anand, R., Kochhar, M. K., and Mishra, M. S. (2015). Make in India: Which Exports Can Drive the Next Wave of Growth?. International Monetary Fund. Antimiani, A., & Henke, R. (2007). Old and new partners: Similarity and competition in the EU foreign agri-food trade. Acta Agriculturae Scand Section C, 4(3), 129-138. Arriola, C., Cadestin C., Kowalski P., Guilhoto J.J.M, Miroudot S. and Frank van Tongeren (2023), Challenges to International Trade and the Global Economy: Recovery from COVID-19 and Russia’s War of Aggression against Ukraine, OECD Trade Policy Papers, No. 265, OECD Publishing, Paris, https://doi.org/10.1787/5c561274-en. Bernatonytė, D. (2015). Estimation of Export Specialization: Lithuanian Case. Quarterly Journal of Economics and Economic Policy, 10(3), 129-138. Chandran, D. (2011). Trade Complementarity and Similarity between India and ASEAN Countries in the Context of the RTA. Available at SSRN 1763299. Chow, P. C. (2012). Trade Similarity Index and the Level of Development. In Trade and Industrial Development in East Asia. Edward Elgar Publishing. Erlat, G., and Ekmen, S. (2009). Export Similarity and Competitiveness: The Case of Turkey in the EU Market. In Proc. Anadolu International Conference in Economics. Finger, J. M., and Kreinin, M. E. (1979). A Measure of Export Similarity and its Possible Uses. The Economic Journal, 89(356), 905-912. Hapsari, I. M., and Mangunsong, C. (2006). Determinants of AFTA Members’ Trade Flows and Potential for Trade Diversion. ARTNeT Working Paper Series, No. 21, Asia-Pacific Research and Training Network on Trade (ARTNeT). Hasan, M. D. (2007). Measuring Export Competitiveness in South Asia: Export Similarity Index Approach. accessed at https://www.academia.edu/22528741/Measuring_Export_Competitiveness_in_South_Asia_Export_Similarity_Index_Approach Hyndman, R. J., and Athanasopoulos, G. (2018). Forecasting: Principles and Practice. OTexts. IMF. (2011). Asia and Pacific, Managing the Next Phase of Growth. Regional Economic Outlook, World Economic and Financial Surveys. April. Kanupriya. (2020). Export Similarity Index as a Barometer of Indian Textiles Exports Competitiveness. The Indian Economic Journal, 68(3), 457-464. Krugman, P. (2008). The Increasing Returns Revolution in Trade and Geography. Nobel Prize Lecture, December 8 Linder, S. B. (1961). An essay on trade and transformation (pp. 82-109). Stockholm: Almqvist & Wiksell. Nguyen, T. N. A., Pham, T. H. H., and Vallée, T. (2017). Similarity in Trade Structure: Evidence from ASEAN+ 3. The Journal of International Trade & Economic Development, 26(8), 1000-1024. Parteka, A., and Tamberi, M. (2013). Product Diversification, Relative Specialisation and Economic Development: Import–Export Analysis. Journal of Macroeconomics, 38, 121-135. Plummer, M. G., Cheong D., and Hamanaka, S. (2010). Methodology for Impact Assessment of Free Trade Agreements. Asian Development Bank. Schott, P. K. (2008). The Relative Sophistication of Chinese Exports. Economic Policy, 23(53), 6-49. Vlasenko, L. (2020). Evaluation of the Composite Export Similarity Index on the Example of China. REICE: Revista Electrónica de Investigación en Ciencias Económicas 8, No. 16: 135-149. Wang, P. Z., and Liu, X. J. (2015). Comparative Analysis of Export Similarity Index between China and EU. International Conference on Management Science and Management Innovation (pp. 222-227). Atlantis Press. August.
Annex I: Literature Review of Export Similarity Index | Reference | Period/Geographies | Method | Major Findings/Result | | Finger and Kreinin (1979) | Similarity pattern of manufactured exports calculated by using Standard International Trade Classification (SITC) data covering 380 categories. Data from 1960 to 1974. Countries covered included US, Japan, old European Economic Community (six countries) and rest of Industrial Western Europe, three groups of Less Developed Countries (LDCs) – semi-industrial, least developed and others. | The index of export similarity was introduced. The study aimed to: (i) Understand possible trade diversion or trade creation effects of preferential treatment given to a particular country(ies) (ii) Assess the degree to which the economic structure of two countries or groups of countries converge/diverge. | 1. Trade diversion occasioned by the Generalised System of Preferences (GSP) of the major industrial countries (the United States, Japan, and Old European Economic Community) will mostly benefit the seven Semi-Industrial LDCs.
2. Tariff concessions exchanged by the industrial countries under General Agreement on Tariffs and Trade (GATT) have probably been helpful in expanding the exports of the Semi-Industrial LDCs, but less so the exports of other LDCs.
3. So long as the LDCs insist on playing a non-reciprocal role at the GATT negotiations, further reductions of trade barriers become less likely.
4. The formation of a free trade area in Europe, much of the preferences in favour of LDCs has been eroded. | | Amable (2000) | Investigated the effects of international trade specialisation, using inter-industry specialisation and trade dissimilarity, on economic growth for 39 countries over 1965–1990. | Three indicators of foreign trade are considered -
(i) Inter-industry specialisation
(ii) Index of trade dissimilarity, and
(iii) Comparative advantage in electronics. | Trade dissimilarity index indicates whether the trade pattern of a country is at odds with the international demand. Using the Generalised Method of Moments, the paper concludes that a trade structure dissimilar to world trade affects growth negatively. | | Schott (2008) | Examined the relative “sophistication” of China’s exports for the period 1972-2001. | Computed –
(i) Market shares and product penetration
(ii) FK's SI, and
(iii) Price comparisons | 1. The study concludes that China’s export bundle increasingly overlaps with that of the world’s most developed economies.
2. China’s exports sell at a substantial and increasing discount relative to the exports emanating from the Organisation for Economic Co-operation and Development (OECD). | | Erlat and Ekmen (2009) | Analysed similarity of Turkish exports with other major exporters to the EU-15 group and with the exports of developed countries as a measure of relative sophistication for the period 1996-2007. | Computed –
(i) FK's export SI,
(ii) Product SI, and
(iii) Price SI. | 1. Turkey faces strong competition in the EU market. The degree of competition changes with respect to the countries and sectors over the years.
2. Product wise, Turkey faces stiff competition in labour-intensive goods.
3. Turkey’s export similarity with developed countries, although increasing, remains low with some developed countries. | | Chow (2012) | Analysed the trade similarity index between East Asian countries to explore if the developing East Asian countries compete amongst themselves and explores the relationship between Export Similarity Index and the levels of economic development for the period 1962-2000. | Computed FK's SI. | The analysis revealed that as the income gap between Japan and ASEAN countries narrowed, the overlap among export commodities with Japan in the world market increased, indicating that there is some evidence of a greater overlap among export commodities as the per capita income gap narrows. | | Parteka and Tamberi (2013) | Assessed the relative specialisation patterns of export and import baskets of countries vis-à-vis the world, for 163 countries for the period 1988-2010. | Computed –
(i) Relative Theil index,
(ii) Relative Gini index, and
(iii) Dissimilarity index. | The study concludes that as per capita income increases, the export and import baskets witness a decline in specialisation and become more diversified, and there is an increase in the similarity between import and export structures. | | Bernatonytė (2015) | Investigated nature and pattern of export specialisation in Lithuania using SITC data for period 2007-2013. | Computed –
(i) Index of export specialisation (modified RCA index),
(ii) Trade dissimilarity index. | 1. Lithuania's integration into the EU has influenced its export specialisation. Trade structure of Lithuania is similar to that of the EU.
2. Biggest flows from Lithuania to the EU are in food, drink and tobacco; raw materials; mineral fuels, lubricants and related materials. | | Wang and Liu (2015) | Export similarity is studied between China and European Union (EU) in world market, American market and Indian market. SITC 1-digit data from 2007-2013 is used. | Computed FK's SI for China and EU in different markets. | 1. China and EU have high export similarity in developed countries' market and, therefore, have fierce competition.
2. China and EU have trade complementarity in developing countries' market. | | Nguyen et al. (2017) | Calculated export similarity index for Association of South East Asian Nations (ASEAN)+3 members at 1 to 4-digit SITC data. Compared that with revealed comparative advantage index. Detected export communities (most similar or most competitive) in ASEAN+3. Data from 1990-2014. Countries covered included ASEAN and China, Japan and Korea. | 1. Computed Finger and Kreinin (FK)’s Similarity Index (SI) for each member country.
2. Community detection based on SI results through PSEUDO-ALGORITHM in network analysis. | 1. Similarity in ASEAN+3’s export composition varies among members with Brunei and Cambodia having low levels of SI while China, Japan, Singapore, S Korea and Malaysia experiencing a high export similarity.
2. Japan, Singapore, China, Malaysia and Korea, with highest SI, form an export community mainly in electronic microcircuits and parts of office machines.
3. Export similarity positively and significantly associated with the Revealed Comparative Advantage (RCA). | | Vlasenko (2020) | 1. Proposed Composite Export Similarity Index. Panel data of 40 countries at Harmonised Commodity Description and Coding System (HS) 2-digit commodities for 2001-18 is used.
2. Export portfolio of China is compared with 40 other major global exporters covering data for 246 destinations. | Computed Composite Export Similarity Index by integrating Export Similarity Index of Commodities and Export Similarity Index of Destinations. | China’s most probable competitors were found as Vietnam, Republic of Korea, Japan, Malaysia and Singapore; least probable competitors with little to none overlap of exports were oil exporting economies of Kuwait, Saudi Arabia and Iran. | | Kanupriya (2020) | ESI computed for five key products at HS 6-digit level (under the HS 2-digit level from 56 to 60) for the period 2013 to 2017 for five key markets for each product | ESI computed by dividing the ratio of Indian textiles exports to the partner country (each of the top five markets identified) to the total exports of all products to those countries by the ratio of partner’s exports of textiles to total exports of all products to India. | The Indian textiles exports are not competitive in terms of the ESI. | Annex II: Computation of the Trade Gap through Export Forecasts Autoregressive Integrated Moving Average (ARIMA) model is a class of linear models that utilises historical values to forecast future values. In an autoregression (AR) model, we forecast the variable of interest using a linear combination of past values of that variable. Integrated represents any differencing that must be applied to make the data stationary. Moving average models use past forecast errors rather than past values in a regression-like model to forecast future values. Thus, a typical model is written as: ARIMA (p,d,q) where p: number of lags of the dependent variable (the AR terms), d: number of differences required to make the series stationary, and q: number of lagged terms of the error term (the MA terms). Seasonal Autoregressive Integrated Moving Average (SARIMA or Seasonal ARIMA) is an extension of ARIMA that supports univariate time series data with a seasonal component. Three new parameters to specify the autoregression (AR), differencing (I) and moving average (MA) for the seasonal component of the series, as well as an additional parameter for the period of the seasonality are added. The SARIMA model is written as: SARIMA (p,d,q) (P,D,Q)m Where, m is the seasonal period (e.g., number of observations per year), the number of time steps for a single seasonal period The lowercase notation is used for the trend (non-seasonal) part of the model, while uppercase notation is used for the seasonal parts of the model. In the article, for forecasting merchandise trade based on the pre-pandemic data, a model with monthly frequency is used. The specification of the model is: SARIMA (1,1,1) (0,1,1)12 For forecasting services trade based on the pre-pandemic data, with quarterly frequency, the model is: SARIMA (1,1,1) (0,1,1)4 |
|