by Anupam Prakash, Kaustav K Sarkar, Ishu Thakur and Sapna Goel^ Overall domestic financial resource balance improved and turned marginally positive at 0.3 per cent of GDP in 2020-21, resulting in higher net financial wealth of the economy. Household financial savings spiked from its long-term trend reflecting in an elevated stock of both currency and deposits and increased savings in insurance products. Financial corporations (other than deposit-taking corporations) with excess inflows from households, and in view of reduced demand for bank credit, mostly invested in government securities. Non-financial corporations deleveraged their balance sheets, improving their net financial wealth after years of successive deterioration. Debt securities are primarily subscribed by other financial corporations, and the Reserve Bank – former having a higher share in G-sec, and the latter in foreign securities. Introduction The financial stocks and flow of funds (FSF) of the Indian economy for 2020-21 highlight certain idiosyncratic movements in economic and financial activities reflecting the impact of COVID-19 pandemic – one of the worst health crises that the world has seen in the last century. The Great Lockdown caused by quarantines and social distancing practices imposed across the globe in 2020 led to the worst economic downturn since the Great Depression, and a far worse economic disruption than the Global Financial Crisis (GFC) (Gopinath, 2020). The financial resource balance1 of the Indian economy turned positive in 2020-21 after improving in the preceding year, characterised by a general slowdown in the economy (Prakash et al., 2022). Based on a holistic framework encompassing description of the financial accounts2 of the institutional sectors3 of the economy, along with instrument-wise breakdown, as categorised by the System of National Accounts (SNA), 2008, this edition of the article brings out insights on the Indian economy on a from-whom-to-whom (FWTW) basis. The detailed statements, following every annual compilation cycle in the series, are also being released as a part of India’s G20 Data Gaps Initiative (DGI) commitment. Augmenting the present information on the contraction of gross domestic product (GDP) in 2020-21, the article deliberates in detail the implications of the cataclysmic impact of the pandemic and subsequent measures undertaken to save ‘lives and livelihood’ by both the Reserve Bank of India and the Government of India. The concomitant shifts in real economic operations get reflected on the financial counterparts and lead to associated changes in the interrelationships between sources and uses of financial funds. Every crisis period underscores the need to have reliable data and key information to help policymakers better assess the fragility of the situation and reformulate policies, as succinctly summarised by Borio (2013) – “good information about the system as a whole and the individual institutions within it – that is, we need to see the forest as well as the trees within it”. The DGI, launched in 2009 after the GFC, in its recommendation II.84 highlighted the relevance of flows and balance sheet data of the institutional sectors in assessing vulnerabilities, interconnections, and spillovers. The second phase of the initiative (DGI- 2), which got delayed by six months due to COVID-19, was marked complete in June 20225. Though the recommended data gaps are yet to be fully closed with respect to sectoral accounts, improved availability of statistics helped in better analysing of the risks and interconnectedness in financial and non-financial sectors in times of uncertainty, especially during the pandemic. India as a G20 economy has been reporting the progress towards the compilation and expansion in coverage of its FSF accounts. Making use of the latest data sources for each sector and sub-sector, this edition publishes refined data series with broadened coverage and segregation (Annexure). Remaining article is structured into four sections. Section II illustrates the sectoral and instrument-wise financial structure of the economy. An assessment of the sectoral financial resource balance is presented in Section III. Section IV delves deeper into the financial flows for various institutional sectors, while the last section concludes the article. II. Financial Structure: Sector and Instrument-wise An incipient impact of the pandemic on the institutional financial accounts can be seen through the changes in stocks of financial assets and liabilities. Financial corporations (FCs), the dominant sector in the economy, constituting more than 40 per cent of the total stock of both financial assets and liabilities, saw a near symmetric increase in both during 2020-21, demonstrating their engagement in financial intermediation. The general government (GG) witnessed a substantial rise in liabilities on account of relief provided during the pandemic, raising its share to 17.9 per cent of total liabilities (17.2 per cent in 2019-20). Households, on the contrary, accumulated financial savings, raising their share in total financial assets to 26.5 per cent (25.4 per cent in 2019-20). Moreover, both an increase in liabilities and decrease in financial assets for rest of the world (RoW) in 2020-21 suggest a further tilt towards domestic resources relative to 2019-20 (Chart 1). The preference for financial instruments across institutional sectors has remained stable over the years. As at end-March 2021, currency and deposits, loans and advances and debt securities remained the most preferred instruments in that order, accounting for more than three-fifths of the total assets and liabilities, both for deployment of resources as well as raising funds. FCs raised resources largely in the form of currency and deposits from the households and GG. Debt securities are primarily subscribed by FCs, particularly other financial corporations (OFCs) and the Reserve Bank – former having a higher share in G-sec, while the latter in foreign securities. While RoW invests preferably via equity and investment funds, households prefer insurance, pension and provident funds as their investment avenues after currency and deposits (Chart 2).
III. Financial Resource Balance In the calamitous year of pandemic, overall domestic financial resource balance improved and turned marginally positive at 0.3 per cent of GDP in 2020-21 (Chart 3). With compression in domestic demand, the economy turned into a net lender of funds with a lower dependence on external resources. Despite swelling up of deficit in GG, the surge in financial savings of the households due to lower discretionary spending and increase in precautionary savings during the pandemic, led to an increase in domestic resource surplus, directly as well as indirectly via FCs6. The net resources available for the corporate sector, i.e., FCs and non-financial corporations (NFCs) can be estimated following the national saving and investment identity. The FSF sectoral resource balances can be used to compute the same, and both are found to be synchronous (Box 1). Box 1: Financial Resources for the Corporate Sector – An Approach from FSF Accounts In an open economy, supply of funds comes broadly from two sources, (i) private savings by the households and corporates (S); and (ii) foreign investors’ resources, equivalent to trade deficit [(M-X) where M is imports and X is exports]. The financial resources are generally demanded by two sectors, viz., for corporate sector investment (I), and the government borrowing [(G-T) where G is the government expenditure and T are the taxes collected]. Equating the demand and supply of financial resources, we get national saving and investment identity [Equation (1)]. Supply of Funds = Demand for Funds The above identity helps us determine the relationship between three balances of an economy – external/current account balance, private sector balance and government balance [Equation (2)]. Private Sector Balance = External Balance – Government Balance | Table 1: Financial Resource Balance – Approximation | | (Per cent of GDP at current market prices) | | Items | 2012-13 | 2013-14 | 2014-15 | 2015-16 | 2016-17 | 2017-18 | 2018-19 | 2019-20 | 2020-21 | 2021-22 | | 1. Current Account Balance (X-M) | -4.8 | -1.7 | -1.3 | -1.0 | -0.6 | -1.8 | -2.1 | -0.9 | 0.9 | -1.2 | | 2. Combined Gross Fiscal Deficit (T-G) | -6.9 | -6.7 | -6.7 | -6.9 | -6.9 | -5.8 | -5.8 | -7.2 | -13.3 | -9.7 | | 3. Private Resource Balance (S-I) [1-2] | 2.1 | 5.0 | 5.4 | 5.9 | 6.3 | 4.0 | 3.7 | 6.4 | 14.2 | 8.5 | | 4. Household Financial Savings | 7.4 | 7.4 | 7.1 | 8.1 | 7.4 | 7.6 | 7.9 | 7.7 | 11.5 | 7.6 | | 5. Corporate Resource Balance (3-4) | -5.3 | -2.4 | -1.7 | -2.2 | -1.2 | -3.6 | -4.2 | -1.4 | 2.7 | 0.8 | | Sources: National Statistical Office (NSO); RBI; and RBI staff estimates. | Drawdown by GG (T – G), when subtracted from the balance from RoW (X – M) gives us the private sector balance, available with the households and corporates. Subtracting the household (HH) sector balance from S – I provides resource balance of the corporate sector (Table 1). The resources available for the corporate sector, can also be derived from FSF sectoral resource balances by aggregating the net resource balances of FCs and NFCs (Table 2). The financial resources for corporate sector worked out from the two datasets, i.e., the approximate measure (Table 1), and the detailed FSF sectoral accounts (Table 2), have moved synchronously (Chart B). FSF accounts, albeit being estimated with a lag, provide an additional sectoral disaggregation of the corporate sector resource balance into FCs and NFCs and respective sub-sectors. For the first time in the last decade (during 2020-21), corporate sector also contributed towards financing of the GG deficit apart from the HH. As per FSF compilation, the corporate sector turned a net lender (3.2 per cent of GDP in 2020-21) from being a net borrower of funds [(-) 2.7 per cent of GDP in 2019-20], directionally similar to the trend visible in Table 1. Timely availability of the alternate measure of resource balance as per Table 1, however, gives a forward-looking perspective for the ensuing year as to how the resource availability will shape. Based on the estimate in Table 1, the corporate sector will continue to provide finances for GG in 2021-22 as well, though moderating to 0.8 per cent of GDP from 2.7 per cent of GDP in 2020-21. 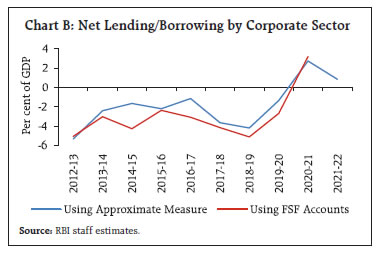
| Table 2: Sectoral Financial Resource Balance from FSF | | (Per cent of GDP at current market prices) | | Sectors | 2012-13 | 2013-14 | 2014-15 | 2015-16 | 2016-17 | 2017-18 | 2018-19 | 2019-20 | 2020-21 | | 1 FCs | 3.1 | 2.2 | 3.6 | 0.6 | 5.6 | 3.9 | 1.7 | 1.9 | 4.5 | | 2 NFCs | -8.1 | -5.2 | -7.9 | -2.9 | -8.7 | -8.1 | -6.8 | -4.6 | -1.3 | | 2.1 PuNFCs | -0.5 | -0.9 | -0.3 | -0.3 | -0.4 | -0.3 | -0.3 | -0.6 | -0.9 | | 2.2 PvNFCs | -7.7 | -4.3 | -7.6 | -2.6 | -8.3 | -7.8 | -6.5 | -4.0 | -0.5 | | 3 GG | -5.3 | -6.4 | -4.5 | -7.7 | -4.2 | -5.0 | -4.7 | -6.3 | -14.3 | | 4 HH | 7.2 | 7.5 | 7.8 | 8.8 | 7.5 | 7.9 | 8.3 | 8.0 | 11.4 | | 5 Domestic Resource Balance (1+2+3+4) | -3.2 | -1.9 | -0.9 | -1.3 | 0.2 | -1.2 | -1.5 | -1.0 | 0.3 | | 6 RoW (External Resources) | 4.7 | 1.7 | 1.4 | 1.1 | 0.7 | 1.8 | 2.1 | 0.8 | -0.9 | | 7 Corporate Resource Balance (1+2) | -5.0 | -3.0 | -4.3 | -2.4 | -3.1 | -4.1 | -5.1 | -2.7 | 3.2 | | Source: RBI staff estimates. |
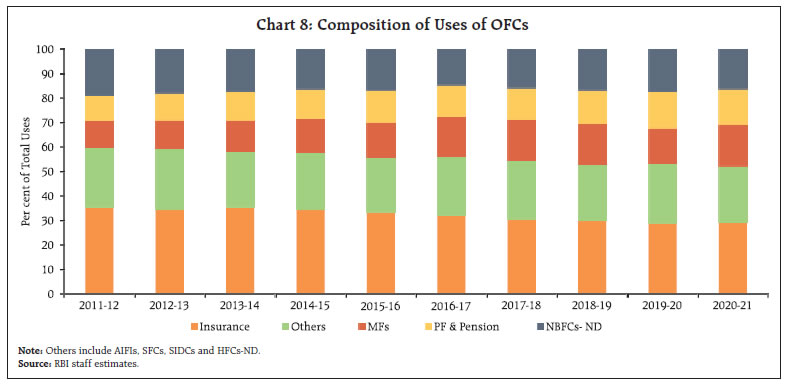
| Table 3: Sectoral Net Financial Wealth | | (Per cent of GDP at current market prices) | | Sectors | 2011-12 | 2012-13 | 2013-14 | 2014-15 | 2015-16 | 2016-17 | 2017-18 | 2018-19 | 2019-20 | 2020-21 | | 1 FCs | 27.8 | 28.4 | 28.3 | 28.9 | 28.1 | 30.2 | 31.7 | 31.4 | 33.5 | 37.8 | | 2 NFCs | -17.1 | -20.7 | -21.5 | -26.8 | -26.1 | -30.2 | -35.1 | -37.6 | -39.5 | -35.3 | | 2.1 PuNFCs | -1.2 | -1.4 | -2.0 | -2.0 | -2.2 | -2.3 | -2.2 | -2.3 | -2.7 | -3.6 | | 2.2 PvNFCs | -15.9 | -19.4 | -19.6 | -24.8 | -23.9 | -28.0 | -32.9 | -35.3 | -36.8 | -31.7 | | 3 GG | -49.6 | -48.9 | -49.6 | -49.2 | -52.2 | -50.9 | -50.9 | -50.7 | -54.0 | -69.0 | | 4 HH | 75.8 | 74.1 | 74.3 | 76.6 | 78.3 | 79.9 | 81.7 | 83.6 | 85.4 | 103.2 | | 5 Total (1+2+3+4) | 36.9 | 32.8 | 31.5 | 29.4 | 28.1 | 28.8 | 27.3 | 26.6 | 25.4 | 36.7 | | 6 RoW | 21.7 | 24.0 | 24.3 | 23.9 | 23.1 | 21.4 | 20.8 | 21.0 | 19.6 | 19.0 | | Source: RBI staff estimates. | | Improved financial health of the domestic economy can also be gauged from a significant rise in its net financial wealth (NFW)7, surging to 36.7 per cent of GDP as at end-March 2021 from 25.4 per cent as at end-March 2020. Deterioration in NFW of GG owing to various welfare measures to combat the pandemic was more than compensated by an increase in NFW of HH and FCs (Table 3). IV. Financial Flows across Sectors Mapping of sectoral financial flows provides a clear picture of the financial relationship between the institutional sectors and also residents and non-residents, describing who finances whom, by what type of instrument, and in what amount. Net flows (uses minus sources) across various sectors of the economy are depicted in a chord diagram (Chart 4). Households continued to remain prominent net lenders in 2020-21. Net flows from HH to OFCs and other depository corporations (ODCs) increased, indicating higher savings with the financial intermediaries, while those to GG and central bank reduced. OFCs with excess inflows from HH, and in view of reduced demand for bank credit in the pandemic year, mostly invested in government securities which got reflected in higher flows from OFCs to GG compared with last year. In view of higher fund requirements of GG, the central bank flows to GG also increased. Public non-financial corporations (PuNFCs) turned net lenders to ODCs from being net borrowers. Net flows from ODCs to central bank and RoW increased. Also, there was a reduction in flows from RoW to PvNFCs compared with last year, on expected lines. 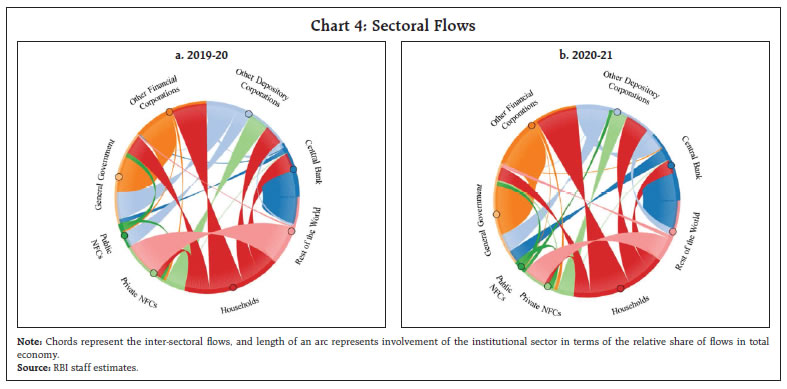 These interconnections and spillovers have been explained in detail in the following sub-sections: IV.1.1 Central Bank In view of a severe contraction in economic activity since the pandemic, the Reserve Bank decisively slashed repo rate and remained accommodative as long as it was necessary to revive growth. This led to an expansion in the Bank’s financial assets to 28.8 per cent of GDP in 2020-21 from 24.6 per cent of GDP in the preceding year8. It is generally observed during crisis times that central banks resort to monetary easing measures (Bagehot’s Dictum)9 – both conventional and unconventional, with a view to attain traditional policy objectives of ensuring price and financial stability, as was observed during the GFC and more recently during COVID-19. When compared with several central banks in advanced economies (AEs) such as Canada, the US and Japan (Chart 5), expansion in the Reserve Bank’s balance sheet was moderate, due to the Bank’s targeted approach supported by innovative monetary policy measures. On the asset side, investment in debt securities – both domestic and foreign, increased to ₹10.42 lakh crore in 2020-21 from ₹2.42 lakh crore in the previous year. Investment in domestic securities surged because of pandemic-driven liquidity management operations conducted during the year. On the other hand, accumulated foreign exchange reserves (FER) were invested in securities instead of deposits, a drift from recent past years. Owing to the refinance facilities extended to the NABARD, SIDBI and NHB, extended line of credit to EXIM Bank to avail a US dollar swap facility, and enhanced collateralised liquidity support to primary dealers, the advances to OFCs posited a growth. Loans and advances to ODCs, however, turned negative reflecting repayment of long-term repo operations (LTRO), targeted LTRO (TLTRO) 1.0 and TLTRO 2.0 by banks during the year.10 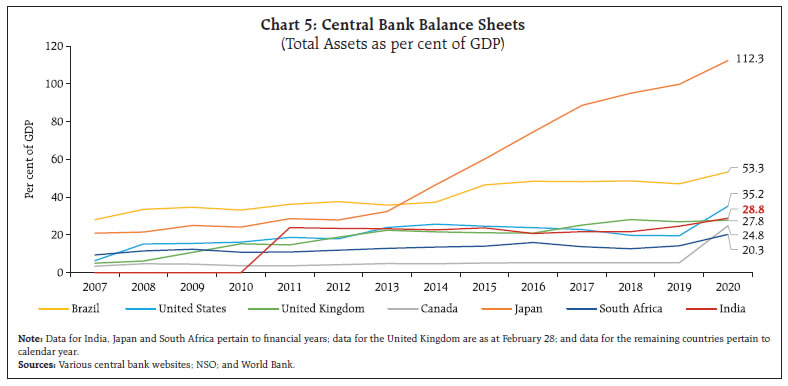 On a similar note, financial liabilities surged to 22.5 per cent of GDP in 2020-21 from 18.2 per cent in 2019-20 mainly due to increase in notes issued and deposits. Flow of currency by the Reserve Bank accelerated remarkably during 2020-21 as households and businesses made a dash for cash with the onset of COVID-19 led abrupt reversal in confidence channels, extreme risk aversion and stopping of income flows (RBI, 2021a). As a result, currency to GDP ratio surged to 14.3 per cent as at end-March 2021 – the highest in a decade, and much above its long-term average of 11 to 12 per cent. A contraction in nominal GDP in 2020- 21 also contributed to escalation in the ratio. In 2020-21, deposits with the Reserve Bank increased to ₹14.5 lakh crore from ₹11.1 lakh crore in 2019-20, primarily on account of phased restoration of cash reserve ratio (CRR) back to 3.5 per cent of net demand and time liabilities (NDTL) at end-March 202111, as compared with CRR requirement of 3.0 per cent of NDTL as at end-March 2020. The Reserve Bank, which continued to be one of the major net lending sectors, witnessed a marginal decline in its NFW to 6.3 per cent of GDP in 2020-21 from 6.4 per cent a year ago. IV.1.2 Other Depository Corporations During the pandemic year, the Indian banking sector navigated the expected deterioration in asset quality of banks in view of the impaired loan servicing capacity among individuals and businesses, cushioned by various policy measures undertaken by the Reserve Bank and the Government (Chart 6). 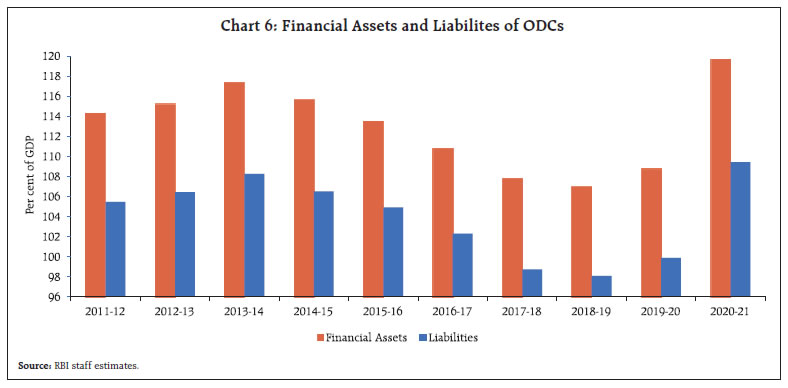 Capital position of banks improved, aided by recapitalisation by the government as well as raising of funds from the market (RBI, 2021b). Sum of NFW and equity – a direct measure of bank capital (OECD, 2017), to total financial assets continued to strengthen in 2020-21 highlighting the increasing ability of ODCs to absorb losses under adverse scenarios (Chart 7a). The two prominent sources of funds for ODCs – deposits and loans and borrowings, act as substitutes. While deposits saw an influx of ₹17.5 lakh crore (growth of 11.1 per cent in 2020-21 over 8.1 per cent in the previous year), loans and borrowings contracted in 2020-21 (contraction of 6.9 per cent in 2020-21 over 5.2 per cent in the previous year) (Chart 7b). In the pandemic year, skyrocketing of households’ saving rate as they cut down on their consumption expenditure, contributed 69.4 per cent to the increase in deposits, while corporates kept their savings in liquid bank deposits amidst the gloomy investment milieu, accounting for 24.3 per cent of the increase in deposits. In contrast, on the asset side, credit offtake remained tepid during 2020-21 as loans to deposit ratio fell to 77.2 per cent in 2020-21 from 81.5 per cent in 2019-20. The reduction in loans was offset by an escalation in debt securities of both central and state governments and deposits with both the Reserve Bank and RoW, as ODCs turned risk averse. IV.1.3 Other Financial Corporations Growth in financial assets and liabilities accelerated in 2020-21 after moderating in the previous year, with growth in liabilities outpacing that in assets. Despite mutual funds (MFs) and provident and pension funds weighing down on the share of insurance sector, insurance continues to dominate in terms of the total financial assets within OFCs over a decade long trend (Chart 8). For insurance sector, 2020-21 was an extraordinary year. Indemnification of the pandemic dues along with digital advancements led to increased penetration of the life insurance12 sector by 13.5 per cent during 2020-21 as compared with 2.8 per cent in 2019-20. Consequently, liabilities of insurance sector rose to 26.3 per cent of GDP in 2020-21, an increase of 21.3 per cent as compared with previous year. Robust equity growth of previous year continued in 2020- 21 as capital of ₹9,950 crore was infused specifically in public sector general and health insurers to improve their overall health (IRDAI, 2021). Growth in premiums during the year, surged financial assets of insurance sector by 21.7 per cent in 2020-21, which were invested in other MFs, equity and debt securities. Consequently, NFW of the insurance sector improved by 30 basis points to 1.4 per cent of GDP in 2020-21. 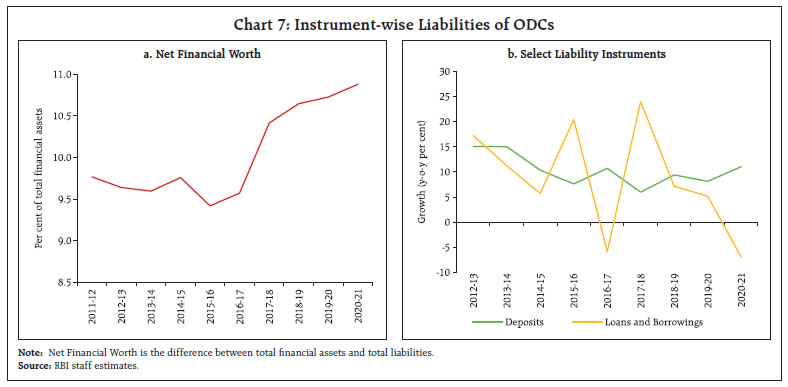
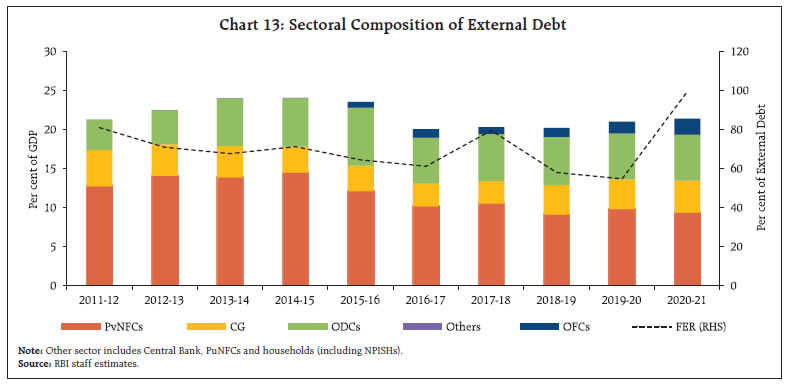
 Amongst the sub-segments gaining traction, the assets under management (AUM) of MFs surged more than five folds in the last decade – to ₹31.4 lakh crore at end-March 2021 from ₹ 5.9 lakh crore at end-March 2012. As a result, share of MFs in total assets of OFCs increased to 17.8 per cent as at end-March 2021 from 11.1 per cent as at end-March 2012. Value of financial assets of MFs, after contracting in 2019-20 because of the pandemic induced stock market crash, recovered during 2020-21 (registering a growth of 41.2 per cent). Despite lower gross mobilisation into MFs, net inflow jumped to ₹2.15 lakh crore (2.5 times of the net inflow during 2019-20) with an almost equal distribution between money market and other MFs. Other expanding sector, the pension and provident funds, remained largely unscathed from the pandemic as it grew by 17.6 per cent in 2020- 21 relative to 17.5 per cent in 2019-20. Government securities remained the preferred investment avenue, reaching 61.3 per cent of the total corpus of debt securities. Both insurance and pension funds invest their respective premiums and contributions in various financial instruments. Half of their financial assets comprise government debt securities, share of which has been increasing over the last few years. While insurance firms have close to 20 per cent holdings in equity and investment fund shares, pension and provident funds tie up a meagre proportion of their funds in equity (Chart 9). IV.2 Non-Financial Corporations NFCs went on a deleveraging spree during the pandemic – to have used lower demand and greater liquidity and fiscal support to strengthen their balance sheets (Gornicka et al., 2021). Consequently, their NFW improved for the first time in 2020-21 after years of successive deterioration. Increase in corporate cash13 holdings explain a part of the recovery in NFW as the corporate cash to GDP ratio surged to 15.6 per cent in 2020-21 from the pre-pandemic average of 13.7 per cent (2011-12 to 2019-20). This can be explained via substantial improvement in liquidity position of the firms because of an increase in corporate profitability, eased credit pressures due to six-month moratorium and risk aversion towards investment14. Owing to pandemic exigencies, borrowings of NFCs, particularly PuNFCs, increased for multiple reasons – to keep operations running as the economy slowed, and for investing in technology to support remote work and reconfigure workplaces to ensure social distancing. Corporate debt15 of NFCs increased to 61.0 per cent of GDP in 2020-21 as compared with 58.3 per cent in the preceding year. Akin to an exercise exploring the corporate cash-to-debt ratio for AEs (Hashimoto et al., 2016), the ratio for Indian corporates increased during 2020-21 essentially due to cash accumulation, reversing a nearly stable trend for PvNFCs and a continuously declining trend for PuNFCs16 (Chart 10). IV.3 General Government Fiscal deficits and debt levels spiked globally in 2020 reflecting a large erosion in revenues and increase in spending to provide stimulus of an unprecedented scale and scope. While gross fiscal deficit (GFD) of the Union Government increased sharply to 9.2 per cent of GDP17 from 4.6 per cent in the previous year, that of state governments rose to 4.1 per cent of GDP from 2.6 per cent in the preceding year (GoI 2022 & RBI 2023). Resultantly, financial resource gap of GG aggravated (Chart 11) and debt levels escalated to 92.2 per cent of GDP in 2020-21 as compared with 77.7 per cent a year ago. For CG, increase in liabilities by a whopping 18.3 per cent in 2020-21 as compared to its pre-pandemic average of 10.7 per cent (2012-13 to 2019-20), translated in an increase in issuance of treasury bills and special securities to ODCs and OFCs. Apart from this, government successfully channelised funds from households via national small savings fund (NSSF), sovereign gold bonds and gold monetisation scheme. The proportion of NSSF pool in outstanding liabilities of CG has been accelerating since 2016-17 (17.3 per cent of total liabilities in 2020-21 as compared to 15.2 per cent in 2016-17). Moreover, NSSF instrument preference18 of the public has altered over the years with share of saving certificates reducing considerably to 13.7 per cent in 2020-21 from 26.5 per cent in 2011- 12, and a commensurate rise in saving deposits. 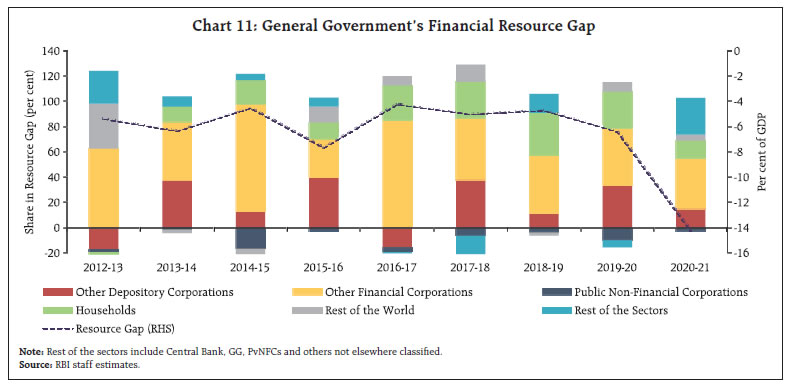 Importance and activities of the Food Corporation of India (FCI)19 increased during the crisis on account of distribution of free foodgrains to the migrants and poor under the Pradhan Mantri Garib Kalyan Anna Yojana (PM-GKAY). Amidst growing risk aversion during COVID-19, FCI raised ₹8,000 crore by private placement of government-backed bonds, subscribed by large banks. Furthermore, to reduce the debt and interest burden, CG sanctioned ₹4,62,737 crore subsidy to FCI in 2020-21 which facilitated on-budgeting of a large part of outstanding loans and repayment of the entire NSSF loan of FCI towards CG. In case of state governments, reliance on debt securities for financing via state development loans, power bonds and Ujwal DISCOM Assurance Yojana (UDAY) bonds has been increasing. In 2020-21, while growth in other instruments slowed, subscription of debt securities posited a growth of 14.1 per cent as compared with 10.8 per cent in the preceding year, taking the share of debt securities to 69.8 per cent of states’ liabilities (68.7 per cent in 2019-20). On assets side, despite deceleration in equity investments, holding of CG in statutory corporations (excluding FCI) and joint stock companies increased during 2020-21. Additionally, ₹1.33 lakh crore and ₹0.70 lakh crore of loans were advanced to state governments and PuNFCs (growth in outstanding loans by 73.4 per cent and 21.2 per cent), respectively. IV.4 Households (including NPISHs) During the pandemic, households’ financial health improved worldwide. Indian households’ NFW surged to 103.2 per cent of GDP in 2020-21 as compared with 85.4 per cent a year ago. In 2020-21, the decelerating growth of financial liabilities of households at 11.4 per cent (12.2 per cent during 2019-20), accompanied by a sharp uptick in growth of financial assets at 16.8 per cent (9.7 per cent during 2019-20), pulled up the NFW. Apart from the surge in savings following the pandemic related restrictions, precautionary motives and government transfers, NFW was also driven upwards, particularly, by the valuation changes due to the booming equity and housing prices.20 Despite slowing growth in loans borrowed from ODCs and OFCs, households’ indebtedness21 increased to 41.0 per cent of GDP in 2020-21 from 36.3 per cent in 2019-20. Corresponding to decomposition of household deleveraging as noted by Bouis (2021), household debt leveraging can occur through rise in actual debt levels, low economic growth or lower inflation. Since 2018-19, increase in debt to GDP ratio of the households has been particularly due to a positive nominal income growth effect on account of contraction in nominal GDP, with a stable net credit effect (Chart 12). Regarding assets, as a natural response to the pandemic induced precariousness and scarcity in the employment opportunities, households held huge buffer of savings in the form of both currency and deposits, as a result of which, currency and deposits soared to 80.5 per cent of GDP in 2020-21 from 69.8 per cent in 2019-20. In addition, accentuated fears regarding health-related uncertainties and death events led to a robust demand for insurance, pension and provident funds, increasing the financial savings of households in insurance by 7.2 percentage points to 42.5 per cent of GDP in 2020-21. IV.5 Rest of the World Amidst the pandemic blues which witnessed foreign portfolio investment (FPI) outflows and reduced levels of dependency on foreign sources for financing, leading to large accretion to FER, growth in both financial assets and liabilities of RoW decelerated in 2020-21. This was also corroborated by a modest surplus in current account balance for 2020-21 (0.9 per cent of GDP), witnessed after 2003-04. With a marginal increase in external debt by 0.4 per cent, the external debt to GDP ratio rose to 21.4 per cent as at end-March 2021 from 21.0 per cent a year ago. The increase was also contributed by valuation loss resulting from the depreciation of US dollar against Indian rupee and major currencies (euro, yen, and SDR) (RBI, 2021a). FER22 to external debt ratio stood at 99.5 per cent as at end-March 2021, showing an increase of 14.2 percentage points over the previous year (Chart 13). 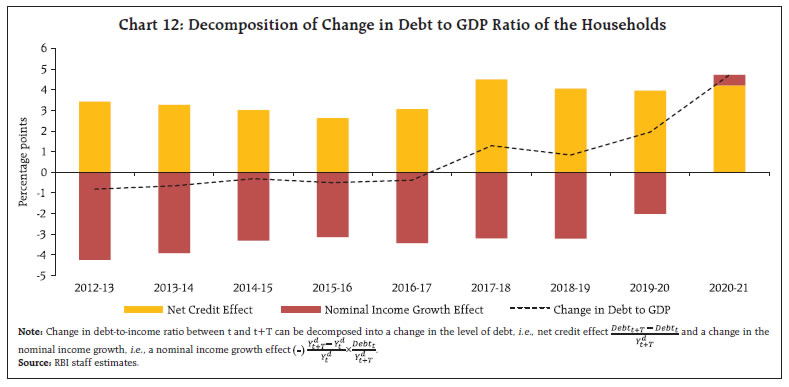
 Despite initial headwinds, Indian equity market made a strong recovery in 2020-21 on the back of decisive monetary and fiscal policy responses, gradual easing of lockdowns, encouraging reports on development of coronavirus vaccine, increased foreign direct investment (FDI) limits in certain sectors and expectations of easing trade wars. Consequently, net FDI into India remained higher during the year despite global FDI flows collapsing and even the FPI flows improved as investors regained their risk-appetite (RBI, 2021a). In addition, a decline in short-term credit requirement by Indian corporates and repayments exceeding fresh credit availed via new agreements led to a net outflow of funds from PvNFCs whereas loans extended to CG by RoW registered an increase during the year. V. Conclusion In 2020-21 as economy came to a standstill, the financial resource balance of the economy turned positive, after improving in the previous year. Households and financial corporations continued to remain major net lenders for deficit sectors. While PuNFCs turned net lenders to ODCs, PvNFCs received lower flows from RoW. The balance sheet of the Reserve Bank swelled with a visible rise in financial assets due to increasing reliance on unconventional measures to ensure appropriate liquidity for smooth functioning of the economy during the pandemic. Depository corporations, mainly banks and non-banks, traversed the pandemic adversities by raising funds via government’s recapitalisation bonds and market-based instruments. Balance sheets of other financial corporations emerged stronger. While insurance sector witnessed an increase in business with premiums flowing from households, AUM of mutual funds amplified in the last decade and pension and provident funds remained largely unaffected from the pandemic ramifications. Non-financial corporations deleveraged their balance sheets in 2020-21 such that their net financial wealth improved after years of successive deterioration. Part of the recovery was because of accumulation of corporate cash on account of improvement in their liquidity position and an increase in corporate profitability. Expansionary fiscal policy on account of providing relief to the poor, migrants and general public (through PM-GKAY, massive vaccine roll out, escalating investments for healthcare infrastructure, etc.) in the backdrop of pandemic escalated the liabilities of both centre and the states, widening the deficit of the general government. There was an increasing reliance on treasury bills and debt securities for servicing their fund requirements. With the effects of the pandemic fading away slowly, Government rolled out a roadmap for durable consumption-boosting and investment-driven recovery. Subsequent fiscal policy, with huge focus on a large capex budget, recovery of consumer sentiments, infrastructural developments and backward and forward linkages would bode well for the recovery of the Indian economy. Pandemic instability and health apprehensions left households with an elevated stock of both currency and deposits and increased savings in insurance products such that household financial savings spiked significantly during 2020-21 from its long-term trend. As economic activities accelerated in 2021-22 and 2022-23, on expected lines, household financial savings began to normalise. Accumulated financial assets (mainly bank deposits, insurance, currency, mutual funds, pension and small savings) during pandemic could provide a buffer for households to dip in order to increase their consumption in subsequent revival period. Pandemic has provided impetus to digital transformation in India fuelling proliferation of digital modes of payment and propelling the country towards ‘less-cash’ alternatives. With a relatively reduced dependence on external financing, particularly by Indian corporates, growth in both financial assets and liabilities of RoW decelerated in 2020-21. With disrupted global supply chains and chip shortages, the trade channels were severely impacted. Subsequently, with essential and timely policy measures, the Indian economy has shown resilience and invoked greater confidence amongst foreign investors which bodes well for ensuing inflow of investments. This, along with the growth drivers mentioned above, such as pick up in discretionary spending and turning around of the investment cycle on the back of digitisation and sustainable and green finance could contribute to faster realisation of the target of turning India into a $5 trillion economy by 2026-27. References Borio, C. (2013). The Great Financial Crisis: Setting Priorities for New Statistics. Journal of Banking Regulation, 14(3-4), 306-317. Bouis, R. (2021). Household Deleveraging and Saving Rates: A Cross-Country Analysis. International Monetary Fund. FSB (2022). G20 Data Gaps Initiative (DGI-2) Progress Achieved, Lessons Learned, and the Way Forward, June 2022. Gopinath, G. (2020, April). The great lockdown: Worst economic downturn since the great depression. IMF blog, 14, 2020. https://www.imf.org/en/Blogs/Articles/2020/04/14/blog-weo-the-great-lockdown-worst-economic-downturn-since-the-great-depression Gornicka, L., Ogawa, M. S., & Xu, M. T. (2021). Corporate Sector Resilience in India in the Wake of the COVID-19 Shock. International Monetary Fund. GoI (2022). Union Budget 2022-2023. Ministry of Finance. Hashimoto, M. Y., & Kinoshita, M. N. (2016). The Financial Wealth of Corporations: A First Look at Sectoral Balance Sheet Data. International Monetary Fund. IRDAI (2021). Annual Report 2020-21. Insurance Regulatory and Development Authority of India. OECD (2017). Understanding Financial Accounts. Edited by Peter van de Ven, P. and D. Fano (eds.), OECD Publishing, Paris, https://doi.org/10.1787/9789264281288-en. Prakash, A., Sarkar, K.K., Thakur, I., Goel, S. (2022). Financial Stocks and Flow of Funds of the Indian Economy 2019-20. RBI Bulletin, May 2022. RBI (2021a). Annual Report 2020-21. Reserve Bank of India. RBI (2021b). Report on Trend and Progress of Banking in India 2020-21. Reserve Bank of India. RBI (2023). State Finances: A Study of Budgets of 2022-23. Reserve Bank of India. Tucker, P. (2009, May). The repertoire of official sector interventions in the financial system: last resort lending, market-making, and capital. In Speech Delivered to the Bank of Japan 2009 International Conference on Financial System and Monetary Policy: Implementation, Bank of Japan, May (pp. 27-28).
Annexure: Improvisations in Methodology and Data Sources Compilation of FSF, which involves a large variety of data sources is subject to certain limitations on account of missing information, measurement errors and incompatibilities. Consequently, statistical discrepancies emerge as a difference between aggregate sources and uses of funds notwithstanding efforts to minimise them. Nonetheless, timely compilation and availability of institutional statistics with instrument-wise details is the most significant prerequisite for minimising discrepancies. In this round of compilation, the major improvements introduced are as follows: -
Data for Port Trusts which are covered within the PuNFCs, have been re-compiled referring to the detailed balance sheets of the respective ports (excluding the Kamarajar Port which is the only corporatised port in India and is registered as a company). -
Insurance sector’s composition has been extended to include standalone health insurers and specialised health insurers (Export Credit Guarantee Corporation of India and Agriculture Insurance Company of India). -
All the computations and representations have been made as a per cent of GDP instead of net national income, as used in the earlier releases, for better international comparison. |
^ The authors are from the Department of Economic and Policy Research, Reserve Bank of India (RBI). Contributions from Kunal Priyadarshi, Chaitali Bhowmick and Amit Kumar are also acknowledged. The views expressed in this article are those of the authors and do not represent the views of the RBI. 1 The financial resource balance is measured by the net acquisition of financial assets less net incurrence of liabilities. 2 Financial accounts comprise financial assets and liabilities which do not include fixed assets, reserves and surplus, risk provisions and deferred tax. 3 The institutional sectors include: (i) financial corporations (FCs); (ii) non-financial corporations (NFCs); (iii) general government (GG); (iv) households (HH) including (v) non-profit institutions serving households (NPISHs). Rest of the world (RoW) is considered as a de facto sector because it only shows transactions of the domestic economy vis-a-vis non-residents and not all the economic activities taking place abroad. 4 Recommendation states – “The G20 economies to compile and disseminate, on a quarterly and annual frequency, sectoral accounts flows and balance sheet data, based on the internationally agreed template, including data for the other (non-bank) financial corporation sector, and develop from-whom to-whom matrices for both transactions and stocks to support balance sheet analysis.” 5 G20 Data Gaps Initiative (DGI-2) Progress Achieved, Lessons Learned, and the Way Forward, June 2022. As per the report, impressive progress has been noted in the reporting of quarterly (14 G20 countries) and annual (16 G20 countries) financial accounts (FSB, 2022). 6 FSF accounts for the Indian economy are currently created on a non-consolidated basis. 7 Net Financial Wealth (NFW) is the difference between total financial assets and total liabilities (excluding equity and investment fund shares). 8 The Expert Committee to review the Extant Economic Capital Framework (ECF) of the Reserve Bank (Chairman: Dr Bimal Jalan), had recommended certain changes in August 2019, including change in the accounting year from ‘July - June’ to ‘April - March’ which got implemented from the year 2020-21. 9 Bagehot’s dictum as summarised by Paul Tucker, a British economist and a central banker – “to avert panic, central banks should lend early and freely (i.e., without limit), to solvent firms, against good collateral, and at high rates” (Tucker, 2009). 10 Banks reversed LTRO funds amounting to ₹1,23,572 crore out of the total of ₹1,25,117 crore and repaid TLTRO and TLTRO 2.0 funds amounting to ₹37,348 crore (RBI, 2021a). 11 CRR was reduced to 3 per cent of the NDTL, effective beginning March 28, 2020 for a period of one year ending March 26, 2021. Gradually in a non-disruptive manner, CRR was restored in two phases, requiring banks to maintain CRR at 3.5 per cent of their NDTL, effective beginning March 27, 2021 followed by 4 per cent of their NDTL, effective beginning May 22, 2021. 12 Insurance penetration is measured as a ratio of premiums received by the life insurance sector to GDP. 13 Corporate cash includes ‘currency and deposits’ and ‘debt securities’ on the asset side reflecting the preference of corporates for holding liquid and safe assets. 14 Share of gross capital formation in GDP – a metric for gauging investment in the economy – fell to 27.9 per cent in 2020-21 from 30.4 per cent in 2019-20. 15 Debt comprises ‘debt securities’ and ‘loans and borrowings’. Since Debt includes intercompany loans within NFC sector, this overestimates the true indebtedness of the sector. 16 Despite variation in the past decade, share of PuNFCs’ financial assets and liabilities in NFCs has been declining. PuNFCs’ financial assets as a proportion of total NFCs’ have reduced from 7.3 per cent in 2011-12 to 6.5 per cent in 2020-21, liabilities on the other hand have reduced from 7.8 to 7.4 per cent during the same period. 17 Despite rolling-out of a massive vaccine programme and other relief measures, CG’s GFD remained modest when compared with average overall deficit of 11.7 per cent for AEs. 18 NSSF fund is raised through three broad instruments – Saving Deposits, Saving Certificates and Public Provident Funds. 19 FCI which is fully owned by the central government and operates on a no-profit and no-loss basis is classified as a part of CG as per SNA 2008. 20 Cian Allen and Cyril Rebillard, The Unequal Covid Saving and Wealth Surge, IMF Blog, 2021. 21 Household debt comprises loans and borrowings (98.7 per cent in 2020-21) and trade credit and advances and other accounts payable (1.3 per cent in 2020-21). 22 FER comprises monetary gold, special drawing rights, reserve position in IMF, and other reserve assets (currency and deposits and securities) as per India’s International Investment Position data release. |