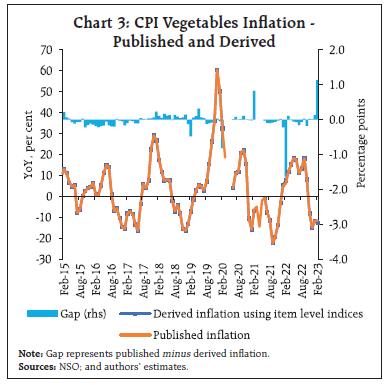
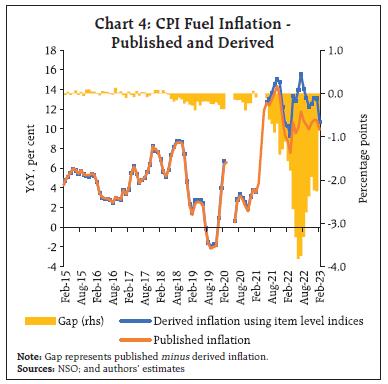
by Praggya Das and Asish Thomas George^ The present method of consumer price index (CPI) compilation in India encompasses aggregation of CPI across sectors (rural/urban) and States/Union Territories (UTs) for item level indices as well as for indices at sub-group/group and all-India level. This method of aggregation at times creates challenges for use of the index for monetary policy since the inflation based on it reflects, in addition to changes in retail prices of goods and services, data kinks that emanate from the aggregation methodology – the January and February 2023 CPI prints are the latest examples. This article discusses about its increasing incidence in the recent period and its quantification. It suggests that an alternate aggregation method in conformity with the international standards, proper treatment of zero prices and timely base revisions can address policy maker’s concerns. I. Introduction Consumer price index (CPI) measures changes in the prices of a representative basket of goods and services that households consume or acquire. CPI forms the basis of a national headline retail price inflation measurement and is one of the most extensively used indicator for public policy. For the central banks, inflation target mandates for the monetary policy are generally defined in terms of CPI and as such high quality CPIs are critical for effective monetary policy making. National statistical offices across globe, including India’s National Statistical Office (NSO), place great importance on the quality and accuracy of national CPIs, as also their international comparability. Following the release of the January 2023 provisional CPI print (on February 13, 2023) by NSO, there was considerable debate on the aggregation methodology followed in CPI as a result of large divergence in the headline CPI inflation published by the NSO over that of a derived overall CPI inflation that users computed from a weighted aggregation of the CPI item level data. The debate continued even after release of the February CPI data on March 13, 2023. In this context, the article attempts to draw light on the aggregation methodology used in CPI and its implications. Section II presents an overview of CPI and its compilation methodology, Section III deals with issues related to construction of CPI elementary indices, Section IV delves on the use of sectoral (rural/ urban) and State/Union Territory (UT)-level and item-level aggregation methodology and its impact on inflation computation. Section V discusses the policy maker’s dilemma for analysing and forecasting inflation. Section VI provides recommendations for reconciling the divergences in future base revisions of CPI and concludes. II. Consumer Price Index – An Overview of the Compilation Methodology Retail price indices in India have a long history, with the consumer price index for industrial workers (CPI-IW) being compiled since October 1946. The Government also compiled consumer price indices for agricultural labourers since September 1964. This was split into separate indices for agricultural labourers (CPI-AL) and rural labourers (CPI-RL) since November 1995. An economy wide gauge of consumer prices came into existence following the recommendations of the National Statistical Commission, 2001 (Chairman: Dr. C. Rangarajan). The all-India CPI series started from January 2011 with base 2010=100. The base was later revised to 2012 and the data for the new base series is available since January 2013.1 Scope of the All-India CPI The all-India CPI series is produced by the NSO2 for three sectors – (i) rural (the series is called CPI-Rural), (ii) urban (CPI-Urban), and (iii) combined (rural + urban, called CPI-combined). The CPI-Combined index is produced separately for all-India and also for all States/UTs. The CPI3 series with base 2012 draws the weights of its basket of items from the NSS (National Sample Survey) 68th Round of Consumer Expenditure Survey (CES), 2011-12. These items are classified in CPI using the international standard COICOP (Classification of Individual Consumption of Items according to Purpose) to ensure international comparability while tailoring in some adjustments to fit appropriately to the Indian context. Construct of the All-India CPI The CPI series uses geometric mean for compilation of elementary indices, the lowest level of aggregation and the lowest level of price indices, constructed primarily for products for which explicit expenditure weights are available within a COICOP class. To compute the elementary indices, NSO uses the ratio of geometric mean of prices, or the Jevons index, the most preferred metric in terms of its statistical properties (Verma, 2016). The details of the construction of elementary indices of CPI are discussed in Section III. The elementary indices are combined to arrive at higher level indices using a Laspeyres index with consumer expenditure of the base year as weights. The Laspeyres formulation (PL) measures current prices weighted by base quantities divided by base prices weighted by base quantities. Typically, a Laspeyres index has the base period b equal to 0 i.e., the reference period itself. As noted in the Practical Guide to Producing Consumer Price Index (PGPCPI) 2009, of United Nations Economic Commissions for Europe, et al., weights are usually derived from an earlier period, i.e., b<0. This is often the case because it may take a year or longer to compile the expenditure weights used in CPI from the consumption expenditure surveys. Thus, the equation used in the CPI is effectively a Young or a Lowe index or as a commonly used nomenclature, a Laspeyres-type index. Most CPIs across globe adopt a Laspeyres-type formulation (PGPCPI, 2009) since for most price indices only base period weights are available. Laspeyres index has the advantage that it is one of the more transparent of the formulae available and is more easily understood by the users. Since CPI is a weighted aggregation of un-weighted elementary indices, the key is the construction of elementary indices. NSO covers 1181 rural and 1114 urban markets to collect prices and these markets are distributed equally across four weeks of a month to capture weekly price variations. The present CPI has a weight reference year of July 2011-June 2012 (reference period of NSS 68th Round) and price reference year (base year) is the calendar year 2012. The provisional CPI indices (sub-groups/groups/ headline) are released for all-India, rural and urban sectors as also for various States/UTs on the 12th of every month4. The all-India combined index at item-level is also released alongside. The index for a month is finalised along with the subsequent month’s data release. III. The Elementary Indices Elementary indices are the basic building blocks of consumer price indices and are aggregated on the base year weights to arrive at monthly indices (equation 2). These weights remain static unless the series is revised to a new base, which is why CPI is called a fixed base index. Since NSO uses Jevons index, in the price relative pti / pbi, both pbi and pti are geometric means of monthly prices collected from differentmarkets for the ith item in the base year b and in the corresponding current period t, respectively. NSO fixes specification of items for which prices are collected after identification of popular markets and selection of shops/outlets for different commodities in these markets. Commodity specifications are defined under structured product description (SPD), which uniquely identifies the product by specifying its various features including brand, variety, unit and quality (CSO, 2014a). Seasonal and Missing Items: Cross Country Practices While computing price relatives, CPI compilers face several challenges – one of which is regarding treatment of seasonal products. Seasonal products are those products that are available during certain seasons and not available during rest of the year, e.g., fresh fruits. The PGPCPI, 2009 and Consumer Price Index Manual: Concepts and Methods, 2020 by the multilateral agencies International Monetary Fund, et al., provide two alternate ways of dealing with seasonal items: the first one is a fixed weight approach that uses the annual weight for the seasonal product in all months using an imputed price in the out-of-season months. While the fixed weight approach is theoretically consistent with a fixed basket CPI, there are issues on choice of imputation method when the prices of the product are not available. The second method, which the PGPCPI suggests is seasonal or variable weight approach where a changing weight is attached to the product in various months. The Harmonised Index of Consumer Prices (HICP) considers seasonal weights method wherein weights for out-of-season seasonal products are zero or set to zero – thus, when an individual product is out of season, its weight is zero and when a product is in season, its weight corresponds to the actually observed quantities (European Union, 2022). Some countries impute price of an item that is out of season and unavailable based on changes observed in the prices of close substitutes or items in the same expenditure class (Australia, 2018 and Canada, 2023). NSO uses the variable weight approach, whereby a zero weight is given to the item in months when it is out of season and product’s original fixed weight is used when in season. However, if a non-seasonal item is temporarily out of stock and no price is reported, NSO uses fixed weight approach and imputes the current month price by multiplying price of the same item in the previous month with average price relative of current month prices to last month prices for rest of markets of the same item where both current and previous month prices are available. The imputation is done within town in case of CPI (Urban) and within State in case of CPI (Rural). Subsidised Prices – The case of Zero Price: Cross Country Practices Other category of products, that require special mention are items covered under government’s social protection services. Products covered under CPI are generally priced items on which final consumption expenditure is incurred by households. Zero price of a product are cases of free social transfers in kind that are usually excluded from the scope of CPIs. The Consumer Price Index Manual: Concepts and Methods, 2020, by the multilateral agencies discusses that “Social transfers cannot be ignored, however, when governments and non-profit institutions decide to introduce (or eliminate) charges for them … increases in their prices to households from zero to some positive amount increase the cost of the basket and should be captured by a CPI … if the price decreases from some positive amount to zero, this also must be reflected in the CPI. The question remains how to deal with the weight for that item. One option may be to use a zero price and adjust the weights during the next update. Another option may be to redistribute the weight to the other items within the class. Finally, it may be decided that the best approach would be to redistribute the weight broadly over all items.” The US Bureau of Labor Statistics (2020) also treats any changes to fees that the government charges for items, such as admission to a national park, as in-scope changes in price for compilation of CPI. If the subsidy is cut and the fare is raised, the CPI will reflect this as a price increase. Unusual price movements are reviewed carefully and checked for validity as per the US CPI, Handbook of Methods. The price index formula cannot handle a price of zero (or free), therefore, a zero price is adjusted to a very small insignificant non-zero price. The services that were previously provided free and become chargeable subsequently, for example introduction of university fees in 1998 in the UK, create two-fold problems. One, there is no weight in the base period (expenditure is zero) and two, there is no base period price with which to compare the new price to create a price relative. To address this, UK Office of National Statistics uses the standard formulation of the Laspeyres index in terms of quantities and price levels, rather than expenditure weights and price relatives. The new product is treated as if it were already included in an existing section (or item) index with zero price but with non-zero quantity equal to its consumption in the base period. The index is then adjusted from the point of introduction of the new price to take on the new expenditure (ONS, 2019). Their manual does not discuss the treatment when an existing non-zero price becomes zero. Australian Bureau of Statistics (ABS) uses equally weighted GM as an elementary index formula. GM produces undesirable results if price of an item falls to zero, for example, as in the case if the government introduces a policy to subsidise fully a particular good or service. Where there is a likelihood of a zero price occurring in the sample and it is inappropriate to use the GM, then the ABS generally uses RAP (relative of average prices) formula, wherein prices are used instead of price relatives. The RAP formula uses the arithmetic mean of prices and not of the price relatives (ABS, 2018). In India, prices of products distributed at discounted rates under government’s public distribution system (PDS), covering wheat, rice, sugar, and kerosene, fall in this category. NSO collects prices of PDS items in respect of three groups of beneficiaries – above poverty line (APL), below poverty line (BPL) and antyodaya anna yojana (AAY) households5 – and price relatives with respect to the base price of respective PDS item are worked out separately for these households. Weighted average of these price relatives is taken to arrive at PDS item index based on number of households having these cards from the data of CES, 2011-12 (CSO, 2014 and 2014a) as weights. While NSO includes PDS items and values them at the subsidised price consumers pay for them, there are no explicit discussions on dealing with zero price in CSO’s manuals on CPI (CSO 2014 and 2014a). The multilateral agencies’ PGPCPI 2009 manual on which NSO’s CPI methodology is broadly drawn also discusses the challenges faced by compilers to measure social security system and mentions that “The social security systems can also cause complications. The CPI compiler is advised to keep in close contact with their policy colleagues to obtain the information which is necessary in order to make informed decisions about which charges should be included in the index and how they should be measured, and also to gain access to relevant sources of data.” IV. Aggregation in CPI Aggregation of price indices in CPI to arrive at headline all-India CPI published by NSO is done in two stages. In the first stage, price indices are calculated for elementary aggregates, which are known as item level indices. These elementary indices are the lowest level of aggregation where prices are combined into price indices and for which explicit expenditure weights are available. In the second stage, these elementary indices are aggregated to obtain higher level indices using consumption expenditure as weights in the Laspeyres index formula (see Section II). By using this vertical aggregation method, sub-group/group/general (or overall) indices for each State/UT are compiled by NSO, separately for rural and urban sectors. These sub-group, group and general indices are aggregated as weighted average, using share of the respective States (and UTs) in the total expenditure of that item to compile all-India sub-group, group and general indices respectively (CSO, 2014). In the case of the all-India item indices, each item index is arrived at by aggregating the items across the sectors and State/UTs using total item expenditure as weight. We call this method of aggregation as horizontal aggregation (i.e., across rural/urban and States/UTs) of price indices. The discourse on geographic and national indices presented in the multilateral agencies’ Consumer Price Index Manual: Concepts and Methods, 2020, and also in the manual’s earlier vintages, mentions that CPIs are often calculated for individual geographic areas within a country and then aggregated to provide a national index based on the price movements in the individual areas. The aggregation approach includes preparation of elementary aggregates that are combined using weights for each item index in the geographic area to derive the all-items CPI for the area. The elementary item indices are then aggregated using their area weights to derive the national item index. The manual says that the same result is obtained if the national item indices are aggregated using the national item weights. The Laspeyres-type index that NSO uses to prepare CPIs has a desirable property of consistency in aggregation. Accordingly, whether the indices are computed horizontally, i.e., across sectors and across States/UTs for items/sub-group/group/overall; or alternately, vertically, i.e., the sub-group/group/overall indices are derived taking weighted average of their constituent item indices, they should lead to the same index number. Thus, no matter in which order the elementary price indices are aggregated (first by geographical stratum and then by product class, or the reverse) the aggregate index results are the same (Statistics Canada, 2023). The above assumes that the basket of products used to calculate the national CPI contains a sufficiently large sample of price and quantity observations belonging to different regions so that the same dataset can be used to calculate the regional and national CPI. In the case of India, NSO methodology and sample size ensures compliance with this requirement. This horizontal and vertical equality can also be algebraically established. Occurrences of Divergence in Price Indices based on Aggregation Methods The present method of horizontal aggregation of CPI, across sectors and States/UTs for all-India item level indices as well as for indices at sub-group/ group and overall, at times creates challenges for use of the index for monetary policy since the inflation based on it reflects, in addition to changes in prices of goods and services, data kinks that emanate from the aggregation methodology. Divergence between price indices compiled by horizontal and vertical aggregation can arise mainly from two sources – missing prices (for seasonal or non-seasonal reasons) and treatment of zero price (as was seen in the January and February 2023 CPI prints). In the absence of missing prices and/or zero prices, whether across items and/or across regions, indices obtained by horizontal aggregation method or the vertical aggregation method will be identical, barring minor issues due to rounding off. In the case of missing prices, NSO follows the internationally accepted procedures. As discussed in Section III, for seasonal products such as fruits/vegetables the weights are imputed using the variable weight approach suggested by PGPCPI as discussed earlier. For other seasonal items, such as clothing, and for non-seasonal items that are temporarily out of stock, prices are imputed using the fixed weight approach. In situations when price becomes zero, such as when the government decides to fully subsidise a particular good or service that was hitherto charged nominal price, there is no explicit mention in the NSO manuals on its treatment. Such cases may be handled by weight imputation or price imputation as discussed in the previous paragraph. However, given that the price has actually been slashed to zero, weight imputation may be preferred. Lastly, zero price itself may be taken exactly as what it is – a zero price – and index could be computed accordingly. The need to discuss the occurrence of missing and zero prices is crucial because in such case overall inflation derived through the vertical aggregation method by users can differ, and at times the divergence could be significant, from not only the published headline CPI inflation, but also for sub-group/group inflation. Impact of the Aggregation Methodology The existence of divergence in CPI index when the items are aggregated vertically from those obtained from horizontal (published) aggregation was discussed in Das and George (2017). It was noted that the method of horizontal aggregation was adopted for constructing CPI but not for WPI (wholesale price index), where the sub-groups/groups/headline indices are arrived by weighted aggregation of lower-level indices, ensuring vertical additivity. A comparison of published CPI headline inflation (using horizontal aggregation of State/UT level data for rural and urban areas) with overall inflation derived using vertical aggregation of item level CPI data, for the period 2015 to 2023 (up to February), shows that, the divergence in inflation has been bidirectional (Chart 1) and on an average (-) 3 basis points (bps), in the range of (-) 27 bps to (+) 25 bps (Annex Table A1).6 The bidirectionality of divergence in inflation rates was visible especially during pre-COVID period. Since 2021, however, the divergence between published and user derived headline inflation has become large (Chart 1). As noted in Section II, one of the major sources for divergence in inflation due to the different aggregation methods could be missing prices. The sub-groups that face recurrent seasonal missing prices are the fruits and vegetables sub-groups. NSO, following the international best practices, in instances of seasonal non-availability of certain fruits/vegetables, imputes their weight among other items in the closest category. Hence, those sub-groups show divergence between published inflation and inflation based on derived indices; however, such divergence is bidirectional and non-systematic (Charts 2 and 3). 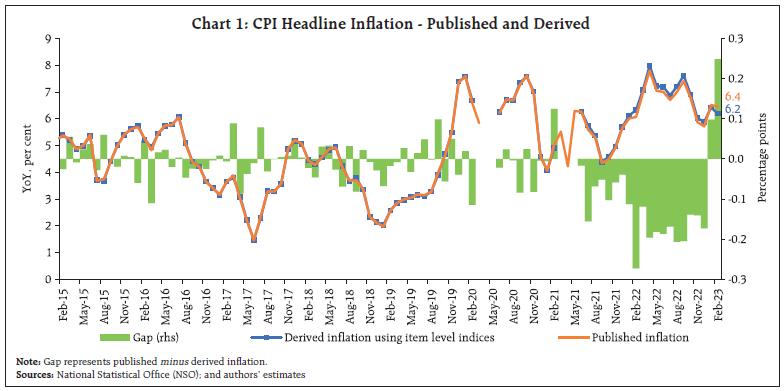 Since June 2021, the fuel group has been a source of large systematic unidirectional divergence between published inflation and derived inflation (Chart 4). In this case, the inflation obtained by vertical aggregation of CPI fuel item indices far exceeded the published fuel group inflation figures. In the absence of the availability of detailed price-quote data, the exact reason for the divergence cannot be identified, but it could have come from the non-availability of price quotes of traditional cooking fuels (such as firewood, coal, cow dung cakes), that over the decade old base-year would have undergone behavioural shifts (the current weights are derived from the consumption expenditure survey of 2011-12), necessitating re-distribution of weights in fuel group in those States/UTs. This is evidenced in the increase in variability of fuel index across States/UTs since 2021 (Chart 5). The coefficient of variation of annual average fuel index across States/UTs also rose from 6.6 per cent in 2013 to 15 per cent during 2020-2021 and to above 19 per cent in 2022-2023. 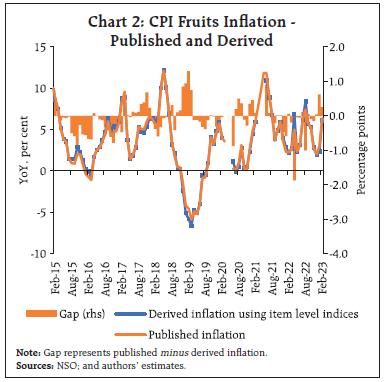
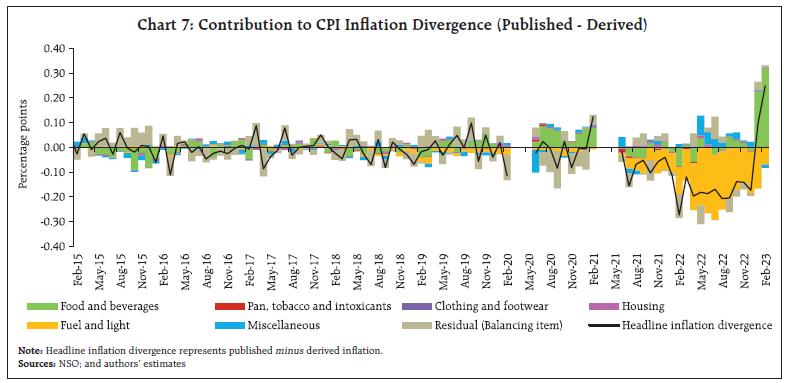
 The substantial divergence observed in the January and February 2023 published CPI headline inflation with that derived by vertical aggregation of item level CPI data was due to a sharp divergence in inflation in the cereals sub-group. Following the extant methodology, when PDS wheat and rice prices were made available for free in certain States/UTs, the weights of such zero priced items were apparently redistributed across the closest category in CPI in those States, implying higher weightage to non-PDS or open market prices. In a scenario of sharp increase in open market wheat and rice prices, cereal inflation is those States/UTs may have got further accentuated. However, the item level indices were compiled by horizontal aggregation across States/UTs with weights for missing PDS prices in one State/UT redistributed to PDS items of other States/UTs, and not between weights of PDS and non-PDS items. As a result, when the States/UTs level overall CPI data were aggregated to arrive at the all-India headline overall index and inflation, it turned out to be substantially higher than what was obtained from a vertical aggregation of CPI item level data (Chart 6). 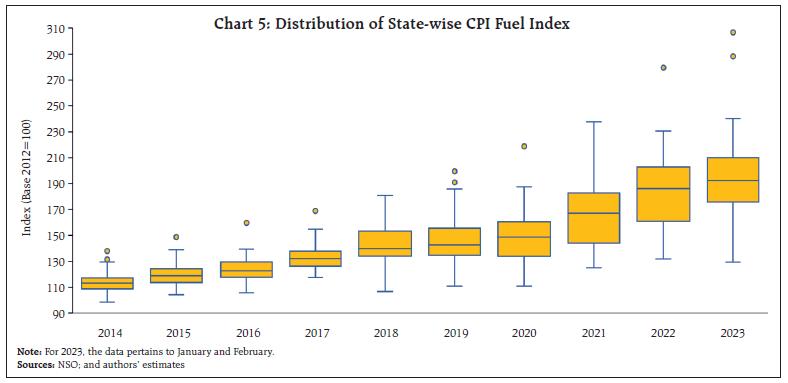 A decomposition of the inflation divergence between published headline CPI inflation and those arrived at by vertical aggregations reveals that such divergences always existed primarily due to missing prices. In the pre-COVID period the divergence was coming from food, fuel and miscellaneous groups. However, it was bi-directional and relatively modest. Since 2021, the divergence has secularly widened, and the published headline inflation was systematically lower than the user derived inflation due to low published fuel group inflation (compared to the derived fuel inflation). In January and February 2023, the divergence in CPI fuel group inflation persisted, but its impact was offset by substantially higher published cereal inflation (compared to the derived cereal inflation), resulting in higher overall published inflation than that derived by vertical aggregation of items (Chart 7). 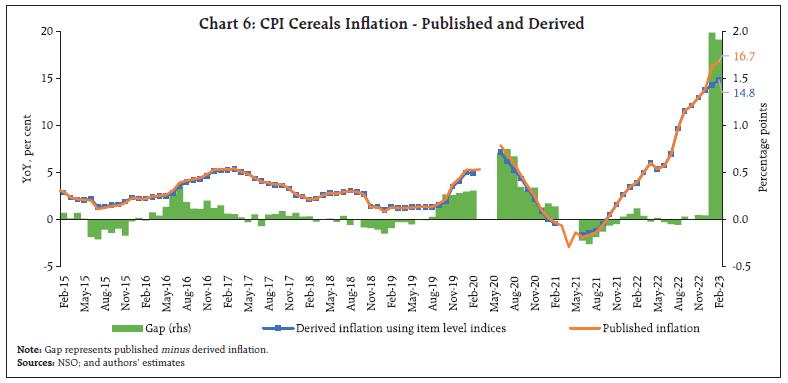
 A t-test of the inflation divergence for the null of zero mean divergence, cannot be rejected for headline CPI inflation for the pre-COVID period of January 2015 to February 2020. However, over the whole period (January 2015 to February 2023) the null hypothesis of zero mean divergence is rejected due to one sided large divergence emanating during the June 2020-February 2023 period, coming from the fuel group (Table 1). Another aspect to highlight is that there is a non-trivial contribution to divergences between published CPI and derived CPI inflation from the term ‘Residual (Balancing Item)’. This component captures the divergence arising from the non-additivity of sub-group/group indices to the overall published index. Due to the methodology of horizontal aggregation of State/UT level indices to arrive at all-India rural, urban indices and headline CPI, vertical aggregation across groups/sub-groups (not CPI item level indices) would also lead to divergences with headline inflation prints. However, in the recent years, the divergences are larger for vertical aggregation of CPI items than those at sub-group/group level.7 Table 1: t-test of CPI Inflation Divergence
(Published minus Derived) | | (Ho: mean inflation divergence = 0) | | CPI-Major Groups | Pre-COVID Period
(Jan-2015 to Feb-2020) | COVID and Post-COVID Period
(Jun-2020 to Feb-2023) | Full Sample Period
(Jan-2015 to Feb-2023) | | CPI-Food | | | | | t | -1.84 | 1.08 | 0.11 | | p-value | 0.07 | 0.29 | 0.91 | | CPI-Pan/Tobacco | | | | | t | 0.90 | -0.81 | -0.29 | | p-value | 0.37 | 0.43 | 0.77 | | CPI-Clothing | | | | | t | 0.00 | 1.40 | 0.89 | | p-value | 1.00 | 0.17 | 0.38 | | CPI-Fuel | | | | | t | -4.28* | -6.17* | -5.12* | | p-value | 0.00 | 0.00 | 0.00 | | CPI-Housing | | | | | t | -0.62 | 1.51 | 0.34 | | p-value | 0.54 | 0.14 | 0.73 | | CPI-Miscellaneous | | | | | t | -0.28 | 1.09 | 0.85 | | p-value | 0.78 | 0.28 | 0.40 | | CPI-Overall | | | | | t | -0.74 | -3.71* | -3.28* | | p-value | 0.46 | 0.00 | 0.00 | *: Denotes rejection of null hypothesis (mean inflation divergence = 0) at 1 per cent level of significance. t denotes the Student’s t statistic.
Source: Authors’ estimates. | V. The Policy Maker’s dilemma When the index is prepared by the national statistical office, why should the user reconstruct it? User derived indices matter since vertical aggregation using a bottom-up approach (from items/sub-groups/groups to overall inflation) is required first, to construct inflation measures that requires vertical aggregated sub-groups/groups/items as in the case of underlying or core inflation measures, and non-additivity oftentimes results in varying inflation rates and directional trends depending on the methodology adopted for construction of such underlying inflation measures. Secondly, it adds uncertainty to inflation forecasts.8 The horizontal versus vertical aggregation issues primarily come to the fore while nowcasting inflation, which follows a highly disaggregated bottom-up approach. CPI for a month is ususally released on the 12th of the following month. However, higher frequency information on prices of select food/fuel items are available on a daily basis, before the official CPI release. Based on these high frequency data, nowcasting involves assigning price momentum to items in CPI, especially food and fuel. These then are vertically aggregated to arrive at the food sub-groups and overall food/fuel inflation. However, considering the way in which CPI is constructed, there are bound to be differences between the headline inflation computed and published, even when at an item level forecasted indices and corresponding published indices largely tally – January and February 2023 CPI print was a recent example. This adds an additional layer of uncertainty to forecasters, especially on how much to account for the impact of missing data, redistribution of weights during shocks like COVID-19 and non-availability of priced items. VI. Recommendations and Conclusion A study of the methods used by NSO for consumer price index shows that it is drawn from the international best practices including its design, product classification, market selection, price collection and data dissemination. However, to arrive at the all-India indices, the present two methods of aggregation of CPI for item level indices on the one hand and indices at sub-group/group and the all-India level on the other, at times makes assessment of prices and it’s forecast a challenge, especially when there is considerable time lag in base revisions. This paper discusses the size of such challenges and its increasing incidence in the recent period. In case the NSO arrives at all-India item level indices through sector and State/UT level aggregation and thereafter proceeds with aggregation of the all-India item indices into higher level aggregates – i.e., the all-India groups with sub-groups and headline indices, the aggregation methodology can be reconciled between published sub-group/group level indices and the users’ item level aggregation. This aggregation method will be in conformity with the international standards for construction of CPI. A similar approach may be adopted to arrive at the all-India sectoral indices. The Technical Advisory Committee on Statistics of Prices and Cost of Living (TAC on SPCL) that guides NSO on preparation of CPI may consider the change in aggregation method so as to make the index more usable for policy analysis. At present there is no guidance on proper treatment of zero prices – such as in the recent period when PDS prices were slashed to zero – in the NSO’s CPI manual. Drawing from international practices, such cases may be considered as zero-prices and not missing prices. Finally, the current CPI base of 2012 is derived from the consumption expenditure survey conducted during 2011-2012. The market survey to identify shops for collecting prices is even older. Efforts to conduct new CES for rebasing CPI to a recent period may be expedited to make the CPI consumption basket relevant of the present household consumption behaviour and prevent instances of missing/thin price quotes. Timely base revision with synchronous CES, price and market survey every five years can address policy maker’s concerns. References: Australian Bureau of Statistics (2018), “Consumer Price Index: Concepts, Sources and Method”. Central Statistics Office (2014), “Report of the Technical Advisory Committee on Statistics of Prices and Cost of Living”, Prices & Cost of Living Unit, National Accounts Division. Central Statistics Office (2014a), “Consumer Price Index: Changes in the Revised Series (Base Year 2012 = 100)”. Das, P. and George, A. T. (2017), “Comparison of Consumer and Wholesale Prices Indices in India: An Analysis of Properties and Sources of Divergence”, RBI Working Paper Series, WPS (DEPR): 05 / 2017. European Union (2022), “Guide on Multilateral Methods in the Harmonised Index of Consumer Prices”. International Monetary Fund, International Labour Organization, Statistical Office of the European Union (Eurostat), United Nations Economic Commission for Europe, Organisation for Economic Co-operation and Development, The World Bank (2020), “Consumer Price Index Manual: Concepts and Methods”. Office for National Statistics (2019), “Consumer Prices Indices Technical Manual”, United Kingdom. Reserve Bank of India (2021), “Monetary Policy Decision Making Process”, Chapter 3, Report on Currency and Finance 2020-21, February. Statistics Canada (2023), “The Canadian Consumer Price Index Reference Paper”, February. United Nations Economic Commission for Europe, International Labour Office, International Monetary Fund, Organisation of Economic Co-operation and Development, Statistics Office of the European Communities, World Bank and Office for National Statistics, United Kingdom (2009), “Practical Guide to Producing Consumer Price Indices”. US Bureau of Labor Statistics (2020), “Consumer Price Index, Handbook of Methods”, Last Modified November 24, 2020. Verma A. (2016), “Formula Does Matter - Finding the Right Prices”, Economic & Political Weekly, Vol. LI No. 16, April 16.
Annex | Table A1: Difference between the Published CPI Headline, Groups and Sub-groups Inflation and Derived Inflation using Vertical Aggregation (of published item level indices): January 2015 to February 2023 | | (Percentage points) | | Item Description | Maximum | Minimum | Average | | Cereals and products | 1.98 | -0.27 | 0.10 | | Meat and fish | 0.16 | -0.13 | 0.00 | | Egg | 0.16 | -0.16 | 0.00 | | Milk and products | 0.12 | -0.10 | 0.00 | | Oils and fats | 0.13 | -0.13 | 0.00 | | Fruits | 1.30 | -1.88 | -0.07 | | Vegetables | 1.13 | -1.63 | -0.03 | | Pulses and products | 0.11 | -0.12 | 0.00 | | Sugar and confectionery | 0.59 | -1.23 | -0.14 | | Spices | 0.11 | -0.09 | 0.00 | | Non-alcoholic beverages | 0.12 | -0.14 | 0.00 | | Prepared meals, snacks, sweets etc. | 0.14 | -0.14 | 0.00 | | Food & beverages | 0.65 | -0.21 | 0.00 | | Pan, tobacco, intoxicants | 0.27 | -0.53 | 0.00 | | Clothing | 0.11 | -0.08 | 0.00 | | Footwear | 0.09 | -0.14 | 0.00 | | Clothing & footwear | 0.08 | -0.09 | 0.00 | | Housing | 0.11 | -0.09 | 0.00 | | Fuel & light | 0.13 | -3.82 | -0.49 | | Household goods/services | 0.57 | -0.70 | 0.01 | | Health | 0.11 | -0.13 | 0.00 | | Transport/communication | 0.36 | -0.46 | 0.00 | | Recreation/amusement | 1.68 | -1.03 | 0.07 | | Education | 0.49 | -0.12 | 0.01 | | Personal care/effects | 0.54 | -0.27 | 0.00 | | Miscellaneous | 0.30 | -0.34 | 0.01 | | All Groups | 0.25 | -0.27 | -0.03 |
| Table A2: Difference between the Published CPI Headline, Groups and Sub-groups Indices and Derived Indices: January 2014 to February 2023 | | Item Description | Maximum | Minimum | Average | | Cereals and products | -0.17 | -4.43 | -0.84 | | Meat and fish | 0.10 | -0.21 | 0.00 | | Egg | 0.00 | -0.20 | 0.00 | | Milk and products | 0.10 | -0.09 | 0.00 | | Oils and fats | 0.11 | -0.10 | 0.00 | | Fruits | 4.05 | -0.33 | 1.15 | | Vegetables | 3.48 | -0.13 | 0.28 | | Pulses and products | 0.11 | -0.10 | -0.01 | | Sugar and confectionery | 1.61 | -0.25 | 0.67 | | Spices | 0.07 | -0.10 | 0.01 | | Non-alcoholic beverages | 0.18 | -0.14 | -0.01 | | Prepared meals, snacks, sweets etc. | 0.21 | -0.13 | 0.00 | | Food & beverages | 0.39 | -0.67 | -0.04 | | Pan, tobacco, intoxicants | 0.39 | -0.55 | -0.02 | | Clothing | 0.08 | -0.13 | -0.02 | | Footwear | 0.11 | -0.10 | 0.00 | | Clothing & footwear | 0.09 | -0.12 | -0.01 | | Housing | 0.07 | -0.10 | -0.01 | | Fuel & light | 7.93 | -0.09 | 1.10 | | Household goods/services | 1.03 | -0.08 | 0.03 | | Health | 0.17 | -0.10 | 0.01 | | Transport/communication | 0.52 | -0.16 | -0.04 | | Recreation/amusement | 1.66 | -1.06 | -0.10 | | Education | 0.75 | -0.10 | 0.00 | | Personal care/effects | 0.84 | -0.18 | -0.03 | | Miscellaneous | 0.40 | -0.15 | -0.02 | | All Groups | 0.51 | -0.11 | 0.05 | | Note: Difference in Index is the absolute difference between the derived index using vertical aggregation and the published index. While deriving the indices, the weights of the item for which index is not available has been adjusted. |
|