Even as global growth is set to slow down or even enter a recession in 2023 as global financial markets wager, India has emerged from the pandemic years stronger than initially thought, with a steady gathering of momentum since the second quarter of the current financial year. On the supply side, agriculture is into a seasonal uptick, industry is emerging out of contraction and services have maintained momentum. Consumer price inflation remains high and core inflation continues to defy the distinct softening of input costs. Introduction This year marks the birth tercentenary of Adam Smith, widely regarded as the father of modern economics. While he is among the most cited in economic conversation, particularly the “invisible hand”, his works are among the least read. Born in 1723 in Scotland, Adam Smith joined Glasgow University at the age of 14. His interests and ideas spanned philosophy, theology, astronomy, law, ethics and the political economy. Adam Smith wrote two books, “The Theory of Moral Sentiments” in 1759 and the celebrated “An Inquiry into the Nature and Causes of the Wealth of Nations” in 1776. To start with a few words from his book – “... wealth does not consist in money or in gold and silver, but in what money purchases”.1 Global financial markets blinked and appear to be backing down from their bet that central banks would begin lowering policy rates later this year. Despite rapid and front-loaded policy rate increases through 2022, the global economy is experiencing a fairly rapid pace of expansion as recent data releases for Advance Economies (AEs) on the labour market, wages and consumer spending suggest, in spite of some sequential slowing. The underlying strength of this expansion is evident in the persistence of elevated inflation. While the strength of the labour market has come as a surprise, it is actually reflecting compositional shifts: leisure, hospitality, retail and healthcare are hiring at levels completely offsetting the jobs shed by tech-heavy companies. This is fuelling wages inflation which has cooled a bit but is still above pre pandemic levels. Hence, central banks are talking tough and seem to be in no mood to let down their guard, with the terminal rate still not sighted. Market-based indicators are starting to mirror the central forecasts of central banks. With equity prices and bond yields having priced in larger possible rate actions than earlier anticipated and the US dollar in retreat, the euphoria of markets that had gotten ahead of themselves has ebbed after the banking sector turmoil in the AEs. They are now bracing up for a completely different scenario – one in which central banks will force the global economy to land. Bank collapses in the US in the first half of March 2023 are rippling through the global financial markets. While the direct impact of this meltdown on economic activity could be limited as it would appear at present, markets are bracing up for tighter financial conditions which could present a trade-off between financial stability concerns and the conduct of disinflationary monetary policy. Fear is creeping back; after remaining tepid for months, the VIX – Wall Street’s fear gauge – surged by 17.7 per cent by March 17 over its level at the end of December 2022. Yield curves are in deep inversion and the future looks darker than it did just a few weeks ago in early February. As market sentiments acquiesce with central bank speak, the rally that had lifted emerging market economies’ (EMEs’) stocks and bonds in the beginning of the year appears to be running out of steam. The J P Morgan Emerging Bond Index has fallen by 3.5 per cent from its level in early February 2023 and the Morgan Stanley Capital International EM stock index has lost 9.6 per cent during 2023 from its peak on January 26, 2023. Although the consensus in projections point to faster growth in the EME world relative to the AEs – 4.0 per cent versus 1.2 per cent, according to the International Monetary Fund (IMF) – they are highly vulnerable to spillovers from tightening policy actions by systemic central banks. Moreover, many of them are wilting under the burden of food and energy insecurity, and debt distress. Yet, EMEs were first off in the battle against inflation and in many of them, it has begun to be brought down, but the beast is not vanquished yet. Risks to financial stability from currency depreciations and debt servicing may divert policy attention away from the elephant in the room. It will be harder for them to get policy right if inflation escapes and rises again. Looking ahead, the deepening geopolitical fault lines appear to be redrawing global value chains and shifting production bases of strategic and high-tech products in such a way that Asia may emerge as the new growth centre for both manufacturing and international trade. Meanwhile, climate change has taken a turn for the worse. According to a report of the International Energy Agency released in March 2023, the world emitted more carbon dioxide (CO2) in 2022 – 36.8 gigatons – than in any other year since records began in 1900. These emissions continue to increase as we rebound from the pandemic with air travel and increased recourse to coal. It is hence no surprise that extreme weather events are intensifying. Climate scientists warn that a year of such emissions growth must be followed by cuts in emissions – not stasis – to slow the dire consequences of global warming. Subsidising renewables, improving energy efficiency, electrification of industry and transportation, renewing carbon sinks in forests and reducing the use of fossils are now imperatives. In this context, the historic High Seas Treaty reached in early March assumes significance. The high seas cover nearly two-thirds of the global ocean – almost half of the Earth’s entire surface. The ocean as a whole takes up 90 per cent of the excess heat and around 25 per cent of the CO2 generated by humanity’s burning of fossil fuels. The Treaty aims to place 30 per cent of the high seas into protected areas by 2030, limiting fishing, deep sea mining and the routing of shipping lanes. By safeguarding and recuperating marine life and the sea beds, the Treaty will contribute in its own way to climate action. The first G20 Finance Ministers and Central Bank Governors (FMCBG) meeting under India’s Presidency, held in Bengaluru during February 24-25, 2023 provided an avenue to reflect the need for global co-ordination in economic policies as well as environmental protection. India’s priorities under the G20 Presidency which, inter alia, include cooperation in key global economic policies, strengthening multilateral development banks (MDBs) and global financial safety net, mitigating debt vulnerabilities, mobilising resources for climate action and Sustainable Development Goals (SDGs) as well as building smarter cities of tomorrow, and addressing risks and opportunities arising from rapid technological advancements in finance industry, were the focus of a fruitful dialogue. Addressing the FMCBG virtually, the Prime Minister of India, Shri Narendra Modi encapsulated the theme of India’s Presidency: ‘Vasudhaiva Kutumbakam: One Earth · One Family · One Future’ as an embodiment of our collective conscience to create an inclusive agenda, restore macrofinancial stability and confidence in multilateralism while supporting the global recovery. He also reminded of the significant challenges that we face collectively in terms of geo-political tensions, supply chain disruptions, persistent inflation, food and energy insecurity, debt distress, and erosion of trust in international financial institutions. In view of the increasing interconnectedness of financial systems across geographies and prominence of - BigTech and FinTech, the FMCBG sought to manage third-party dependencies, cyber risks, and broaden the dialogue to gauge the macrofinancial implications of crypto-assets, and risks to the traditional financial architecture. The group supported a globally coordinated approach to managing these risks. India’s rapid strides on developing a world-class digital payment infrastructure which also fosters financial inclusion was lauded as a model to emulate. The meeting was attended by 72 delegations and over 500 foreign delegates also echoed voices of the Global South represented by the invitees - Senegal, Morocco, Nepal, Oman, Nigeria, Mauritius, Egypt, and Bangladesh. The Indian economy has remained resilient amidst high tides of uncertainty. The second advance estimates (SAE) of national income released by the National Statistical Office (NSO) on February 28, 2023 indicate that the recovery from the pandemic was stronger than earlier believed, led by private consumption and supported by a rebound in government consumption during 2021-22. The pick-up in export growth and a large easing of import growth reduced the drag from net exports. On the supply side, the improvement was more broad-based, led by services and followed by industry. Turning to the current financial year, the positive momentum of real GDP that took hold in Q2 of 2022-23 was maintained in Q3. On the other hand, unfavourable statistical base effects inherent in year-on-year (y-o-y) growth calculations slowed the headline growth rate in Q3. The deceleration in government final consumption expenditure counteracted the upside from the deceleration in imports. Private consumption also lost speed and so did fixed investment, although public spending on infrastructure provided a cushion. On the supply side, agriculture and services offered a silver lining against the backdrop of moderation in industry. The Q3 data carry valuable information content for the rest of the year. Private consumption may edge down further, going by high frequency indicators, including and perhaps mainly due to elevated inflation. Investment must be regenerated from private sources alongside the public sector’s push to consolidate and improve the quality of spending so as to provide the congenial habitat for the private effort. On the supply side, agriculture is into a seasonal uptick and industry is limping out of contraction. Services have maintained momentum. The Q4 data release will nevertheless need to be read with a pinch of salt because unfavourable base effects will be strong. An EME like India typically runs a current account deficit (CAD) so that deficient national saving is supplemented by foreign resources to achieve desired levels of investment. During the pandemic, the gap between investment and saving reversed from a gap of 0.8 per cent of GDP in 2019-20 to a surplus of 1.0 per cent in 2020-21. It has again flipped to a gap of 1.2 per cent in 2021-22. If this is suggesting the beginning of a new trend as indicators for 2022-23 also point, India’s growth prospects are poised to improve. The NSO’s data release of end February also revealed that India’s per capita GDP grew by 14.7 per cent in nominal terms and by 5.9 per cent in real terms in 2022-23. Over the last decade, these growth rates were 9.5 per cent and 4.5 per cent, respectively, making for improvement in livelihoods. In US dollar terms, India’s per capita GDP has crossed US$ 2,450, which represents a stride towards becoming a middle-income economy. According to the NSO’s data release, consumer price inflation for February 2023 remains high. The prices of cereals and milk have been driving up recent inflation prints, although open market sales by the Food Corporation of India (FCI) have tempered the prices of wheat, which may continue into the March reading. The all-important question is: will the rabi harvest survive the heat wave or the untimely rains and hailstorms? On the other hand, core inflation continues to defy the distinct softening of input costs. Over the financial year ahead (2023-24), inflation is expected to range tightly between 5.0 and 5.6 per cent2 if India survives an El Nino event adversely affecting the south west monsoon, given global uncertainties. Set against this backdrop, the remainder of the article is structured into four sections. Section II captures the rapidly evolving developments in the global economy. An assessment of domestic macroeconomic conditions is presented in Section III. Section IV reviews financial conditions in India, while the last Section concludes the article. II. Global Setting Global growth has turned out to be stronger than anticipated in spite of formidable headwinds. The Organization for Economic Cooperation and Development (OECD) in its Interim Economic Outlook report, released on March 17, 2023, revised up the global growth forecast for 2023 to 2.6 per cent from its November 2022 projection of 2.2 per cent, and for 2024 to 2.9 per cent from 2.7 per cent. Along with this, the probability of a ‘hard landing’ has also reduced (Chart 1). Elevated inflation, strong labour markets and hawkish central bank guidance have fuelled market expectations of higher interest rates for longer. The initial response was a hardening of sovereign bond yields, strengthening of the US dollar and shedding of gains by global equity markets in February. Just as markets were pricing in the possibility of further tightening of financial conditions, bouts of volatility have unsettled investor sentiments with the collapse of three banks in the US. There has been a shift in the drivers of global growth in 2022. EMEs, led by India and China, are projected to account for about 80 per cent of global growth in 2023, with India contributing nearly 17 per cent (Chart 2). Our model based nowcast projects a positive global growth momentum of 0.3 per cent in Q1:2023 (Chart 3a and 3b).
Among high frequency indicators, the global composite purchasing managers’ index (PMI) increased to 52.1 in February 2023, reflecting a broad-based pick-up across geographies, and marking the first expansion in six months. This was primarily led by services with the first month of expansion of manufacturing since July 2022 as supply chain constraints eased and economic activity was released from the fetters of pandemic restrictions (Chart 4a). In terms of global manufacturing PMIs, EMEs registered expansion while AEs remained in contraction (Chart 4b). Services, on the other hand, recorded a more broad-based expansion (Chart 4c). India consolidated its position amongst the top perfomers of PMI expansion in both manufacturing and services (Chart 4d).
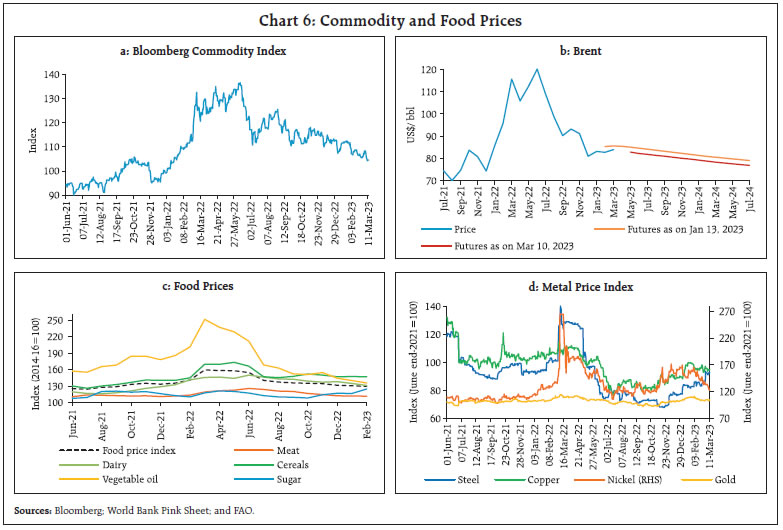
In terms of trade activity, the Baltic Dry Index – a measure of shipping charges for dry bulk commodities – shot up by 45 per cent in February, and rose further in early March, on the back of an increase in demand for capesize ships (Chart 5a). This points to a possible rebound in world trade that had contracted in December 2022 by 3.0 per cent (y-o-y) due to a steep negative momentum and an unfavourable base effect (Chart 5b). Global commodity prices traded with a softening bias in February and early March as expectations of prolonged tightening of monetary policy in AEs dampened the demand outlook (Chart 6a). Crude oil ruled at an average price of US$ 82.7 per barrel in February on demand concerns (Chart 6b). The outlook remains highly uncertain, given the tight demand supply balance. According to the International Energy Agency (IEA), global oil demand is set to rise by 2 million barrels per day (mb/d) in 2023, with most of it likely to originate from the Asia Pacific region. Global output, however, is expected to grow by only 1.2 mb/d in 2023. The food price index3 of the Food and Agricultural Organization (FAO) declined marginally in February as significant drops in the prices of vegetable oils and dairy products more than offset the steep rise in sugar prices (Chart 6c). Fear of lower production in a few countries, including India, propelled sugar prices to a six-year high in February. Metal prices, except for steel, softened due to demand concerns resurfacing (Chart 6d). Gold prices remained volatile in the wake of the strengthening US dollar, increased rate hike expectations and market panic triggered by a few bank collapses in the US. 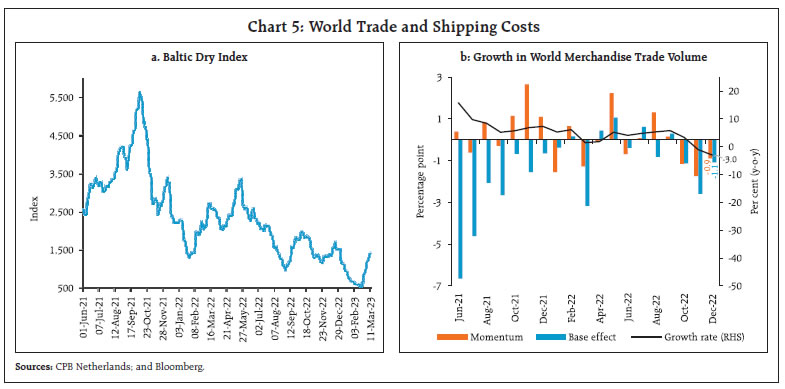
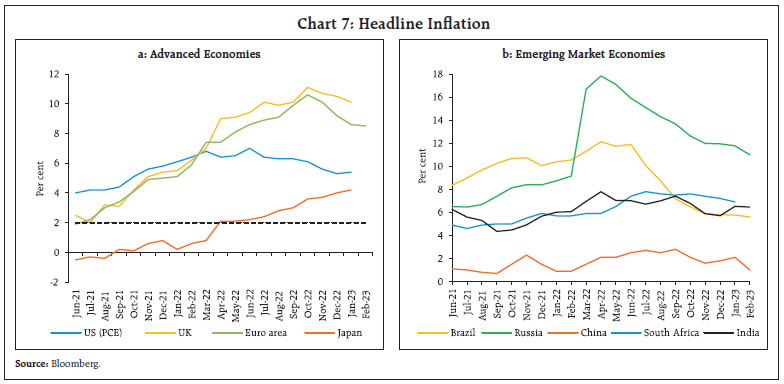 Headline inflation eased across most AEs and EMEs; nonetheless, it remains elevated and well above targets in most economies. In the US, headline CPI inflation moderated to 6.0 per cent in February 2023 from 6.4 per cent a month ago in line with market expectations. Inflation based on the personal consumption expenditure (PCE) price index rose slightly to 5.4 per cent in January 2023 (Chart 7a). In the Euro Area and in the UK, inflation moderated to 8.5 per cent and 10.1 per cent in February and January 2023, respectively. In Japan, CPI (all items less fresh food) inflation rose to 4.2 per cent in January 2023, the highest in four decades. Elevated core inflation remains a major concern in most economies. Among the EMEs, inflation moderated in Brazil, Russia, Thailand and China during February 2023 (Chart 7b). Global equity markets ended weaker in February, pricing in an increased possibility of further rate hikes. Equities shed gains to the tune of 3 per cent (m-o-m) in February mainly driven by EME stocks ending the month 6.5 per cent lower than the previous month while AE stock prices fell by 2.5 per cent (Chart 8a). The decline has continued into March so far (up to March 15) with markets shedding more than 2 per cent, led by the AEs in the wake of turmoil in the US banking sector. During February 2023, the 10-year G-sec yields hardened across major AEs, with higher rate increase expectations following the release of strong US data on retail sales and non-farm payrolls. The 10-year US treasury yield rose by 41 bps in February while the 2-year G-sec yield shot up by 61 bps, increasing the magnitude of yield curve inversion (Chart 8b). This has reversed in March as investors shifted towards safer assets amidst financial turbulence, causing a sharp fall in yields for both short and long-term maturities. The US dollar rallied again, gaining 2.7 per cent during February (Chart 8c). Concomitantly, the MSCI currency index for EMEs shed 2.2 per cent in February on the back of capital outflows (Chart 8d). By early March, however, the US dollar weakened in the aftermath of the failure of two banks in the US. Central banks of most AEs and EMEs slowed the pace of tightening while a few have paused. The US Federal Reserve raised its benchmark interest rate by 25 bps in February whereas other central banks, including in the UK, Euro area, New Zealand and Israel, increased their policy rates by 50 bps each. The Euro area and Australia increased its key rates by 50 bps and 25 bps, respectively, in March while South Korea and Canada halted their rate hikes in February and March, respectively (Chart 9a). Japan, however, continued to diverge by maintaining an accommodative stance. Most EME central banks have paused, including Peru, Brazil, Chile, and Malaysia (Chart 9b). In contrast, China continued with monetary accommodation and Turkey cut its policy rate by 50 bps in February to support its economy battered by the catastrophic earthquake.
III. Domestic Developments The Indian economy is exhibiting resilience in an international environment shrouded with uncertainty. Growth impulses are getting further strengthened by easing of supply chain pressures and a rebound in services activity. Our index of supply chain pressure for India (ISPI) remained below its historical average, indicating sustained easing of pressures (Chart 10). The economic activity index, which tracks the movements of a set of 27 high frequency indicators, showed that overall economic activity remained resilient despite some moderation in momentum during January 2023 (Chart 11a). Our nowcast of real GDP growth for Q4:2022-23 is placed at 5.3 per cent (Chart 11b).
Aggregate Demand The SAE of national income, released on February 28, 2023 by the NSO, placed the real GDP growth at 7.0 per cent for 2022-23 – the same as in the first advance estimates (FAE). During Q3:2022-23, the Indian economy grew at 4.4 per cent (Chart 12). While private final consumption expenditure (PFCE) decelerated, gross fixed capital formation (GFCF) recorded a growth of 8.3 per cent, drawing strength from the Government’s thrust on infrastructure. The contraction in government final consumption expenditure (GFCE) eased in Q3:2022-23 in relation to the previous quarter, continuing to reflect the effects of fiscal consolidation. The contribution of net exports to overall GDP growth was marginally negative as export growth surpassed that of imports. Both exports and imports registered double-digit growth in Q3:2022-23. Turning to more recent developments, lead indicators point towards sustained momentum in economic activity. E-way bill volumes and toll collections remained high even as calendar year effects were visible - February being the shortest month. Electricity generation recorded strong growth in February 2023 as peak demand increased due to a rise in the mean temperature (Chart 13). Daily average consumption of fuel soared to its highest level in February 2023 (since the inception of the series in April 1998), with increased demand from industry and transport sectors (Chart 14a). Retail sales increased on a y-o-y basis, but the pace moderated sequentially, although for the calendar month of February, the sales was highest since 2019 (Chart 14b and 14c). Two-wheeler sales went up by 8.8 per cent, with the electric vehicle (EV) segment maintaining the volumes recorded in the preceding two months. Better crop prices aided double digit tractor sales growth for the third consecutive month. Sales of motorcycle sales and three wheelers also picked up, with government schemes, subsidies and aggressive financing boosting sales (Chart 14d).
The share of EV sales in total vehicle retail sales rapidly increased to 6.0 per cent in February 2023 from 1.2 per cent in February 2021, with the sold units crossing the one million mark in Apr-Feb 2022-23 (Chart 15). EV penetration (i.e., EV retail sales as a percentage of total vehicle retail sales) is the highest for the three wheeler segment, followed by two wheelers. The Union Budget 2023-24 has increased the outlay under the FAME scheme (Faster Adoption and Manufacturing of Hybrid and Electric Vehicles scheme) by 78 per cent to ₹5,172 crores. In the tourism sector, average room rates4 recorded a robust year-on-year (y-o-y) growth which led to an increase in revenue per available room5 (RevPAR) [Chart 16a]. The hotel occupancy rate, however, is yet to recover to its pre-pandemic levels (Chart 16b). Demand for fast moving consumer goods (FMCG) goods increased in February as stores built up stocks to capitalise on summer demand. According to retail intelligence platform Bizom, signs of improvement are visible in rural demand, with expectations of a bumper wheat crop and higher grain prices. As per the Centre for Monitoring Indian Economy (CMIE), the all India unemployment rate was at 7.5 per cent in February 2023 as against 7.1 per cent a month ago (Chart 17a). It edged down in urban areas while in rural areas, it rose marginally due to seasonal factors. The employment rate (ER) and the labour force participation rate (LFPR) remained largely unchanged (Chart 17b).
Hiring in the organised sector improved sequentially for both manufacturing and services in February 2023 as reflected in the PMI employment sub-indices (Chart 18). India’s merchandise exports at US$ 33.9 billion in February 2023 contracted y-o-y by 8.8 per cent and sequentially by 5.1 per cent, reflecting weakening global demand (Chart 19).6 Total merchandise exports during 2022-23 (April-February) at US$ 405.9 billion were 7.6 per cent higher than in the corresponding period of the previous year and close to the annual target of US$ 450 billion.
Non-oil exports, which account for 80 per cent of total exports, contracted by 4.3 per cent y-o-y in February 2023, weighed down by engineering goods, cotton yarn and fabrics, and chemicals (Chart 20).
Exports of petroleum products at US$ 4.9 billion in February 2023 declined by 28.8 per cent y-o-y and registered a sharper sequential decline of 36.0 per cent. The fall in exports was driven by diesel shipments (accounting for nearly half of total exports of petroleum products) due to waning European demand (Chart 21). Easing commodity prices were reflected in the value of merchandise imports reaching an 18-month low of US$ 51.3 billion in February 2023. They declined by 8.2 per cent y-o-y and by 1.4 per cent sequentially (Chart 22). Gold, fertilisers, electronic goods, and petroleum, oil and lubricants (POL) were the main items that dragged imports down, while transport equipment, iron and steel, and coal, coke and briquettes were the commodities that contributed positively to import growth (Chart 23). With Electric Vehicles (EVs) gaining traction in the Indian market, imports of lithium and lithium-ion at US$ 2.3 billion during 2022-23 (up to January), grew by 56 per cent y-o-y (Chart 24). The recent discovery of 5.9 million tonnes of lithium reserves in Jammu and Kashmir will make India the seventh largest producer in the world, with a 5.8 per cent share in global reserves. This will help India in reducing its import dependence in this crucial mineral. The merchandise trade deficit increased to US$ 17.4 billion in February 2023 from a 17-month low of US$ 16.3 billion in January 2023 as exports witnessed a larger sequential contraction in comparison with imports. As per the latest data from the Controller General of Accounts (CGA), during April – January 2022-23, the gross fiscal deficit (GFD) of the central government stood at 67.8 per cent of the revised estimates (RE), higher than in the corresponding period of the previous year (58.9 per cent) as expenditure growth outpaced revenue. In terms of composition of expenditure, capital expenditure grew by 29 per cent (y-o-y) during this period on account of the thrust on capital spending by the Union Government (Chart 25a). Revenue expenditure, on the other hand, grew modestly by 9.7 per cent (y-o-y), leading to a marked improvement in the quality of spending during the period (Chart 25b). On March 13, 2023, the Government presented the second and last batch of Supplementary Demand for Grants for 2022-23 which proposed a net cash outgo of ₹1.48 lakh crore. On the receipts side, gross tax revenue grew by 12.6 per cent (y-o-y), driven by an increase in collections under all major tax heads except excise duty (which is attributed to the cut in excise duty on petrol and diesel in May 2022). Direct and indirect taxes grew by 16.5 per cent and 8.6 per cent (y-o-y), respectively (Chart 26).
The Goods and Services Tax (GST) collections (Centre plus States) in February 2023 at ₹1.49 lakh crore grew by 12.4 per cent (y-o-y) [Chart 27]. Aggregate Supply During 2022-23, aggregate supply as measured by the gross value added (GVA) at basic prices grew by 6.6 per cent as per the SAE (marginally lower than 6.7 per cent in the FAE). Overall GVA growth was driven by services and agriculture sectors, while the industrial sector decelerated amidst intensification of input cost pressures (Chart 28).
As on March 03, 2023 the total summer crop7 sown area stood at 28.3 lakh hectares, 1.8 per cent higher than a year ago. Planting is expected to gain momentum in the coming weeks, aided by ample soil moisture levels. The rabi sowing position for tomato, onion, and potato crops is likely to achieve the target (Chart 29). The overall procurement of rice during the ongoing kharif marketing season (KMS) 2022-23 was marginally lower at 48.0 million tonnes (as on March 09, 2023) as compared with 49.0 million tonnes a year ago. Mandi arrivals of paddy in KMS 2022-23, however, stood higher at 32.94 million tonnes (as on March 09, 2023), surpassing last year’s level by 37.0 per cent. The stock of rice with the Food Corporation of India (FCI) was 6.0 times the quarterly buffer norms for January-March. Although the wheat stocks are currently below the prescribed buffer norms, they are being further replenished by fresh procurements during the rabi season. Following the announcement of OMSS (D) on January 25, 2023, the daily mandi arrivals of wheat increased while prices moderated (Chart 30). The additional offtake under OMSS (D), along with the recently reduced reserve price of wheat, are expected to moderate inflationary pressures.8 In continuation with the previous announcement of offloading 3 million tonnes of wheat under Open Market Sale Scheme (Domestic) [OMSS (D)], the Government decided to offload an additional quantity of 2 million tonnes by open market sales through e-auctions to flour mills/private traders/bulk buyers/ manufactures on February 21, 2023. So far (up to March 15, 2023), the FCI has conducted six e-auctions with a cumulative total of 3.38 million tonnes of wheat sold (against the overall allocation of 4.5 million tonnes). 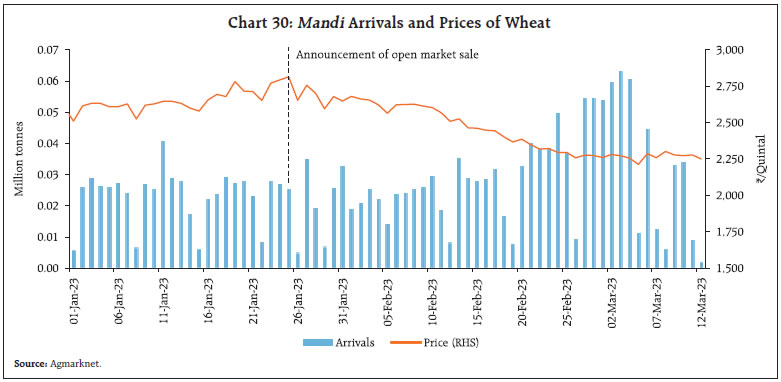 In 2023, India experienced its hottest February on record which raised concerns over rabi crop prospects, especially for wheat. The latest crop assessment report by the Department of Agriculture and Farmers’ Welfare (DA&FW) indicates that crop conditions are normal in all the major wheat growing states, as more than 50 per cent of the current wheat sown area is comprised of terminal heat stress-tolerant varieties. The Indian Meteorological Department (IMD) has, however, highlighted the enhanced probability of occurrence of heatwaves in the central and northwest regions of India for the current summer season (March-May) [Chart 31]. The headline PMI for manufacturing and services, at 55.3 and 59.4, respectively, remained strongly in expansionary mode during February 2023 (Chart 32a and 32b). Domestic business growth fuelled the expansion in the manufacturing sector with robust growth in output and new orders. Output in the service sector expanded at the strongest rate in 12 years, aided by a moderation in cost pressures and favourable demand conditions.
In the services sector, transport indicators recorded a mixed picture in February 2023. Cargo traffic at major ports recorded double digit growth, aided by growth in carriage of thermal coal and iron ore as well as a low base last year (Chart 33a). Railway freight earnings, however, recorded a slight moderation (Chart 33b).
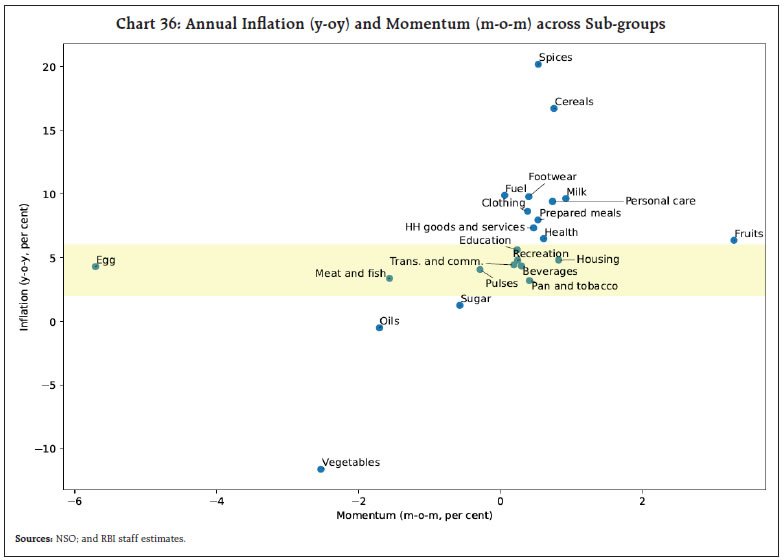
In the construction sector, activity remained robust with cement production and steel consumption sustaining growth (Chart 34). High frequency indicators in the service sector exhibited strong y-o-y growth, partly on account of a low base (Table 1). Data for March 2023 so far (up to March 8), point to a mixed outlook for the aviation sector. While passenger footfalls improved, domestic cargo shipments remained weak during the month. In terms of regional policy initiatives, Tamil Nadu unveiled a new EV policy to promote the growth of a strong EV ecosystem. Karnataka proposed to set up a state-of-the-art start-up park and to establish new industrial clusters through the Karnataka State Small Industries Development Corporation (KSSIDC). Odisha reduced the VAT on sale of aviation turbine fuel (ATF) to give a boost to regional connectivity. West Bengal has announced a ‘Bhavishyat Credit Card’ scheme to provide financial assistance for setting up micro-enterprises targeting more than two lakh youths. Inflation Headline inflation, as measured by y-o-y changes in all India Consumer Price Index (CPI)9, moderated to 6.44 per cent in February 2023 from 6.52 per cent in January (Chart 35a). The moderation in headline inflation by 8 bps between January and February was driven by a favourable base effect of 24 bps, which more than offset the positive momentum of 17 bps. During the month, prices increased month-on-month (m-o-m) by 41 bps in the core category and by 5 bps in the fuel group, whereas food and beverages group recorded a negative momentum of 6 bps. The marginal easing of headline inflation, however, was driven by moderation in y-o-y inflation within fuel, and core (excluding food and fuel) categories (Chart 35b). Food inflation (y-o-y) was marginally higher at 6.3 per cent in February over 6.2 per cent a month ago. Within the food group, prices rose by 16.7 per cent (the highest since June 2013) in cereals. Milk, fruits, sugar, non-alcoholic beverages and prepared meals were the other major sub-groups that recorded higher inflation. On the other hand, annual rate of price increases softened in respect of eggs (which recorded a negative momentum of 5.7 per cent), meat and fish, pulses and spices categories. Negative momentum drove prices of edible oils into deflation (Chart 36). The vegetables sub-group registered a marginally lower deflation in February. 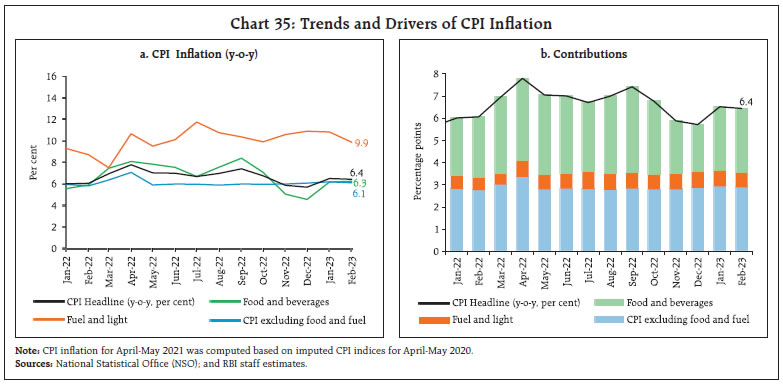
 Inflation in the fuel and light group declined to 9.9 per cent in February from 10.8 per cent in January, mainly owing to a softening in inflation in respect of kerosene and firewood and chips. CPI core inflation softened to 6.1 per cent in February from 6.2 per cent in January. Inflation in sub-groups such as recreation and amusement, clothing and footwear, education, and personal care and effects moderated, while higher inflation was seen in pan, tobacco and intoxicants, housing, household goods and services, and health groups (Chart 37). Along with a moderation in overall inflation, the wedge between rural and urban inflation narrowed to 62 bps in February 2023 from 85 bps a month ago, even though rural inflation at 6.72 per cent remained higher than urban inflation. Among sub-groups, spices, cereals, meat and fish and clothing were dearer in rural belts. Fuel and light, pulses and milk and products registered higher inflation in urban centres (Chart 38). Among States, Andhra Pradesh and Telangana experienced higher inflation (excess of 8 per cent) whereas Chhattisgarh, Delhi, Goa, Himachal Pradesh and Manipur recorded lower inflation (below 4 per cent) [Chart 39]. High frequency food price data for March so far (March 1-14) point to decline in prices of cereals (mainly wheat and atta), cereals and key vegetables. Barring masur (red lentils), pulses registered an uptick in prices (Chart 40).
Retail selling prices of petrol and diesel in the four major metros remained steady in March so far. While kerosene prices declined after an increase in the previous month, LPG prices increased in March (Table 2). | Table 2: Petroleum Products Prices | | Item | Unit | Domestic Prices | Month-over-month (per cent) | | Mar-22 | Feb-23 | Mar-23^ | Feb-23 | Mar-23^ | | Petrol | ₹/litre | 109.98 | 102.92 | 102.92 | 0.0 | 0.0 | | Diesel | ₹/litre | 91.62 | 92.72 | 92.72 | 0.0 | 0.0 | | Kerosene (subsidised) | ₹/litre | 46.87 | 55.79 | 54.21 | 4.0 | -2.8 | | LPG (non-subsidised) | ₹/cylinder | 926.25 | 1063.25 | 1113.25 | 0.0 | 4.7 | ^: For the period March 1-14, 2023.
Note: 1. Other than kerosene, prices represent the average Indian Oil Corporation Limited (IOCL) prices in four major metros (Delhi, Kolkata, Mumbai and Chennai).
2. For kerosene, prices denote the average of the subsidised prices in Kolkata, Mumbai and Chennai.
Sources: IOCL; Petroleum Planning and Analysis Cell (PPAC); and RBI staff estimates. |
Input cost inflation, as reflected in the wholesale price index (WPI), indicate significant moderation during the second half of 2022-23. The decline in input cost pressures has been greater for the industrial sector than for the farm sector (Chart 41). According to the PMI data, the rate of expansion in selling prices moderated in both manufacturing and services sector. Input costs for manufacturing sector, however, picked up pace sequentially (Chart 42a and 42b). IV. Financial Conditions Developments in liquidity conditions during the second half of February 2023 through March 15 were driven by movements in government spending. The banking system largely remained in deficit mode amidst outflows due to GST collections in the second half of February 2023. Liquidity conditions eased, thereafter, because of the usual government spending at the end of February and in the beginning of March. Overall, average daily absorptions under the liquidity adjustment facility (LAF) amounted to ₹1.5 lakh crore during February 16 through March 15, 2023 the bulk of which was absorbed under the standing deposit facility (SDF) [Chart 43]. The amount parked under the fortnightly variable rate reverse repo (VRRR) auction was lower at ₹0.13 lakh crore for the fortnight beginning February 24, 2023 as compared with ₹0.35 lakh crore in the previous auction. The Reserve Bank conducted another fortnightly variable rate repo (VRR) auction on March 10 injecting ₹0.8 lakh crore at a weighted average cut off rate of 6.53 per cent. 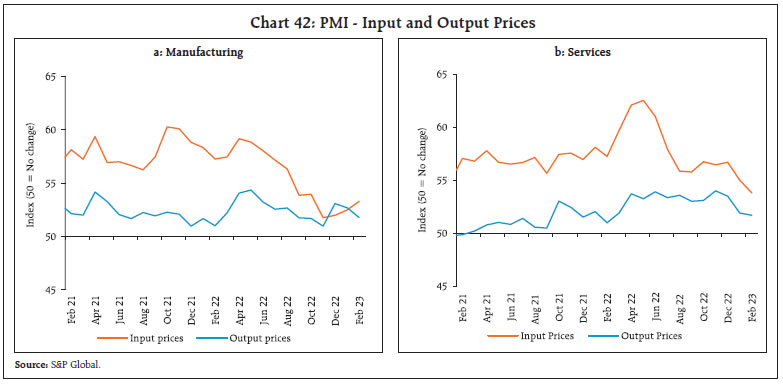
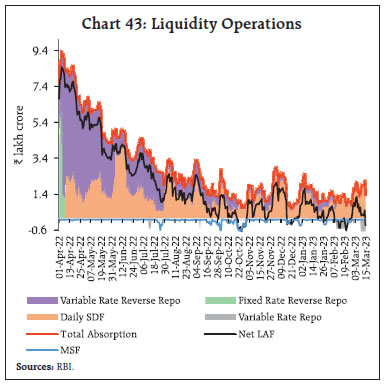 On a net basis (adjusted for injections through repo and MSF), average absorption was placed at ₹0.27 lakh crore during February 16 through March 15, 2023. The expected liquidity tightness in March due to (i) currency leakage; (ii) the scheduled maturity of long-term repo operations (LTROs) and targeted long-term repo operations (TLTROs); and (iii) the usual year-end demand for funds is likely to be partially offset by an increase in government spending. The conduct of 14-day VRR auction reinforces the RBI’s commitment to remain flexible and open to conducting two-sided operations as warranted by evolving liquidity conditions. The weighted average call rate (WACR) – the operating target of monetary policy – traded (on an average) at 6.44 per cent – 6 bps below the policy repo rate during February 16 through March 15, 2023 (Chart 44a). Activity in the call market was steady, with average daily volume during February 16 through March 15, 2023 at ₹14,428 crore as compared with ₹14,219 crore during January 16 to February 15, 2023. Rates in the collateralised segment also eased – the tri-party repo and market repo rates traded 13 bps and 9 bps, respectively, below the policy repo rate. Across the term money segment, however, rates firmed up with yields on 3-month treasury bills (T-bill), certificates of deposit (CDs) and commercial paper (CPs) for non-banking financial companies (NBFCs) trading above the MSF rate reflecting moderation in surplus liquidity (Chart 44b). 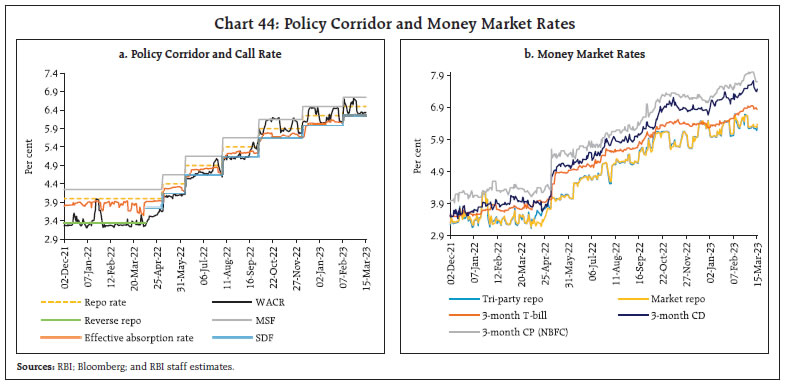 In the primary market, fund mobilisation through CD issuances was robust at ₹6.3 lakh crore during the financial year so far (up to March 10), higher than ₹2.0 lakh crore in the corresponding period last year reflecting banks’ additional demand for funds on account of buoyant credit offtake. CP issuances, however, moderated significantly to ₹12.5 lakh crore during the financial year so far (up to February 28) from ₹19.0 lakh crore in the corresponding period last year, displaced by bank credit offtake. The average risk premium in the money market (3-month CP minus 91-day treasury bill) remained elevated at 98 bps. The yield on the 10-year benchmark G-sec (7.26% GS 2033) tracked the movement in US treasury yields of corresponding tenor - the latter having surpassed the 4 per cent mark again in early March, similar to levels observed in October-November 2022. Subsequently, the US treasury yields dropped sharply following the unravelling of the crisis in US-based Silicon Valley Bank (SVB) on March 10 (Chart 45a). The yield on US 10-year treasury slumped nearly 20 bps on March 10 and taking cues from it, the domestic yield on the 10-year benchmark softened closing at 7.34 per cent on March 15. Across the yield curve, G-sec yields hardened at the mid-end of the curve while longer term yields eased on March 15 compared to February 15, 2023 (Chart 45b).10 Corporate bond yields hardened across issuer categories and tenors, while spreads exhibited diverse movements (Table 3). Funds mobilised through corporate bond issuances were ₹0.66 lakh crore during January 2023, nearly half of ₹1.36 lakh crore in December 2022. The average risk premium in the bond market (5 year AAA minus 5 year G-sec) moderated to 43 bps during February 16 through March 15, 2023 from 50 bps during January 16 to February 15, 2023. 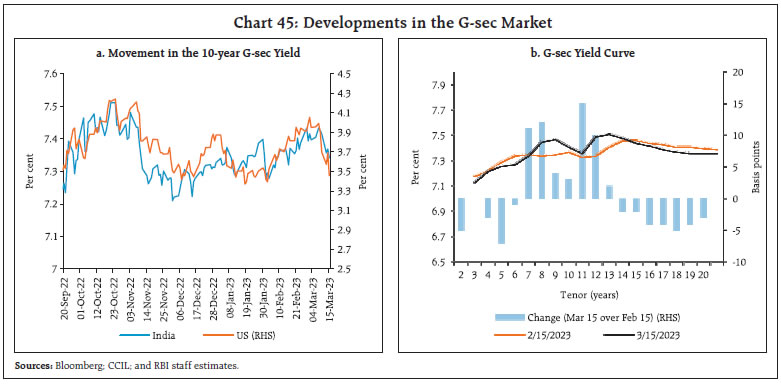
| Table 3: Financial Markets - Rates and Spread | | Instrument | Interest Rates (per cent) | Spread (basis points) (Over Corresponding Risk-free Rate) | | Jan 16, 2023 – Feb 15, 2023 | Feb 16, 2023 – Mar 15, 2023 | Variation (in bps) | Jan 16, 2023 – Feb 15, 2023 | Feb 16, 2023 – Mar 15, 2023 | Variation (in bps) | | 1 | 2 | 3 | (4 = 3-2) | 5 | 6 | (7 = 6-5) | | Corporate Bonds | | (i) AAA (1-year) | 7.88 | 8.06 | 18 | 75 | 46 | -29 | | (ii) AAA (3-year) | 7.80 | 8.03 | 23 | 59 | 58 | -1 | | (iii) AAA (5-year) | 7.87 | 7.95 | 8 | 50 | 43 | -7 | | (iv) AA (3-year) | 8.50 | 8.75 | 25 | 129 | 130 | 1 | | (v) BBB-(3-year) | 12.41 | 12.40 | 25 | 493 | 495 | 2 | Note: Yields and spreads are computed as monthly averages.
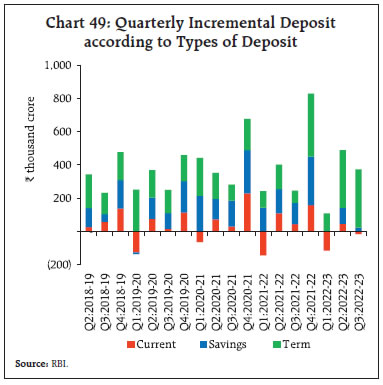
Sources: FIMMDA; and Bloomberg. | Reserve money (RM), excluding the first-round impact of changes in the cash reserve ratio (CRR), grew by 8.4 per cent on a y-o-y basis as on March 10, 2023 (8.9 per cent a year ago) [Chart 46]. Currency in circulation (CiC), the largest component of RM, recorded a growth of 8.3 per cent (8.9 per cent a year ago). Money supply (M3) grew by 9.5 per cent as on February 24, 2023 (8.7 per cent a year ago), primarily driven by its largest component – aggregate deposits with banks – which went up by 9.7 per cent. The growth in scheduled commercial banks’ (SCBs) credit stood at 15.5 per cent, as on February 24, 2023 down from a high of 17.8 per cent recorded in October 2022. 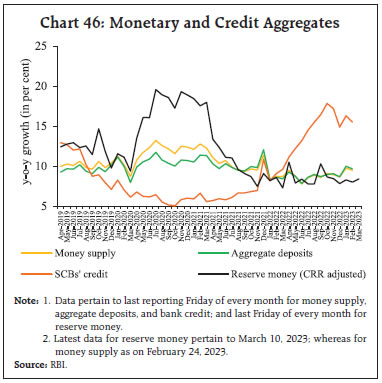 Despite some moderation in credit growth in recent months, the overall growth remains strong. In terms of geographical distribution, metropolitan branches of banks, which account for nearly 60 per cent of bank loans, led the lending expansion (Chart 47). Branches in the urban, semi-urban and rural areas also maintained double digit credit growth on a y-o-y basis. Banks have revised their repo linked external benchmark-based lending rates (EBLRs) upwards by 250 bps in tandem with the increases in the policy repo rate since May 2022. SCBs have also increased their 1-year median marginal cost of funds-based lending rate (MCLR) by 135 bps during the period May 2022 to February 2023. As a result of the increase in benchmark rates for pricing of loans, weighted average lending rates (WALRs) on fresh rupee loans of SCBs increased by 149 bps during May 2022 to January 2023. The increase in the share of EBLR linked loans, which accounts for a major share of outstanding floating rate rupee loans (47.6 per cent as at end-September 2022), has improved the pace of transmission to WALR on outstanding loans – the pass-through to WALR on outstanding rupee loans stood at 86 bps during May 2022 to January 2023. 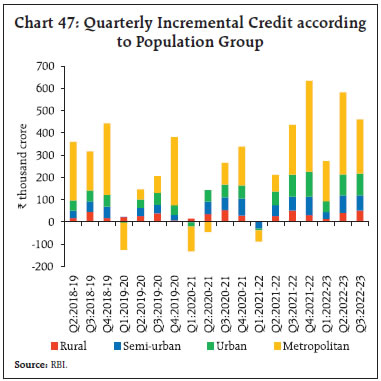 Across bank groups, transmission to WALRs on fresh rupee loans of public sector banks (PSBs) has exceeded that of private sector banks (PVBs) in the current tightening period, i.e., May 2022 to January 2023 (Chart 48). The WALR on fresh rupee loans of PSBs increased by 159 bps while that of PVBs increased by 119 bps. Lending rates of PSBs, however, remain lower than those of PVBs. The pass-through to WALR on outstanding loans was relatively better for PVBs than for PSBs. Banks have also repriced their deposit rates higher in recent months to mobilise funds. The intensifying competition among banks to expand their deposit base may impel banks to increase deposit rates going ahead. The median term deposit rates (i.e., average card rates on retail deposits) on fresh deposits increased by 82 bps during May 2022 to February 2023 (Table 4). As returns on fixed deposits improved and differentials with savings deposit rate increased in the recent period, the lion’s share of bank deposits accrued to term deposits (Chart 49). On an annual (y-o-y) basis, term deposits recorded a growth of 13.2 per cent, whereas current and savings deposits increased at a moderate pace of 4.6 per cent and 7.3 per cent, respectively. | Table 4: Transmission from the Repo Rate to Banks’ Deposit and Lending Rates | | (Variation in basis points) | | Period | Repo Rate (bps) | Term Deposit Rates | Lending Rates | | Median Term Deposit Rate (Card Rates) | WADTDR- Outstanding Deposits | EBLR | 1-Year MCLR (Median) | WALR - Fresh Rupee Loans | WALR- Outstanding Rupee Loans | | Retail Deposits | Retail and Bulk Deposits | | Easing Cycle Feb 2019 to Mar 2022 | -250 | -208 | -188 | - | -155 | -232 | -150 | | Tightening Period May 2022 to Feb 2023* | +250 | 82 | 87 | 250 | 135 | 149 | 86 | Note: 1. Latest data on WALRs and WADTDRs pertain to January 2023.
2. 28 domestic banks have increased their EBLRs by 250 bps as at end-February 2023.
3. Acronyms: WALR: Weighted Average Lending Rate. WADTDR: Weighted Average Domestic Term Deposit Rate; MCLR: Marginal Cost of Funds-based Lending Rate; EBLR: External Benchmark based Lending Rate.
Source: RBI staff estimates. |
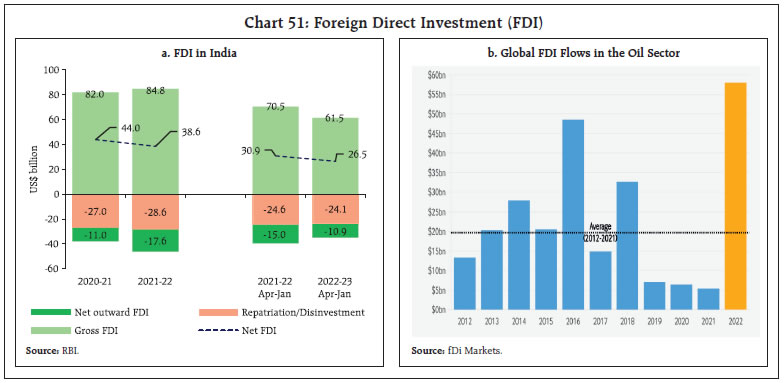
 Hawkish minutes of the Federal Open Market Committee’s (FOMC) meeting, a sharp rise in US treasury yields, and fresh geopolitical risks after Russia suspended its participation from the New Strategic Arms Reduction Treaty (START) dented positive sentiment in the Indian equity market during the second half of February 2023. Consequently, the BSE Sensex reversed its earlier gains and registered a cumulative decline of 1 per cent during February 2023 (Chart 50). The BSE Sensex recovered its losses in early March 2023, aided by optimistic domestic and global economic data. Domestic equities, however, declined thereafter tracking the sell-off in global markets as the collapse of SVB and concerns over the financial health of a large European financial services provider dented investors’ sentiments. Overall, the BSE Sensex declined by 1.6 per cent during the month so far to close at 57,990 on March 17, 2023. Gross inward foreign direct investment (FDI) moderated to US$ 61.5 billion during 2022-23 (April-January) from US$ 70.5 billion a year ago (Chart 51). Net FDI decreased to US$ 26.5 billion during this period from US$ 30.9 billion a year ago, mainly reflecting a decline in equity inflows. Manufacturing, financial services, computer services, retail and wholesale trade, and communication services received the bulk of FDI equity inflows during 2022-23 (April-January). Singapore, Mauritius, the US, the UAE and the Netherlands were the major source countries during this period. Globally, there has been an increase in the amount of FDI channelled towards the oil sector in 2022. 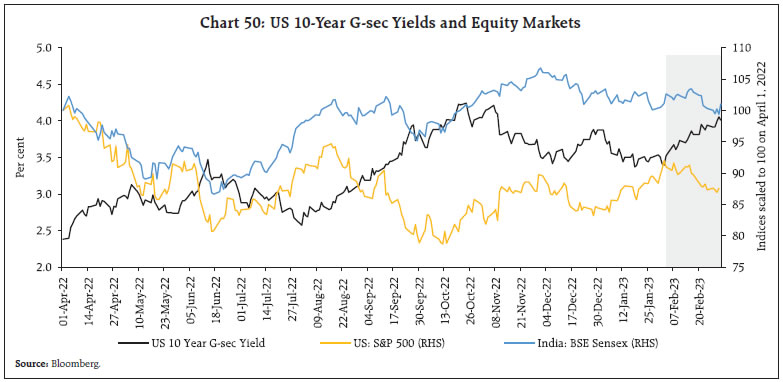
 In March 2023 (up to March 16), foreign portfolio investments (FPIs) turned positive after three months since November 2022 and recorded inflows of US$ 1.5 billion (Chart 52). Most of the outflows in February 2023 were from the equity segment. Among major sectors, automobiles, consumer durables and financial services were the leading recipient sectors of FPI in equities during 2022-23 (April-February), whereas information technology, oil, gas and consumable fuels, and metals and mining sectors recorded the highest outflows.
As compared with the corresponding period of the previous financial year, the amount of external commercial borrowings (ECBs) registrations and disbursements was lower by US$ 10.4 billion and US$ 11.2 billion, respectively, whereas principal repayments were higher during 2022-23 so far (up to January 2023). This resulted in net ECB outflows during the current financial year (Chart 53). A substantial portion of newly registered ECBs are intended for domestic on-lending/sub-lending purposes, followed by borrowings for new projects, import of capital goods and refinancing of earlier ECBs (Chart 54). During 2022-23 so far (up to January), major global benchmark rates, viz., the London interbank offer rate (LIBOR) and the secured overnight financing rate (SOFR) rose by 319 basis points (bps) and 403 bps, respectively, in sync with the tightening of monetary policy in major economies. Combined with the movements in the weighted average interest margin (WAIM), the overall cost of ECB loans increased from 2.7 per cent in March 2022 to 7.3 per cent in January 2023 (Chart 55). As of February 2023, India held the fifth largest foreign exchange reserves in the world (Chart 56a). India’s foreign exchange reserves recorded a decline of US$ 11.7 billion in February 2023 and stood at US$ 560.0 billion as on March 10, 2023 (Chart 56b), covering more than nine months of imports projected for 2022-23. On a cumulative basis, India’s forex reserves increased by US$ 27.3 billion since September 2022.
In the foreign exchange market, the Indian rupee (INR) depreciated vis-à-vis the US dollar (m-o-m) in February 2023 (Chart 57). The performance of the rupee was in line with many other EMEs and reserve currencies. Volatility in the movement of the INR, as measured by the coefficient of variation was, however, lower than that of other currencies, except the Turkish lira in February. In terms of the 40-currency real effective exchange rate (REER), the INR depreciated by 0.5 per cent in February 2023 (m-o-m) [Chart 58].
Payment Systems Digital transactions through major payment modes maintained growth (y-o-y) in February 2023 (Table 5). The turnover in the National Automated Clearing House (NACH) recorded a strong uptick, buoyed by the disbursal of PM Kisan Samman Nidhi (PM-KISAN) installment of more than ₹16,800 crore in the month.11 Under the Unified Payments Interface (UPI), peer-to-merchant (P2M) payments continued to gain in share over peer-to-peer (P2P) payments. With the RuPay credit cards going live on the UPI platform12, merchant adoption is set to gain further traction. A marked expansion in e-commerce-based transactions kept credit card momentum upbeat for a year till February 2023, with the monthly spending of around ₹1 lakh crore. In terms of cross-border digital payments, a landmark was achieved with the launch of the UPI linkage with Singapore’s real-time payment system, PayNow, on February 21, 2023. In line with the growing popularity of the UPI, the Reserve Bank has extended the UPI facility to inbound travellers from the G20 nations for effecting local merchant transactions through the issuance of full-KYC prepaid payment instruments (PPIs). The Reserve Bank launched the second edition of the Global Hackathon – HARBINGER 2023 – with the theme ‘Inclusive Digital Services’.13 To further bolster digital adoption, the ‘Har Payment Digital’ mission has been initiated as a part of the Digital Payment Awareness Week (March 6 to 12, 2023). As a move to strengthen the oversight of crypto-based transactions, the government has brought trading, safe-keeping, and related financial services involving virtual digital assets (VDAs) within the purview of the Prevention of Money Laundering Act (PMLA), 2002. Conclusion The NSO’s end-February data release indicates that the Indian economy is intrinsically better positioned than many parts of the world to head into a challenging year ahead, mainly because of its demonstrated resilience and its reliance on domestic drivers. Even as global growth is set to slow down or even enter a recession in 2023 as global financial markets wager, India has emerged from the pandemic years stronger than initially thought, with a steady gathering of momentum since the second quarter of the current financial year. Year-on-year growth rates do not reflect this pick-up of pace because by construction they are saddled with statistical base effects, and instead suggest a sequential slowing down through successive quarters of 2022-23 to an unsuspecting reader. Currently available forecasts of India’s real GDP growth for 2023-24, including those of the RBI, settle between 6.0 and 6.5 per cent. But, as we wrote in last month’s edition of the State of the Economy, what if at least 50 per cent of the ₹35,000 crore of tax relief proposed in the Union Budget is used by taxpayers for consumption and adds to private final consumption expenditure – a component of GDP? This is plausible because the proportion of an additional rupee of income that is spent on consumption by households in India is estimated at 0.54 (54 paise). And what if even a third of the additional allocation of ₹3.2 lakh crore budgeted for effective capital expenditure adds to gross fixed capital formation, another component of GDP? India’s real GDP can go up from ₹159.7 lakh crore in 2022-23 to not just ₹169.7 lakh crore in 2023-24 as is currently being projected but to ₹170.9 lakh crore. This is simple arithmetic; hardly a hurray at half-time. Also, unlike the global economy, India would not slow down – it would maintain the pace of expansion achieved in 2022-23. We remain optimistic about India, whatever the odds.
|