by Aayushi Khandelwal^, Rachit Solanki^,
Saksham Sood^, Ipsita Padhi^,
Anoop K Suresh^, Samir Ranjan Behera^ and Atri Mukherjee^ The finances of the Central government as well as the States remained resilient in H1:2022-23, with the receding impact of the pandemic on economic activity, even as the war in Europe warranted higher expenditure on subsidies and targeted fiscal measures to tame inflation. The gross fiscal deficit of the general government remained contained in both the quarters of H1:2022-23, while higher capex by the Centre provided sustained impetus to recovery of growth. Going forward, the States need to speed up their capex within their higher budgetary space in H2:2022-23. I. Introduction The Union Budget 2022-23 was presented at a time when the Indian economy was still recovering from the contractionary impact of the COVID-19 pandemic with high vaccine coverage infusing confidence for faster normalisation of economic activity. Against this backdrop, while catalysing the recovery process through a record level of capital expenditure and greater focus on infrastructure, the Union Budget for 2022-23 aimed at feasible order of fiscal consolidation with the intent to lower the fiscal deficit to below 4.5 per cent of GDP by 2025-26. The States too have endeavoured for fiscal consolidation in 2022-23, budgeting a consolidated GFD of 3.3 per cent1 of the GDP, down from 3.6 per cent in 2021-22 (RE). The performance of government finances, as evident from this half yearly review has been robust, notwithstanding the macroeconomic effect of the war in Europe. The Centre’s tax collections surpassed expectations on the receipts side, with all major heads such as income tax, corporation tax, and goods and services tax (GST) recording high growth. The Central government also ensured front-loaded capital expenditure. In States’ case, the revenue receipts, driven by strong growth of tax revenues, have performed well resulting in a marked improvement in their GFD for H1:2022-23. States have also sustained the pace of their total expenditure. The rest of the article is structured as follows: Section II analyses the receipt and expenditure of the Centre and States (at a quarterly frequency) for H1:2022-23.2 Section III deals with the outcomes in terms of key deficit indicators and their financing. Section IV presents estimates on general government (Centre plus States) finances for Q1 and Q2 of 2022-23 along with projections for the second half of 2022-23. Section V sets out the concluding observations and the near-term fiscal outlook. II. Fiscal Outcomes in Q1 and Q2 of 2022-23 In line with the previous year, more than 50 per cent of the budgeted total receipts of the Central government were realised during H1:2022-23. On the other hand, the total expenditure of the Central government remained contained at 46.2 per cent of budget estimates (BE), as against an average of 53.5 per cent of BE during 2017-18 to 2019-20, despite the challenges posed by the war in Europe on macroeconomic outcomes. The fiscal performance of the States has been robust, with an improvement in their budgetary deficits in H1:2022-23. The States’ total receipts have been strong, as reflected in a higher proportion of budgeted total receipts collected in H1:2022-23, compared to those collected in the previous years. On the expenditure side, the States have expended 39.1 per cent of their budgeted total expenditure during H1:2022-23, broadly in line with their past spending patterns (Chart 1 a and b). a. Receipts Revenue receipts of the Central government registered a growth of 5.2 per cent in Q1:2022-23, as robust growth in tax revenues was partly offset by a contraction in non-tax revenues on the back of lower dividend transfer from the Reserve Bank. With a pick-up in non-tax revenues in Q2:2022-23, the growth in revenue receipts improved to 11.2 per cent. Non-debt capital receipts3 increased by 278.0 per cent in Q1:2022-23, led by the successful initial public offer (IPO) of Life Insurance Corporation (LIC), but remained lackluster in Q2:2022-23 (Chart 2 a and b). States’ revenue receipts have witnessed a robust y-o-y growth of 26.3 per cent in H1:2022-23 - 32.6 per cent and 21.1 per cent in Q1:2022-23 and Q2:2022-23, respectively. Tax revenue, which accounted for 76 per cent of the revenue receipts during H1:2022-23, grew at 36.8 per cent and 28.5 per cent in Q1:2022-23 and Q2:2022-23, respectively. The non-debt capital receipts of the State government4 remained modest in Q1:2022-23 and Q2:2022-23 (Chart 3 a and b). The Centre’s direct tax collections registered a y-o-y growth of 23.2 per cent in H1:2022-23, led by the growth in income tax and corporation tax by 25.7 per cent and 21.6 per cent, respectively. In Q1:2022-23, the Centre’s direct tax collections grew by 35 per cent whereas in Q2:2022-23 it recorded a growth of 14.5 per cent on a y-o-y basis (Chart 4a). On the other hand, while the Centre’s indirect tax collections increased by 11.9 per cent during H1, there was a contraction in customs and union excise duty collections on account of (i) cuts in excise duty on petrol and diesel in May 2022, and (ii) reduction in customs duty on key raw materials and inputs for the steel and plastic industry as well as commodities such as cotton and vegetable oil, which were aimed at taming inflation. States’ own direct tax collections performed well during H1:2022-23 (Chart 4b). The GST collections (Centre plus States) have remained buoyant, recording a y-o-y growth of 32.2 per cent and averaging ₹1.5 lakh crore during H1:2022-23, as against an average of ₹1.1 lakh crore during H1:2021-22. In Q1:2022-23, the GST collections recorded a growth of 37.1 per cent whereas in Q2:2022-23 it registered a growth of 27.5 per cent on a y-o-y basis (Chart 5).
In the case of States, two major factors which have contributed to the growth in tax revenues are the higher and stable collection of States GST (SGST) and tax devolution from the Centre (on account of higher buoyancy in direct taxes, GST, and higher inflation). In order to support the States in accelerating their capital outlay, the central government front-loaded the tax devolution in August 2022 by releasing two instalments of tax devolution amounting to ₹1.16 lakh crores (Chart 6 a and b).
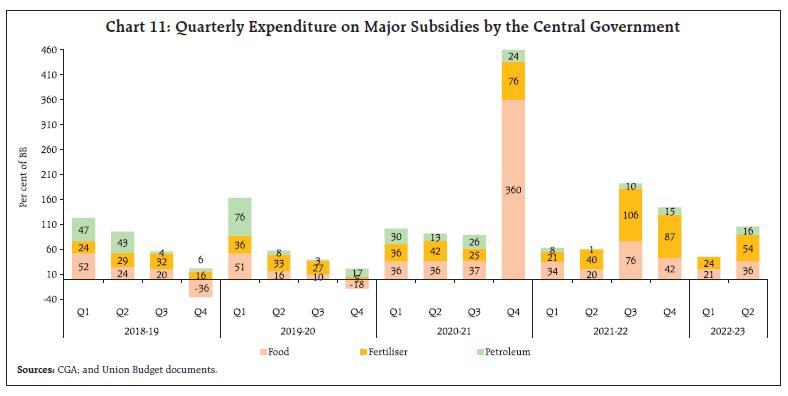
Centre’s non-tax revenues contracted in Q1:2022-23 due to lower surplus transfer from the Reserve Bank but witnessed a sharp up-tick in Q2, primarily owing to an increase in non-tax collections from economic services.5 However, on the disinvestment front, 37.8 per cent of the budgeted disinvestment target of ₹65,000 crore has been raised in H1, primarily owing to the LIC IPO (Chart 7). In the case of States, the non-tax revenue grew at 55.6 per cent in Q1:2022-23 and 13.3 per cent in Q2:2022-23. b. Expenditure In 2022-23 (BE), the total expenditure of the central government was budgeted to grow by a modest 4.6 per cent6, on top of 7.4 per cent growth in 2021-22 (RE), with revenue expenditure growth budgeted at 0.9 per cent and capital expenditure growth at 24.5 per cent.7 However, in March 2022 the Union government announced Phase VI of the Pradhan Mantri Garib Kalyan Anna Yojana for the period April to September 2022, with an estimated additional cost of ₹80,000 crore.8 Subsequently, Phase VII of the scheme was also announced for the period October-December 2022, with an estimated additional cost of ₹44,762 crore.9 Further, the Union government has approved additional fertiliser subsidy of ₹1.13 lakh crore over and above the budget estimates, to insulate the farmers from rising international fertilizer prices.10,11 The Union government also placed before the Parliament the first batch of supplementary demand for grants for 2022-23 during the winter session of the parliament12 which involved additional cash outgo.13 Owing to these developments, the growth in total expenditure and revenue expenditure is expected to exceed the budget estimates. During H1:2022-23, total expenditure recorded a y-o-y growth of 12.2 per cent, with revenue expenditure and capital expenditure increasing by 6.0 per cent and 49.5 per cent, respectively.14 Even though in H1:2022-23 around half of the budgeted capital expenditure has been spent, it has recorded a high y-o-y growth of 49.5 per cent attributable to the frontloading of capital expenditure vis-à-vis previous years. In this period, key ministries such as the Ministry of Road Transport and Highways, the Ministry of Defence and the Ministry of Railways have accounted for more than 80 per cent of the total capital expenditure (Chart 8). Going forward, in H2:2022-23, after accounting for the impact of major post-budget announcements, total expenditure growth is likely to spike to 14.9 per cent, with revenue expenditure growth picking up to 13.8 per cent and capital expenditure slowing down to 20.6 per cent (Chart 9). The trend in quarterly expenditure indicates a decline in expenditure growth from Q1:2022-23 to Q2:2022-23. In the case of revenue expenditure as well as capital expenditure, the expenditure growth (y-o-y basis) in Q2:2022-23 turned out to be lower vis-à-vis the corresponding period of the previous year viz., Q2:2021-22. This is primarily due to the base effect, as Q2:2021-22 recorded high expenditure growth when expenditure had to be frontloaded and expanded to deal with the second wave of the pandemic (Chart 10 a and b). The major subsidies outgo of the Central government, comprising food, fuel and fertilisers stood at 62.6 per cent of BE in H1:2022-23 compared to 53.8 per cent of BE in H1:2021-22, recording a y-o-y growth of 9.9 per cent. Food subsidy accounted for 58.4 per cent of total outgo on major subsidies in H1:2022-23 vis-à-vis 72.5 per cent in the corresponding period of last year (Chart 11). States’ revenue expenditure remained healthy in the first two quarters of 2022-23 with its growth turning out to be slightly higher than that in the corresponding period of the previous year. Keeping in line with their past spending pattern, States have exhausted 41.4 per cent of their budgeted revenue expenditure in H1:2022-23. On the other hand, the capital expenditure by the States has remained anaemic so far. In Q1:2022-2315, the capital outlay by the States contracted by 9.9 per cent. Though the growth recovered during the next quarter, it remained feeble. The growth rate of capital expenditure and more importantly the capital outlay in H1:2022-23 has been muted at 7 per cent and 2.1 per cent, respectively (Chart 12 a and b).16 Normally, the States tend to back-load their expenditure in the latter half of the year. Going forward, it is expected that the States may boost their capital expenditure. 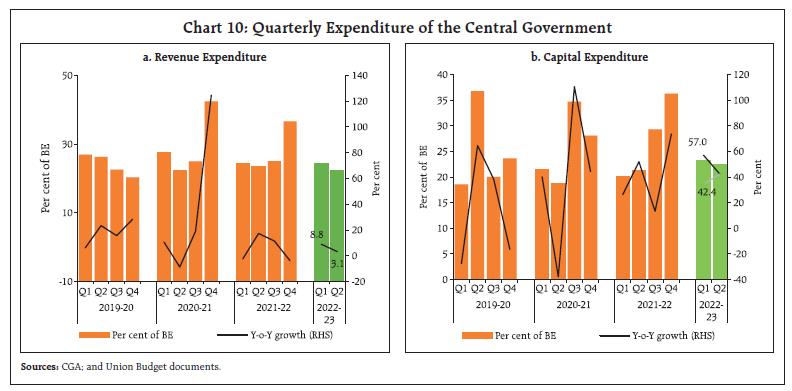
 The effort of the States would be supplemented by augmented availability of resources following the relaxation of norms pertaining to off-budget borrowings17, front-loading of tax devolution by the Centre, payment of GST compensation cess and pick up in the loans by the States under the Scheme for Special Assistance to States for Capital investment.18 III. Fiscal Deficit and its Financing a. Fiscal Deficit Central Government After attaining a GFD of 6.7 per cent of GDP in 2021-22 (PA), the Union government has budgeted for a GFD of 6.4 per cent of GDP in 2022-23 with the medium-term target of bringing down the GFD below 4.5 per cent of GDP by 2025-26. During H1:2022-23, the GFD of the Union government stood at 37.3 per cent of the BE, marginally higher than the GFD of 35.0 per cent during the corresponding period of the previous year (viz., H1:2021-22). In comparison with the corresponding period of the previous year, the fiscal deficit rose during H1:2022-23, attributable to higher subsidy bills and front loading of capital expenditure. On the brighter side, higher tax collections helped offset higher subsidy bills and helped contain the fiscal deficit (Chart 13 a and b). State Governments The States had budgeted a consolidated GFD of 3.3 per cent of GDP for 2022-23 (BE), lower than 3.6 per cent in 2021-22 (BE). In Q1:2022-23 and Q2:2022-23, the States have exhausted a lower proportion of their budgeted GFD as against the same in the corresponding period of the previous year. Consequently, the fiscal space available to States in the latter half of the year has expanded to 71 per cent of their budgeted GFD in 2022-23, a sharp rise from 57.2 per cent for the corresponding period of the previous year (Chart 14). While the GFD of the States has improved in the post-pandemic period, the debt level of the States continues to remain high.19 Moreover, the implicit debt of the States in the form of State guarantees (viz., contingent liabilities) has also seen a considerable rise in the recent past, which may expose some of the States to additional fiscal risks (Box I). 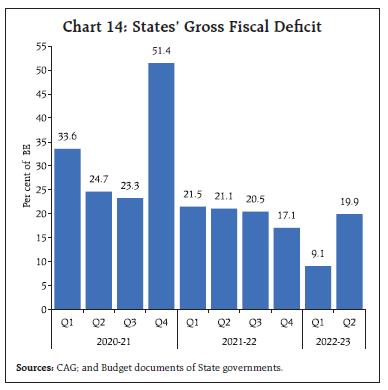 The quality of expenditure [measured by revenue expenditure to capital outlay (RECO)] for the Centre recorded significant improvement in Q1:2022-23 and Q2:2022-2320, attributed to the higher thrust placed by the Central government on capital expenditure. In contrast, the expenditure quality of the States suffered a setback on account of subdued capital outlay by the States. In Q1:2022-23 and Q2:2022-23 their RECO ratio inched up to 11.6 and 7.2, respectively, higher than the levels in the corresponding period of the last year. Though the revival of capital outlay in Q2:2022-23 helped in improving the expenditure quality, it still leaves room for further improvement. Box I: State Government Guarantees – Recent Trends State governments often issue guarantees on behalf of several subordinate, independent and parastatal entities - including State-owned enterprises, cooperative institutions and urban local bodies. These guarantees do not explicitly form a part of the debt burden of the State government but are classified as ‘Contingent Liabilities’ of the State government as they are only invoked at the occurrence of a specified event agreed in the guarantee contract. Any significant invocation of these guarantees will raise their debt to GDP ratios further. Over the past few years, the cumulative guarantees by the States have been on a rising trajectory (Chart 1a). There are significant inter-state variations in exposure to contingent liabilities. Amongst major States, Telangana, Rajasthan, Andhra Pradesh, Uttar Pradesh and Chhattisgarh had issued guarantees amounting to over 5 per cent of their GSDP (Chart 1b). It is noteworthy that in the case of some of these States, the quantum of outstanding guarantees now compares sizably to their existing debt stock (Chart 1c). For instance, outstanding guarantees in respect of Telangana, Andhra Pradesh, Rajasthan and Uttar Pradesh are now more than a fifth of their total outstanding debt. Telangana, in particular, stands out from the rest of the larger States with the highest contingent liabilities to GSDP ratio at around 9.4 per cent. Although guarantees are not explicit debt, they have the potential to drain States’ budgetary resources in the case of their invocation. Indiscriminate issuances of guarantees may also harm the banking sector as the loan sanctioning agencies might have been issuing credit only on the strength of the guarantee issued by the State without undertaking the requisite due diligence. In this context, the Reserve Bank has advised lending institutions not to sanction loans solely based on State guarantees and the loan sanctioning should be done after thoroughly examining the merit on a case-by-case basis. The fifteenth finance commission (FC-XV) had noted that ‘a complete reporting mechanism of explicit and implicit guarantees is not yet in place.’ In addition, it called for developing an accounting standard for financial reporting and disclosure of public debt, including contingent liabilities (FC-XV, 2020). The Centre has stipulated the States to set-off their off-budget borrowings of 2021-22 against their borrowing limits for next four years, till March 2026. The Reserve Bank has in the past examined the implications of States’ contingent liabilities/guarantees on their fiscal position. In this regard, several of the Reserve Bank’s initiatives were a direct outcome of deliberations held at the Conference of State Finance Secretaries (RBI, 2012). Based on the recommendations of the Technical Committee on State Government Guarantees constituted by the Reserve Bank in 1997, a Guarantee Redemption Fund (GRF) was constituted in the Reserve Bank to provide a cushion to the States against the liability arising from the invocation of guarantees (RBI, 1999). However, only 18 States21 are currently members of the GRF scheme. For these 18 States, the GRF fund amounts to only 2.3 per cent of their total outstanding guarantees (RBI, 2021). Furthermore, the ceiling limits applied for States vary widely, with some States applying the limit as a certain percentage of total revenue receipt, or in some cases as a percentage of GSDP, and in some cases as either of the two. In contrast, for the Centre, the volume of sovereign guarantees undertaken in a financial year is currently limited to an amount not exceeding 0.5 per cent of the GDP (FRBM Act, 2003).  Without formal project assessment processes, fiscal risks from loan guarantees could rise in the medium term. A proper risk assessment framework may be enacted by the States Finance Departments to decide on the quantum of guarantees and the guarantee fee. Additionally, States may ensure that enough provisioning is maintained in their GRFs in line with the expected invocation of guarantees. References: FC-XV (2020). Finance Commission in COVID Times – Report for 2021-26. Volume I Main Report. XV Finance Commission. Reserve Bank of India (1999). Report of the Technical Committee on State Government Guarantees. Reserve Bank of India (2012). State Finances: A Study of Budgets of 2011-12. Reserve Bank of India (2021). State Finances: A Study of Budgets of 2021-22. | 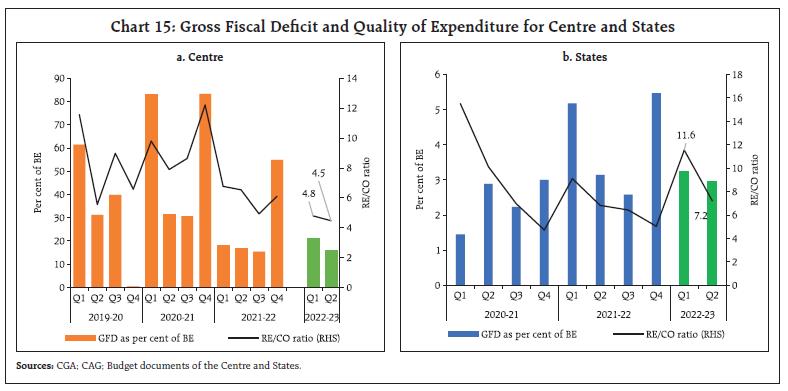 The expenditure quality of the States has a profound impact on medium to long-term growth of the economy necessitating a revamped push on capex in the remaining half of the year by the States (Chart 15 a and b). b. Financing of GFD In H1:2022-23, the Union government completed 55.4 per cent of the budgeted net market borrowings for 2022-23, which financed the major chunk of its GFD during the first half of the year. The market borrowings were followed by the utilisation of National Small Savings Fund (NSSF) for financing the GFD of the Union government. With the private sector demand for credit rising and spill over from the aggressive tightening of monetary policy by the US Fed continuing to exert hardening pressures, the 10-year g-sec yield has remained above 7 per cent during H1:2022-23. Nonetheless, the borrowing programme of the Union government during H1:2022-23 was carried out smoothly. In fact, the decision of the Union government to cut its borrowing target by ₹10,000 crore from its budgeted target for 2022-23 signals its confidence of attaining the fiscal deficit target of 6.4 per cent of GDP despite its unanticipated rise in expenditure for 2022-23 mainly accounted by higher food and fertilizer subsidies.22 This is attributable to the Centre’s tax revenue that has been growing at a robust pace. Going forward, this may aid in containing the spike in 10-year g-sec yields witnessed during H1:2022-23. On the other hand, the Centre’s market borrowing programme for H2:2022-23 would remain unchanged as per the issuance calendar for October 2022 - March 2023. In addition to ₹5.76 lakh crore of gross market borrowing as per the issuance calendar, the Government of India would also be issuing its novel sovereign green bonds for an aggregate amount of ₹16,000 crore (Box II). The net market borrowings undertaken by the States during H1:2022-23 witnessed a decline in comparison to the same period in the previous year, supported by their lower GFD (Chart 16).24 The net market borrowings by the States in H1:2022-23 accounted for only 26 per cent of their budgeted target while States had completed 40 per cent of their budgeted market borrowings in the corresponding period of the previous year. Amongst the larger States/UTs, Andhra Pradesh, Haryana, Punjab, and Jammu and Kashmir have seen a significant rise in their net market borrowings in H1:2022-23. Box II: Sovereign Green Bonds for A Low Carbon Economy Fiscal policy would need to play a crucial role in mitigating climate change risks as measures that are environmentally beneficial in the long run would require substantial amount of financing. In this context, financial innovation can play a critical role in supporting such interventions. The development of green bond market has been one such financial innovation over the last 15 years (Ando et al., 2022). The Green Bonds Principles23 set the foundations for the elements to be incorporated within a Green Bond Policy Framework - a critical document to give credibility to a green bond. These principles are entirely voluntary and should be seen as the guidelines for all green bond market participants. They also serve as the basis for many national frameworks (IFC, 2018). Green bonds issued by the sovereign (i.e., these bonds carry guarantees related to repayment of principal and payment of interest by the sovereign or the government) are termed sovereign green bonds (SGBs). The SGBs are similar to dated government securities except for the green clause. The funds raised by the sovereign through the SGBs would form part of overall government borrowing. Though green bonds have gained popularity, at the sovereign level (i.e., SGBs), their market remains very shallow. Nonetheless, the issuance of SGBs is likely to expand in the coming years since many countries view green bond issuance as a vital tool for demonstrating moral leadership on climate change as well as funding commitments under the Paris Agreement which was adopted in 2015 (Ando et al., 2022). By issuing SGBs, several potential benefits arise for the sovereign. Firstly, the growing popularity of green bonds allows the sovereign to issue SGBs having longer maturity (attributable to the longer horizon of green projects) and at a low borrowing cost vis-à-vis vanilla sovereign bond [i.e., greenium] (Ando et al., 2022). Additionally, the pricing of the SGBs is not reliant on the underlying return on investment of the projects, but rather the sovereign’s risk/ rating. Secondly, since the proceeds from issuing SGBs are channelled towards green projects, the commitment to finance green projects could send signal as well as improve the reputation of the sovereign leading to higher price for the sovereign’s non-green bonds (Doronzo, Siracusa, and Antonelli 2021). Thirdly, by issuing SGBs, the sovereign can reduce the cost of capital for green projects by attracting new investors who are interested in green investments (Climate Bonds Initiative, 2018). On the other hand, there are several factors which currently impede further development of the green bond market. These include narrow investor base, limited SGB issuances so far among the emerging and developing economies, absence of an international set of guidelines as to what constitute green bonds and lastly, the risk of fund mismanagement (Ando et al., 2022). Even though the first green bond was issued in 2007 by the European Investment Bank and the green bond market has been continuously growing, SGBs issuance started much later in 2016 when Poland became the first issuer of SGBs building on the spirit of the Paris Agreement. Following Poland, France also issued SGBs in 2017. France was followed in 2017 by Fiji and Nigeria who became the first among developing economies to issue SGBs. This was followed by several advanced economies as well as emerging/ developing economies (Chart 1). So far, 24 nations have issued SGBs. However, the issuance of SGBs by these economies exhibits large variation in terms of various parameters viz., issuance size, maturity, yield, tax incentivisation, value as well as the currency of issue. Nevertheless, the common objective of issuing SGBs across economies has been to finance green projects and thereby address issues such as climate change (Mosionek-Schweda & Szmelter, 2019). Corporates have been issuing green bonds in India for a few years in a growing market; however, the country’s global share is miniscule. In keeping with the ambition to significantly reduce the carbon intensity of the Indian economy, the Government of India (GoI) through the Union Budget 2022-23 had announced the issuance of SGBs. Currently, the framework for India’s SGBs has been finalised and has been designed to comply with the four components (viz., use of proceeds, project evaluation and selection, management of proceeds and reporting) and key recommendations of ICMA Green Bonds Principles. The SGBs issuance would focus on financing public projects across nine sectors which inter alia includes climate change, sustainable water and waste management, clean transportation, renewable energy and pollution control. The framework adopted by India has been termed ‘medium green’ by the Centre for International Climate and Environmental Research (CICERO), the leading global independent reviewer of green bond investment architecture. The first issuance of such SGBs by India is expected to take place in the current fiscal year. The issuance of SGBs by GoI is timely as India is taking over the G20 presidency where it will draw attention to issues such as climate financing. 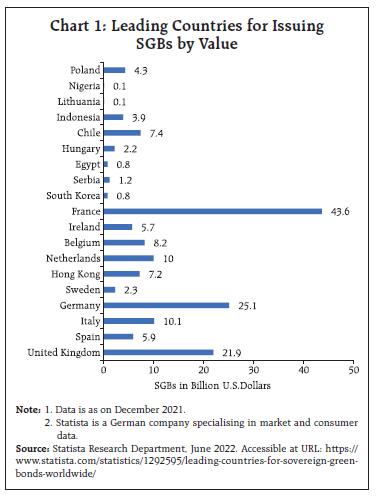 SGBs provide the sovereigns across the globe an opportunity to finance green infrastructure, demonstrate moral leadership on climate change as well as attract a new pool of domestic and international investors. Compared with its early days, the green bond market is presently witnessing rapid growth and it is recommended that sovereign nations should consider green bonds as part of their ongoing fundraising mix and integrate a program of issuances into their portfolio. The initiative adopted by India in this direction is commendable. As climate change would continue to remain a threat to economic development and life on this planet, governments need to adopt practices that build resilience in the face of a changing climate. It is estimated that trillions of dollars would be required for assisting economies in countering the climate challenge. By creating a new market for climate finance through SGBs, governments can not only safeguard from climate-change related issues but can also support their Paris Agreement commitments (IFC, 2018). References: Ando, Sakai; Fu, Chenxu; Roch, Fransico & Wiriadinata, Ursula (2022). Sovereign Climate Debt Instruments: An Overview of the Green and Catastrophe Bond Markets. IMF Staff Climate Note. No.4. July. Climate Bonds Initiative (2018). Green Infrastructure Investment Opportunities. Indonesia & London. Doronzo, Raffaele; Siracusa, Vittorio & Antonelli, Stefano (2021). Green Bonds: The Sovereign Issuer’s Perspective. Bank of Italy, Markets, Infrastructures, Payment Systems Working Paper. No.3. International Finance Corporation (2018). Guidance for Sovereign Green Bond Issuers: With lessons from Fiji’s First Emerging Economy Sovereign Green Bond. World Bank Publication. March. Mosionek-Schweda, Magdalena & Szmelter, Monika (2019). Sovereign Green Bond Market: A Comparative Analysis. European Financial Law in Times of Crisis of the European Union. pp. 433–444. | 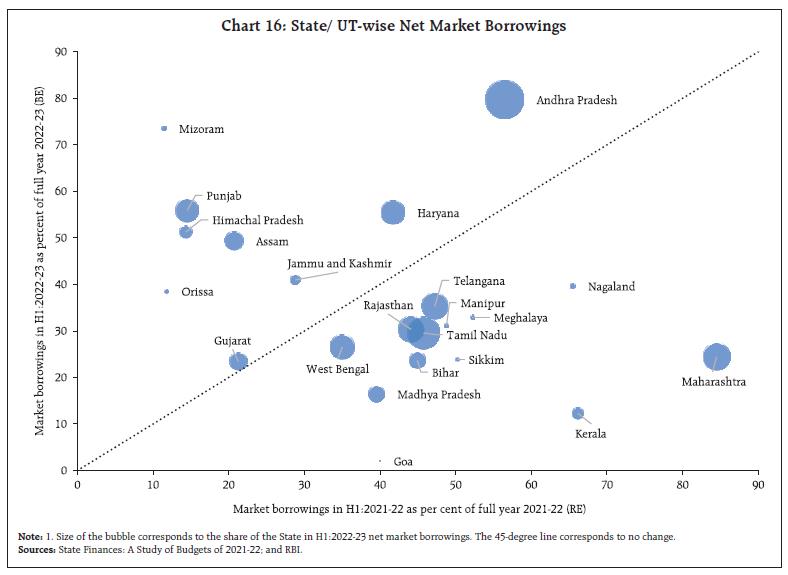 The financial accommodation availed by the States under various facilities provided by the Reserve Bank increased in H1:2022-23 by 20 per cent25 over the corresponding period of the previous year26. The average amount availed by the States under Ways and Means Advances (WMA), and Overdraft (OD) facilities declined by 21.9 per cent and 23.4 per cent, respectively, and that under the Special Drawing Facility (SDF) increased by 160 per cent. Except Himachal Pradesh, Haryana, Manipur, Meghalaya and Telangana rest of the states have seen a decline in their daily utilisation of WMA in H1:2022-23 over the same period in the previous year (Chart 17 a and b). IV. General Government Finances The general government GFD for 2022-23 is budgeted to consolidate to 9.4 per cent of GDP. In continuation of the effort to provide timely fiscal data on the general government, the quarterly fiscal position of the general government has been compiled till Q2:2022-23. Improved revenue mobilisation by the Centre and States has kept the general government GFD subdued in Q1 and Q2 of 2022-23. Going forward, while tax collections are expected to remain buoyant in H2, higher subsidy pay-outs by the Centre and a pick-up in States capex could result in a general government deficit of 9.3 per cent and 13.6 per cent of GDP in Q3 and Q4 (projected), respectively. Accordingly, the general government GFD is expected to increase from 6.4 per cent of GDP in H1:2022-23 to 11.5 per cent in H2: 2022-23 (Chart 18 a and b). V. Conclusion To sum up, the finances of the Central government as well as the States remained resilient in H1:2022-23 with receding negative spillover effects induced by the pandemic, even as the war in Europe has led to targeted fiscal measures to contain inflation and higher allocation for food and fertiliser subsidies. The Centre recorded robust tax collections, both direct taxes and GST reflecting sustained recovery of the economy, improved tax governance and administration as well as healthier balance sheet of the corporate sector. By reiterating its target of attaining GFD below 4.5 per cent of GDP by 2025-26, the Centre has exhibited its firm commitment to fiscal consolidation while at the same time prioritising capital expenditure to drive the recovery in growth and create a virtuous cycle to crowd in private investment. The States too have strengthened their fiscal parameters as is evident from the decline in their consolidated GFD and net market borrowings. However, the capital expenditure of the States has remained weak which is reflected in the deterioration of its expenditure quality. Going forward, the major challenge for both the Centre as well as States lie on the capex front. For the Centre, the current thrust provided for capex needs to be continued while also focussing on fiscal consolidation. For the States, it is imperative that they necessarily increase their capex due to its centrality in stimulating higher economic growth.
Appendix Tables | Table 1: Budgetary Position of the Central Government during April-September | | Item | (₹ thousand crore) | (Per cent) | | Actuals | Budget Estimates | Percent of BE | Y-o-Y Growth Rate | | 2022-23 | 2021-22 | 2022-23 | 2021-22 | 2022-23 | 2021-22 | 2022-23 | 2021-22 | | 1 | 2 | 3 | 4 | 5 | 6 | 7 | 8 | 9 | | 1. Revenue Receipts | 1169.6 | 1081 | 2204.4 | 1788.4 | 53.1 | 60.4 | 8.2 | 96.3 | | 1.1. Net Tax Revenue | 1012 | 920.7 | 1934.8 | 1545.4 | 52.3 | 59.6 | 9.9 | 100.8 | | 1.2. Non-Tax Revenue | 157.6 | 160.4 | 269.7 | 243.0 | 58.4 | 66.0 | -1.7 | 73.8 | | 1.3. Interest Receipts | 12.5 | 10.3 | 18 | 11.5 | 69.4 | 89.3 | 21.1 | 79.4 | | 2. Capital Receipts | 34.2 | 18.1 | 79.3 | 188.0 | 43.1 | 9.6 | 88.7 | 23.8 | | 2.1. Recovery of Loans | 9.6 | 9.0 | 14.3 | 13.0 | 67.2 | 69.3 | 6.6 | 1.7 | | 2.2. Other Receipts | 24.6 | 9.1 | 65 | 175.0 | 37.8 | 5.2 | 169.8 | 57.7 | | 3. Total Receipts (1+2) | 1203.7 | 1099.2 | 2283.7 | 1976.4 | 52.7 | 55.6 | 9.5 | 94.4 | | 4. Revenue Expenditure | 1480.7 | 1396.7 | 3194.7 | 2929.0 | 46.3 | 47.7 | 6.0 | 6.3 | | of which | | | | | | | | | | (i) Interest Payments | 436.7 | 365.2 | 940.7 | 809.7 | 46.4 | 45.1 | 19.6 | 19.5 | | 5. Capital Expenditure | 342.9 | 229.4 | 750.2 | 554.2 | 45.7 | 41.4 | 49.5 | 38.3 | | of which | | | | | | | | | | (i) Loans and Advances | 23.6 | 19.5 | 140.1 | 40.4 | 16.8 | 48.3 | 20.8 | 12.3 | | 6. Total Expenditure (4+5) | 1823.6 | 1626.0 | 3944.9 | 3483.2 | 46.2 | 46.7 | 12.2 | 9.9 | | 7. Revenue Deficit (4-1) | 311.1 | 315.6 | 990.2 | 1140.6 | 31.4 | 27.7 | -1.4 | -58.6 | | 8. Fiscal Deficit (6-3) | 619.8 | 526.9 | 1661.2 | 1506.8 | 37.3 | 35.0 | 17.7 | -42.4 | | 9. Gross Primary Deficit {8-4 (i)} | 183.2 | 161.6 | 720.5 | 697.1 | 25.4 | 23.2 | 13.3 | -73.4 | | Source: Office of the Controller General of Accounts, Ministry of Finance, Government of India. |
| Table 2: Quarterly Position of Central Government Finances | | Item | (₹ thousand crore) | (Per cent) | | Q1 | Q2 | Per cent of BE | Y-o-Y Growth Rate | | Q1 | Q2 | 2022-23 | | 2022-23 | 2021-22 | 2022-23 | 2021-22 | 2022-23 | 2021-22 | 2022-23 | 2021-22 | Q1 | Q2 | | 1 | 2 | 3 | 4 | 5 | 6 | 7 | 8 | 9 | 10 | 11 | | 1. Revenue Receipts | 568.1 | 540 | 601.5 | 541.1 | 25.8 | 30.2 | 27.3 | 30.3 | 5.2 | 11.2 | | 1.1. Net Tax Revenue | 505.9 | 412.7 | 506.1 | 508.0 | 26.1 | 26.7 | 26.2 | 32.9 | 22.6 | -0.4 | | 1.2. Non-Tax Revenue | 62.2 | 127.3 | 95.4 | 33.0 | 23.1 | 52.4 | 35.4 | 13.6 | -51.2 | 188.9 | | 1.3. Interest Receipts | 5.1 | 4.7 | 7.4 | 5.6 | 28.1 | 40.5 | 41.3 | 48.9 | 8.3 | 31.7 | | 2. Capital Receipts | 28.0 | 7.4 | 6.2 | 10.7 | 35.3 | 3.9 | 7.8 | 5.7 | 278.0 | -42.1 | | 2.1. Recovery of Loans | 3.4 | 3.4 | 6.2 | 5.6 | 24.0 | 26.2 | 43.2 | 43.1 | 0.5 | 10.3 | | 2.2. Other Receipts | 24.6 | 4 | 0.0 | 5.1 | 37.8 | 2.3 | 0.0 | 2.9 | 514.6 | -99.4 | | 3. Total Receipts | 596.0 | 547.4 | 607.7 | 551.8 | 26.1 | 27.7 | 26.6 | 27.9 | 8.9 | 10.1 | | 4. Revenue expenditure | 772.8 | 710.1 | 707.9 | 686.5 | 24.2 | 24.2 | 22.2 | 23.4 | 8.8 | 3.1 | | of which | | | | | | | | | | | | (i) Interest Payments | 228.6 | 184.3 | 208.1 | 180.9 | 24.3 | 22.8 | 22.1 | 22.3 | 24.0 | 15.0 | | 5. Capital expenditure | 175.1 | 111.5 | 167.8 | 117.9 | 23.3 | 20.1 | 22.4 | 21.3 | 57.0 | 42.4 | | of which | | | | | | | | | | | | (i) Loans and Advances | 14.1 | 6.6 | 9.5 | 12.9 | 10.1 | 16.4 | 6.8 | 31.9 | 112.6 | -26.5 | | 6. Total Expenditure | 947.9 | 821.6 | 875.7 | 804.4 | 24.0 | 23.6 | 22.2 | 23.1 | 15.4 | 8.9 | | 7. Revenue Deficit (4-1) | 204.8 | 170.2 | 106.4 | 145.5 | 20.7 | 14.9 | 10.7 | 12.8 | 20.4 | -26.9 | | 8. Fiscal Deficit (6-3) | 351.9 | 274.2 | 268.0 | 252.6 | 21.2 | 18.2 | 16.1 | 16.8 | 28.3 | 6.1 | | 9. Gross Primary Deficit {8-4 (i)} | 123.3 | 90 | 59.9 | 71.7 | 17.1 | 12.9 | 8.3 | 10.3 | 37.0 | -16.5 | | Source: Office of the Controller General of Accounts, Ministry of Finance, Government of India. |
| Table 3: Budgetary Position of the State Governments during April-September | | Item | (₹ thousand crore) | (Per cent) | | Actuals | Budget Estimates | Percent of BE | Y-o-Y Growth Rate | | 2021-22 | 2022-23 | 2021-22 | 2022-23 | 2021-22 | 2022-23 | 2021-22 | 2022-23 | | 1 | 2 | 3 | 4 | 5 | 6 | 7 | 8 | 9 | | 1. Revenue Receipts | 1155.9 | 1460.2 | 3132.7 | 3511.9 | 36.9 | 41.6 | 26.3 | 26.3 | | 1.1. Tax Revenue | 843.0 | 1114.4 | 2144.4 | 2457.6 | 39.3 | 45.3 | 30.9 | 32.2 | | 1.2. Non-Tax Revenue | 82.8 | 109.7 | 257.4 | 298.4 | 32.2 | 36.8 | 47.0 | 32.5 | | 1.3. Grants-in-aid and Contributions | 230.2 | 236.2 | 739.3 | 755.9 | 31.1 | 31.2 | 7.1 | 2.6 | | 2. Capital Receipts | 4.6 | 3.5 | 21.0 | 19.7 | 22.1 | 17.6 | 103.3 | -25.1 | | 2.1. Recovery of Loans and Advances | 4.5 | 3.4 | 14.4 | 13.7 | 31.5 | 24.6 | 103.6 | -25.5 | | 2.2. Other Receipts | 0.1 | 0.1 | 6.6 | 6.0 | 1.5 | 1.5 | 87.1 | -7.8 | | 3. Total Receipts | 1160.6 | 1463.7 | 3153.6 | 3531.6 | 36.8 | 41.4 | 26.5 | 26.1 | | 4. Revenue expenditure | 1306.6 | 1509.5 | 3292.8 | 3642.1 | 39.7 | 41.4 | 12.9 | 15.5 | | 4.1 Interest Payments | 153.7 | 185.7 | 415.3 | 446.9 | 37.0 | 41.5 | 6.2 | 20.8 | | 5. Capital expenditure | 183.0 | 195.8 | 633.7 | 721.6 | 28.9 | 27.1 | 73.8 | 7.0 | | 5.1 Capital Outlay | 168.7 | 172.3 | 580.6 | 662.3 | 29.1 | 26.0 | 77.3 | 2.1 | | 6. Total Expenditure | 1489.6 | 1705.3 | 3926.5 | 4363.7 | 37.9 | 39.1 | 18.0 | 14.5 | | 7. Revenue Deficit (4-1) | 150.7 | 49.3 | 160.1 | 130.2 | 94.1 | 37.9 | -37.8 | -67.3 | | 8. Fiscal Deficit (6-3) | 329.0 | 241.6 | 772.9 | 832.0 | 42.6 | 29.0 | -4.6 | -26.6 | | 9. Gross Primary Deficit (8 - 4.1) | 175.3 | 56.0 | 357.6 | 385.1 | 49.0 | 14.5 | -12.5 | -68.1 | Note: Data pertains to 23 States.
Source: Comptroller and Auditor General of India; Budget Documents of the States. |
| Table 4: Quarterly Position of State Government Finances | | Item | (₹ thousand crore) | (Per cent) | | Actuals | Per cent of BE | Y-o-Y Growth Rate | | Q1 | Q2 | Q1 | Q2 | 2022-23 | | 2021-22 | 2022-23 | 2021-22 | 2022-23 | 2021-22 | 2022-23 | 2021-22 | 2022-23 | Q1 | Q2 | | 1 | 2 | 3 | 4 | 5 | 6 | 7 | 8 | 9 | 10 | 11 | | 1. Revenue Receipts | 527.2 | 699.0 | 628.7 | 761.3 | 16.8 | 19.9 | 20.1 | 21.7 | 32.6 | 21.1 | | 1.1. Tax Revenue | 373.9 | 511.4 | 469.1 | 603.0 | 17.1 | 20.8 | 21.4 | 24.5 | 36.8 | 28.5 | | 1.2. Non-Tax Revenue | 37.6 | 58.6 | 45.1 | 51.1 | 14.9 | 19.6 | 17.9 | 17.1 | 55.9 | 13.3 | | 1.3. Grants-in-aid and Contributions | 115.7 | 128.9 | 114.5 | 107.2 | 15.7 | 17.1 | 15.6 | 14.2 | 11.4 | -6.4 | | 2. Capital Receipts | 2.1 | 2.0 | 2.5 | 1.4 | 10.1 | 10.4 | 12 | 7.2 | -3.3 | -43.4 | | 2.1. Recovery of Loans and Advances | 2.1 | 2.0 | 2.4 | 1.4 | 14.6 | 14.8 | 16.9 | 9.9 | -3.5 | -44.4 | | 2.2. Other Receipts | 0.0 | 0.0 | 0.1 | 0.1 | 0.2 | 0.3 | 1.3 | 1.2 | 22.6 | -13.8 | | 3. Total Receipts | 529.3 | 701.0 | 631.2 | 762.7 | 16.8 | 19.8 | 20 | 21.6 | 32.4 | 20.8 | | 4. Revenue Expenditure | 618.4 | 707.0 | 688.2 | 802.6 | 18.8 | 19.4 | 20.9 | 22 | 14.3 | 16.6 | | 4.1 Interest Payments | 66.2 | 81.7 | 87.6 | 103.9 | 15.9 | 18.3 | 21.1 | 23.3 | 23.4 | 18.6 | | 5. Capital Expenditure | 77.0 | 69.7 | 106.0 | 126.1 | 12.1 | 9.7 | 16.7 | 17.5 | -9.5 | 19.0 | | 5.1. Capital Outlay | 67.9 | 61.2 | 100.8 | 111.1 | 11.7 | 9.2 | 17.4 | 16.8 | -9.9 | 10.2 | | 6. Total Expenditure | 695.4 | 776.7 | 794.2 | 928.6 | 17.7 | 17.8 | 20.2 | 21.3 | 11.7 | 16.9 | | 7. Revenue Deficit | 91.2 | 8.0 | 59.5 | 41.3 | 57 | 6.2 | 37.2 | 31.7 | -91.2 | -30.6 | | 8. Fiscal Deficit (6-3) | 166.1 | 75.7 | 163.0 | 165.9 | 21.5 | 9.1 | 21.1 | 19.9 | -54.4 | 1.8 | | 9. Gross Primary Deficit (8 - 4.1) | 99.9 | -6.0 | 75.4 | 62.0 | 27.9 | -1.6 | 21.1 | 16.1 | -106.0 | -17.8 | Note: Data pertains to 23 States.
Source: Comptroller and Auditor General of India; Budget Documents of the States. |
|