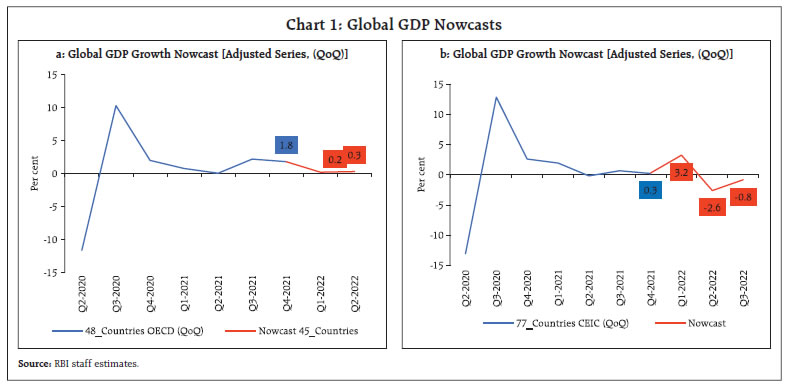
Aggressive and synchronised monetary tightening has further weakened global economic prospects as financial markets sold off, investors took fright and jettisoned risky assets. In India, broader economic activity has remained resilient and poised to expand further with domestic demand accelerating as the contact-intensive sectors are experiencing a bounce-back. Robust credit growth and fortified corporate and bank balance sheets provide further strength to the economy. Headline inflation is set to ease from its September high, albeit stubbornly, on the back of easing momentum and favourable base effects. These factors will entrench India’s prospects as one of the fastest growing economies of the world. Introduction Following the week beginning September 19, 2022 when eight central banks matched the US Fed in raising policy rates by a cumulative 500 basis points – and another went the other way by cutting rates - storm clouds darkened the horizon, posting the world into a dangerous, poli-crisis phase. Financial markets sold off, investors took fright and jettisoned risky assets, the World Bank warned of a devastating recession, and more recently, the International Monetary Fund has cautioned about a cost-of-living crisis affecting people around the world. More than 200 years of globalization is threatened by fragmentation, financial conflict and the spectre of inflation at levels and of a tenacity not seen in four decades. As central banks dig in, determined to bring inflation under control, hopes of an ‘immaculate disinflation’1 fade. Households and businesses lose hope and brace for pain. Are there risks of doing too much or too little? The US Fed’s Federal Open Markets Committee (FOMC) believes that ‘the cost of taking too little action to bring down inflation outweigh the cost of too much action’2. Yet several participants also noted that in the current highly uncertain global economic and financial environment, it would be important to calibrate the pace of further tightening with the aim of mitigating the risk of significant adverse effects on the economic outlook. Clearly, the risks have become two-sided and there is a greater sensitivity than before that the cumulative restraint on aggregate demand due to monetary policy actions could well exceed what is required to bring inflation to target. As Mark Twain once wrote, “it is not what you don’t know that kills you, its what you know for sure that ain’t true.” As in the early 1980s, the 1990s and in the summer of 2013 when the US tightened monetary policy or talked of it, emerging and developing countries are again particularly at risk and face an extremely daunting outlook. It is feared that the deadly cocktail of higher food, fertilizer and energy prices, outsized currency depreciations, capital flight, and the sharp slowdown in global growth is going to push more than 70 million people in these countries into abject poverty. In an influential view, the human consequences of these overlapping crises is catastrophic.3 By comparison, however, this time around they seem to be coping. They were first off the mark in tightening monetary policy, their currencies have fallen by less than their advanced economy peers, and their fundamentals and macroeconomic policy frameworks have improved relative to past episodes4, with bigger foreign exchange reserves and deeper local financial markets that help to absorb shocks. In fact, the IMF estimates that they have drawn down reserves to the extent of US $ 400 billion in the first half of 2022, but this is a small fraction of their cumulative holdings of US $ 4 trillion. For several of them, the descent of their currencies against the unrelenting strength of the US dollar has been more orderly than the tumbles experienced by even reserve currencies. The next 150 basis points of rate increases by the Fed will, however, test them and hence they remain on high alert. With CPI inflation in the US showing no signs of abating in the reading for September 2022 that was released on October 12, futures markets in the US are pricing in a 75 basis points increase in the target federal funds rate in November 2022 with close to 100 per cent probability. The risk of investors fleeing into US treasuries if turbulence intensified is real and present. For all countries, advanced and emerging alike, risks to financial stability have increased and some have materialized as recently in the UK. The IMF’s October 2022 Global Financial Stability Report alerts us about tightening financial conditions, deteriorating market liquidity, and snowballing financial vulnerabilities fuelled by years of ultra-low interest rates and cheap credit. In fact, as the GFSR points out, four frontier economies have already defaulted, eight low income countries (LICs) are in debt distress and 30 LICs are at high risk of debt crisis. The risk of a disorderly tightening of financial conditions confronting them is amplified by capital flows pulling back from these jurisdictions. An immediate concern is about the second order effects of aggressive monetary policy tightening - financial market contagion and sudden stops in credit markets setting off a more severe recession than currently anticipated. Another common risk is the rising frequency and intensity of extreme floods and droughts that have characterized 2022 so far. These events have collided with geopolitically induced threats to food and energy security. 2022 has turned to be the sixth warmest year on record5. In the view of the IMF, climate change poses a major threat to long-term growth and prosperity, and it has a direct impact on the economic well-being of all countries. Economies in south and southeast Asia are most vulnerable to the physical risks associated with climate change. They are also the countries that have most to gain if the world is able to rein in temperature increases. These economies will need significant climate financing in the coming years to reduce their emissions and adapt to the physical effects of climate change6. In contrast to the synchronized tightening of monetary policy worldwide alluded to earlier, the Reserve Bank of India (RBI) delivered a ‘perfect 50’ on September 30. Reading the move as in sync with expectations, markets in India broke away from the global pessimism and serenaded the increase in the policy rate to 5.90 per cent, with the Indian rupee appreciating over the previous day’s close, while bond yields remained steady and equities shed bearish sentiments to rise by 2 per cent on the same day. The monetary policy committee (MPC) was of the view that inflation is likely to be above the upper tolerance level of 6 per cent through the first three quarters of 2022-23, with core inflation remaining high. While the global outlook was seen as shrouded by considerable uncertainty, the MPC adjudged that domestic economic activity is holding up well and is expected to be buoyant in the second half of the year amidst consumer and business optimism. Accordingly, it felt that further calibrated monetary policy action is warranted to keep inflation expectations anchored, restrain the broadening of price pressures, pre-empt second round effects and support medium-term growth prospects. The MPC also decided to persevere with the withdrawal of accommodation to ensure that inflation aligns with the target going forward, while supporting growth. Broader economic activity has remained resilient and poised to expand further. Domestic demand is accelerating, with auto sales having rebounded, real estate sales on the rise in spite of a pick-up in borrowing costs and the contact-intensive hospitality services experiencing a bounce-back. Bank credit is increasing by double digits and the sustained surge in goods and service tax collections is signalling growing formalisation of the economy. Indian equities are outperforming both advanced and emerging peers. Selling by foreign portfolio investors is being more than matched by domestic institutional investors’ buying. Corporate and bank balance sheets have become fortified through the period of the pandemic. There is a view that India is likely to be among the few emerging economies that would be left standing after the global hurricane has passed. So, is India decoupling? Time will tell. For now, reasonably strong macrofundamentals by comparator comparison are being tested by the twin whammies of rising international interest rates and an inexorably strengthening US dollar. This is inflicting collateral damage – imported inflation and INR depreciation. Financial market notwithstanding and despite periodic revisions of forecasts by various agencies in India and abroad, the consensus seems to be that real GDP growth in India will clock 7 per cent or close to it in 2022-23. Some recent developments inspire this confidence. First, as foretold in the August issue of the State of the Economy, 5G was launched in India in several cities on October 1, 2022. Introduction of 5G technology is likely to be a game changer for Indian manufacturing and services sector with high data speed, low latency, high quality video services and highly reliable communications. 5G can also generate significant social benefits in terms of telesurgeries and real-time monitoring of disasters, precision agriculture, minimising the role of humans in dangerous industrial operations such as in deep mines, offshore activities and the like. Second, India is reshoring. The National Logistics Policy (NLP) launched on September 2022 aims to lower the cost of logistics to best international standards, increase the competitiveness of Indian products at home and abroad and increase efficiency across all sectors of the economy, thereby boosting value addition and enterprise. Coordination improvements will boost sector speed, value creation, and entrepreneurship. The Policy includes integration of digital systems, across road transport, railways, aviation, commerce ministries and foreign trade; a unified logistics interface platform that will ensure shorter and smoother cargo movement and enable the exchange of information confidentially on a real-time basis; and ease of logistics business through transparency and accessibility. A systems improvement group will monitor all logistics-related projects. The Policy is aimed at making India a global manufacturing powerhouse and pave its way to becoming a logistics hub. Third, in pursuance of the announcement made in the Union Budget 2022-23, 75 digital banking units (DBUs) in 75 districts of the country were dedicated to the nation on October 16, 2022. The DBUs will provide banking services and products in an efficient, paperless, secure and connected environment on a 24X7X365 basis in self-service mode. They will also be instruments of financial inclusion and financial literacy. Set against this backdrop, the remainder of the article is structured into four sections. Section II captures the rapidly evolving developments in the global economy. An assessment of domestic macroeconomic conditions is presented in Section III. Section IV reviews financial conditions in India, while the last Section concludes the article. II. Global Setting Downside risks to the global economic outlook have increased since the last edition of this article. Aggressive rate hikes and hawkish forward guidance by advanced economy (AE) central banks have accentuated financial stability risks to the global recovery that has started to stall in Q2:2022. GDP in several parts of the world has either started contracting or decelerating. The prolonged geopolitical conflict and the likelihood of a harsh winter have amplified energy and food price shocks. The International Monetary Fund in its latest World Economic Outlook (WEO), released on October 11, 2022 has projected global growth to slow from an estimated 6.0 percent in 2021 to 3.2 per cent in 2022 (unchanged from July 2022 WEO update) and 2.7 per cent in 2023 (revised down by 0.2 percentage points from July 2022 projection) [Table 1]. These forecasts factor in a number of turbulent challenges that the global economy faces including multi-decadal high inflation, tighter financial conditions, conflict in Ukraine, lingering COVID-19 pandemic and slowdown in China. Moreover, the global inflation is projected to rise to 8.8 percent in 2022 (revised up by 0.5 percentage points relative to July 2022 WEO update), then moderate to 6.5 percent in 2023 (revised up by 0.8 percentage points relative to July 2022 WEO update) and further ease to 4.1 percent by 2024 – reflecting confidence that inflation will recede with tighter monetary policy. Our model-based nowcast indicates that the contraction witnessed in Q2:2022 has likely extended into Q3:2022 (Chart 1: a and b).7 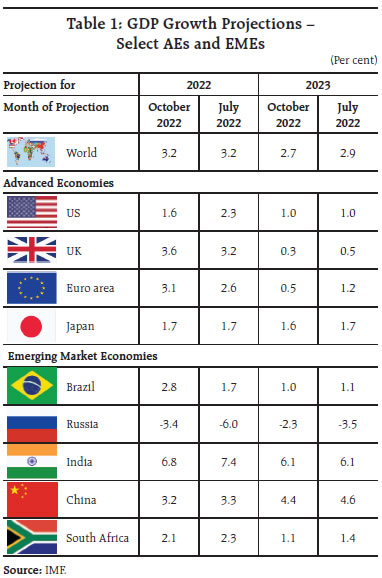
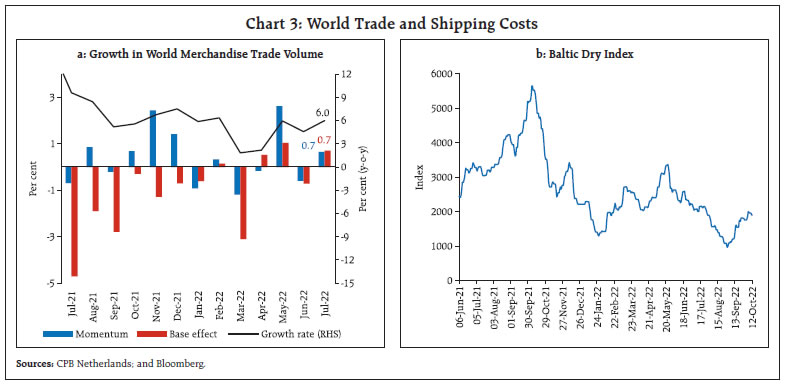
 Among high frequency indicators, global composite purchasing managers index (PMI) inched up marginally to 49.7 in September from August’s 26-month low of 49.3 as services business activity stabilised while manufacturing output declined. The global manufacturing PMI fell to 49.8 in September from 50.3 in August, lapsing into the contraction zone for the first time since June 2020. Output fell in intermediate and investment goods sectors while business optimism sank to a 28-month low (Chart 2). World merchandise trade volume rose by 6.0 per cent (y-o-y) in July 2022 from 4.6 per cent in June on the combination of a positive momentum and a favourable base effect (Chart 3a). Increased demand for vessels caused the Baltic Dry Index – a measure of shipping charges for dry bulk commodities – to rise by 82.4 per cent in September bucking the decline witnessed for the previous four consecutive months (Chart 3b). According to World Trade Organization (WTO), world merchandise trade volume is expected to grow 3.5 per cent in 2022 before slowing to 1.0 per cent in 2023 (downward revision of 2.4 per cent). PMI sub-indices also indicate a fall in the volume of new export business for the seventh consecutive month and receding international trade flows. 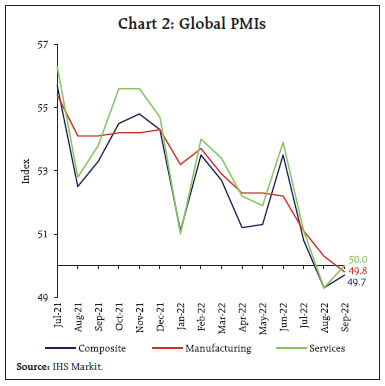
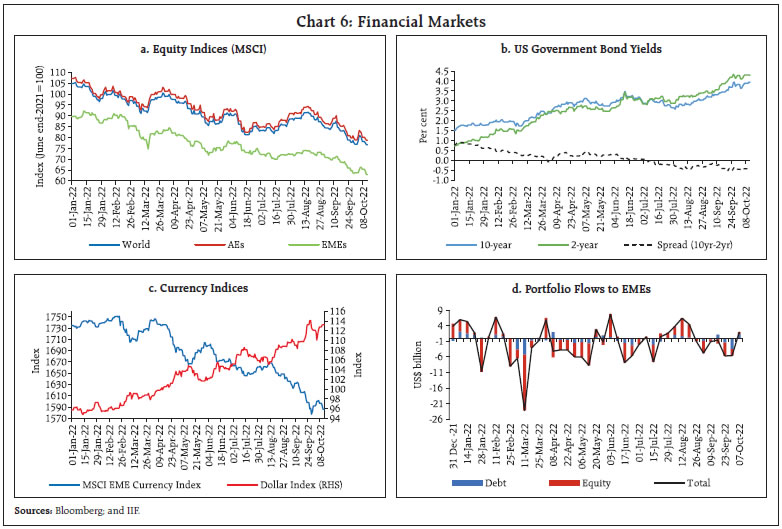
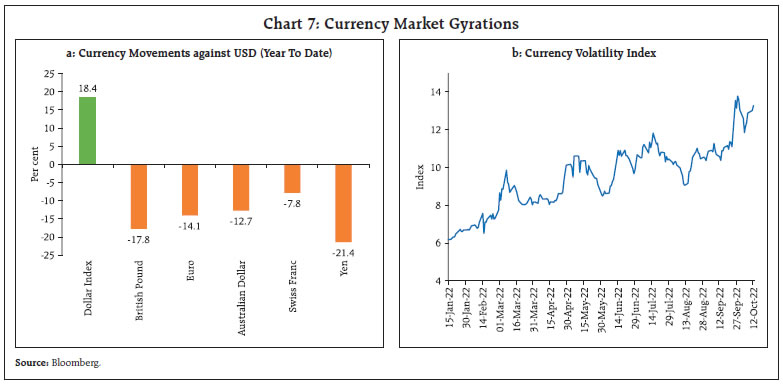
 Global commodity prices remained volatile, shedding 8.3 per cent by end-September as slowing global growth dampened demand (Chart 4a). Crude oil prices traded at an average of US$ 90 per barrel in September, their lowest in 7 months, and continued to decline till October 3 in response to slowing global demand and the monotonically strengthening US Dollar. Prices inched up as the OPEC plus cartel and the allied producers agreed to collectively reduce output by 2 million barrels per day or approximately 2 per cent of global consumption on October 5 (Chart 4b). Gold prices declined in September hitting a low of US$ 1,618 per troy ounce on September 28, lowest since April 2020, reflecting rising US 10-year G-sec yields (Chart 4c). In October so far, gold prices have been highly volatile, edging up marginally driven by safe haven demand. The FAO food price index registered its sixth consecutive monthly decline, dropping by 1.5 per cent in September 2022, marked by fall in all its sub-indices8 barring cereal sub-index (Chart 4d). The correction in vegetable oil prices has been the sharpest as they fell by 40 per cent from the historical high levels recorded in March 2022. 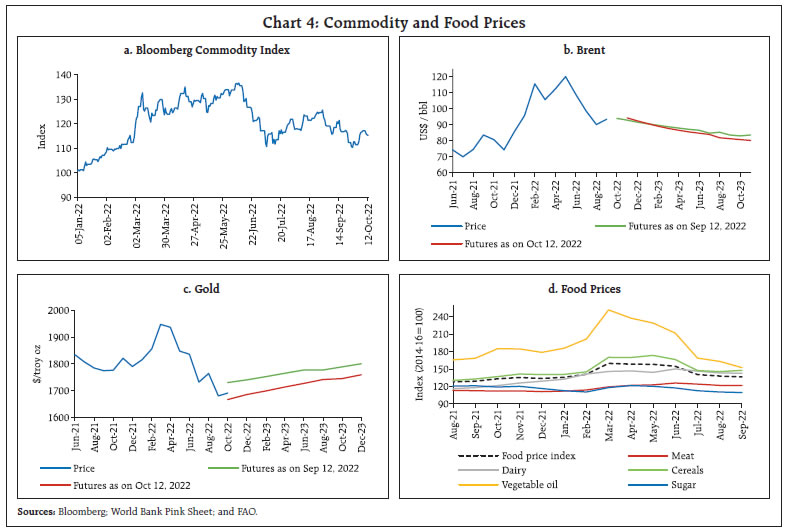 Elevated inflation remains the major policy concern for most economies even though the recent fall in commodity prices has led to inflation coming off peaks in many countries. The US headline CPI inflation (y-o-y) moderated to 8.2 per cent in September 2022 from 8.3 per cent in August while core CPI inflation firmed up to 6.6 per cent in September. Inflation based on the personal consumption expenditure (PCE) index (Fed’s preferred measure) was at 6.2 per cent y-o-y in August 2022, marginally down from 6.4 per cent in July on account of a favourable base effect (Chart 5a). In the Euro Area, annual inflation soared to a new peak of 10.0 per cent in September 2022, up from 9.1 per cent in August, led by energy, food, alcohol and tobacco. In the UK, CPI inflation was at 9.9 per cent in August, marginally down from 10.1 per cent in July due to the decline in the transport sub-index. Among the BRICS9 economies, inflation in Brazil eased to 7.2 per cent in September from 8.7 per cent in August, while in Russia it eased to 13.7 per cent in September from 14.3 per cent in August (Chart 5b). Global equity markets shed gains in the second half of September, with the MSCI world equity index ending the month 9.7 per cent lower than in August. The decline in the EME sub-index was much more pronounced than that for the AEs (Chart 6a). In the bond market, 10-year G-sec yields hardened across major AEs, reflecting central banks’ hawkish stances. The 10-year US treasury yield shot up by 64 basis points in September while the 2-year G-sec yield rose by 79 bps, leading to a steep inversion in the yield curve (Chart 6b). The US Dollar continued its rally in September on the Federal Reserve’s hawkish tone and on safe haven demand, reaching fresh 20-year highs. Concomitantly, the MSCI currency index for EMEs declined in September, exacerbated by capital outflows (Chart 6c & 6d). Heightened volatility in foreign exchange markets driven by bets on how aggressively the Fed will tighten monetary policy in the face of surging inflation has given a boost to the US dollar, while other currencies have been hit (Chart 7). The Deutsche Bank’s Currency Volatility Index –historical volatility index of the major G7 currencies – reached a multi-month high in October as central banks continue withdrawing liquidity. 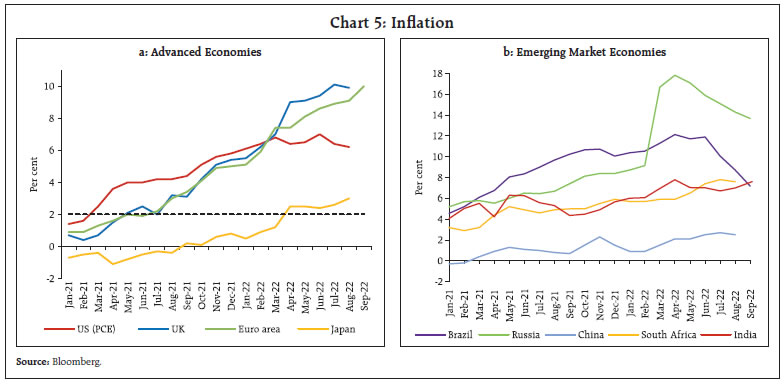
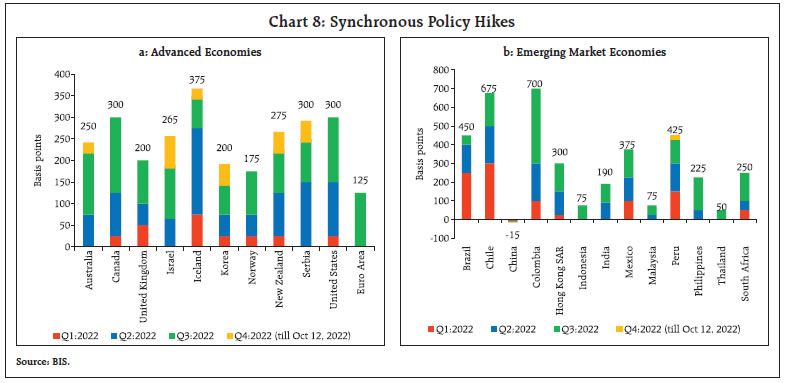 Central banks of most AEs and EMEs continued with synchronised monetary tightening to break the back of entrenched inflation pressures (Chart 8). During the month of September, the Federal Reserve increased its target range of the federal funds rate by 75 bps, its third consecutive 75 bps hike, with projections showing that the benchmark rate would rise to 4.4 per cent by the end of this year before peaking at 4.6 per cent next year. The European Central Bank (ECB) and Bank of Canada also front-loaded their monetary policy actions with 75 bps rate hikes. Sweden hiked its policy rate by 100 bps and Switzerland ended Europe’s negative rate era with a 75 bps rate increase. The UK, South Korea and New Zealand raised their policy rates by 50 bps each while Australia and Iceland raised their policy rates by 25 bps each in their latest meetings. Japan, on the other hand, has continued to diverge by maintaining an accommodative stance. Most EME central banks have also continued with policy tightening. Hungary, Chile and Thailand raised their policy rates by 125 bps, 50 bps and 25 bps, respectively, in their latest meetings. In contrast to other EMEs, Turkey cut its rate by 100 bps each in August and September and China remained accommodative while Brazil and Czech Republic have maintained a pause in their latest meetings. III. Domestic Developments In an uncertain and fragile global economic environment, the Indian economy showed resilience. Indicators of aggregate demand indicate that the onset of the festive season and pent-up demand kept growth impulses strong. Our economic activity index that employs a dynamic factor model (DFM) with 27 high frequency indicators nowcasts GDP growth for Q2: 2022-23 at 6.4 per cent (Chart 9). Several high-frequency indicators remain upbeat. The withdrawal of the south west monsoon has aided travel, hospitality and construction sectors. Electricity generation picked up in September (Chart 10). GST collections (Centre plus states) recorded a robust year-on-year (y-o-y) growth of 26.2 per cent and stood at ₹1.48 lakh crore in September 2022, surpassing ₹1.4 lakh crore for the seventh consecutive month (Chart 11). E-way bills generation recorded an all-time high of 84 million in September, on the back of increased economic and trading activity in the economy induced by festive season (Chart 12a). Toll collections too grew strongly both in volume and value terms (Chart 12b). Fuel consumption moderated across all categories in September due to seasonal maintenance of refineries (Chart 13a). Pent-up demand and easing of chip shortage elevated automobile wholesale dispatches to eleven-month high in September. This led to normalisation of sales for the entry level car segment and three-wheelers to pre-pandemic levels (Chart 13b).
Rural demand indicators picked up, with domestic sales of two wheelers, three wheelers and motorcycles increasing y-o-y as well as over pre-pandemic levels. Domestic tractor sales picked up sharply to an eleven-month high in September (Chart 13c). As per Federation of Automobile Dealers Associations (FADA), commercial vehicle sales registrations also increased in September, led by an increase in sales of heavy commercial vehicles due to bulk fleet purchases (Chart 13d). Sales of fast-moving consumer goods (FMCG) products increased by 12 per cent (y-o-y), driven by double digit growth in commodities and packaged food. Price corrections led to a sequential decline in value growth in September 2022, even as volume growth sustained in both urban and rural areas. As per the household survey of the Centre for Monitoring Indian Economy (CMIE), the unemployment rate fell to 6.4 per cent in September 2022, the lowest since August 2018 against the backdrop of a marginal improvement in labour participation and an increase in the employment rate to 36.8 per cent – the highest in the last four months (Chart 14). In terms of the organised sector employment outlook, the purchasing managers’ index (PMI) employment sub-index for manufacturing picked up registering an expansion for the seventh consecutive month. The services sector employment PMI remains in the expansionary zone for the fourth consecutive month albeit moderating from a 14-year high last month (Chart 15). In rural areas, demand for work under the Mahatma Gandhi National Rural Employment Act (MGNREGA) increased marginally in September, reflecting the ebbing of Kharif sowing. On a y-o-y basis, it declined by 33.4 per cent, indicating availability of better employment opportunities in the non-farm sector (Chart 16). India’s merchandise exports at US$ 35.4 billion recorded growth of 4.8 per cent on y-o-y basis, despite a sequential decline of 3.8 per cent in September, reflecting the knock-on effects of slowing external demand (Chart 17). During H1:2022-23 as a whole, however, merchandise exports at US$ 231.9 billion posted a robust growth of 17.0 per cent. In terms of broad categories, petroleum exports increased on y-o-y basis, reflecting the impact of the reduction of export taxes on petroleum products. Non-oil exports, on the other hand, contracted for the second consecutive month in September 2022. Engineering goods, constituting around a fourth of the export basket, declined for the third consecutive month, reflecting the impact of the export tax imposed on iron and steel products (Table 2). Textiles and cotton yarn were the other major groups which contracted on both sequential and y-o-y bases. Robust performance was recorded by exports of electronic goods and gems and jewellery, the latter benefitting from strong demand in the UAE post implementation of the Comprehensive Economic Partnership Agreement (CEPA).
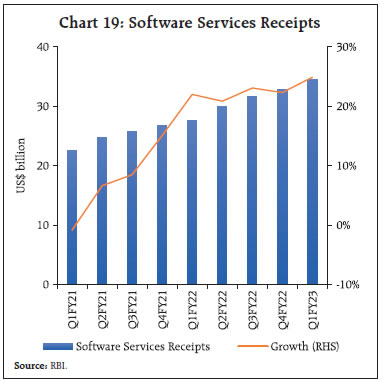
India and UK initiated free trade agreement (FTA) negotiations in January 2022. The fifth round of talks concluded in July 2022. India runs a merchandise trade surplus with the UK, with the major exports being apparel and clothing, machinery, pearls, precious and semi-precious stones, whereas key items imported from UK are stones, nuclear reactors, mineral fuels and oils (Chart 18). Exports of software services have been seeing steady growth of more than 20 per cent since Q1:2021-22, partly boosted by strong forward external trade linkages as reflected in the export intensity of foreign subsidiaries in India in the information technology (IT) sector alongside waning import intensity (Chart 19)10. Computer services account for over two-thirds of total software services exports. As per the Reserve Bank’s annual survey on exports of computer software and information technology enabled services (ITES) 2021-22, North America accounts for more than a half of total software exports, followed by Europe11. IT and business process outsourcing (BPO) services have been resilient in the pandemic. 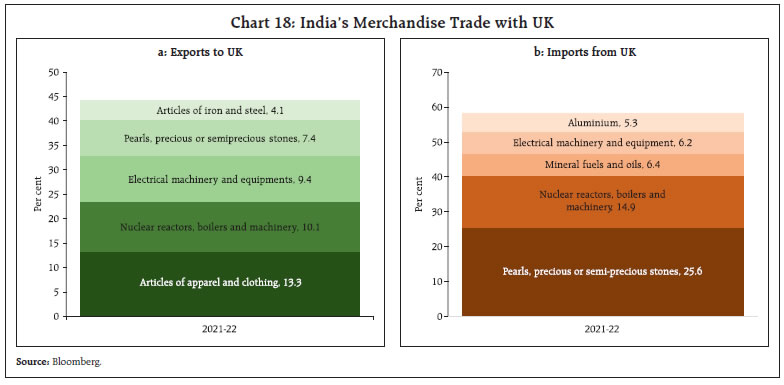
 India’s merchandise imports remained above US$ 60 billion for the fifth consecutive month in September 2022, however import growth moderated to 8.7 per cent on a y-o-y basis and declined sequentially by 3.8 per cent (Chart 20). During H1:2022-23, imports were US$ 380.3 billion, growing by 38.6 per cent. An analysis of the top 10 major commodity groups reveals that items such as crude products, electronic goods, machinery and chemicals witnessed contraction on a sequential basis in September (Table 3).
During April-September 2022-23 import of oil, gold, fertiliser, and coal, which together accounts for around 41 per cent of India’s total imports, recorded a robust growth, both in value and volume terms, exerting further pressure on the trade deficit (Chart 21).
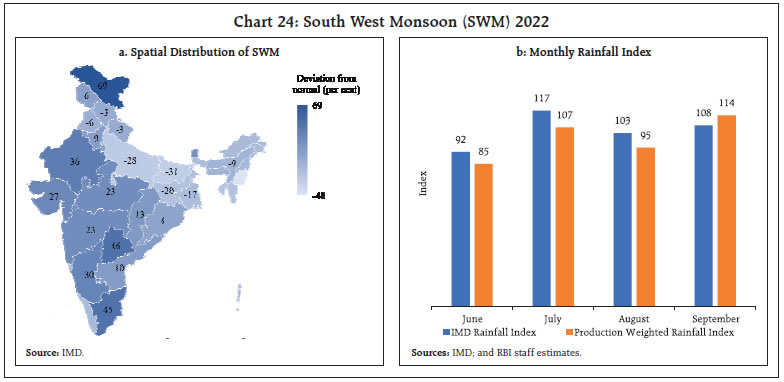
India’s trade deficit at US$ 25.7 billion in September 2022 was marginally lower on a sequential basis but was about 14.4 per cent higher than a year ago. The fiscal parameters of states improved during April-August 2022-23, with moderation in both the gross fiscal deficit (GFD) and the revenue deficit (RD) − both in absolute terms as well as proportions to budget estimate (BE) (Chart 22). This consolidation has been achieved primarily through the growth in revenue receipts by 28 per cent. Tax revenue, which accounted for 76 per cent of the revenue receipts in this period, grew at a robust pace of 32.9 per cent on the back of buoyant SGST collections and a sharp increase in tax devolution from the Centre (Chart 23). Non-tax revenue also posted a healthy y-o-y growth. Turning to states, capital outlay grew at a modest rate of 6.5 per cent during this period, recovering from a decline in Q1:2022-23. With strong growth in revenue receipts, pick up in interest-free 50-year loans under the scheme of Special Assistance to States for Capital Investment, and front-loading of tax devolution by the Centre, states are expected to step up their capital outlay in the latter half of 2022-23. Aggregate Supply The southwest monsoon (SWM) has begun to gradually withdraw from the Indian subcontinent. The total rainfall during the season (June 1 - September 30, 2022) was 6 per cent above the long period (1971-2020) average (LPA). Despite an early start, however, the temporal and spatial distribution of rainfall was uneven (Chart 24a). Geographically, except for east and north-east India (-18 per cent), all other regions of the country received above normal rainfall. Thirty out of the 36 meteorological sub-divisions recorded normal to above normal rainfall. The production-weighted rainfall index (PRN) stayed below the aggregate rainfall index of the Indian Meteorological Department (IMD) except for the month of September (Chart 24b). Kharif sowing caught up substantially in September and by the end of the month, the total sown area was 1102.8 lakh hectares, which was 1.8 per cent higher than the normal sown area but marginally lower by 0.8 per cent than last year’s average. 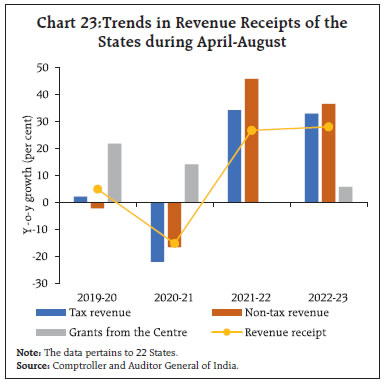
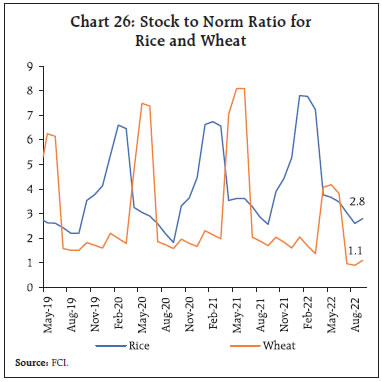
 The first advance estimates (1st AE) of the production of Kharif foodgrains for the year 2022-23 was placed at 149.9 million tonnes, which is lower by 0.4 per cent and 3.9 per cent over the first and fourth advance estimates for 2021-22 respectively. The lower production reflects the impact of uneven spatial and temporal distribution of the south-west monsoon with rice and oilseeds being most affected on account of the rainfall deficit in the major production regions (Chart 25). However, sugarcane and maize are estimated to touch record levels of production for the third and fourth consecutive years, respectively. The procurement of rice during the Kharif marketing season 2021-22 (up to October 13, 2022) at 592.7 lakh tonnes was lower by 1.4 per cent (y-o-y). The new Kharif marketing season 2022-23 has commenced with the procurement of 28.8 lakh tonnes so far. As per the quarterly buffer norms (October-December), stock levels of rice remained comfortable (2.8 times) as of October 01, 2022. In the case of wheat, the cumulative procurement of 187.9 lakh MT led to a total stock of 227.5 lakh MT which is 1.1 times; marginally above the prescribed buffer norms for the ongoing quarter (Q3:2022-23) (Chart 26). 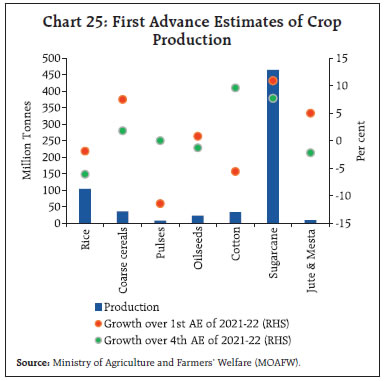
 The late revival of the south-west monsoon augurs well for the Rabi season. The surplus rainfall during July-September led to congenial soil moisture levels and reservoir storage conditions (Chart 27a). As on October 13, the reservoir level stood at 90 per cent of the full capacity, in comparison to last year’s level of 83 per cent and the decadal average of 77 per cent (Chart 27b). The availability of all major fertiliser groups and seed categories is in surplus, further brightening Rabi prospects (Chart 27c & 27d). In order to ensure adequate food security among the poor and vulnerable sections of the country, the Union Government has extended the “Pradhan Mantri Garib Kalyan Anna Yojana (PMGKAY-Phase VII)” till December. With a food grain offtake target of 122 lakh metric tonnes (LMT), this entails an additional outlay expenditure of ₹44,762 crore. Under phases I to VI, approximately a total of 927.8 LMT of food grains (576.2 LMT rice and 351.6 LMT Wheat) has been lifted so far (Upto September 18, 2022) (Chart 28). 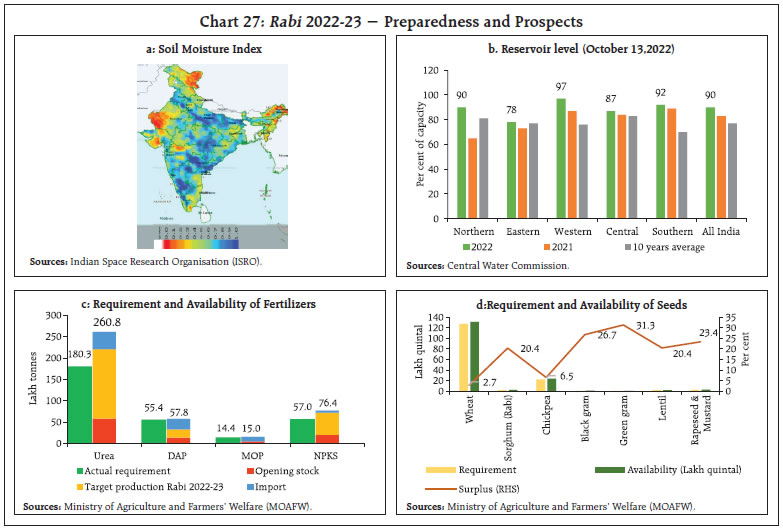 In the industrial sector, the headline manufacturing purchasing manager’s index (PMI) remained in the expansionary zone albeit at a lower pace as compared with the previous two months. Future output expectations were the highest since February 2015 while the input prices sub-component expanded at the slowest pace since October 2020, reflecting the recent fall in commodity prices (Chart 29a). Services PMI signaled strengthening of business expectations for the second consecutive month, climbing to its highest value since January 2015. Headline PMI services remained in the expansionary zone albeit moderated marginally from last month under the impact of sustained input price pressures, increasingly competitive environment, and interest rate hikes by advanced economies (Chart 29b). 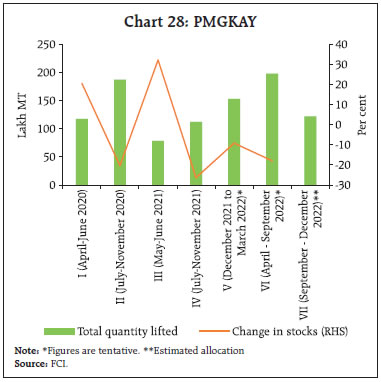 Higher post-tax profits12 recorded by the listed non-financial private corporate sector have helped it to maintain leverage and resilient performance. High-frequency data for the second quarter reflect sustained demand conditions supporting corporate sector performance. The credit ratio13 as measured by number of upgrades versus downgrades remained high at 5.5 times in the first half of 2022-23 (five times during H2:2021-22), pointing to the ongoing broad-based improvement in India Inc’s credit quality. The recent sharp moderation in international commodity prices bodes well for corporate profitability. 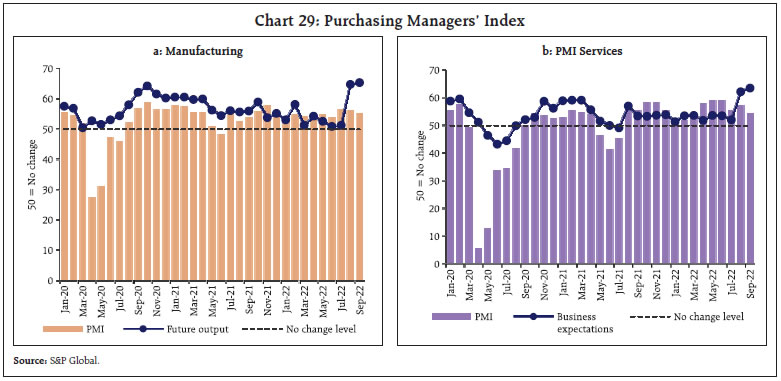
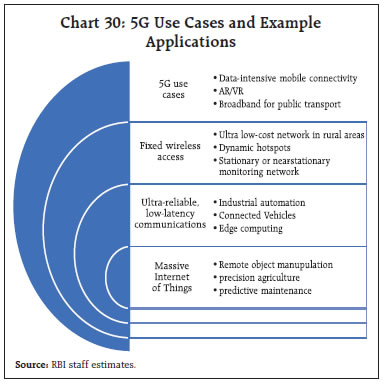 As per the estimates of Global System for Mobile Communications Association (GSMA), the adoption of 5G, which is likely to account for more than a third of total connections in India by 2030, is expected to contribute around US$455 billion to the Indian economy (0.6 per cent of GDP by 2040). The high 4G adoption rate (79 per cent) will provide a conducive environment for a faster 5G transition, crucial for industrial automation, connected vehicles, predictive maintenance and precision agriculture (Chart 30). In the services sector, transport sector indicators remained in expansion, with railway freight traffic earnings growing by 9.1 per cent (y-o-y) in September 2022 as compared to 7.9 per cent in the previous month (Chart 31a). While coal and iron ore dispatches recorded double-digit growth annually, food grains and pig iron declined. Cargo traffic at major ports recorded slight moderation in September owing to a decrease in containerized cargo and fertilizer raw material tonnage (Chart 31b).
In the construction sector, cement production and steel consumption continued to show an uptick. Steel consumption recorded a sustained growth over pre-pandemic levels for a year now, while cement production moderated in August as the extended monsoon slowed down construction activity, yet it recorded a double-digit growth over August 2019 (Chart 32). In October (up-to 12th October), activity in the passenger segment increased on a m-o-m basis, with a pick-up in festive demand in the domestic passenger segment. The cargo segment, however, contracted for both domestic and international freight (Table 4).
Inflation Data released by the National Statistical Office (NSO) on October 12, 2022 showed that inflation, measured by year-on-year (y-o-y) changes in the all-India consumer price index (CPI), increased to 7.4 per cent in September, up from 7.0 per cent in August (Chart 33a). This increase of 40 basis points (bps) in September was on account of a positive momentum (month-on-month increase in CPI) of about 60 bps, partly offset by a favourable base effect (month-on-month change in prices a year ago) of about 20 bps. All the three major components of the CPI reflected price pressures with m-o-m increases being of the order of 85 bps in the food and beverages group, 39 bps in the fuel group and 33 bps in the ‘core’ (excluding food and fuel) category (Chart 33b). Headline inflation was mainly pushed up by the sharp increase in CPI food inflation to 8.4 per cent in September from 7.6 per cent a month ago (Chart 34). Price pressures were most visible in the case of vegetables, spices and cereals. They also edged up in case of meat and fish, milk and pulses. On the other hand, price pressures softened in the case of edible oils, fruits, sugar and non-alcoholic beverages. Despite positive momentum, y-o-y inflation in respect of eggs continued to remain in the negative territory (Chart 35). Inflation in the fuel and light category moderated to 10.4 per cent in September from 10.8 per cent in August on account of favourable base effects that offset positive price momentum. A sharp decline in LPG and kerosene (PDS) inflation was partly offset by a pick-up in price pressures in other fuels (dung cake and firewood and chips). Despite the monthly increase by 1.6 per cent, electricity prices remained in deflation on a y-o-y basis. With a weight of 6.8 per cent in the CPI, the fuel group contributed 9.6 per cent of headline inflation in September. Core inflation edged up to 6.0 per cent in September from 5.9 per cent in August. While sub-groups such as recreation and amusement and personal care and effects witnessed moderation in inflation, pan, tobacco and intoxicants, clothing and footwear, housing, household goods and services, health, transport and communication and education registered an increase. In terms of regional distribution, rural inflation at 7.6 per cent was higher than urban inflation (7.3 per cent) in September 2022. Among the states, Andhra Pradesh, Madhya Pradesh, Maharashtra, Mizoram, Odisha, Telangana, Tripura, West Bengal and Lakshadweep experienced inflation in excess of 8 per cent whereas Goa, Manipur and Andaman & Nicobar Islands recorded inflation below 4 per cent (Chart 36). High-frequency food price data for October so far (October 1-12) from the Department of Consumer Affairs (DCA) point to a softening of prices of cereals, primarily on account of a decline in wheat prices. Pulses prices registered a broad-based decline other than for tur. Within edible oils, prices continued to decline for mustard oil and sunflower oil. Among key vegetables, onion and potato prices remained range-bound while tomato prices continued to harden due to heavy rains in August-September in key tomato producing areas, which resulted in lower mandi arrivals (Chart 37).
Retail selling prices of petrol and diesel in the four major metros remained unchanged in October. While kerosene prices moderated in September vis-à-vis August, it remained steady in October. LPG prices were kept unchanged in September and October so far (Table 5).
| Table 5: Petroleum Products Prices | | Item | Unit | Domestic Prices | Month-over-month (per cent) | | Oct-21 | Sep-22 | Oct-22^ | Sep-22 | Oct-22 | | Petrol | ₹/litre | 106.37 | 102.92 | 102.92 | 0.0 | 0.0 | | Diesel | ₹/litre | 97.92 | 92.72 | 92.72 | 0.0 | 0.0 | | Kerosene (subsidised) | ₹/litre | 34.56 | 57.55 | 57.55 | -8.3 | 0.0 | | LPG (non-subsidised) | ₹/cylinder | 907.71 | 1063.25 | 1063.25 | 0.0 | 0.0 | ^: For the period October 1-12, 2022.
Note: Other than kerosene, prices represent the average Indian Oil Corporation Limited (IOCL) prices in four major metros (Delhi, Kolkata, Mumbai and Chennai). For kerosene, prices denote the average of the subsidised prices in Kolkata, Mumbai and Chennai.
Sources: IOCL; Petroleum Planning and Analysis Cell (PPAC); and RBI staff estimates. | Input cost pressures increased in September 2022 across manufacturing and services, albeit at a slower pace, as reflected in the PMIs. Selling prices also edged up across manufacturing and services, with the services sector registering price increases higher than the long-term average. IV. Financial Conditions The outflow of advance tax receipts, coupled with forex outflows, moderated surplus liquidity conditions in September. The pick up in government spending in the beginning of October augmented liquidity somewhat. Accordingly, the average daily absorptions under the liquidity adjustment facility (LAF) moderated to ₹1.6 lakh crore during the second half of September through October 13, 2022 from ₹2.6 lakh crore during August 15 to September 14, 2022 (Chart 38). ₹1.1 lakh crore was absorbed through the overnight standing deposit facility (SDF), while the remaining was mopped up through variable rate reverse repo (VRRR) auctions (both main and fine-tuning). Tightening liquidity conditions also necessitated recourse to the marginal standing facility (MSF) window by banks intermittently of an average of ₹15,482 crore during mid-September to October 13 as against ₹2,654 during mid-August to September 14, 2022. The Reserve Bank conducted an overnight variable repo rate (VRR) auction for ₹50,000 crore on September 22, 2022 (bids received - ₹94,267 crore) at a cut-off rate of 5.58 per cent in order to ease liquidity strains. The 14-day VRRR auctions also elicited a muted response as evident in bids received of a mere ₹3,748 crore as against the notified amount of ₹2.0 lakh crore. In view of the moderation in surplus liquidity, the Reserve Bank announced merger of the 28-day VRRR with the fortnightly 14-day main auction in the monetary policy statement on September 30. At the same time, the Reserve Bank reiterated that fine-tuning operations of various maturities for absorption as well as injection of liquidity will continue as may be necessary from time to time. Furthermore, drawdown of excess cash reserve ratio (CRR) and excess statutory liquidity ratio (SLR) holdings of banks are also helping banks tiding over fund flow mismatches. 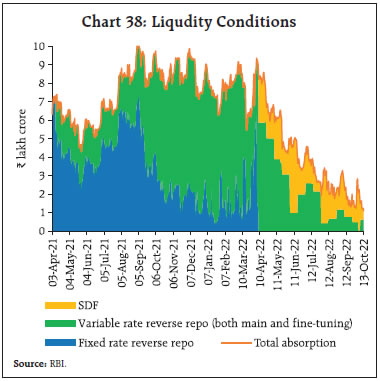 The weighted average call rate (WACR) traded 2 bps above the policy repo rate (on average) during the second half of September through October 13, 2022 indicating somewhat tightened liquidity conditions (Chart 39a). Similarly, rates in the collateralised segment surged, with triparty and market repo rates trading above the policy repo rate (Chart 39b). In the term money segment, rates on 3-month treasury bills (T-bill), 3-month certificates of deposit (CDs) and 3-month commercial paper (CPs) traded above the MSF rate by 13 bps, 41 bps and 86 bps, respectively. In the primary market, fund mobilisation through CD issuances has been robust at ₹2.96 lakh crore in H1:2022-23 (up to September 26), higher than ₹1.73 lakh crore in H2:2021-22, reflecting banks’ demand for additional funds to meet the buoyant credit offtake. On the other hand, CP issuances declined to ₹7.20 lakh crore during H1:2022-23 (up to September 26) from ₹10.09 lakh crore in H2:2021-22 as appetite for bank credit improved. 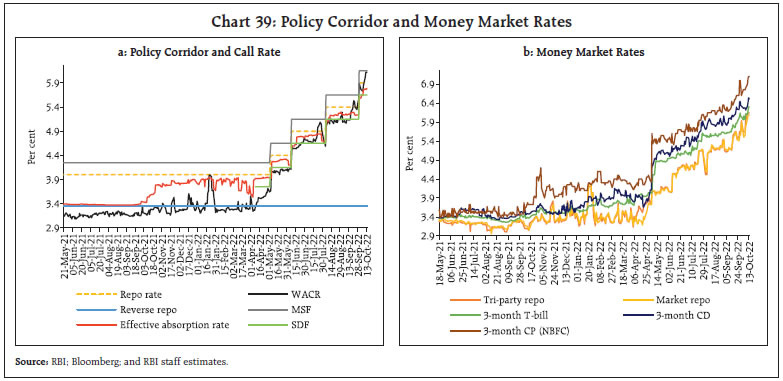 In the fixed income market, bond yields hardened across the yield curve, with the yield on the new 10-year benchmark G-sec (7.26 GS 2032) closing at 7.42 per cent on October 13, 2022 – higher than 7.13 per cent on September 14 (Chart 40a). Domestic yields took cues from the sharp surge in US treasury yields following the 75 bps rate hike by the US Fed and its hawkish forward guidance. The policy repo rate hike by the Reserve Bank also firmed up bond yields. Subsequently, the market sentiment was also dented after JP Morgan held off the inclusion of Indian government bonds in its widely tracked emerging market bond index. With the short-end of the curve exhibiting higher sensitivity to monetary policy tightening, the slope of the yield curve declined further (Chart 40b). While the upward shift in the level of the yield curve is consistent with a declining slope (as measured by the 10-year minus 2-year spread) since April, a perceptible decline in the curvature14 is evident since the May policy meeting, indicating subdued expectations of further policy tightening going ahead. Overall, the yield curve suggests an improvement in long-term growth prospects.15 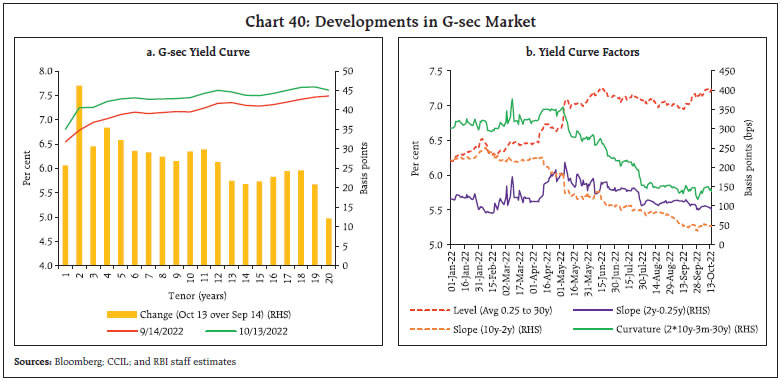 Corporate bond yields generally hardened in tandem with G-sec yields across tenors and the rating spectrum (Table 6). In the primary market, corporate bond issuances declined to ₹45,159 crore in August 2022 from ₹69,166 crore in the previous month and also stood lower than the issuance of ₹49,848 crore in August 2021. | Table 6: Financial Markets - Rates and Spread | | Instrument | Interest Rates (per cent) | Spread (bps) (Over Corresponding Risk-free Rate) | | Aug 17 - Sept 14 2022 | Sept 15 -Oct 13, 2022 | Variation (in bps) | Aug 17 - Sept 14 2022 | Sept 15 - Oct 13, 2022 | Variation (in bps) | | 1 | 2 | 3 | (4 = 3-2) | 5 | 6 | (7 = 6-5) | | Corporate Bonds | | | | | | | | (i) AAA (1-year) | 6.89 | 7.01 | 12 | 43 | 14 | -29 | | (ii) AAA (3-year) | 7.35 | 7.75 | 40 | 43 | 47 | 4 | | (iii) AAA (5-year) | 7.46 | 7.70 | 24 | 31 | 23 | -8 | | (iv) AA (3-year) | 8.09 | 8.50 | 41 | 116 | 122 | 6 | | (v) BBB-(3-year) | 11.76 | 12.15 | 39 | 483 | 487 | 4 | Note: Yields and spreads are computed as monthly averages.
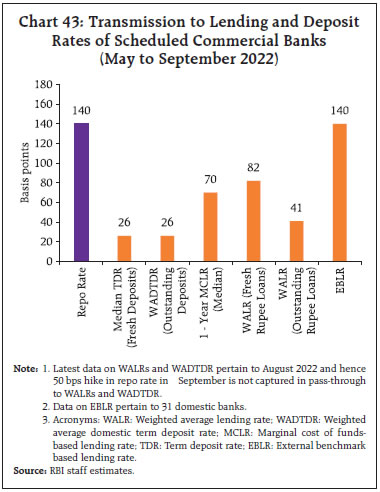
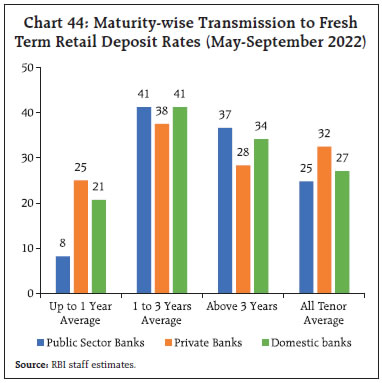
Source: FIMMDA; and Bloomberg. | Reserve money (RM) excluding the first-round impact of change in cash reserve ratio (CRR) rose by 8.9 per cent on a y-o-y basis as on October 7, 2022 (8.7 per cent a year ago) [Chart 41]. Currency in circulation (CiC), the largest component of RM, recorded growth of 8.3 per cent (8.9 per cent a year ago). Money supply (M3) registered growth of 8.6 per cent as on September 23, 2022 (9.3 per cent a year ago), primarily driven by its largest component – aggregate deposits with banks – which grew by 8.7 per cent (9.4 per cent a year ago). Scheduled commercial banks’ (SCBs’) credit accelerated to 16.4 per cent as on September 23, 2022 (6.7 per cent a year ago), which is the highest since October 18, 2013 (16.3 per cent). The pick-up in bank credit growth was led by the term loans category. With economic activitiy gaining momentum, growth in bank credit for working capital16 has also caught up in recent months reflecting an optimistic outlook for demand conditions (Chart 42). During May to September 2022, banks have increased their external benchmark based lending rates (EBLRs) by 140 bps in response to the increase in repo rate. SCBs have also increased their 1-year median marginal cost of funds-based lending rate (MCLR) by 70 bps during the same period. The upward revisions in benchmark rates for loan pricing and an increase in the share of EBLR-linked loans have improved the pace of transmission to lending rates.17 Subsequently, weighted average lending rates (WALRs) on fresh and outstanding rupee loans increased by 82 bps and 41 bps, respectively, during May-August 2022 (Chart 43). In response to the 50 bps policy rate hike in the September 30 MPC meet, banks have started adjusting their repo-linked benchmark rates upward. Banks have been quicker in adjusting their lending rates vis-à-vis retail deposit rates. The median term deposit rate of SCBs, which reflects the prevailing card rates on fresh deposits, increased by 26 bps during May-September 2022. Transmission to the median term deposit rate on fresh deposits of domestic banks has improved to 27 bps during the same period. The extent of pass-through to term retail deposit rates, however, has been higher for longer tenor maturities (Chart 44). The Government of India has also reviewed the rates on small savings instruments (SSIs) on September 29, 2022 and revised them upwards by 10-30 bps. The prevailing interest rates are, however, 44-77 bps below the formula-based rates for Q3:2022-23.18 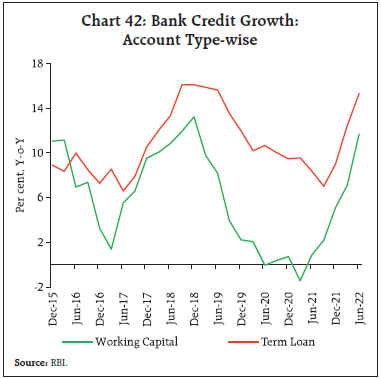
 The domestic equity market went through sell-off, with the BSE Sensex declining by 4.2 per cent in the second half of September 2022 as rate hikes by central banks in major AEs and concerns over global growth weighed on market sentiments (Chart 45a). Foreign portfolio investors (FPIs) turned net sellers to the tune of ₹13,406 crore in September 2022 after remaining net buyers in the previous two months. Flows from domestic institutional investors (DIIs), however, remained strong, aggregating to ₹14,120 crore in the equity segment. Despite the recent correction, the Indian equity market remains an outperformer among peer EMEs (Chart 45b).19 In October, equity markets have remained volatile so far. Markets rebounded initially as FPIs turned net buyers in the first week; however, pared the gains subsequently tracking weak global cues. Overall, the BSE Sensex has declined 0.3 per cent so far in October 2022 to close at 57,235 on October 13, 2022. 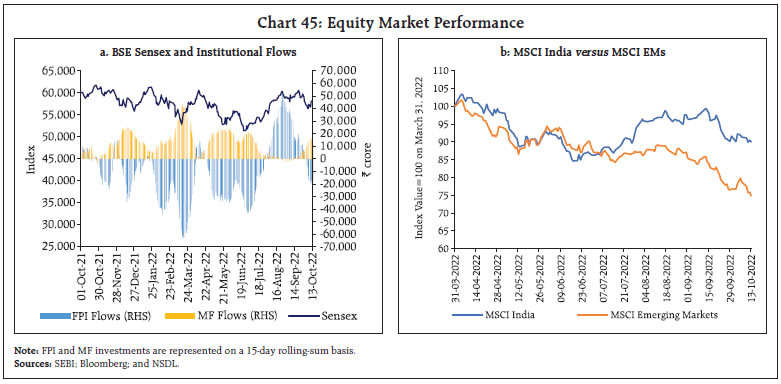
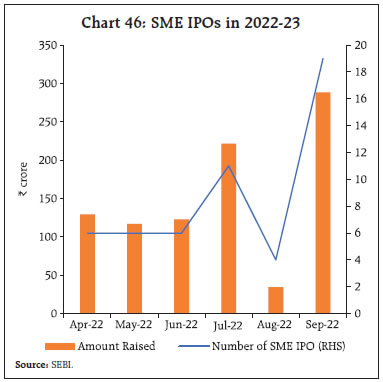 Fund-raising plans through equity markets remained lackluster as only 17 companies raised ₹35,847 crore via mainboard initial public offerings (IPOs) so far in 2022-23 (up to September 2022), which also includes over ₹20,000 crore raised by the Life Insurance Corporation of India. However, in sharp contrast to activity in the main board segment, the small and medium enterprises (SME) segment exhibited substantial activity in September 2022, with 19 companies (the highest number since May 2018) raising funds via IPOs20 (Chart 46). Progress towards broadening the investor base, reducing the information asymmetry for investors, and adequate aftermarket liquidity in the small and medium-sized enterprises (SME) platform can act as an enabler to further boost the entrepreneurial ecosystem.21 Gross inward foreign direct investment (FDI) at US$ 34.1 billion during April-August 2022 moderated from its level a year ago (Chart 47). However, net FDI increased to US$ 19.3 billion during this period from US$ 18.2 billion a year ago, on account of a decline in outward FDI from India. Manufacturing, communication services, computer services, retail and wholesale trade sectors and financial services received the major share of FDI equity inflows during April-August 2022. Disinvestment by FPIs in the second half of September led to net outflows of US$ 1.4 billion during the month (Chart 48). Volatile sentiments in global markets, fears of global recession and aggressive rate hikes by the US Fed triggered the risk-off sentiments, with major EMEs reporting net outflows in September. In October 2022 (till 12th) net sell off by FPIs were to the tune of US$ 0.5 billion. Gross disbursements of external commercial borrowings (ECBs) to India at US$ 7.8 billion during April-August 2022 moderated as compared with US$ 9.9 billion a year ago while on a net basis (i.e., excluding repayments and inter-company borrowings), ECBs recorded net outflows of US$ 2.6 billion as against net disbursement of US$ 3.0 billion in the previous year. The weighted average maturity of ECBs registered during August 2022 stood at 7.3 years (4.6 years in July 2022), with more ECB agreements related to new projects/modernisation (Chart 49). 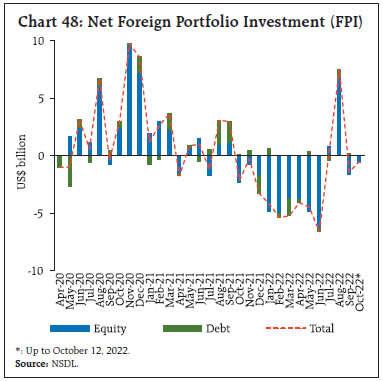 The foreign exchange reserves at US$ 532.9 billion as on October 7, 2022 were equivalent to 8.7 months of imports projected for 2022-23 (Chart 50). So far, in 2022-23, the reserves have been depleted by US$ 74.4 billion; however, most of the depletion was on account of valuation loss due to the appreciation of the US dollar against major currencies. Globally foreign currency reserves are falling at a record pace as central banks across the globe intervene to support their currencies. According to the IMF’s COFER,22 reserves have declined by around US$ 884 billion during the first half of 2022 (Chart 51).
In the foreign exchange market, the Indian rupee (INR) depreciated by 0.8 per cent vis-à-vis the US dollar (m-o-m) in September 2022 on the back of FPI equity outflows and strong US dollar. As compared to major EMEs, however, the INR continues to show a modest depreciation against the US dollar (Chart 52). In real effective terms, the INR appreciated by 1.0 per cent (m-o-m) in September 2022, mainly due to appreciation of the INR in nominal effective terms (Chart 53). Payment System Digital transactions continued advancing across various payment modes in September 2022. Transactions under large-value and retail modes recorded double digit growth (y-o-y) on a higher base a year ago (Table 7). A recent survey report indicates that around 93 per cent of the respondents in India used at least one mode of digital payments as of April 2022.23 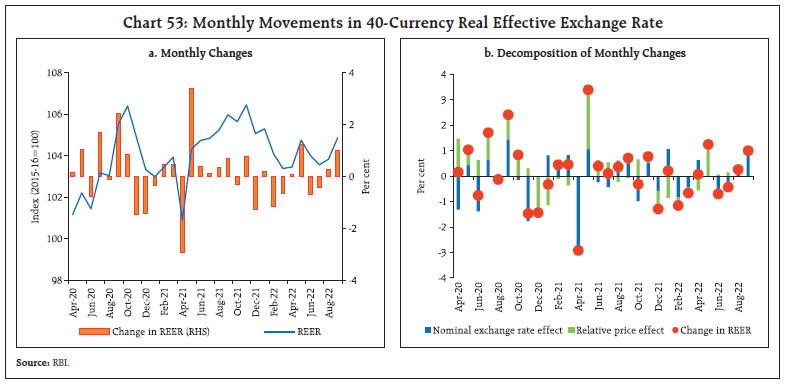
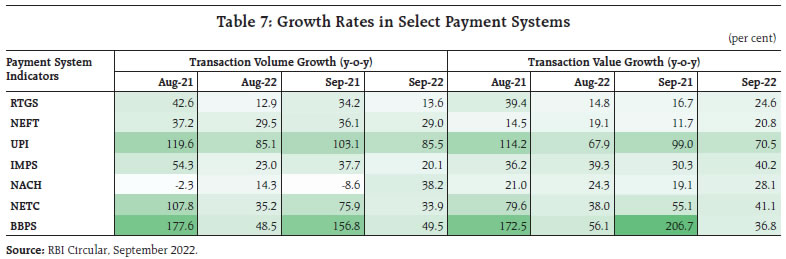 Reflecting the meteoric rise in Unified Payments Interface (UPI) based payments, peer-to-merchant (P2M) payments have soared by 112 per cent (volume) and 103 per cent (value) in September 2022, as against the growth of 63 per cent in both volume and value observed in the peer-to-peer (P2P) segment.24 The bulk of the P2M and P2P volumes is in the ₹0-500 transaction band (i.e., 83 per cent and 56 per cent, respectively), followed by the ₹501-2000 slab (Chart 54a and 54b). Increasing volumes in ₹0-500 slab in the P2M segment indicates growing inclusivity of UPI transactions that can further foster the access to credit for small merchants and unorganised segments through creation of online transactional trails. In the cards segment, average ticket size of credit card transactions at e-commerce outlets (₹5948) exceeded point of sale (PoS) transactions (₹3363) by 76 per cent. With the rising number of e-commerce users in tier-2 cities and rise of new e-commerce models25, the usage of credit card transactions is likely to go up. The Bharat Bill Payment System (BBPS), an interoperable and accessible platform for payment of bills, grew impressively in September with significant growth in loan repayment and direct-to-home recharge sub-segments. 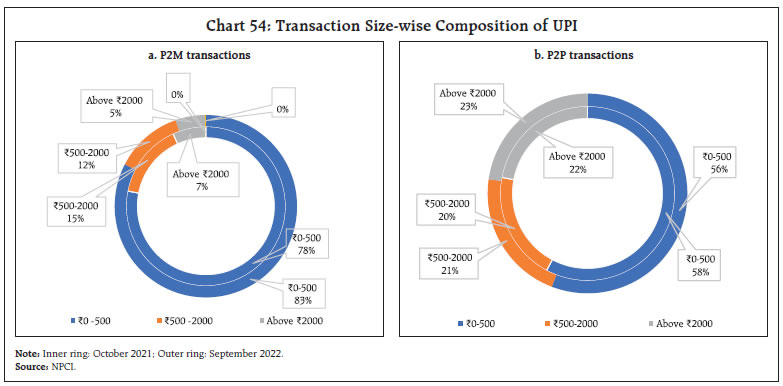 To bring in synergy in regulation, apart from convergence on standards of data collection and storage, the Reserve Bank has proposed to bring the offline Payment Aggregators (PAs) into the regulatory framework.26 The Reserve Bank, in collaboration with the stakeholders, launched three initiatives. First is the launch of a UPI Lite feature (a pre-approved payment solution used to carry out very small value transactions using on-device wallets).27 Second is a feature to link credit cards to the UPI, which is aimed at further boosting UPI usage. Third is the decision to allow inward remittances of bill payments through BBPS.28 The NPCI International Payments Limited (NIPL) has partnered with international payment players, aimed at enabling active Indian UPI IDs to transact at select QR locations across the globe.30 On October 7, 2022 the Reserve Bank released a Concept Note on Central Bank Digital Currency (CBDC) for India to create awareness about CBDCs in general and the planned features of the Digital Rupee (e₹) – India’s proposed CBDC – in particular. It was also indicated that the Reserve Bank will soon commence pilot launches of e₹ for specific use cases. Conclusion Looking ahead, India is poised to consolidate and accelerate the recovery over the rest of the year. The momentum of real GDP growth is expected to shed the drag embedded in the NSO’s estimates for the first quarter of 2022-23 and move into positive territory in the remaining quarters, including on a seasonally adjusted basis. Although this may not be evident in year-on-year growth rates due to unfavourable base effects, q-o-q annualised rates will reflect the underlying recovery. Contact-intensive sectors will likely lead the rejuvenation as the restraint due to the pandemic waned. Festival-related spending is already boosting consumption demand with positive externalities for other components of domestic demand. Headline inflation is set to ease from its September high, albeit stubbornly, on the back of easing momentum and favourable base effects. These positive developments are likely to be driven by the food and beverages, which has undergone repeated shocks in the first half of the year. These impulses are already evident in daily data alluded to in Section III. There has also been an appreciable decline in WPI inflation in September on a broad-based easing across its constituents. Easing in international price pressures embodied in commodity and supply chain pressures are also likely to contribute to the softening of costs and prices. While the persistence of headline CPI inflation above the tolerance band for three consecutive quarters (up to September) will trigger mandated accountability processes, monetary policy remains focussed on re-aligning inflation with the target. This may involve two milestones – first, bringing it within the tolerance band and second, lowering to around its mid-point. This trajectory will likely be gradual in view of the repeated shocks to which inflation has been subjected by both epidemiological and geopolitical causes, but the easing of inflation will inject confidence into both consumers and businesses, recharge animal spirits and investment and improve the international competitiveness of India’s exports. The fight against inflation will be dogged and prolonged, given the long and variable lags with which monetary policy operates, and fraught with uncertainties. Yet, if we succeed, we will entrench India’s prospects as one of the fastest growing economies of the world enjoying a negative inflation differential with the rest of the world. This happy outcome will re-enthuse foreign investors, stabilise markets and secure financial stability on an enduring basis. As Kristalina Georgieva, Managing Director, IMF, remarked at a media briefing during the recent IMF-World Bank annual meeting: “India deserves to be called a bright spot on this otherwise dark horizon”.
|