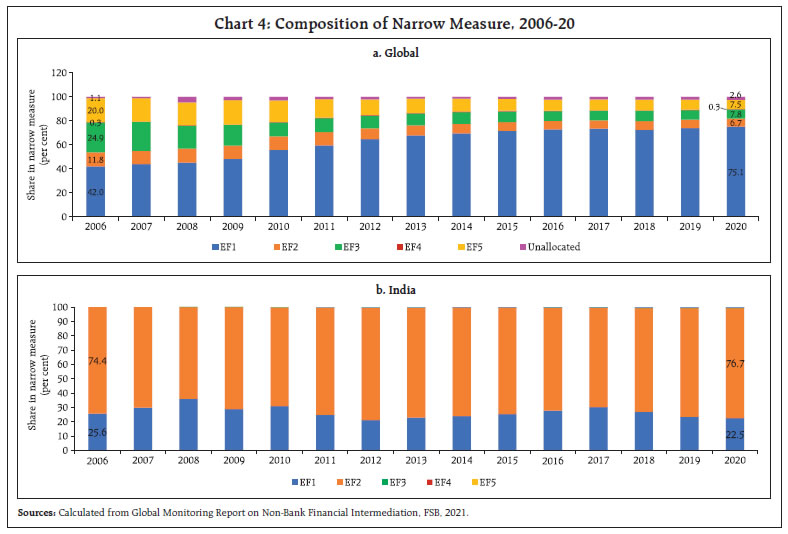
The consolidated balance sheet of the NBFC sector exhibited double digit growth in quarter-ending December 2021, buoyed by an uptick in the economy. Credit disbursement grew at a robust rate in the same period. NBFCs focused more on investments as indicated by their growth rates, which exceeded credit growth in all quarters during 2021-22 so far. An improvement in profitability indicators of NBFCs at end-December 2021 reflects the waning impact of the pandemic. Asset quality, however, deteriorated when compared to the corresponding quarter in 2020-21. Going forward, the recent regulatory initiatives are expected to strengthen the NBFC sector. I. Introduction There has been a rapid expansion of the global financial system, spurred by differential regulation, technological and financial progress, and innovative business models. In this milieu, the footprint of non-bank financial intermediaries (NBFIs)1 has expanded considerably, accounting for almost half the global financial assets in 2020 (FSB, 2021). In emerging market economies (EMEs) like India, non-banks have established themselves as an integral and indispensable part of the financial landscape. They further the financial inclusion agenda by complementing the mainstream banking system. They are adept at gauging the differential needs of their customers and offer tailored financial products and solutions (RBI, 2021). Non-banks have also hopped on the ‘digital bandwagon’, which is transforming India’s financial sector, particularly since the COVID-19 pandemic. Having benefitted from lighter and differential regulation vis-à-vis banks, non-banks foster innovation and spur competitiveness in the financial sector, ultimately benefitting the consumers. Non-banking financial companies (NBFCs), which existed in India from the pre-independence period, got a fillip after the bank nationalisations in 1969 and 1980 following which banks accorded higher priority to developmental objectives. It was left to the private sector to cater to retail financial and investment activities and NBFCs filled this vacuum (IMF, 1998). The rapid growth of the NBFC2 sector in India in recent times has important implications for financial stability. As the largest borrowers from the financial system, NBFCs are meshed into a web of inter-linkages with banks, capital markets and other financial entities (FSR, 2021). Considering this increasing interconnectedness, the existing regulations governing NBFCs were overhauled. The Reserve Bank is set to implement Scale Based Regulation (SBR) and Prompt Corrective Action (PCA) Framework for NBFCs from October 2022. These regulations aim at creating a strong and resilient financial system while ensuring that the diversity and flexibility of NBFCs are preserved. In view of the growing importance of the NBFC sector in India’s financial ecosystem, this article looks at the performance of select NBFCs in 2021-22 up to December 2021 following the second wave of the pandemic using the supervisory data filed by NBFCs on the eXtensible Business Reporting Language (XBRL) platform3. The rest of the article is divided into the following sections. Section II provides an international perspective on NBFIs and discusses India’s place in the global NBFI space. Section III provides a detailed overview of the NBFC sector in India. Sections IV and V provide an assessment of the NBFC sector’s balance sheet and off-balance sheet items, respectively. Section VI evaluates the financial performance, asset quality and capital adequacy of the sector. Section VII digs a little deeper to examine the sectoral deployment of credit and delinquencies therein. Section VIII concludes and highlights issues relating to future developments in the sector. II. International Experience in Non-banking Financial Intermediation The Great Financial Crisis (GFC) exposed the pitfalls in the international financial architecture, particularly in regulation and supervision of systemically important entities and in assessment of their risks and vulnerabilities (Claessens, Dell’Ariccia, Igan, & Laeven, 2010). Therefore, G-20 group mandated the Financial Stability Board (FSB) to develop a comprehensive framework for regulation and oversight of the global financial system. One of the priority reform areas is enhancing the resilience of NBFIs, under which the FSB conducts an annual monitoring exercise to identify the build-up of systemic risks in NBFIs and undertake corrective action when required. In the aftermath of the GFC, as banks started deleveraging and cleaning up their balance sheets especially in the United States (US) and Europe, NBFIs took up the space vacated by banks (CGFS, 2018). As a result, globally, the sector witnessed an expansion, growing from USD 58 trillion in 2002 to 226 trillion in 20204, providing an alternative to bank financing. Their share in global financial assets increased from 44 per cent in 2002 to 49 per cent in 2020 (Chart 1). 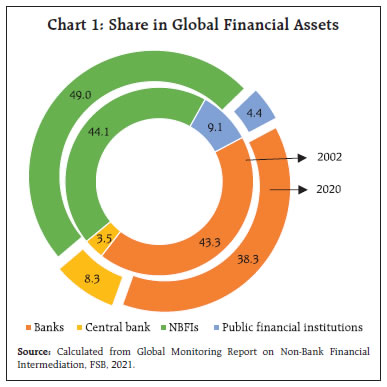 Advanced economies (AEs) account for the bulk of the global NBFI assets. The US had the largest NBFI sector in the run up to the GFC (Kodres, 2012), after which its share in global NBFIs moderated and that of other AEs increased. Nevertheless, it continues to account for over one-third of the total NBFI assets in 2020. On the other hand, the share of EMEs increased from 0.8 per cent to almost 11 per cent between 2002 and 2020. This was primarily driven by China, where shadow banking activities mushroomed after regulatory constraints were imposed on traditional banking as a response to the GFC (Bowman et al., 2018). India is a small player at the global level, accounting for 0.7 per cent of the global NBFI assets in 2020 (Chart 2). However, the size of the NBFI sector as a share of India’s GDP has increased from 18 per cent in 2002 to over 60 per cent in 2020, which highlights the increasing importance of the sector in India’s financial landscape (Chart 3). To capture the extent to which NBFIs pose bank-like financial stability risks, the FSB has developed a “narrow measure”, which classifies NBFIs into five economic functions (EFs) or activities5. While globally, the narrow measure represents around 28 per cent of NBFI assets, in India it is around 45 per cent as per the data for 2020 (Table 1). 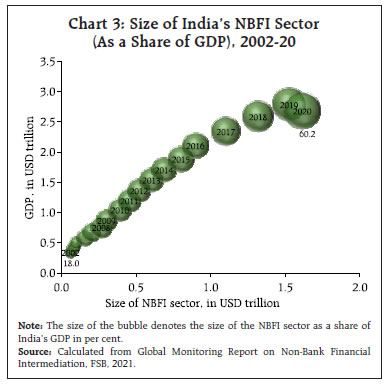 Globally, the share of EF1 in the narrow measure increased from 42 per cent in 2006 to over 75 per cent in 2020 and that of other activities except the unallocated category declined commensurately during the same period (Chart 4a). With an annualised growth of 10 per cent between 2006 and 2020, EF1 drove the growth of the narrow measure, particularly in the aftermath of the GFC. On the contrary, EF2 continued to be the largest entity type in India, followed by EF1, with the former growing at an annualised rate of 17.4 per cent during 2006-20. The shares of EF1 and EF2 in India’s narrow measure have largely remained stable (Chart 4b). EF2 entities largely comprise finance companies, which perform the credit intermediation function and rely on short-term funding for loan provision. They complement bank credit and provide financing to niche segments where banks are not active participants (FSB, 2021). NBFCs in India largely form a part of EF2 and are regulated under Section 45 IA of the RBI Act, 1934 and form the subject matter of this article. 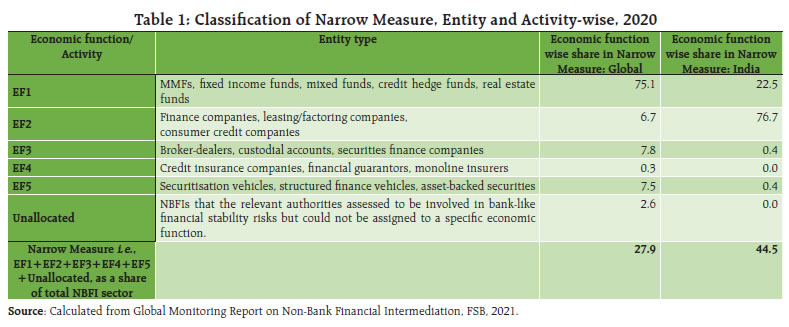
| Table 2: Classification of NBFC Sector by Activity | | Type of NBFC | Nature of activity / Principal business | | Investment and Credit Company (ICC) | Lending and investments. | | Infrastructure Finance Company (IFC) | Providing loans for infrastructure development. | | Infrastructure Debt Fund (IDF) | Facilitate flow of long-term debt to infrastructure projects. | | Core Investment Company (CIC) | Investment in equity shares, preference shares, debt, or loans of group companies. | | NBFC- Micro Finance Institution (NBFC-MFI) | Collateral free loans and advances to small borrowers. | | NBFC – Factor | Factoring business i.e., financing of receivables. | | Non-Operative Financial Holding Company (NOFHC) | For setting up new banks in private sector through its promoter/promoter groups. | | Mortgage Guarantee Company (MGC) | Providing mortgage guarantees for loans. | | Asset Reconstruction Company (ARC) | Acquiring and dealing in financial assets sold by banks and financial institutions. | | Peer-to-Peer Lending platform (P2P) | Providing an online platform to bring lenders and borrowers together to help mobilise funds. | | Account Aggregator (AA) | Collecting and providing information about a customer’s financial assets in a consolidated, organised and retrievable manner to the customer or others as specified by the customer. | | Housing Finance Company (HFC) | Financing for housing. | | Source: RBI. | III. A General Overview of the NBFC sector As on January 31, 2022, there were 9,4956 NBFCs registered with the Reserve Bank. Based on liability structure, NBFCs are categorised into deposit-taking NBFCs (NBFCs-D), which are allowed to raise term deposits and non-deposit taking NBFCs (NBFCs-ND). NBFCs-ND are further categorised as systemically important NBFCs (NBFCs-ND-SI) if their asset size exceeds ₹500 crore. Based on the kind of activity they undertake, NBFCs are classified into 12 categories (Table 2). In terms of number of companies, NBFCs-ND, with an asset size of less than ₹500 crore, have the largest share (Chart 5a). The number of NBFCs-D has reduced from 64 in January 2021 to 49 in January 2022. NBFCs-ND-SI are second in terms of number of companies, but they have the largest share of around 81 per cent of the total assets of the sector (Chart 5b). As of March 2021, NBFCs-D accounted for nearly 14 per cent and non-systemically important NBFCs-ND, around 5 per cent of the total assets of the sector. To maintain consistency, our sample consists of 278 NBFCs which have regularly filed returns in all quarters from December 2019 to December 2021. Our sample represents around 85 per cent of the assets of the NBFC universe in December 20217. In this sample, NBFCs- ICC are the largest (52.8 per cent), followed by IFCs (43.7 per cent) which consists mainly of large government-owned NBFCs. NBFCs-MFI, NBFCs-IDF and NBFCs-Factors together constituted remaining 3.5 per cent of our sample. IV. A Balance Sheet-based Analysis of NBFCs The consolidated balance sheet of NBFCs recorded a higher Y-o-Y growth in quarter-ending December 2021 as compared to December 2020 (Table 3). The growth was driven by an uptick in the economy after passing of the second wave of the pandemic, release of pent-up demand, availability of adequate provisions, and improved capital positions. An analysis of NBFCs-ND-SI and NBFCs-D during the corresponding period also shows an expansion in their balance sheets. IV.1. Liabilities Structure of NBFCs Borrowings and reserves and surplus together constitute almost 88 per cent of the liability side of balance sheet. At end-December 2021, the reserves and surplus grew at a robust pace owing to ploughing back of profits by NBFCs, which were aimed at bolstering their balance sheets. NBFCs rely heavily on bank and market borrowings to meet their funding requirements, except NBFCs-D, which have access to public deposits as well. | Table 3: Consolidated Balance Sheet of NBFCs | | (₹ crore) | | | Amount outstanding at the end of | Y-o-Y growth (Per cent) | | Dec-20 | Mar-21 | Dec-21 | Dec 20 over Dec 19 | Dec 21 over Dec 20 | | 1. Share Capital | 87,877 | 91,392 | 92,902 | 14.1 | 5.7 | | 2. Reserves and Surplus | 4,36,427 | 4,63,942 | 5,18,518 | 13.5 | 18.8 | | 3. Public Deposits | 52,524 | 56,426 | 63,510 | 27.4 | 20.9 | | 4. Total Borrowings | 19,63,017 | 21,01,027 | 22,08,431 | 10.9 | 12.5 | | 5. Current Liabilities and Provisions | 1,71,847 | 1,72,047 | 1,73,283 | 12.4 | 0.8 | | 6. Other Liabilities | 26,100 | 33,903 | 52,619 | 3.9 | 101.6 | | Total Liabilities / Assets | 27,37,792 | 29,18,738 | 31,09,263 | 11.7 | 13.6 | | 1. Loans and Advances | 22,52,413 | 23,93,871 | 25,02,575 | 17.7 | 11.1 | | 2. Investments | 2,32,851 | 2,41,748 | 2,80,547 | 18.1 | 20.5 | | 3. Cash and Bank Balances | 1,16,197 | 1,31,857 | 1,40,814 | 47.7 | 21.2 | | 4. Other Current Assets | 78,129 | 74,707 | 80,916 | 2.5 | 3.6 | | 5. Other Assets | 58,203 | 76,555 | 1,04,411 | -68.4 | 79.4 | Notes: 1. Data are provisional.
2. Numbers may not add up as all components are not reported here.
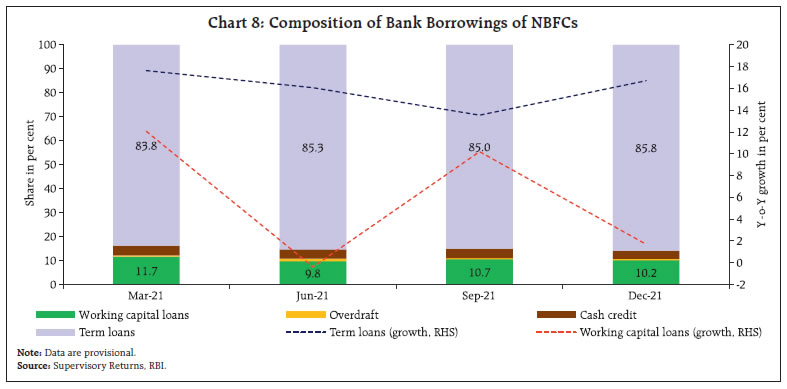
Source: Supervisory Returns, RBI. | NBFCs have both secured and unsecured borrowings. The share of secured borrowings constituted more than half of total borrowings at end-December 2021 (Chart 6a). Bank borrowings grew at a higher pace than market borrowings in quarter-ending December 2021 (Chart 6b). Debentures and commercial paper (CP) together comprise market borrowings. Subscription of NBFCs’ debentures by banks has shown an upward trend, increasing marginally between March 2021 and December 2021(Chart 7a). Subscription of NBFCs’ CPs is dominated by mutual funds followed by banks, together accounting for 86.8 per cent of total CP subscriptions of NBFCs at end December 2021 (Chart 7b). Bank borrowings consists of term loans, working capital loans, cash credit and overdraft. Post the IL&FS episode, there has been a gradual realignment of NBFCs’ borrowings with increasing reliance on long-term borrowings. Hence, term loans form preponderant share in the borrowings from banks by NBFCs. Sustained growth in term loans is indicative of economic recovery gaining momentum. On the other hand, growth rate of working capital loans remained subdued (Chart 8). 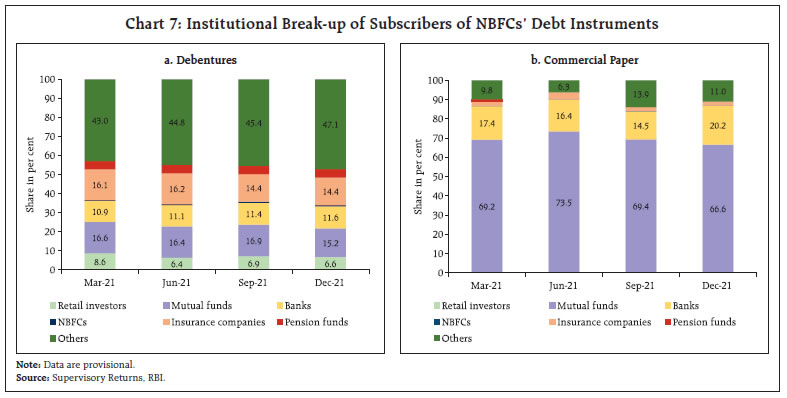
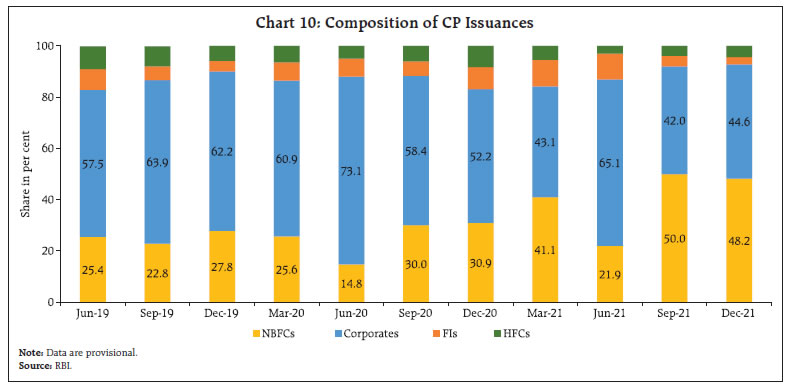
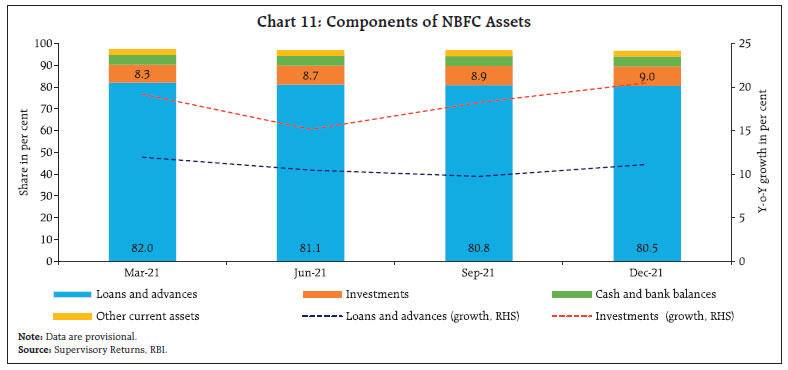
 In the quarter following the national lockdown in 2020 (Q1:2020-21), due to a combination of factors including risk aversion, sell-offs in financial markets and abrupt winding up of some schemes by mutual funds, yields on bonds of NBFCs spiked. The spreads narrowed in the following quarters, but the differentiation continued between AAA and AA-rated NBFCs. However, from January 2021 onwards, the gap started to decline. The gap between spread of three-year bonds of AA rated NBFCs and bonds of AAA rated NBFCs of the same maturity fell from a peak of 145 basis points (bps) in January 2021 to 74 bps in December 2021, thus, reaching pre-COVID-19 levels. This was reflective of a gradual reduction in the risk aversion in the market (Chart 9a). The spread of CPs over treasury bills peaked in the aftermath of the first wave of COVID-19 in April 2020 and spiked again March 2021 during the second wave. It gradually softened afterwards but inched up in December 2021 as compared to the preceding quarters on account of buoyant primary market activity (RBI, 2022) (Chart 9b). NBFCs and corporates are the largest participants in the CP market. Overall CP issuances grew by 41 per cent in Q3:2021-22 after declining in Q3:2020-21. This growth was propelled by NBFCs which raised ₹3,12,530 crore via CPs in Q3:2021-22, which was 48.2 per cent of the overall issuances. The low interest rate environment might have driven NBFCs to raise short-term resources through this channel (Chart 10). IV.2 Asset Structure of NBFCs Loans and advances followed by investments form the largest components on the assets side of the balance sheet of NBFCs. NBFCs extend more of secured loans than unsecured loans. NBFCs invest in, inter alia, government securities, equities, debentures, bonds, and mutual funds. NBFC credit showed an incremental growth of 11.1 per cent at the end of December 2021 as compared to 17.7 per cent in December 2020, which was on account of a favourable base effect. NBFCs continued to focus more on investments as indicated by their growth rates exceeding growth in credit in all quarters during 2021-22, so far. As NBFCs preserved cash in the preceding periods, incremental growth of cash and bank balances fell in quarter ending December 2021. This is indicative of comfortable liquidity position of NBFCs on their balance sheets aided further by the systemic surplus liquidity (Chart 11). 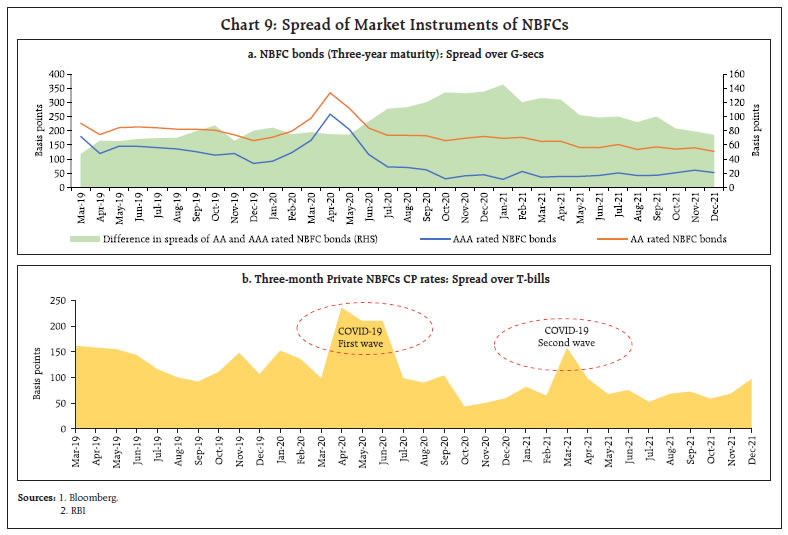
 A modest increase in credit growth of NBFCs was witnessed as of end-December 2021 on account of reduced threat of COVID-19 along with progress in vaccinations which led to higher mobility. The advent of the festive season also helped in this regard. ICCs, which provide bulk of consumer loans, showed an increase in credit growth in quarter ending-December 2021. IFCs’ credit growth decelerated slightly due to disruptions caused by second wave of the pandemic but following the government’s focus on the infrastructure sector, the demand for infrastructure credit is likely to improve in the near future. NBFCs-MFI grew at a healthy pace shaking off the blow inflicted by the pandemic (Chart 12a). ICCs and IFCs together made up nearly 96 per cent of total credit extended by NBFCs during this period (Chart 12b). 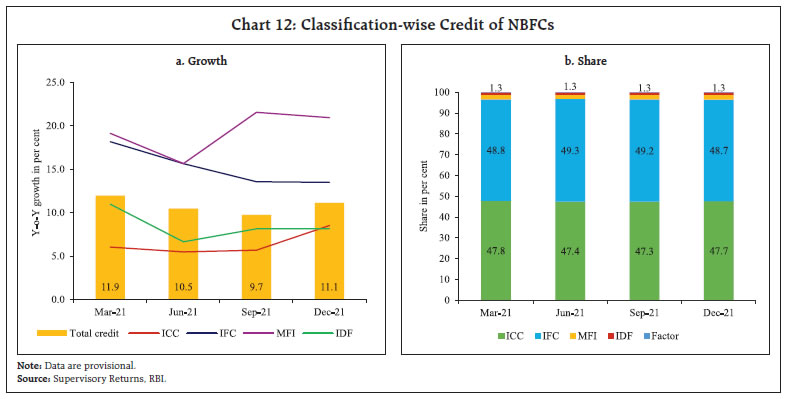
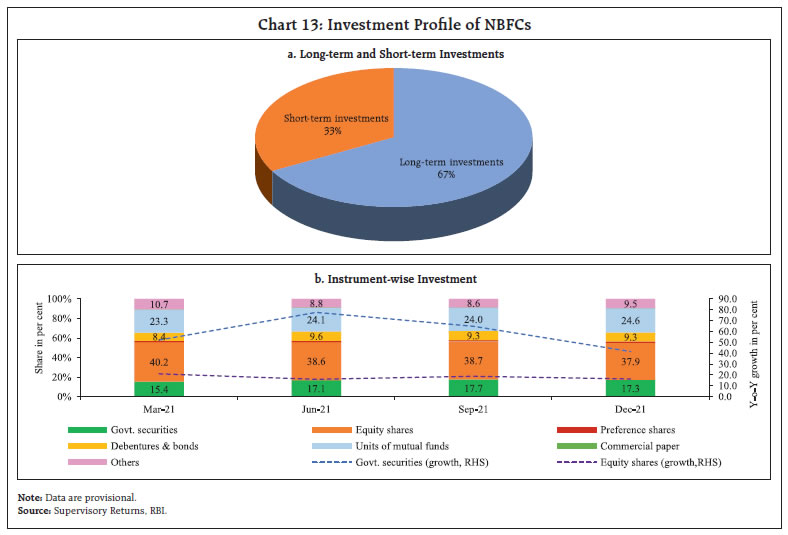 Long-term investments continued to dominate total investments in quarter ending December 2021 (Chart 13a). In this period, NBFCs continued their investment in equity shares and government securities, driven by a bullish stock market and given the lower interest income from their lending business. Investment in government securities grew by 41.6 per cent in quarter-ending December 2021. Government securities along with equity shares comprise more than half of NBFC investments (Chart 13b). V. Off- Balance Sheet exposure of NBFCs Off-balance sheet (OBS) exposures refer to activities that involve contingent commitments or contracts, which generate fee-based income for the company, but do not appear in the company’s balance sheet as assets or liabilities under conventional accounting procedure (Ghosh & Nachane, 2002). These include, inter alia, guarantees, commitments, interest rate and exchange rate contracts, standby facilities, and credit lines. OBS activities offer an attractive source to NBFCs to boost their non-interest incomes. However, they also pose liquidity risk, credit risk and market risk, akin to on-balance sheet activities (BCBS, 1986). The Ind-AS framework, which has been made applicable to NBFCs since 2018 in a phased manner, considers these risks and requires NBFCs to make appropriate provisions. In the NBFC sector, the share of financial and other guarantees in the total risk-adjusted non-funded exposure increased from 19.1 per cent in December 2020 to 38.7 per cent in December 2021 on account of the financial uncertainties relating to the pandemic. The ICCs and IFCs together formed about 99 per cent of the total risk-adjusted non-funded exposure of all NBFCs as of end-December 2021 (Chart 14). VI. Financial Performance, Asset Quality and Capital Adequacy The profitability of the NBFC sector improved in Q3:2021-22 compared to the corresponding quarter in 2020-21 as economy shook off the impact of the second wave with relatively fewer operational disruptions (Chart 15). NBFCs-ND-SI, the largest segment in NBFCs, experienced robust growth in fund and fee-based income, which gave fillip to their profitability. On the other hand, while the income of NBFCs-D grew only marginally, profits grew on the back of declining interest expenses. The asset quality of NBFCs, which had worsened due to the second wave of the pandemic, stabilised during Q2:2021-22. However, an uptick in GNPA and NNPA ratios was witnessed in Q3:2021-22 as NBFCs absorbed the impact of revised income recognition, asset classification and provisioning (IRACP) norms8. The deterioration in asset quality was possibly also attributable to rolling back of regulatory forbearance provided to individuals and small businesses under the Resolution Framework 2.0 by directing NBFCs to invoke it only for borrowers having stress on account of COVID-19 (effective September 2021)9 (Chart 16). It is expected that these measures will be beneficial in the long run as NBFCs will focus on developing better collection processes and encourage credit discipline among their borrowers while bridging the regulatory gap between banks and NBFCs. 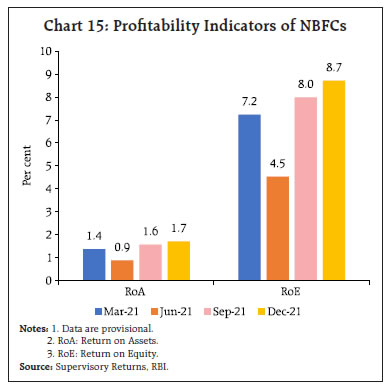 As per the extant regulations, every NBFC is required to maintain a minimum capital ratio of 15 per cent of its aggregate risk-weighted assets (including both on and off- balance sheet items). To further strengthen their capital position, the PCA framework for NBFCs will be made effective from October 1, 2022. Any NBFC breaching the risk threshold, (defined by three parameters, namely CRAR, Tier-1 ratio and NNPAs) will be placed under PCA. At present, the NBFC sector looks comfortably poised to comply with these new regulations with an overall CRAR of 27.5 per cent at end-December 2021 (Chart 17).
VII. Sectoral Distribution of Credit and NPAs of NBFCs NBFCs continued to deploy the largest quantum of credit from their balance sheets to industrial sector followed by retail, services, and agriculture. The sectoral credit distribution remained largely unchanged in 2021-22 (up to end-December 2021) as compared to end-December 2020 (Chart 18a). All sectors witnessed high growth rates on account of base effect and resumption of economic activities after the ebbing of the second wave of the pandemic. Industrial sector, particularly the micro and small and large industries, which were among the worst hit by the pandemic, showed signs of revival. Services sector showed consistent improvement in credit growth for last three quarters. Within services sector, transport operators, trade and commercial real estate (CRE) grew at a robust pace. Credit to agriculture and allied activities continued to perform well, registering a robust growth of 13.9 per cent in December 2021 over December 2020 (Chart 18b). VII.1 Sub-sectoral Credit and Asset Quality Within industry, power10 was the largest recipient of credit from NBFCs on account of the presence of many large government-owned NBFCs which operate in this segment. Its share was 33.7 per cent in overall credit extended by NBFCs as on end-December 2021. In retail sector, NBFCs largely operate in vehicle loans segment, followed by the gold loans segment. Transport operators and CRE are dominant segments under services sector. Economic downturn during the pandemic severely impacted CRE business. The continued reliance on the work-from-home policy by corporates also dampened the prospects of the CRE segment (Chart 19a). Industrial sector accounted for the largest share in NPAs followed by retail loans, services, and agriculture respectively, at quarter ending December 2021. Within industry, power sector contributed significantly to the total impaired assets of NBFCs accounting for 30 per cent of overall NBFC NPAs at end-December 2021. As per the report of the Standing Committee on Energy11, NPAs in the power sector are attributable to, inter alia, high interest cost, cost escalation due to extraneous reasons like court cases, delayed decision by lending consortium and lack of working capital. Retail sector accounted for 31.3 per cent of NPAs of NBFC sector at the end of Q3:2021-22. In the retail sector, vehicle loans added more impaired assets to the sector relative to their share in credit, as the ability to service vehicle loans was adversely affected by low freight rates and rising fuel costs (Moody’s, 2021). 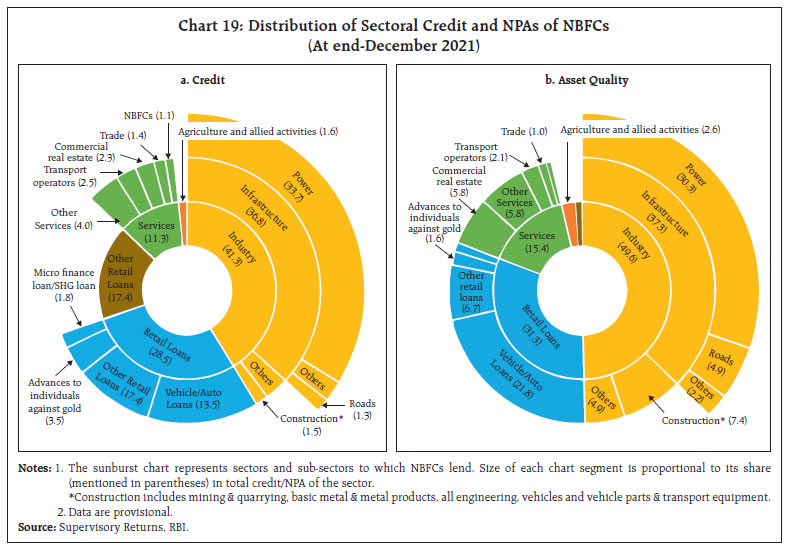 In the services sector, CRE accounted for the largest share in NPAs. In April 2020, the Reserve Bank issued guidelines which allowed NBFCs to restructure CRE projects which faced delays due to reasons beyond the control of promoters for one year. Subsequently, NPAs of CRE segment increased significantly in Q1:2021-22 after the regulatory forbearance ended and have continued to remain elevated till Q3:2021-22 (Chart 19b). Unwinding of policy measures to mitigate the effects of COVID-19, along with the new asset classification norms for NBFCs issued by the Reserve Bank in November 2021 led to better recognition of NPAs across sectors in December 2021. VIII. Conclusion Though India accounts for less than 1 per cent of the global NBFI assets, the share of NBFI sector in India’s GDP has steadily increased over time. Around 45 per cent of the NBFI sector (in terms of asset size) in India comprise entities which engage in credit intermediation involving maturity and liquidity transformation and are, therefore, important from a financial stability standpoint. Based on supervisory data, in quarter-ending December 2021, the consolidated balance sheet of NBFCs grew at a faster pace than the corresponding period in the previous year. The bottom lines of the NBFC sector also improved in Q2 and Q3: 2021-22 with the waning of the second wave of COVID-19. On the other hand, asset quality of the sector deteriorated in Q3:2021-22, which could be partly attributed to NBFCs adapting to the changes in IRACP norms as well as rolling back of regulatory dispensation under Resolution Framework – 2.0 for individuals and small businesses. With strong capital buffers, adequate provisions, and sufficient liquidity on their books, NBFCs are poised for expansion. Nevertheless, going forward, as the economy recovers, NBFCs need to be wary of rising borrowing costs on account of normalisation of monetary policy. Further, while NBFCs have largely realigned their business models by leveraging digital channels to improve their accessibility and acquisition of new customers, this might prove to be a challenge for smaller NBFCs which may have to ramp up their technological capabilities. NBFCs also need to remain more vigilant about cybercrimes. Another challenge is to build upon strong governance and risk management standards to gain stakeholder confidence. On the regulatory front, recognising the increasing scale and complexity of NBFCs’ operations along with their rising interconnectedness with other entities in the financial system, the Reserve Bank has envisioned SBR. Under these regulations, the focus has been shifted from an activity-based regulation to one based on riskiness and scale of operations, following the principle of proportionality. Bank-like regulatory initiatives such as PCA and IRACP norms would further bridge the gap in regulation of NBFCs vis-à-vis banks. These regulations are expected to strengthen the NBFC sector in the times to come. References BCBS. (1986). The management of banks’ off-balance-sheet exposures: a supervisory perspective. Retrieved from Bank for International Settlements: https://www.bis.org/publ/bcbsc134.htm Bowman, J., Hack, M., & Waring, M. (2018). Non-bank Financing in China, Bulletin March 2018. Retrieved from Reserve Bank of Australia: https://www.rba.gov.au/publications/bulletin/2018/mar/pdf/non-bank-financing-in-china.pdf CGFS. (2018). Structural changes in banking after the crisis. Committee on the Global Financial System, BIS. Claessens, S., Dell’Ariccia, G., Igan, D., & Laeven, L. (2010, February). Lessons and Policy Implications from the Global Financial Crisis. Retrieved from International Monetary Fund: https://www.imf.org/external/pubs/ft/wp/2010/wp1044.pdf FSB. (2021). Global Monitoring Report on Non-Bank Financial Intermediation. Financial Stability Board (FSB). FSR. (2021). Financial Stability Report, December 2021. Reserve Bank of India. Retrieved from https://rbidocs.rbi.org.in/rdocs//PublicationReport/Pdfs/FSRDEC2021_FULL2D99E6548CD0478CA90EE717F2B85D45.PDF Ghosh, S., & Nachane, D. (2002). Off-balance sheet activities in banking: Theory and Indian experience. Munich Personal RePEc Archive (MPRA). IMF. (1998). IMF Staff Country Report No. 98/112. Washington D.C.: International Monetary Fund. Kannan, R., Shanmugam, K., & Bhaduri, S. (2019). Non-Banking Financial Companies Role in India’s Development: A Way Forward. Springer Nature Singapore Pte Ltd. Kodres, L. (2012). Economic Premise, September 2012. Retrieved from International Monetary Fund (IMF): https://www.imf.org/external/pubs/ft/fandd/basics/52-shadow-banking.htm Moody’s. (2021). Auto ABS – India: Coronavirus resurgence will hurt performance. RBI. (2019-20). Report on Trend and Progress of Banking in India. RBI. (2021). Chasing the Horizon, November 2021. Retrieved from Bulletin: https://www.rbi.org.in/Scripts/BS_ViewBulletin.aspx?Id=20626 RBI. (2022). State of the Economy, January 2022. Retrieved from Bulletin: https://www.rbi.org.in/Scripts/BS_ViewBulletin.aspx?Id=20749
|