As the world stepped into the new year, the path of the recovery in India as in the rest of the global economy encountered headwinds from a rapid surge in infections due to Omicron. Nonetheless, amidst upbeat consumer and business confidence and an uptick in bank credit, aggregate demand conditions stay resilient, while on the supply front, rabi sowing has exceeded last year’s level and the normal acreage. Manufacturing and several categories of services remain in expansion. More recently, expectations that Omicron may turn out to be more of a flash flood than a wave have brightened near-term prospects. Introduction As the world stepped into the new year, India set its course on a path of recovery. As per the first advance estimates by the National Statistical Office (NSO), the Indian economy surpassed its pre-pandemic level in 2021-22. With the recovery unevenly gaining traction, all the constituents of aggregate demand entered into expansion, with investment, exports and imports exceeding their pre-COVID levels (Chart 1). Government final consumption expenditure (GFCE) accelerated in 2021-22, providing an upward thrust to aggregate demand. On the supply side, the farm sector remained upbeat on the back of record kharif production. Industrial and services activity exhibited a halting recovery, while services are yet to catch up with their 2019-20 levels. Since the December 2021 issue of the State of the Economy article, there has been moderation in some sectors. On the external front, however, India’s robust export performance in December reflects resilient demand for Indian goods, while imports also surged on the back of improvement in domestic demand. Building competency in high-tech products like electrical machinery, mechanical appliances, optical and surgical apparatus would be critical for sustaining export growth in the coming decades. 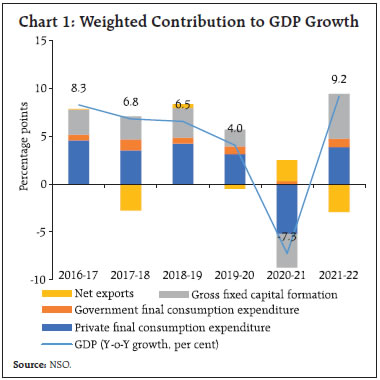 Policy measures initiated by the Reserve Bank in the wake of the pandemic reached their pre-announced sunset dates in 2021-22. While certain liquidity measures have been wound down as a result, other regulatory measures, including deferment of implementation of net stable funding ratio (NSFR), restrictions on dividend payouts by scheduled commercial banks (SCBs), and deferment of implementation of the last tranche of capital conservation buffer, have been realigned to avoid extended forbearance and risks to financial stability while providing targeted support to needy sectors. Bank credit growth is indicating signs of a gradual recovery, led by the retail segment, although flow of credit to lower rated corporates remains hesitant. In this regard, the Reserve Bank recently released its Report on Trend and Progress of Banking in India, 2020-21. The highlights of the Report are: -
Scheduled commercial banks’ (SCBs’) gross non-performing assets (GNPA) ratio declined from 8.2 per cent at end-March 2020 to 7.3 per cent at end-March 2021 and further to 6.9 per cent at end-September 2021. The provisioning coverage ratio (PCR) increased to 68.1 per cent by September 2021 from 66.2 in March 2020. -
Profitability of SCBs, as indicated by return on assets (RoA), improved to 0.7 per cent at end-March 2021 and further to 0.8 per cent in September-2021 from 0.2 per cent at end-March 2020 aided by stable income and decline in expenditure. -
The capital to risk weighted assets (CRAR) ratio of SCBs strengthened from 14.8 per cent at end-March 2020 to 16.3 per cent at end-March 2021 and further to 16.6 per cent at end-September 2021, aided by higher retained earnings, recapitalisation of public sector banks (PSBs) and capital raising from the market by both PSBs and private sector banks (PVBs). -
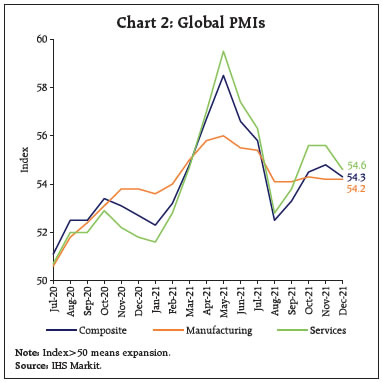
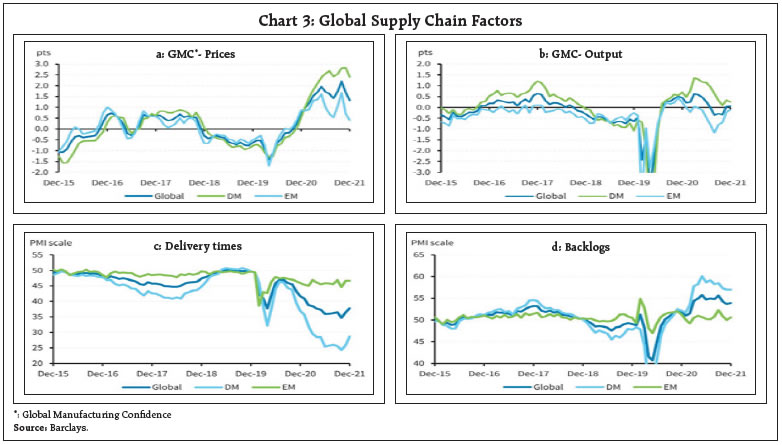
The share of restructured standard advances (RSA) in total advances rose to 0.8 per cent at end-March 2021 from 0.4 per cent at end March 2020, largely reflecting the one-time restructuring scheme for standard advances announced by the Reserve Bank in August 2020, and further to 1.8 per cent by September 2021 due to Resolution Framework 2.0 for retail loans and MSMEs. The rest of this article is structured into four sections. Section II outlines recent global economic developments. An assessment of domestic macroeconomic conditions is presented in section III. Section IV reviews financial conditions in India and the last section concludes the article. II. The Global Setting The resurgence of COVID-19 and the emergence of newer variants pose a major risk to near-term economic prospects. By January 10, 2022, about 306 million cases have been confirmed globally. With the Omicron variant showing high transmissibility, several countries have again clamped lockdowns, travel restrictions and other containment measures. Inflation continues to spiral across economies as pent up demand unlocks, boosted by stimulus-induced step-up in consumer demand, and disruptions in production and supply chains continue. This is prompting the hastening of normalisation of monetary policy. Some easing of supply chain disruptions and shipping charges is underway, however, the waning of pandemic-induced inflation is expected to be lagged until the latter part of 2022. Overall, there has been a slowdown in the momentum of global growth. The World Bank in its latest Global Economic Prospects (GEP) report issued on January 11, 2022 forecast that global recovery will sharply decelerate in the wake of continued COVID-19 resurgences, lesser policy support and persisting supply bottlenecks. Growth projections for the US and China have been markedly revised down for both 2021 and 2022 (Table 1). Sharp deceleration in major economies will drag down external demand for emerging market economies (EMEs). The World Bank expects that advanced economies (AEs) would achieve a full recovery in output by 2023, while EMEs would still be 4 per cent lower than their pre-pandemic trend. The global composite purchasing managers’ index (PMI) ended 2021 at a three-month low of 54.3 in December, albeit, remaining in expansion for 18 consecutive months. Concomitantly, the global services PMI also slid to a three-month low of 54.6 in December, although it continued to outperform its manufacturing counterpart, which remained steady at the previous month’s level of 54.2 (Chart 2). Even as inflationary pressures and supply chain disruptions remain elevated, there are tentative signs of some easing. Input costs and output prices registered their weakest increase in eight months, while vendor delivery time rose by the lowest extent in nine months (Chart 3). The New York Fed’s Global Supply Chain Pressure Index1 has peaked and might start to moderate going forward. 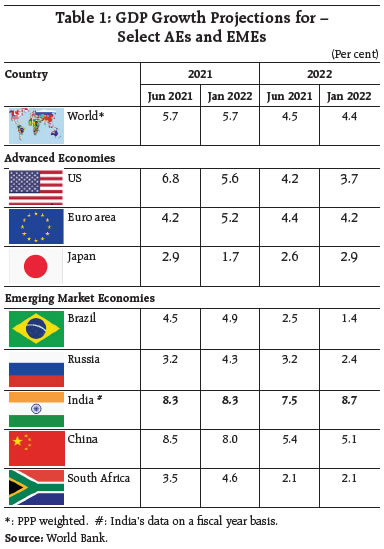
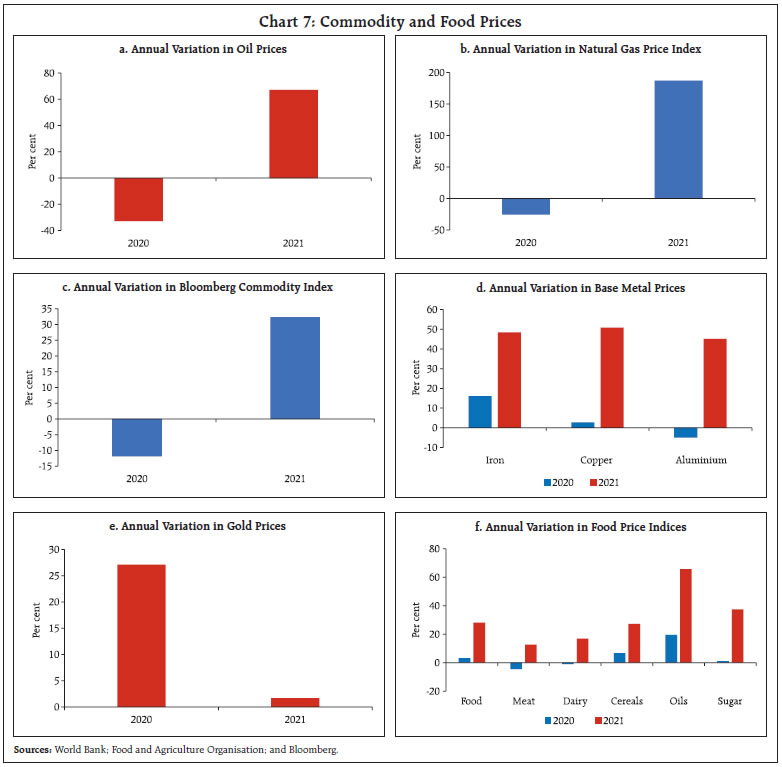
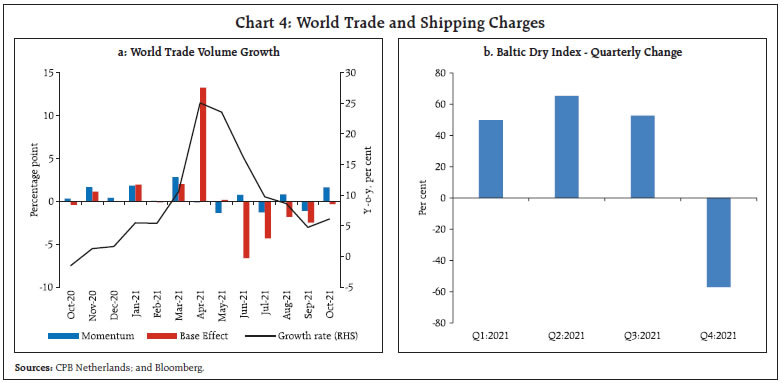 On the external demand front, world trade volume growth (y-o-y) accelerated to 6.1 per cent in October 2021 after decelerating for five consecutive months (Chart 4a). The Baltic Dry Index also moderated in Q4:2021 after rising to a 13-year high in early October (Chart 4b). Freight rates also moderated across routes in December 2021, but they still remain above their pre-pandemic levels (Chart 5a). The immediate reaction to Omicron has, however, caused supply chain restrictions to rise, pushing up turn-around time and waiting time for containers headed for the US (Chart 5b). Inflation surged to multi-decadal highs in several regions (Chart 6). In the US, inflation measured by the y-o-y change in personal consumption expenditure (PCE) price index soared to a near 40-year high of 5.7 per cent in November, with core PCE inflation also accelerating to a 32-year high of 4.7 per cent. Euro area inflation surged to a new high of 5.0 per cent in December. Among BRICS economies, CPI inflation in December 2021 registered a moderation in Brazil to 10.1 per cent from the 18-year high level of 10.7 per cent in the previous month. In Russia, inflation remained steady at 8.4 per cent in December. A key driver of inflation across the world in 2021 has been the rapid surge in energy, food and commodity prices. According to the World Bank, crude oil prices increased by 67.2 per cent in 2021, following a decline of 32.8 per cent in 2020 (Chart 7a). Natural gas prices registered a near three-fold increase in 2021, with prices in Europe rising steeply to record highs in December (Chart 7b). The Bloomberg commodity price index edged up by 32.3 per cent in 2021, with metal prices increasing on the back of recovery in manufacturing, greater demand for ‘green’ metals and also pandemic-related supply disruptions (Charts 7c and 7d). On the other hand, gold prices registered only a marginal pick up in 2021 as safe haven demand for the yellow metal waned and dollar strengthened (Chart 7e). Notwithstanding a marginal moderation in December, food prices surged to a decadal high in 2021 on account of weather-related supply disruptions and higher import demand from China for select food items (Chart 7f). Financial markets were unsettled by the trajectory of the virus and shifts in the monetary policy stances of major central banks. Stock markets remained buoyant in AEs, while those in EMEs underperformed due to less sanguine growth prospects as also due to country-specific factors (Chart 8a). In the US Treasury market, the benchmark 10-year yield generally rose in the latter half of 2021 in response to high inflation and growth outcomes, but the 2-year yield began hardening only in Q4:2021 in response to shifts in the monetary policy stance. Resultantly, the yield spread narrowed gradually (Chart 8b). The US dollar rallied strongly in H2:2021 in view of strong safe haven demand and the policy pivot towards faster normalisation by the Federal Reserve (Chart 8c). As risk appetite waned, there was a moderation of capital flows to EMEs in the final months of 2021, with a sharper slowdown in debt flows (Chart 8d). The International Monetary Fund (IMF) has noted that in an environment of elevated risks to global growth, a faster pace of rate hikes by the Fed could tighten financial conditions across the world. A possible slowing of US demand and trade could lead to capital outflows and currency depreciation in EMEs. 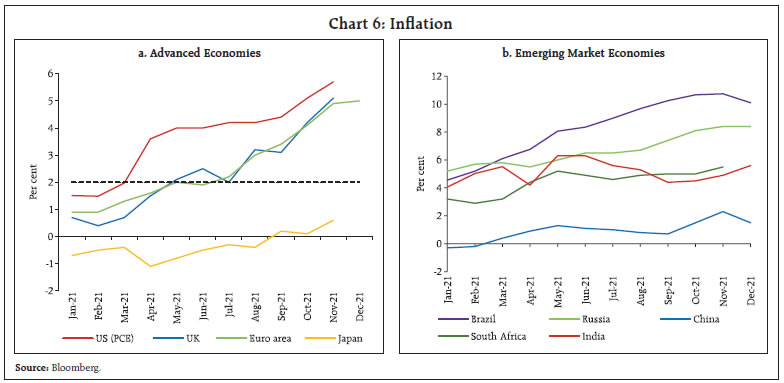
 On the monetary policy front, the US Fed in its December meeting signaled a faster pace of winding down of its asset purchase programme by doubling the monthly quantum of taper. The European Central Bank has announced a slower pace of asset purchases under the Pandemic Emergency Purchase Programme (PEPP) in Q1:2022 and discontinuation of PEPP by end-March 2022. The ECB would, however, double the purchases under the Asset Purchase Programme (APP) in Q2:2022 and slowly revert to the actual pace by Q4:2022. The Bank of Japan has also signalled completion of additional purchases of commercial paper and corporate bonds by end-March 2022 and from April 2022, it would revert to the quantum of purchases prior to the pandemic. The Bank of England joined the rate-hiking club with a 15 basis points (bps) increase in its policy rate. Russia effected its seventh rate hike in December. Poland became the first country to raise rates in 2022 with a hike of 50 bps on January 4, which was the fourth consecutive increase since rate hikes commenced in October 2021. Peru, Argentina and Uruguay are the other central banks that have raised rates in 2022 so far (up to January 11). The People’s Bank of China (PBoC) effected a rate cut of 5 bps in its 1-year Loan Prime Rate. This was the first cut in key policy rate since April 2020 and followed up a reduction in the reserve requirement ratio earlier in December. Turkey effected a fourth consecutive reduction in December, leading to a cumulative cut of 500 bps since September 2021 (Chart 9). 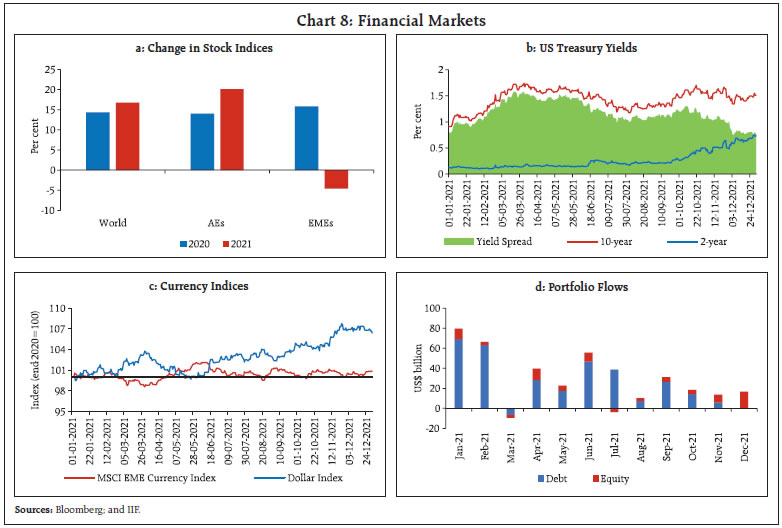 As we commence the new year, the near-term global outlook remains hazy. While Omicron surged faster than Delta, it was followed by a sharp collapse in South Africa. This has boosted hopes that Omicron will be more of a flash flood than a wave. 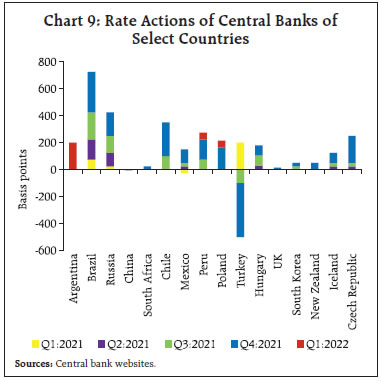 An overarching priority is being attached to stemming inflationary pressures, although there is a view that the worst of inflation is now behind the world economy. Few factors are cited: first, after surging to its highest level in a decade, the UN index of global food prices slid 0.9 per cent in December 2021. Second, the global supply chain pressures may have begun to moderate and are expected to ease further going forward. Third, metal prices seem to have stabilised in H2:2021 and are likely to soften in 2022. The World Bank expects that after surprising to the upside in 2021, inflation would remain above the pre-pandemic level in 2022 also. The Organisation for Economic Co-operation and Development (OECD) projected inflation to peak by the end-2021, and then soften to levels that are in sync with the gradually increasing labour costs and diminishing spare capacity across the world. Inflation in OECD economies is projected to ebb from 4.9 per cent in Q4:2021 to 3.4 per cent by Q4:2022. Since waning of inflation is largely expected only in the latter part of 2022, the policy trade-offs are getting increasingly complex as inflation continues to soar to record highs while the output gap remains negative. III. Domestic Developments The recovery that has been underway in the Indian economy with the ebbing of the second wave of the pandemic is encountering headwinds from a rapid surge in infections in a third wave marked by the rapid transmissibility of the Omicron variant. Consequently, mobility indicators exhibited a sequential moderation in January. Google mobility indices dropped below the baseline numbers for retail and recreation activities and around workplaces as offices made a quick transition to work from home protocols (up to January 8, 2022) (Chart 10a). The Apple mobility index tumbled across all major cities, although it remained above its pre-pandemic level (Chart 10b). Electricity generation accelerated through January so far, reaching pre-pandemic levels (Chart 10c). 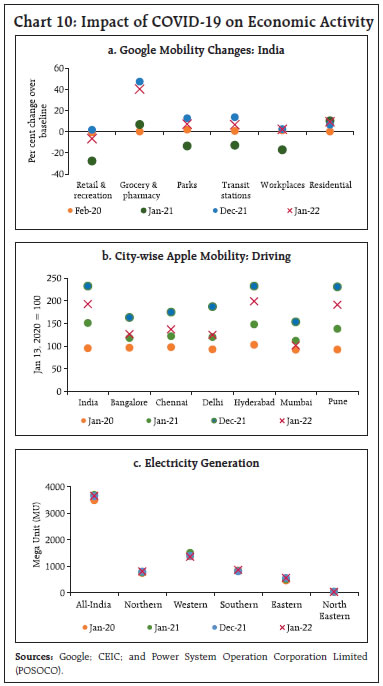 Daily infections surged to over 2.71 lakh on January 13, the highest since mid-May 2021, with active caseload hitting 15.5 lakh (Chart 11). On the vaccination front, India has made commendable progress, administering 155.4 crore jabs as on January 13, 2022 (Chart 12). The inoculation drive has been extended to adolescents in the age group 15-18 years since January 3, 2022 with 3.15 crore doses having been administered to them. Furthermore, the Central Drugs Standard Control Organisation (CDSCO) granted approval to two more vaccines for restricted use in emergency situations, viz., Biological-E’s CORBEVAX and Serum Institute of India’s COVOVAX, in order to shore up its arsenal in the fight against the pandemic.
Aggregate Demand Aggregate demand conditions have stayed resilient. The issuance of E-way bills – an indicator of freight movement – surged to 7.2 crore in December, the second highest in its history (Chart 13a). This is indicative of the likelihood of robust collection of the goods and services tax (GST) in January 2022. With a strong pick-up in manufacturing and construction, highway toll collections soared by 16 per cent month-on-month (m-o-m) in December (Chart 13b). Power consumption rose by 4.5 per cent to 110.3 billion units in December. The increase in mobility in December 2021 increased fuel consumption, with the consumption of petrol surpassing pre-pandemic levels. Aviation turbine fuel (ATF) and diesel consumption also exhibited sequential improvement though ATF still remains below the pre-pandemic levels (Chart 14a). Domestic air passenger footfalls exhibited signs of moderation in early-January, reversing the gradual uptick since June 2021. 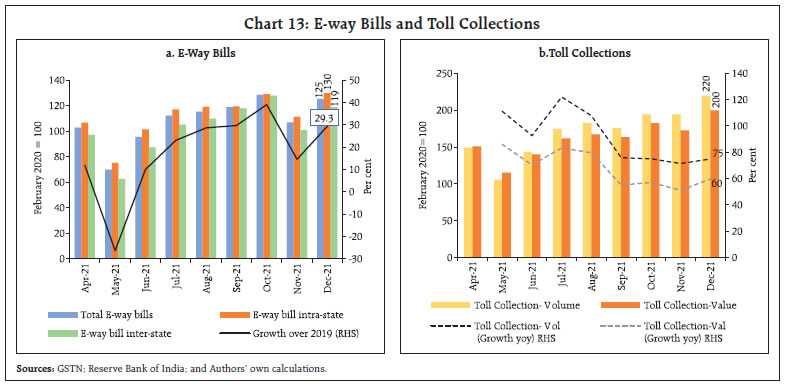 There was a broad-based decline in vehicle registrations in December 2021, primarily due to shortage of semiconductors amidst global supply chain disruptions (Chart 14b). The drop was led by two-wheelers registrations, which contracted by 19.9 per cent, and dragged overall registration volumes. As per the Federation of Automobile Dealers Associations (FADA), higher cost of ownership, tepid rural sentiments and the recent threat from Omicron dampened sales in December 2021 (Chart 14c). Commercial vehicles sales, however, accelerated amidst a surge in freight rates. Tractor sales plunged by 27.5 per cent, indicative of a slump in rural demand (Chart 14d). 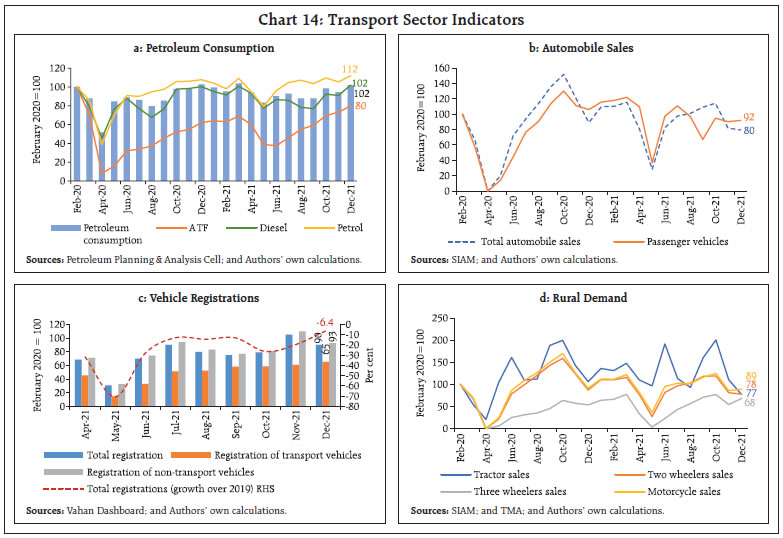 As consumer confidence resumed, the Refinitiv-Ipsos primary consumer sentiment index improved by 2.6 percentage points in December over a month ago. This was led by a boost in confidence for personal finances and investments. There was a sharp uptick in hotel bookings for celebrations during the year end, with several locations and resorts reporting full occupancy.2 The sales of fast moving consumer goods inched up by 11 per cent in December, largely driven by packaged food and commodities.3 Rural consumption benefited from the release of ₹20,900 crore under the 10th instalment of the PM-KISAN scheme. In the top 7 cities, housing sales jumped by 71 per cent in 2021 over a year ago, amidst decadal low interest rates and attractive discount offers by builders.4 As per the household survey of the Centre for Monitoring Indian Economy (CMIE), the labour participation rate turned up to 40.9 per cent in December, the highest since September 2020. The employment rate also improved by 23 bps, though the unemployment rate worsened to 7.9 per cent in December from 7.0 per cent a month ago (Chart 15). An industry-wise analysis by the CMIE indicates that jobs were lost in manufacturing, hotels, tourism, and education, while more jobs were created in construction, agriculture and retail trade. As per the CMIE’s employment statistics, the total number of employed workers surpassed the 2019 level (pre-pandemic) for the first time in 2021 in December (Chart 16). According to the staffing solutions provider TeamLease, hiring by e-commerce and allied sectors surged by 28 per cent in 2021.5
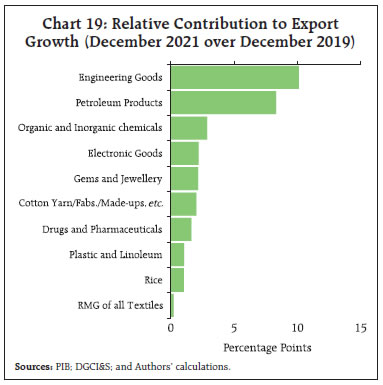
In contrast, the employment segment of the purchasing managers’ index (PMI) showed that employment under both manufacturing and services sectors slipped into contraction in December 2021 (Chart 17). India’s merchandise exports touched an all-time high of US$ 37.8 billion, recording a sequential improvement of 25.9 per cent in December and achieved 75 per cent of the target set for 2021-22 (Chart 18a and 18b). 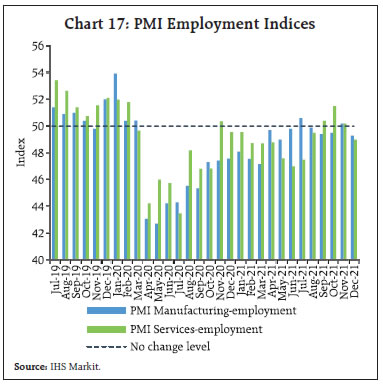 Export growth was broad-based, with ten major commodity groups accounting for around 80 per cent of exports recording an expansion above their pre-COVID levels (Chart 19). The improvement in export performance stemmed from higher value of shipments of engineering goods, petroleum products, chemicals and electronic goods. Notably, engineering goods exports hit their highest level of US$ 9.7 billion, supported by a rise in global metal prices. Pharmaceuticals exports grew by 23.5 per cent over pre-COVID level supported by record exports of 422.4 lakh COVID-19 vaccine doses. Rice, the largest constituent of the agricultural export basket, has displayed robust growth compared, even relative to pre-pandemic levels. The expansion of world rice trade by 4.9 per cent in 2022 as projected by the Food and Agriculture Organisation (FAO) bodes well for India’s rice exports. 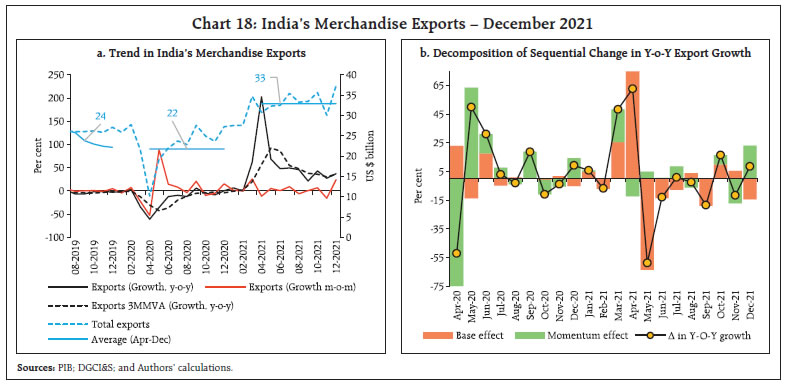
 Merchandise imports rose to their highest level of US$ 59.5 billion in December 2021, staying well above the US$ 50 billion mark for the fourth consecutive month and indicating a strong underlying momentum of domestic demand (Chart 20a and 20b). Robust import demand was driven by petroleum products, gold and electronic goods (Chart 21). Moreover, nine out of ten major commodity groups comprising more than 70 per cent of imports recorded an expansion over pre-COVID levels, mirroring the broad-based demand uptick. Gold imports at US$ 4.7 billion in December 2021 expanded by 91.7 per cent over the pre-COVID period. At 720.3 tonnes during April-December 2021, India has already imported 88.1 per cent of the average annual import volume of the last five years.
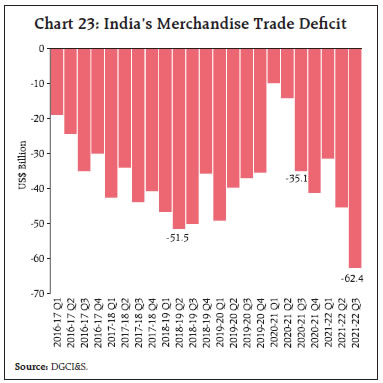
The imports of coal, coke and briquettes recorded a sequential deceleration during December 2021 (Chart 22a). Overall non-oil non-gold imports maintained strong growth for the seventh consecutive month in December over pre-pandemic levels (Chart 22b). After the all-time high monthly trade deficit of US$ 22.9 billion in November 2021, the trade deficit eased to US$ 21.7 billion in December 2021. On a quarterly basis, the trade deficit reached a record level of US$ 62.4 billion during Q3:2021-22 (Chart 23). The fiscal position of the Union government continued to post improvement, with net tax revenues touching an all-time high of 73.5 per cent of budget estimates (BE) and the gross fiscal deficit plummeting to 46.2 per cent of BE during April-November 2021, as against the five-year average of 50.6 per cent and 112.5 per cent, respectively (Chart 24). On the expenditure front, capital expenditure improved by 13.5 per cent while revenue expenditure was up by 8.2 per cent over 2020-21. The growth in capital expenditure was led by the Ministry of Road Transport and Highways which has exhausted 68.3 per cent of its budgeted capital expenditure. As per cent of BE, however, both revenue and capital expenditure during April-November 2021-22 trail below trend. 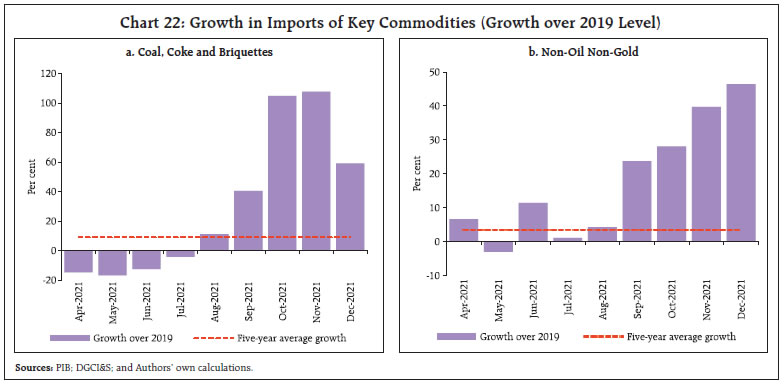
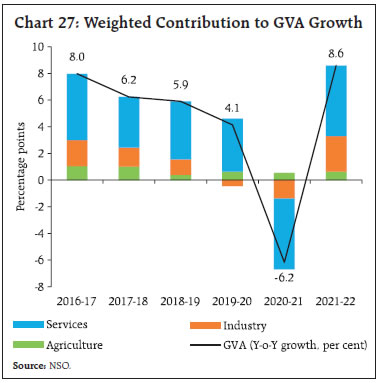
 If the budget estimates for 2021-22 and expenditure proposals contained in the two supplementary demand for grants are realised, revenue expenditure less interest payments and major subsidies (an indicator of government final consumption expenditure) may increase by 29.0 per cent over 2020-21 (70.3 per cent over 2019-20), providing a boost to aggregate demand. Increased expenditure will be partially offset by buoyant tax collections. Additionally, the Union government will also benefit from the higher nominal GDP, which stands at ₹232.15 lakh crore as against the assumption of ₹222.87 lakh crore used for budget estimates for 2021-22. Collections under GST posted a y-o-y growth of 12.7 per cent in December 2021 (Chart 25). In Q3:2021-22, the highest quarterly GST collections of ₹3.9 lakh crore since the introduction of GST were recorded. This is an outcome of various policy and administrative measures to improve compliance and would perhaps demonstrate the inherent advantages of having a GST. 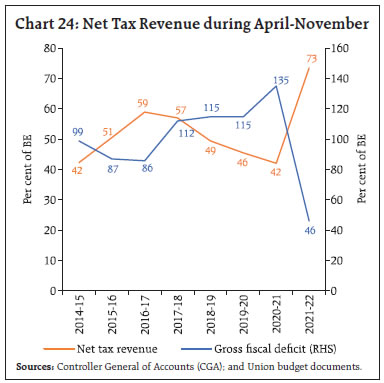 State finances have exhibited significant improvement, with their revenues surpassing pre-pandemic levels. States’ tax and non-tax receipts recorded a y-o-y growth of 29.2 per cent and 53.8 per cent, respectively, during April-November 2021. All the major heads of states’ taxes have exceeded the levels of 2019-20 and have seen high growth during April-November 2021. In particular, states’ GST revenue and sales tax collections have seen a robust growth of 35.2 per cent and 37.3 per cent, respectively. Until November 2021, states’ have mobilised a relatively higher share of their budgeted revenue receipts than the past trend since 2018-19 (Chart 26a). 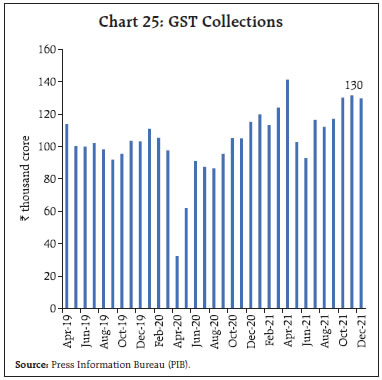 On the expenditure front, states’ revenue expenditure grew by 12.8 per cent during April-November 2021, up 9.0 per cent over the corresponding period of the pre-pandemic year of 2019-20 (Chart 26b). The quality of expenditure has also seen an improvement, which is reflected in states’ capex recording a growth of 67.6 per cent in April-November 2021 (Chart 26c). The thrust on capex augurs well for a durable growth revival. Overall, the states’ gross fiscal deficit has come down sharply as per cent of BE for majority of the states, reflecting improved fiscal management (Chart 26d). Aggregate Supply On the supply side, aggregate supply, as measured by gross value added (GVA) at basic prices, increased by 8.6 per cent6 in 2021-22, as against a contraction of 6.2 per cent a year ago. The acceleration in GVA growth was facilitated by robust growth in agriculture, coupled with recovery in industry and in several constituents of services, albeit, on a favourable base (Chart 27). Supported by replenished reservoir levels (Chart 28a) and spatially and temporally well-distributed north-east (NE) monsoon rainfall, an area of 664.6 lakh hectares has been covered under rabi sowing so far, which is 106.3 per cent of the full season normal rabi acreage. Notably, rapeseed and mustard oilseed acreage surpassed the full season normal area by 46.9 per cent, reflecting the impetus given by the government in the form of price assurance (Chart 28b). As on January 14, 2022, the area sown under oilseeds recorded growth over last year (21.8 per cent) while that of wheat, rice and coarse cereals lagged. Despite the supply of major fertilisers staying below the level of the previous year, the monthly availability (as on January 12, 2022) was higher in comparison to required levels (Chart 28c). Reflecting the employment generated by the ongoing rabi sowing in the rural hinterland, the demand for work under the Mahatma Gandhi National Rural Employment Guarantee Scheme (MGNREGA) slid y-o-y for the fourth consecutive month in December 2021 (Chart 28d). 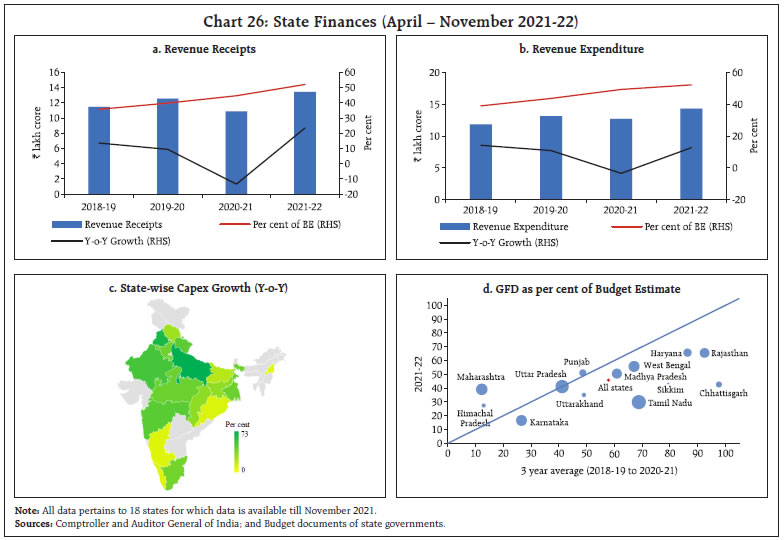
 As on January 12, the cumulative procurement of rice at 37.3 million tonnes (kharif marketing season 2021-22) exceeded the level of previous year (36.3 million tonnes). As per the quarterly buffer norms (January-March), stock levels for both rice and wheat remained comfortable (7.1 and 2.4 times, respectively). On December 20, 2021, as part of policy measures to curb inflationary pressures, the Securities and Exchange Board of India (SEBI) suspended derivatives trading in paddy (non-basmati), wheat, chana, moong, soybean, mustard seed, and crude palm oil in all commodity exchanges for a period of one year. 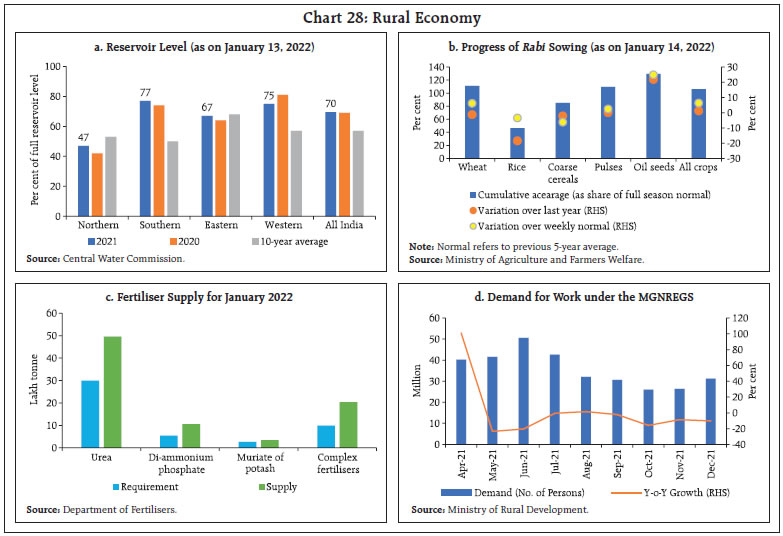
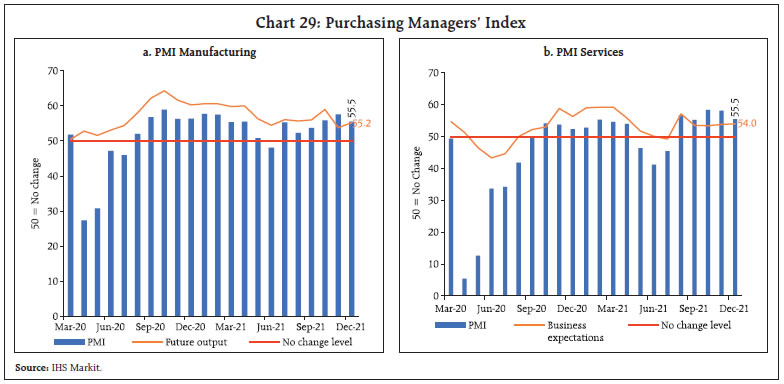 In the industrial sphere, the headline manufacturing PMI remained in expansion at 55.5 in December 2021. It moderated, however, from the level of 57.6 in November due to a dip in output, stock of purchases and new orders. India’s coal production surged to 74.8 million tonnes in December, marking an increase of 6.8 per cent over its pre-pandemic level. The services PMI stood at 55.5 in December, recording an expansion for the fifth consecutive month. The business expectations index (BEI) for services expanded to 54.0 in December 2021, up from 53.8 in November 2021 (Chart 29). Construction activity has tapered in recent months, as evident in the performance of its coincident indicators. Steel consumption continued to contract in December, although it was primarily on account of lower demand from the automobile sector. Cement production contracted for the first time in the last ten months in November 2021, reflective of waning of pent-up demand (Chart 30).
In the services sector, railways freight traffic accelerated to 7.2 per cent in December from 6.3 per cent in the preceding month (Chart 31a). As shipping hurdles and container shortages eased globally, cargo traffic at India’s major ports in December 2021 picked up sequentially. Over a year ago, cargo traffic declined marginally by 0.8 per cent, led by a fall in iron ore and coking coal cargo (Chart 31b). In the aviation sector, both passenger and cargo traffic have exhibited a gradual recovery since August 2021, with both international and domestic cargo freight normalising in November 2021. Passenger traffic also gathered steam on the back of travels during the festival season. In the wake of the recent threat from Omicron, new travel guidelines might delay growth of this sector. In the first week of January, daily domestic airport footfall7, averaged 6.4 lakh per day, declining by 7.9 per cent over the corresponding week in December. International airport footfall also declined by 7.2 per cent sequentially. The cargo segment recorded double-digit contraction of 23.7 and 21.6 per cent for domestic and international cargo, respectively, as airlines cancelled or rescheduled flights due to the rising number of COVID-19 infections. There was an improvement in the performance of trade, hotels, transport communication, and GST e-way bills (Table 2). The performance of the IT sector was boosted in Q3:2021-22 by the rapid pace of digitalisation and higher discretionary expenditure by firms.8 Inflation Headline CPI inflation (year-on-year) for the month of December 2021 edged up to 5.6 per cent from 4.9 per cent a month ago (Chart 32a). A welcome decline in momentum (month-on-month change in prices in the current month) by around 35 bps was offset by a large unfavourable base effect (month-on-month change in prices a year ago) of around one percentage point, resulting in headline inflation increasing by around 70 bps between November and December. The CPI food group, particularly vegetables, was the key driver of the decline in headline CPI momentum. It also suffered adverse base-effects. 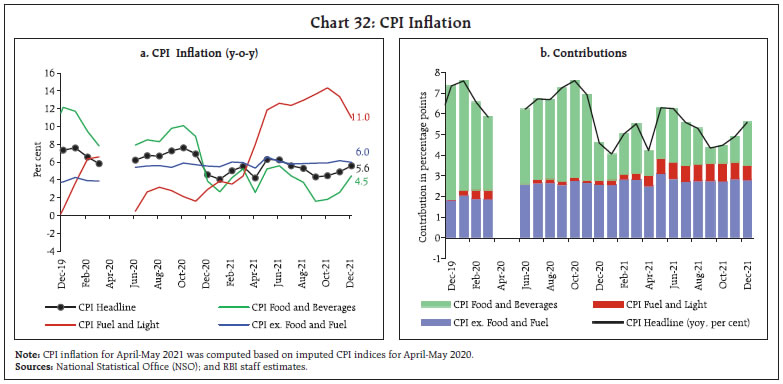 Food and beverages inflation increased to 4.5 per cent in December from 2.6 per cent in November, largely due to an unfavourable base effect of around 2.7 percentage points. Cereals, eggs, milk, and prepared meals inflation edged up. On the other hand, inflation in meat and fish, oils and fats, fruits, pulses, sugar and confectionary, spices and non-alcoholic beverages moderated. Vegetable price deflation narrowed considerably in December. Fuel inflation moderated to 11.0 per cent in December from 13.3 per cent in November primarily on account of LPG, kerosene and firewood and chips. Electricity prices continued to remain in deflation in December. CPI fuel (weight of 6.84 per cent in the CPI basket) contributed to around 13 per cent of headline inflation in December (Chart 32b). CPI inflation excluding food and fuel or core inflation remained elevated at 6.0 per cent in December, though there was some softening from 6.2 per cent seen in November 2021 (Chart 32a). While inflation in clothing and footwear, household goods and services, education, and personal care and effects sub-groups increased, inflation in pan, tobacco and intoxicants, housing, health, transport and communication, and recreation and amusement moderated. High frequency data from the Ministry of Consumer Affairs, Food and Public Distribution (Department of Consumer Affairs) for January so far (January 1-12, 2022) indicate a broad-based softening of prices of key food items. Cereals prices largely remained steady, while pulses as well as edible oils prices continued to register broad-based declines. Prices of potatoes, onions and particularly, tomatoes witnessed seasonal price corrections (Chart 33). 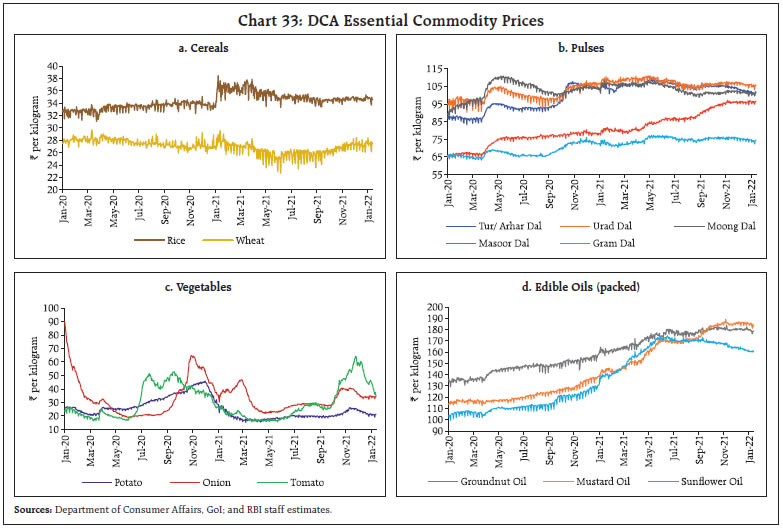
| Table 3: Petroleum Product Prices | | Item | Unit | Domestic Prices | Month-over-month (per cent) | | Jan-21 | Dec-21 | Jan-22^ | Dec-21 | Jan-22 | | Petrol | ₹/litre | 87.57 | 102.93 | 102.87 | -2.5 | -0.1 | | Diesel | ₹/litre | 78.97 | 90.51 | 90.51 | -1.3 | 0.0 | | Kerosene (subsidised) | ₹/litre | 23.21 | 38.68 | 38.68 | -2.1 | 0.0 | | LPG (non-subsidised) | ₹/cylinder | 704.63 | 910.13 | 910.13 | 0.0 | 0.0 | ^: For the period January 1-12, 2022.
Note: Other than kerosene, prices represent the average Indian Oil Corporation Limited (IOCL) prices in four major metros (Delhi, Kolkata, Mumbai and Chennai). For kerosene, prices denote the average of the subsidised prices in Kolkata, Mumbai and Chennai.
Sources: IOCL; Petroleum Planning and Analysis Cell (PPAC); and RBI staff estimates. | Retail selling prices of petrol and diesel in the four major metros remained unchanged in January so far. LPG and kerosene prices also remained steady in the first half of January (Table 3). There was some let-up in input cost pressures in December, as reflected in the PMIs, across manufacturing and services. Selling price increases were muted across manufacturing and services. IV. Financial Conditions With a view to fostering macroeconomic and financial stability and supporting the recovery amidst a renewed surge in infections, the Reserve Bank conducted proactive liquidity management, while maintaining adequate liquidity surplus in consonance with the MPC’s accommodative policy stance. Alongside, rebalancing of the liquidity surplus was continued by migrating surplus liquidity from the fixed rate overnight reverse repo window to the variable rate reverse repo (VRRR) auctions of longer maturity. As part of this process, the Reserve Bank conducted two 14-day VRRR auctions in the second half of the month, i.e., on December 17 and 31, for a notified amount of ₹6.5 lakh crore and ₹7.5 lakh crore, respectively. Complementing the 14-day VRRRs, six fine-tuning operations of 3-7 days maturity and one longer term VRRR of 28-days maturity were conducted to modulate systemic liquidity in a non-disruptive manner, while meeting the productive requirements of the economy. Continuing with the rebalancing of surplus liquidity in the first half of January 2022, the Reserve Bank conducted one 14-day VRRR for a notified amount of ₹5.0 lakh crore and five fine-tuning operations of 3-7 days maturity. Consequently, the daily liquidity absorption under the liquidity adjustment facility (LAF) averaged ₹8 lakh crore in the second half of December 2021 through January 2022 (up to January 13), lower than ₹9.4 lakh crore in the first half. Concomitantly, the liquidity absorbed through the fixed rate reverse repo also moderated to ₹1.5 lakh crore during the period from ₹2.2 lakh crore during mid-November to mid-December 2021 (Chart 34). 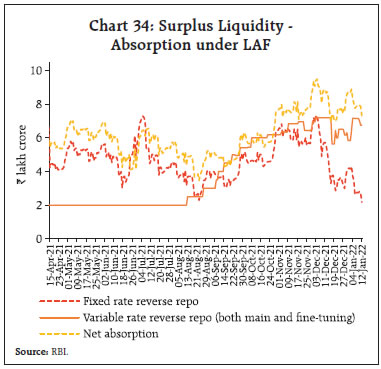
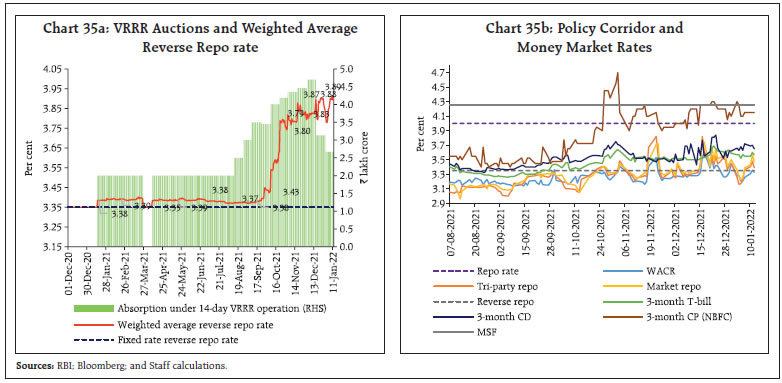 The effective reverse repo rate moved closer to the repo rate9 (Chart 35a). Taking cue from the higher cut-offs in the VRRR auctions, money market rates hardened. Increased frequency of VRRR auctions of 3-4 days maturity and advance tax payments weighed on the short end of the money market in the second half of December 2021. In the overnight segment, while the weighted average call rate (WACR) continued to hover close to the reverse repo rate, those in the collateralised segment - market repo and tri-party repo inched higher from mid-December, albeit, with a softening bias in January 2022. In the term segment, 3-month T-bill and certificates of deposit (CDs) rates evolved in conjunction with the effective reverse repo rate with their average spreads (over the reverse repo rate) ruling higher at 24 bps and 31 bps, respectively, during the latter part of December 2021 through January 12, 2022. On the other hand, rates on 3-month commercial paper (CP-NBFCs) remained elevated in view of buoyant primary market activity (Chart 35b). Bond yields ruled higher, with the 10-year G-sec (old) yield hovering at near two year high levels and closing at 6.58 per cent on January 14, 2022. Global cues, viz., indication of a faster reversal of accommodative stances by major central banks (such as the unexpected hike by the Bank of England), rise in US treasury yields and higher crude oil prices dented sentiments and pushed up yield levels. In the domestic primary segment, higher yield cut offs, coupled with devolvement on primary dealers (PDs) in the weekly auction conducted on December 24, 2021, January 7 and 14, 2022. The Reserve Bank did not accept any bids for floating rate bond 2028 (GOI FRB 2028) and 6.10 GS 2031 and accepted all bids for 6.95 GS 2061 in the weekly auction on December 31, 2021. Bearish tendency also got reflected in the higher underwriting fee for the auction conducted on December 31, 2021 and during first two weeks of January 2022. Corporate bond yields too hardened based on signals from the rise in G-sec yields (Chart 36). Overall monetary and credit conditions evolved in line with the Reserve Bank’s objective of nurturing the nascent recovery. Reserve money (RM), excluding the first-round impact of the cash reserve ratio (CRR) restoration, grew at 9.1 per cent y-o-y as on December 31, 2021 (19.1 per cent a year ago) with currency in circulation - the largest component of RM - expanding at 7.8 per cent (22.1 per cent a year ago). On the other hand, money supply (M3) grew at 9.9 per cent as on December 31, 2021 (12.5 per cent a year ago) on the back of robust deposit mobilisation by banks (10.3 per cent). The growth in scheduled commercial banks’ (SCBs’) credit to the commercial sector, which crossed the 7 per cent level in November 2021 for the first time since April 2020, accelerated further to 9.2 per cent as on December 31, 2021 (6.2 per cent a year ago) (Chart 37). 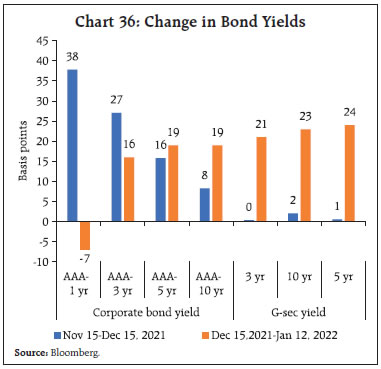 Surplus liquidity and forward guidance on the monetary policy stance continue to facilitate monetary transmission. Since March 2020, the one-year median marginal cost of funds-based lending rate (MCLR) of SCBs softened cumulatively by 100 bps. The median term deposit rate dipped by 154 bps through March 2020 to December 2021. The reduction in the overall cost of funds has enabled transmission to the weighted average lending rate (WALR) on outstanding rupee loans. There has been a complete pass-through of repo rate cuts to the WALR on outstanding loans during March 2020 to November 2021 (Table 4). 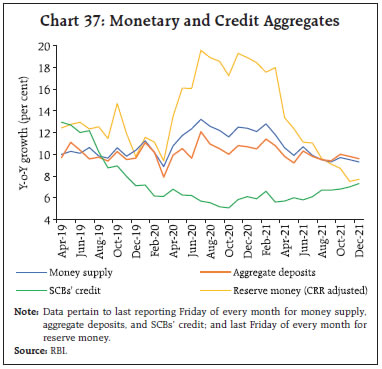 Concomitantly, deposit rates too have moderated across all tenors starting from March 2020. A larger dip of 184 bps is discernible across shorter tenor deposits of up to one-year maturity and a relatively smaller pass-through to deposit rates on longer tenor deposits of maturity above 3 years is seen. Across domestic banks, private banks continue to exhibit higher pass-through to term deposit rates compared to their public sector counterparts (Chart 38). In recent months, a few major banks have started raising interest rates on deposits, anticipating a pick-up in credit demand. | Table 4: Transmission from the Repo Rate to Banks’ Deposit and Lending Rates | | (Variation in basis points) | | Period | Repo Rate | Term Deposit Rates | Lending Rates | Median TDR
(Fresh Deposits) | WADTDR
(Out-standing Deposits) | 1 - Year Median MCLR | WALR
(Out-standing Rupee Loans) | WALR
(Fresh Rupee Loans) | | Feb 2019 - Sep 2019 | -110 | -9 | -7 | -30 | 0 | -43 | | Oct 2019 - Dec 2021* | -140 | -185 | -180 | -132 | -133 | -154 | | Mar 2020 - Dec 2021 * | -115 | -154 | -141 | -100 | -114 | -124 | | Feb 2019 - Dec 2021* | -250 | -213 | -187 | -155 | -133 | -197 | Note: Latest data on WALRs and WADTDR pertain to November 2021.
WALR: Weighted average lending rate; WADTDR: Weighted average domestic term deposit rate;
MCLR: Marginal cost of funds-based lending rate; TDR: Term deposit rate.
Source: RBI. |
The Government of India reviewed interest rates on small saving instruments (SSIs) on December 31, 2021 and left them unchanged for the seventh straight quarter. The current interest rates on SSIs are 42-168 bps higher than the formula-based rates for Q4:2021-22.10 Equity markets turned volatile in December 2021, initially responding positively to the Reserve Bank’s bi-monthly monetary policy announcement of status quo in the policy rate and stance, but reversed gains subsequently on concerns over the spread of the Omicron variant (Chart 39a). With concerns on the severity of the Omicron variant subsiding, the market recouped its losses, tracking positive global cues. On a calendar year basis, Indian equities (BSE Sensex) registered gains of 22 per cent, outperforming most of emerging market peers (Chart 39b). The BSE Sensex advanced by 5.1 per cent in 2022 so far to close at 61,223 on January 14, 2022.
During December 2021, mutual funds recorded net purchases to the tune of ₹21,923 crore, while FPIs turned net sellers, giving up ₹13,150 crore in the domestic equity market. The IPO market remained exuberant, with listing of mainboard IPOs of 12 companies in December– the highest for any month in 2021 (Chart 40a). Resource mobilisation by these companies amounted to ₹15,553 crore. The year 2021 turned out to be the year of the IPO boom, with mainboard listings of 64 companies mobilising ₹1.2 lakh crore, as against mainboard listings of 14 companies mobilising ₹26,312 crore in 2020. Sector-wise, bulk of the resources in 2021 was mobilised by new-age platform based companies operating across food delivery, insurance, auto and financial services verticals (Chart 40b). India’s current account balance recorded a deficit of 1.3 per cent of GDP in Q2:2021-22 as against a surplus of 0.9 per cent of GDP in Q1:2021-22 and 2.4 per cent of GDP a year ago. Reflecting the movement in fundamentals, the Indian rupee (INR) depreciated against the US dollar in December by 0.6 per cent (m-o-m). This was also mirrored in the movement of the INR in terms of the 40-currency real effective exchange rate (REER) index, which depreciated by 1.4 per cent over its level a month ago (Chart 41). India’s net international investment position as at end-September 2021 improved over end-March 2021 with the accretion in Indian residents’ overseas financial assets outpacing the increase in foreign-owned assets in India. A robust accretion to foreign exchange reserves in 2021-22 has, inter alia, improved the coverage of short-term debt (on residual maturity basis) to 248.2 per cent at end-September 2021 from 226.9 per cent at end-March 2021 (Table 5). The sudden surge in Covid cases and anticipation of faster policy tightening by major central banks fed into bearish sentiments among foreign investors. During December 2021, foreign portfolio investors (FPIs) reduced their exposures in both equity and debt segment of the domestic capital market (Chart 42). Going forward, a strong pipeline for IPOs in 2022 and the likely inclusion of sovereign bonds in global bond indices may support FPI inflows. Net disbursements of external commercial borrowings (ECB) to India (including inter-company borrowings) were of the order of US$ 7.5 billion during April-November 2021 as compared with net outflows of US$ 2.3 billion a year ago. A sizeable portion of ECBs raised in November was used for on-lending/sub-lending, new projects and import of capital goods. | Table 5: Key External Vulnerability Indicators | | Indicator | End-Mar. 2021 | End-Sep. 2021 | | 1. External Debt (US$ billion) | 569.6 | 593.1 | | 2. External Debt to GDP Ratio (%) | 21.1 | 20.1 | | 3. Short-term Debt (RM) to Total Debt Ratio | 44.6 | 43.2 | | 4. Reserves to Total Debt Ratio (%) | 101.3 | 107.1 | | 5. Reserves to Short-term Debt (RM) Ratio (%) | 226.9 | 248.2 | | 6. Reserve Cover of Imports (in months) | 17.4 | 14.6 | | 7. Net International Investment Position (IIP)# | -351.1 | -331.8 | | #(US$ billion) | | | | 8. Net IIP/GDP ratio (%) # | -13.1 | -11.6 | RM: Residual Maturity.
IIP: International Investment Position.
#: Negative sign indicates non-residents’ net claims on India.
Source: RBI. | Foreign exchange reserves stood at US$ 632.7 billion on January 07, 2022 (Chart 43), providing a cover equivalent to 13 months of imports projected for 2021-22.
Payment Systems The year 2021 ended on a buoyant note with digital payment transactions across wholesale and retail segments displaying steady growth (y-o-y) in December (Table 6). Transaction values processed under the Real Time Gross Settlement (RTGS) accelerated for the third month in a row, while volumes rose to 1.92 crore, i.e., the highest in FY 2021-22 so far. On the retail front, payments through the National Electronic Funds Transfer (NEFT), Immediate Payment Service (IMPS), National Automated Clearing House (NACH), and Bharat Bill Payment System (BBPS) exhibited sequential improvement in December over its level a month ago. The Unified Payment Interface (UPI) hit another milestone, clocking the highest ever transactions of 456 crore amounting to a record value of ₹8.26 lakh crore. Reflecting the upbeat momentum in mobility, the transaction volumes and values through the National Electronic Toll Collection (NETC) surged to an all-time high. Overall, the daily average transactions across major payment channels gained in value over the previous month. India’s digital payment ecosystem recorded healthy expansion in 2021. The total RTGS volumes accelerated by 37 per cent, while values demonstrated a growth of 18 per cent. Transactions through the UPI channel have more than doubled in both volume and value terms. Other key retail payment modes like the NEFT, IMPS, NETC and BBPS have also posted strong growth during the year. On January 3, 2022, the Reserve Bank released the framework for facilitating offline digital payments through channels like cards, wallets and mobile devices. Such payments have been capped at ₹200 per transaction with a total limit of ₹2000 for all transactions. This move is expected to bolster digital financial inclusion by promoting digital uptake in remote areas with limited internet or telecom connectivity.11 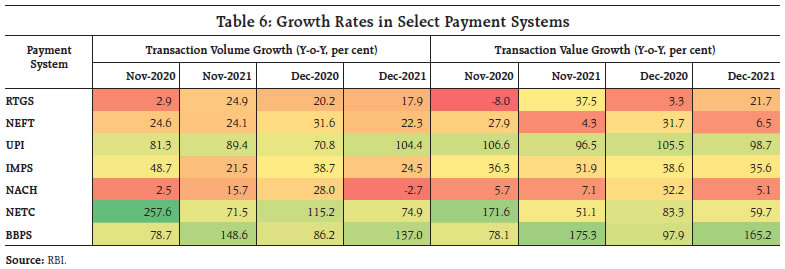 With the aim of improving the security of card-based transactions and ensuring customer privacy, the Reserve Bank has prohibited storing of customer card credentials on merchant platforms and mandated the adoption of Card-on-File (CoF) tokenisation with effect from December 31, 2021. Following representations from industry stakeholders, the deadline to comply with these norms has been extended by 6 months, i.e., till June 30, 2022 to foster a smooth transition to token-based card transactions.12 In order to incentivise adoption of digital payment modes, the Government has rolled out a scheme worth ₹1,300 crore to reimburse a certain percentage of the value of person-to-merchant (P2M) transactions done through RuPay debit cards and BHIM-UPI.13 Data for early January 2022 (up to January 12) indicate growth in digital payments, although the recent surge in infections may pose a concern going forward. Nevertheless, the payment industry is expected to display resilience owing to availability of varied checkout options and rising digital awareness. Market estimates predict that the value of digital payments could jump three-fold from US$300 billion in FY 2021 to US$1 trillion by FY 202614. Conclusion Overall economic activity in India remains strong, with upbeat consumer and business confidence and upticks in several incoming high frequency indicators. On the vaccination front, India has made rapid strides. On the Omicron variant, the recent data from the UK and South Africa suggest that such infections are 66 to 80 per cent less severe, with a lower need for hospitalisation.15 This has brightened near-term prospects and financial markets reflect this optimism. Alongside, monetary and credit conditions are improving with bank credit picking up in a gradual but sustained manner. India’s digital payment ecosystem is also expanding rapidly. In contrast, the global outlook remains clouded by considerable uncertainty. Inflation continues to mount across geographies amidst disruptions in production, supply chains and transportation. Consequently, the divergence between monetary policy stances across jurisdictions has widened. There are indications that supply chain disruptions and shipping costs are slowly easing, although the waning of inflation may take longer. This provides a window of opportunity to focus all energies on accelerating and broadening the global recovery.
|