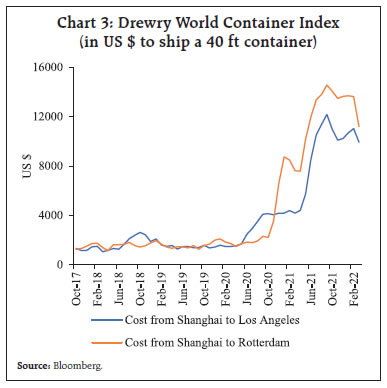
Global container shipping industry, a significant part of global supply chain logistics, came under severe pressure as world trade recovered from the collapse triggered by initial wave of the COVID-19 pandemic. Mirroring the global surge, freight charges in India have also been trending up and contributing to the rising value of India’s exports and imports in the recent quarters. The freight shocks emanating from container shortages and increased market frictions are found to have an impact on domestic retail prices, through import quantum and wholesale price channels under a structural vector autoregression (SVAR) framework. Higher freight also appear to exacerbate the passthrough of import cost shock to retail inflation. Introduction The world-wide restrictions triggered by coronavirus shock in 2020 led to significant collapse of international movements in goods and labour. The pandemic struck when global trade was already facing heightened uncertainties in the wake of Brexit and US-China trade tensions, which had rendered freight capacity relatively stagnant and supply chains disrupted (Patra et. al., 2022). Also, no significant new capacities could have been added during the early waves of the pandemic. The container shipping industry that caters to transport of the traded goods and forms a significant part of global supply chain logistics, came under severe pressure when the world trade recovered swiftly, particularly from sharp acceleration in exports from East Asia, Pacific and China, which reflected in the surge in freight cost across all transoceanic trade routes. In this context, this study looks at international trade in India that rebounded from the initial impact of the pandemic and has now surpassed the pre- COVID-19 average levels and analyses the contribution of freight in imports and exports values, using unit value and quantum indices as well as by constructing quarterly price indices for India, separately for freight and import cost based on the freight to trade ratios as derived components from its balance of payments (BOP) statistics. In view of the greater role of freight price1 in import and export prices in the recent period, it also examines the role of freight in inflation dynamics in India. The interconnected nature of global trade passed through the terrains of both risk and resilience during the pandemic which reflected in its contraction and rebound, aided by initial hindrances and later supply responses. Interruptions to international trade including lower activity or suspension of services on some routes in view of sinking demand and heavy restrictions, led to the congestions at ports, as shipping containers that usually move back and forth, got concentrated at few ports (UNCTAD, 2020). The constrained capacity management by carriers amid swiftly dropping container inventory caused market frictions (viz., long delays at ports, backlog of product waiting to be delivered/cleared/loaded adding to the congestion and leading further to container unavailability). These market frictions were further aggravated by other underlying causes, including pandemic related labour shortages and changing trade patterns - surge in e-commerce, consumer spending shift from contact-intensive services to lockdown-initiated consumer durables and health related supplies, that added more pressure to the shipping costs (Kamali, 2022). The low recycling of empty containers on longer trade routes amid restrictions contributed to their global shortages, which in turn contributed to higher premiums/leasing rates on new containers (UNICEF, 2021). 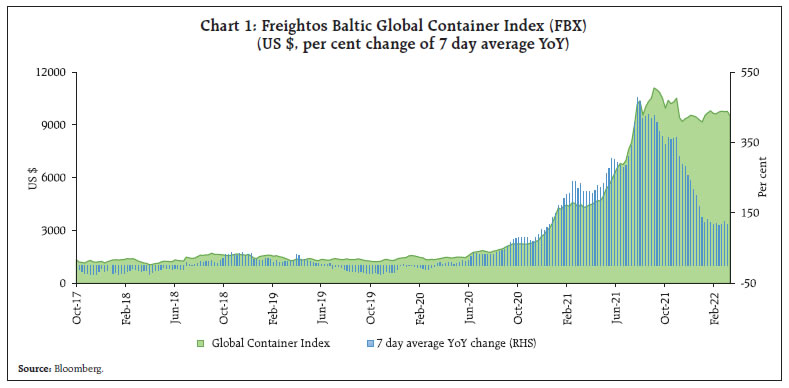 Such increased market frictions led to manifold increase in the global container freight costs at the time when shipping industry was already struggling to meet the surging demand, more notably from China, which recovered sooner from the pandemic vis-à-vis other regions and contributed substantially to the rebound in trade, given its strong position in global trade and its being a dominant container manufacturer (Attinasi et. al., 2021). The market driven shipping costs, as reflected in Freightos Baltic Global Container Index (FBX)2, has been recording over 100 per cent annual growth consistently since late 2020, indicating sustained high pressure (Chart 1). The spikes reflect the strong demand and faster than expected recovery in global trade (Chart 2). Prices of shipping containers and container freight rates across all trade links spiralled up according to the Drewry world container index, which has remained at elevated levels after touching record peak during Sept-Oct 2021 (Chart 3). Reflecting the surge in global commodity prices and transport costs, inflation and inflation expectations in the Euro area and the US have risen substantially in the recent period (Charts 4a, 4b). In order to gauge the inflationary impact of the higher costs, OECD quantifies the pass-through of 50 per cent rise in shipping cost to consumer price inflation (via merchandise import price inflation) to around 0.2 percentage point after four quarters, given the relatively small portion of transport costs in the total goods value (Nefussi and Rusticelli, 2021). Another study looks at the impact of shipping cost on US inflation and estimates that 15 percent increase in shipping costs leads to 0.10 percentage point increase in core inflation after one year (Herriford et. al., 2016). 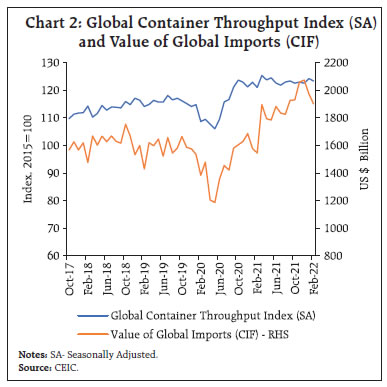
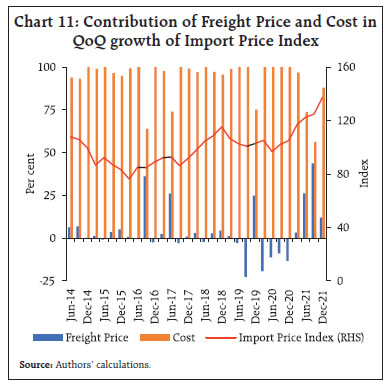
 Based on a sample of 46 countries from February 1992 to December 2021, shipping cost is found to be closely affecting the inflation (Swallow et. al., 2022). The study concludes that a one standard deviation increase in global shipping costs typically increases domestic headline inflation by 0.15 percentage point over 12 months. Even as adverse impact of the pandemic waves is still lingering on the macro-economic conditions in different parts of the globe, the Russian invasion of Ukraine has come as another severe economic shock to the international trade, growth and the prices (OECD, 2022). The rest of the study is organised in five sections. Section II presents some emerging stylised facts in international merchandise trade and freight vis-à-vis India, including trends in their unit value and quantum indices. Section III elucidates construction of unit price indices separately for freight and estimates the contribution of freight in overall increase in import values in context of global surge in freight rates. Section IV examines the impact of freight price shocks on domestic retail inflation and describes structural vector autoregression (SVAR) framework. Section V concludes. II. India’s Commodity Trade and the Freight Costs - Stylised Facts (a) The widespread global trade downturn followed by the V-shape recovery3: With the collapse in international commodity prices, particularly of crude oil in conjunction with weak global demand, international trade that had recovered in 2016-17, deteriorated again from the second half of 2018-19 and further in 2019-20, also led by trade tensions between the US and China, fears of disorderly Brexit in Europe and a subdued global output outlook (UNCTAD, 2021). The widespread trade downturn was also reflected in India’s trade movements (Chart 5) and their growth rates. With the advent of COVID-19 pandemic that followed up with the sharp compression in consumption and investment, and the collapse in international commodity prices during first half of 2020-21, India’s merchandise exports and imports contracted by 7.3 per cent and 18.0 per cent, respectively in 2020-21. 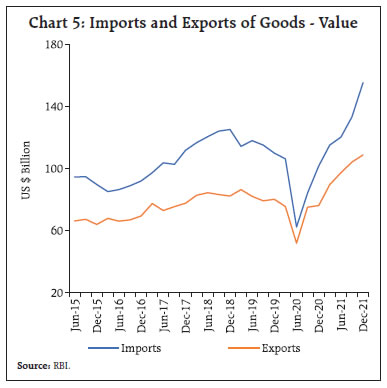 Policy support and rolling out of stimulus packages in response to the stress conditions, and gradual easing-up of lockdown measures with increasing vaccination coverage resulted in fast recovery in domestic demand and improvements in the supply chains in 2021. Also the commodity prices, particularly the oil price dynamics gradually changed during the year with supply restraints more strictly observed by OPEC plus, well supported by additional voluntary production cuts by the OPEC’s largest producers, driving fuel costs further, which in turn, added to higher trade values. The steady rebound was also reflected in India trade movements and their growth rates. (b) Increased freight and shipping costs4: Global spurt in freight costs is reflected in India’s trade as well. In line with rebound in trade and escalating freight, the ratio of freight to India’s exports and imports have also surged in the recent period (Charts 6 and 7). Though the trade fell substantially in Q1:2020-21 in response to COVID-19 demand disruptions, the ratio of freight to total exports and imports stayed elevated as freight charges held up and remained sticky. Foreign trade picked up gradually with easing of the lockdown restrictions and consequent rebound in the economic activity since Q2:2021-22. Acceleration in trade demand drove the freight charges to import ratio that had generally remained steady around 3.5 per cent, upwards to 4.9 per cent by Q3:2021-22. Similarly, the freight to exports ratio climbed to 5.7 per cent in Q3:2021-22 from below 5 per cent during the pre-pandemic period. (c) Soaring unit values5: Unit value (including freight) and quantum indices for imports have risen after the first wave of COVID-19. As the import quantum index caught up with pre-pandemic level, the unit value index continued its sharp upward movement, implying the increasing role of prices (cost plus freight) in driving up imports. On the other hand, both quantity and value contributed in the surge of merchandise exports between Q1:2020-21 and Q3:2021-22 (Charts 8 and 9)6. III. Construction of Price Indices and Recent Trends Three broad variables, namely, value (V), price (P) and quantum (Q) are considered for construction of the freight price indices for merchandise exports and imports. Given the very low share of insurance in total imports measured on ‘cost, insurance and freight’ (CIF) basis, it is included under cost. In other words, the total import price is broken down into two broad groups, viz, cost (C) and freight (F). Since exports are compiled on free on board (FOB) basis, the total export price is equivalent to the cost and accordingly, the freight price needs to be determined separately. Let the variables Vji,t, Pji,t, Qji,t be the value, price, and quantum of group ‘i’ for trade ‘j’ at time ‘t’, where, i = F, C; and j = M, X; M and X imply imports and exports, respectively. Based on the relations, 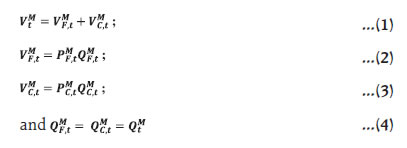 the prices of freight (F) and cost (C) for imports are computed. It may be noted that equation (1) represents the sum of total freight value and the import cost, which are separately determined as the product of price and quantum indices by the equations (2) and (3), respectively. In equation (2), VMF,t is the value index of freight constructed, based on the quarterly value of freight available in the BOP statistics. The equation (2) represents the freight value index as the product of freight price index and the freight quantum index. Further, as represented by equation (4), the quantum corresponding to the freight and the import cost are assumed to be same as the import quantum index. Accordingly, the freight price index is constructed by dividing the freight value index by the import quantum index. The weight contributions of cost and freight to the changes in import prices are computed by taking the shares of their values as weights, which in turn can be expressed as the function of prices, under the assumption of equivalent quantum for both cost and freight. The weights for cost and freight in imports at time ‘t’ are 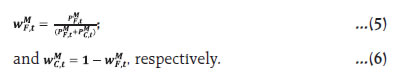 In case of exports, as the freight price needs to be determined separately, the relations that are used to compute the freight prices are where TXF,t and TtX are the inflows received on account of export freight and total exports of goods, respectively. The equation (8) is derived from (7), as the values of exports and inflows received are same. For the construction of export freight price index, the export freight value series is converted into index VXFt, and adjusted with the export quantum index. Following the above approach and using the quarterly data on unit value index (UVI), quantum index (QI) and freight on imports/exports (in value terms) for the period Q1:2013-14 to Q3:2021-22 and the lockdown dummy, the freight prices are estimated. Seasonally adjusted quarter-over-quarter (Q-o-Q) growth rates, using X-13 ARIMA-SEATS method, are used to quantify the impact of freight prices on trade. The export quantum index (QI) is found to observe the seasonal peak in Q3 until 2019-20. However, with successive waves of the pandemic subsequently, the pattern appears to have broken down. Accordingly, while adjusting seasonality for this series, the effective period has been taken as Q1:2013-14 to Q4:2019-20. Due to collapse in trade on account of nation-wide lockdowns, year-on-year (YoY) growth rates for export freight price index recorded strong base effects during the first half of 2021-22, though the influence of base effects on import freight price index was much lower (Charts A1, A2 and Table A1 in the Annex). As year-on-year growth rate is susceptible to the base effect, the quarter-over-quarter (Q-o-Q) growth momentum is used in the rest of the study. Moreover, with a view that the seasonal factors may mask the inherent short-run behaviour, the series are tested and seasonally adjusted while using Q-o-Q growth rates. The implications for the import cost and freight price shocks on domestic inflation have been analysed through SVAR methodology (Sims 1987; Sims and Zha 1998) and is described in Section IV. In this context, it may be mentioned that, in case of the US economy, Attinasi et. al. (2021) analysed and quantified the impact of increased transportation cost through SVAR method, following Herriford et. al. (2016). Also, Kose and Ünal (2021) analysed oil price and its volatility impact on Turkey’s inflation, based on SVAR model. Imports: To explore whether the freight charges in India have taken the greater role in the rising trade values in the context of up-trending global shipping costs, the unit price indices for freight and cost for imports are separately constructed (Chart 10) for the reference period Q1:2013-14 to Q3:2021-22 based on the quarterly UVI and QI using freight to import ratios as weights. It is observed that freight price index has surged sharply since Q3:2020-21, while cost index has slowly and gradually moved up since Q1:2020-21. Additionally, the freight price index is found to display seasonal upticks, mainly during Jan-March of every year (Table A2 in Annex). An analysis of the contribution of the freight price and cost in the quarterly variation of the import price index indicates that freight price has contributed substantially to the rise in import price (and therefore in the value) during Q1 and Q2 of 2021-22 (Chart 11). The movement in share of freight price index in overall unit price index, however, was also influenced by some episodes of muted sequential growth of import price index (e.g., Q2:2016-17, Q1:2017-18 and Q3:2019-20) (shaded in black). The positive contribution of freight price during the first half of 2021-22, was visibly substantial in rising import price index. The contribution, however, shrank in the subsequent periods as the cost component gained more dominance. 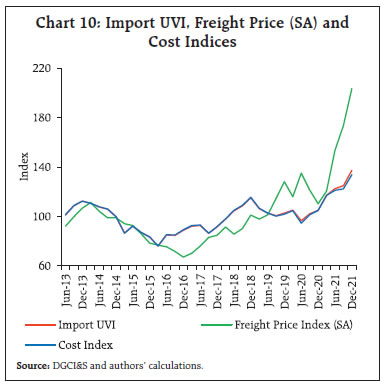
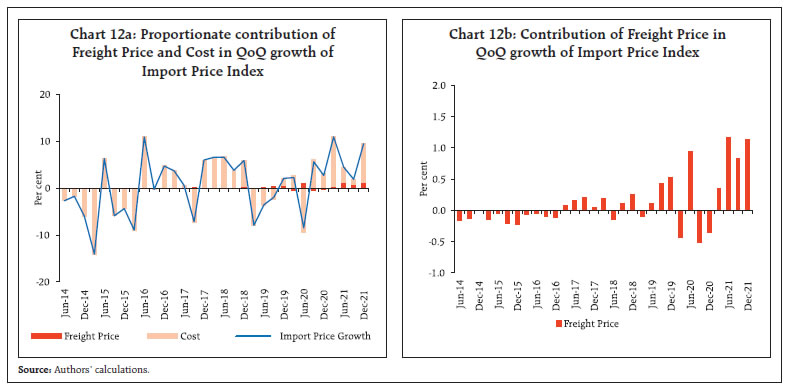 The contributions of freight and cost in total import prices (UVI) were also seen by distributing the Q-o-Q growth rates of total import prices proportionately between the freight price and cost (Chart 12a). It is observed that the changes in total import prices, influenced by the changes in freight prices were substantial in the recent period (Chart 12b). The high freight prices during Q1:2020-21 despite large drop in import prices when global trade collapsed significantly, reflects stickiness in freight prices in a period of restricted movements of some vessels/ routes. However, as mentioned earlier, the latest three quarters of the reference period experienced a visible rise in freight prices, which also contributed to increase in imports prices. Exports: In Q1:2020-21 during the first wave of COVID-19, although exports had fallen drastically in value as well as in volume terms, freight receipts did not moderate, reflecting firmness in the transport service prices. The lower capacity utilisation in carriers during the pandemic could also have prevented fall in freight charges. With the borders opening-up, a clear upward shift in freight prices was observed, which remained strong even as export quantum surged in Q3:2021-22 (Chart 13). IV. Implications of Rise in Freight Prices for Retail Inflation The implication of rise in global freight prices to the domestic inflation through trade channel is empirically established based on SVAR model with five variables, viz., import cost index (PMC,t), freight price index (PMF,t), import quantum index (QtM), domestic wholesale price index (PtWPI) and domestic consumer price index (PtCPI) for the reference period Q1:2013-14 to Q3:2021-22. The quarter-over-quarter (QoQ) seasonally adjusted growth rates of these variables are considered in the SVAR system with the following structure: where, 'π' implies the QoQ inflation, and 'q' is the QoQ growth rate of the quantum of imports. It may be mentioned that, although in the recent period, the surge of world commodity prices has been identified as a major driver for rising inflation and inflation expectations, the world commodity prices are not considered in the SVAR system with a view that it may vitiate the empirical results due to its influence on the import cost. Among the price indices selected for the SVAR system, the domestic price indices are found to be highly correlated. While WPI being commodity price index has higher correlation with import cost, CPI which also includes price of services, has weaker co-movement with import cost. In terms of QoQ growth rates of indices, while the import cost and freight price are found to co-move with WPI, their correlations with CPI are relatively low (Table 1 and Chart 14), which could be due to different basket structures. The structural specification, among the structural shocks (ε) and residuals/errors (u) for determining short-run contemporaneous relationships, is as under: | Table 1: Correlations between Price Indices and their Growth Rates | | | Import Cost | WPI | CPI | | Freight Price | 0.78 (0.13) | 0.86 (0.28) | 0.62 (0.07) | | Import Cost | | 0.79 (0.71) | 0.38 (0.06) | | WPI | | | 0.83 (0.25) | | Note: Figures in brackets imply correlations between growth rates. |
In this specification, apart from the usual restrictions for exactly identified system, the additional restriction α5= 0 is imposed while estimating the model with the view that imports cost would usually be impacting CPI based inflation via its impact on WPI, and not directly7. In addition, a dummy is introduced since the second quarter of 2020 for factoring COVID-19 impact on import cost, freight charges and import quantum8 (Charts A3, A4, A5 in Annex), when the country-wide lockdown severely affected the whole economy including international trade. The lockdown was, thereafter, gradually lifted within the next two quarters. The dummy variables, however, are found to be insignificant for the third and fourth quarters of 2020 and are dropped for the empirical analysis. Table 2 provides the estimated values of coefficients appeared in the contemporaneous structure between the shocks and residuals, along with their levels of significance. The freight shock, which is at the central point of discussion worldwide since Q2:2021-22, is observed to have contemporaneous pass-through to the domestic CPI inflation through the multiple channels. Specifically, the freight shock (for instance, from the shortage of containers or due to increase in market frictions) is observed to be significant and positive for WPI and then impacts retail CPI. Second, although a positive freight price inflation shock is found negatively impacting import quantum to be transported significantly, the impact from import quantum to domestic WPI inflation is observed insignificant. Also, the model does not find the direct contemporary impact of freight shock to CPI. | Table 2: Results of Structural VAR Model | | Dependent \ Shock | Import Cost | Freight Price | Import Quantum | WPI | | Freight Price | 0.44 | | | | | | [ 1.89*] C1 | | | | | Import | 0.15 | -0.36 | | | | Quantum | [ 0.86] C2 | [ -2.91***] C4 | | | | WPI | 0.14 | 0.09 | -0.001 | | | | [ 4.13***] C3 | [3.32***] C5 | [ -0.02] C7 | | | CPI | | -0.01 | -0.001 | 0.15 | | | | [ -1.00] C6 | [-0.10] C8 | [2.50**] C9 | | Note: The symbols *,**,*** imply 10 per cent, 5 per cent and 1 per cent levels of significance, respectively. | 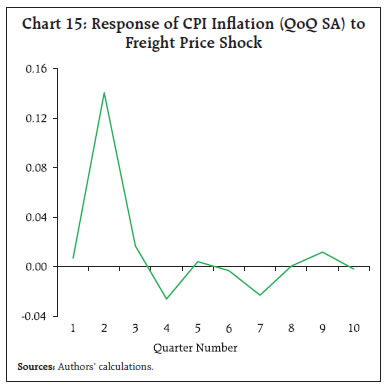 Based on the impulse response function (IRF), it is observed that the impact of freight shock on CPI inflation (QoQ SA) is maximum in the second successive quarter before dying down (Chart 15). Also from the forecast error variance decomposition, the evidence of more than 5 per cent contribution of freight shock to the total forecast error variance of CPI inflation in the second quarter, supports its impact on CPI inflation (Chart 16). In case of import quantum, the contribution of its shock to the total forecast error variance of CPI inflation becomes significant in the third quarter vis-à-vis the second quarter, and thus, underscoring its lag impact on domestic CPI inflation. In order to quantify the impact of exogenous shocks (import cost/freight price) on the domestic retail inflation (YoY), the SVAR system is estimated at first without any shock and the baseline forecasts for CPI and their corresponding inflation numbers are generated. In the second step, the similar procedure is applied with shock and the corresponding forecasts for inflation are obtained. The difference between the inflation forecasts with shock and the baseline forecasts is quantified as the impact of exogenous shock to YoY inflation. 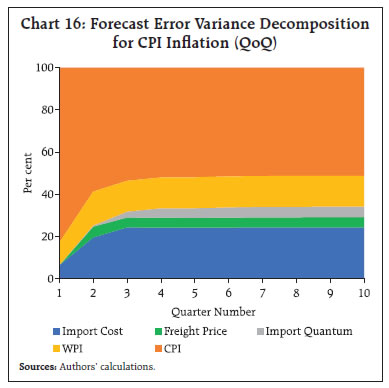 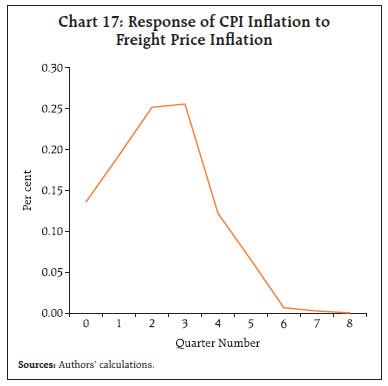 Based on the impulse response function, it is found that 10 per cent rise in import freight cost is expected to raise the year-on-year CPI inflation by 0.89 percentage point over the next six quarters before dying down (Chart 17). In particular, 10 per cent rise in import freight price leads to a rise in annual consumer price inflation by 0.21 percentage point (Table A4 in Annex). Also, the passthrough of import cost to retail inflation, which is predominantly influenced via WPI channel, is also exacerbated by the higher freight prices. V. Conclusions The COVID-19 pandemic-induced supply side disruptions increased transaction costs in many sectors, especially the contact intensive ones. The associated disruptions had adverse impact on many activities, exposing weak links. Global transport of goods was one such segment which has taken time to respond as trade started rebounding after initial wave of the pandemic. In line with sharper recovery in global trade in 2021-22, particularly the imports, that recovered and exceeded the pre-COVID-19 levels faster than the exports, the freight costs surged and have remained elevated since Q3:2020-21 reflecting the increasing supply-demand imbalances, market frictions and constrained shipping capacities. These developments impacted logistic charges worldwide, including in India as reflected in the ratio of freight charges to India’s exports and imports. The study looks at India’s international trade movements and analyses the contribution of freight charges in imports and exports values, using unit value and quantum indices as well as by constructing its quarterly price indices. In view of the greater role of freight charges in import and export prices in the recent period, the study also examines the role of freight costs in exacerbating inflation dynamics in India. The study finds the impact of freight price shocks such as container shortages and the pandemic related market frictions, on the retail prices through import quantum and wholesale price channels. Based on the impulse response function, the study estimates that 10 per cent rise in import freight cost is expected to raise the year-on-year CPI inflation by 0.89 percentage point over the next six quarters before dying down. In particular, 10 per cent rise in import freight price leads to a rise in annual consumer price inflation by 0.21 percentage point. This study precedes the recent Russia-Ukraine war and hence do not quantify the impact on the freight costs from further disruptions caused to supply chains. The softening seen since September 2021 in the transport costs with new capacities coming onstream and economies normalising, has already started getting constrained by the renewed pressure from the war effects. The stretched shipping costs could, therefore, be a new normal for a longer period, contingent largely on easing of geopolitical pressures and appearance of no further pandemic waves. References Attinasi, M. G., Bobasu, A., and Gerinovics, R. (2021). What is Driving the Recent Surge in Shipping Costs? ECB Economic Bulletin, Issue 3, 26-32. Directorate General of Commercial Intelligence and Statistics. Foreign Trade Statistics, various issues. Herriford, T., E. Johnson, N. Sly, and A. Lee Smith (2016). How Does a Rise in International Shipping Costs Affect U.S. Inflation?, Macro Bulletin, Federal Reserve Bank of Kansas City. Kamali, P. (2022). Global shipping costs are easing but pressures remain, IMF Blog. Kose, N., and E. Ünal. (2021). The effects of the oil price and oil price volatility on inflation in Turkey. Energy 226. https://doi.org/10.1016/j.energy.2021.120392 Nefussi, G. S. and Rusticelli E. (2021). How will rising shipping cost affect inflation in OECD countries?, OECD Economics Department. OECD (2021). Rising container shipping costs could push up near-term inflation in OECD countries, OECD Economic Outlook, May. OECD (2022). Interim report on Economic and Social Impacts and Policy Implications of the War in Ukraine, OECD Economic Outlook, March. Patra, M.D., Behera H. and Gajbhiye, D. (2022). Measuring Supply Chain Pressures on India. RBI Bulletin, April. Reserve Bank of India Bulletin. Balance of Payments Statistics, various issues. Sims, C. A. (1987). A Rational Expectations Framework for Short Run Policy Analysis, New Approaches to Monetary Economics, ed. by W. Barnett, and K. Singleton, pp. 293–310. Cambridge University Press. Sims, C. A., and T. Zha (1998). Error Bands for Impulse Responses, Econometrica, 67, 1113–1156. Swallow Y. C., Deb P., Furceri D., Jiménez D. and Ostry J.D. (2022). Shipping Costs and Inflation, IMF Working Paper. UNCTAD (2020). The Impact of the COVID-19 Pandemic on Trade and Development: Transitioning to a New Normal, special publication, UNCTAD interdivisional team. UNCTAD (2021). Key Statistics and Trends in International Trade 2020, Division on International Trade and Commodities (DITC), UNCTAD secretariat. UNICEF (2021). COVID-19 Impact Assessment on Global Logistics and Supplies, UNICEF supply division. U.S. Census Bureau (2017). X-13-ARIMA-SEATS Reference Manual, Version 1.1.
Annex | Table A1: Base Effects of Freight Price Index for India’s Exports and Imports | | Quarters | Freight Price Index for Exports | Freight Price Index for Imports | | Base Effect | Q-o-Q Growth | Difference in Y-o-Y Growth | Base Effect | Q-o-Q Growth | Difference in Y-o-Y Growth | | 2019-20:Q1 | -9.9 | 8.7 | -1.2 | 16.5 | -5.2 | 11.4 | | 2019-20:Q2 | -4.0 | -2.4 | -6.4 | -6.2 | 13.6 | 7.3 | | 2019-20:Q3 | -6.1 | 9.7 | 3.6 | -13.8 | 14.1 | 0.3 | | 2019-20:Q4 | 10.6 | -13.3 | -2.8 | -2.0 | -6.8 | -8.8 | | 2020-21:Q1 | -8.7 | 57.1 | 48.4 | 5.2 | 8.6 | 13.8 | | 2020-21:Q2 | 2.4 | -30.7 | -28.3 | -13.6 | -10.3 | -23.9 | | 2020-21:Q3 | -9.7 | 3.5 | -6.2 | -14.1 | -6.0 | -20.1 | | 2020-21:Q4 | 13.3 | -10.4 | 3.0 | 6.8 | 11.0 | 17.8 | | 2021-22:Q1 | -57.1 | 0.8 | -56.3 | -8.6 | 18.4 | 9.8 | | 2021-22:Q2 | 30.7 | 5.5 | 36.2 | 10.3 | 12.5 | 22.8 | | 2021-22:Q3 | -3.5 | 14.7 | 11.2 | 6.0 | 19.4 | 25.4 |
| Table A2: Average Seasonal Factors (Period: 2013-14 to 2020-21) | | Variable | Q1 | Q2 | Q3 | Q4 | | Imports Cost | 101.0 | 99.0 | 100.5 | 99.8 | | Freight Price | 97.2 | 97.1 | 98.6 | 106.9 | | Imports Quantum | 106.0 | 100.0 | 97.7 | 96.3 | | WPI | 100.1 | 100.5 | 100.3 | 99.2 | | CPI | 99.5 | 100.6 | 100.6 | 99.2 |
| Table A3: Estimated Coefficients – SVAR Exactly Identified System | | Dependent \ Shock | Import Cost | Freight Price | Import Quantum | WPI | | Freight Price | 0.44 | | | | | | [ 1.89*] C1 | | | | | Import Quantum | 0.15 | -0.36 | | | | | [ 0.86] C2 | [ -2.91***] C4 | | | | WPI | 0.14 | 0.09 | -0.001 | | | | [ 4.13***] C3 | [3.32***] C5 | [ -0.02] C7 | | | CPI | -0.02 | -0.01 | 0.001 | 0.20 | | | [ -1.20] α5 | [ -1.09] C6 | [0.04] C8 | [2.77***] C9 | | Note: The symbols *,**,*** imply 10%, 5% and 1% levels of significance, respectively. |
| Table A4: Response of Domestic Retail Inflation via Freight Price changes under SVAR Framework | | 10% shock to | Average Response of CPI Inflation
(Y-o-Y) over next one year (in bps) | | A. Freight Price | 21 | | Channel 1: via Import Quantum and WPI | 10 | | Channel 2: via WPI | 25 | | B. Import Cost | 36 | | B1. Import Cost via Freight Price | 22 | | Channel 1: via Freight Price, WPI | 24 | | Channel 2: via Freight Price, Import Quantum and WPI | 17 | | B2. Import Cost via WPI | 30 | | All variables simultaneously | 58 |
|