The global surge in inflation since the second half of 2021 has reignited interest in assessing the role of post-pandemic balance sheet policies of central banks in fuelling inflation, against the backdrop of the missing inflation puzzle that was encountered after the global financial crisis (GFC). This article explains the link between RBI’s balance sheet size, growth in monetary aggregates and inflation, and explores conditions under which excess money growth may not be inflationary. It finds that in the post-COVID period, the decline in income velocity of money and persistent negative output-gap warranted a larger than usual growth in monetary aggregates, without endangering the inflation outlook. The intellectual pivot for monetary policy that “inflation is always and everywhere a monetary phenomenon”1 views money supply as an exogenous process, solely determined by the monetary authority. Excess money creation, or unrestrained expansion in the balance sheet size of a central bank, accordingly, has been vaunted as the prime driver of inflation. The practice of central banking since the 1990s, however, has progressively de-emphasized this wisdom, with interest rate emerging as the key instrument of monetary policy, thereby discrediting any meaningful role for exogenously determined money supply. In fact, most models for contemporary macroeconomic policy analysis either exclude money, or at best treat money as endogenous or demand determined, precluding any causal role for money (Carpenter et al, 2010). In the monetary policy strategy review undertaken by the European Central Bank (ECB) in 2021, it also highlighted “a weakening of the empirical link between monetary aggregates and inflation”. The prime driving force behind this overwhelming shift in monetary consensus has been the growing realisation that money supply is not exogenously determined by a central bank. In practice, it is determined endogenously by the private sector (and government) demand which the central bank must accommodate to keep the interest rates in the economy aligned to its policy interest rate. If a central bank injects excess primary money into circulation than what the private sector desires to hold or can absorb, it must come back to the central bank as unabsorbed excess liquidity in the system. Unless fully absorbed by the central bank, money market rates can crash to levels below the policy interest rate. A corridor system for implementing monetary policy may provide a floor to money market rates, but even then, excess liquidity could still remain largely non-inflationary in the absence of adequate demand to absorb the surplus liquidity. Since the global financial crisis (GFC) of 2008, however, the exogenous money view has resurfaced, with the central banks of advanced economies (AEs) resorting to large scale asset purchase programmes, or unconventional balance sheet policies, highlighting new channels for transmission of such unconventional policies to support recovery in growth2. The missing inflation puzzle post-GFC for more than a decade emboldened them to persevere with oversized balance sheets, till they faced the upsurge in inflation in 2021 and 2022 (so far) prompting them to end QE/ start quantitative tightening (QT). This has reignited research interest in examining the relevance of the monetarist view to the contemporary world. Large scale expansion in the balance sheet size of the Federal Reserve post-GFC was not inflationary because money supply growth remained subdued relative to growth in base money (implying a collapse in the money multiplier) and also nominal GDP or demand in the economy was not very sensitive to expansion in base money (reflected in a collapse in the income velocity of base money), together explaining a profound breakdown of the relationship between base money and inflation/economic activity (Williams, 2012). The relationship, however, was expected to re-emerge with recovery in economic activity as banks were more likely to use excess reserves for new lending in such a situation rather than park them with the central bank. This eventual risk materialised in the US with the robust post-COVID recovery in economic activity led by fiscal and monetary stimulus that was evident from record high growth in money supply in 2021 and 2022 (so far). Recent research on the importance of reference value of monetary aggregates to assess risks to inflation under different economic conditions suggests that when inflation is stable and close to the target, the relationship from money to inflation may not be relevant. In unsettled monetary and inflationary conditions (i.e., periods of high variability in both), however, monetary aggregates tend to provide useful lead information about inflation (Cadamuro and Papadia, 2021). Others nevertheless reiterate the view that there is no causal relationship between base money and inflation (Stella, et al., 2021). The post-GFC missing inflation conundrum and the recent (post-COVID) surge in inflation in some of the major advanced economies, given that both outcomes coincided with bloated balance sheets of their respective central banks, inspire curiosity to revisit the relevance of the conventional monetarist view to current Indian conditions. In India, the post-COVID unconventional monetary measures - that ranged from provision of term liquidity up to three years at overnight repo rate on the one hand to the use of G-sec Acquisition Programmes (G-SAPs) to facilitate a non-disruptive completion of record high borrowings of the government on the other, involving an injection of cumulative potential liquidity equivalent to 8.7 per cent of GDP - and the associated expansion in Reserve Bank of India (RBI)’s balance sheet size has also been viewed as a risk to inflation (Rangarajan, 2022; Ranade, 2022). The endogenous money view, given the persisting and large negative output-gap3, however, would generally suggest no risks to inflation as the demand for money continues to be weak. Only a robust pick-up in demand that can absorb the surplus liquidity in the system could be inflationary. Empirical findings for India suggest that excess liquidity that does not lead to higher broad money growth is not inflationary (RBI, 2017). An informed assessment of the significance of endogenous versus exogenous monetary channels in the current Indian context requires a revisit of several lessons from past experience. First, in a crisis time, income velocity of money could crash and as a result the information content of money growth may become ambiguous (Pattanaik and Shankaran, 2011). Higher money growth may counterbalance the contractionary impact of the velocity shock rather than pose risks to inflation. Second, the stability of conventional money demand function, which is the bedrock of monetarism, is increasingly less likely to hold in the age of financial innovations, rising digital non-cash modes of payments for transactions and also in view of the emergence of FinTech for financial intermediation. In India, non-banks (i.e., non-banking financial entities and markets) meet about 50 per cent of the annual financial resource requirement of the commercial sector, and this share also changes from year-to-year. Monetary aggregates, accordingly, provide less consistent lead information about transaction demand in the economy. Third, transitory supply shocks to inflation may at times be accommodated by the central bank, which could invariably reverse the direction of causation (from inflation to money supply, rather than the opposite as propounded by the exogenous money view). Fourth, the experiment with the efficacy of an exogenous monetary expansion in AEs post-GFC could be sustained in a low inflation environment. The scope for such an experimentation in a high inflation regime may be limited, given the risks of unhinging inflation expectations and also likely policy ineffectiveness resulting from economic agents adjusting fully to the money financed stimulus by anticipating its consequences for inflation and the associated erosion of financial wealth/savings. The emergence of private markets for funding – reflected in the private equity (PE) boom providing “one-stop-capital” to firms as an alternative to funding from banks and public markets (through bonds and shares) – can also add further haze to the relationship between any conventional measure of money and inflation (The Economist, 2022a and 2022b). Against this backdrop, this article examines the relationship between RBI’s balance sheet size and CPI inflation, with a focus on identifying the leading information properties of reserve money. Section II compares RBI’s balance sheet size with other major central banks that have adopted aggressive quantitative easing (or balance sheet) policies in response to both GFC and COVID-19. The difference between balance sheet size and reserve money (or high-powered money created by the RBI) is presented in Section III, with an assessment of the causal relationship between reserve money (M0)4, broad money (M3), balance sheet size on the one hand and CPI inflation on the other, with a view to check the empirical significance of the endogenous money view. Recognising the role of time-varying nature of money multiplier and income velocity of money in disturbing the signals embodied in monetary aggregates, their patterns are also studied in this section for normal and stress periods. In view of the expected role of the state of business cycle in altering the degree of sensitivity of inflation to changes in monetary aggregates, the impact assessment is undertaken in Section IV, enabling assessment of risks to inflation from money growth when monetary stimulus in a period of economic slack aims at achieving non-inflationary recovery in growth. Concluding observations are presented in Section V. II. Balance Sheet Expansion in Response to COVID-19 Like many AEs, India also resorted to unconventional monetary policies to ease COVID-19 related stress in the financial markets/specific segments of the economy and ensure flow of credit to the productive sectors of the economy (for details, refer to Patra, 2022). As a result, RBI’s balance sheet size as a per cent of GDP expanded to 28.7 per cent in 2020-21, before moderating to 26.5 per cent in 2021-22 (Chart 1a). The post-COVID expansion in the RBI’s balance sheet was, however, relatively subdued compared to the scale of expansions recorded in the AEs such as the US, UK and Euro area. Moreover, the order of expansion in the stock of reserve money as a percentage of GDP was particularly restrained in India5. In fact, the evolution of reserve money in relation to nominal GDP in India has been along a stable trajectory all through and occasional crisis time deviations have normalised quickly.6 These distinctions are often not kept in perspective in India while highlighting concerns based on central bank balance sheet patterns observed in AEs. 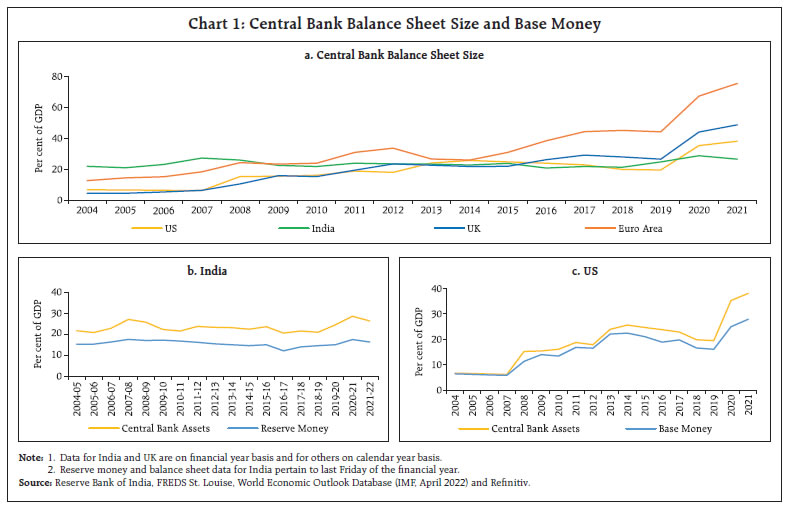 III. Balance Sheet Size versus Monetary Aggregates A decomposition of RBI’s balance sheet as a per cent of GDP from the liability side shows that its headline expansion in 2020-21 was driven by increases in both reserve money (monetary liabilities) and other liabilities together with a contraction in nominal GDP, while the subsequent moderation is largely because of reduction in other liabilities (Chart 2a). At a further disaggregated level, other liabilities mainly comprise net non-monetary liabilities (NNML) of RBI reflecting movements in currency and gold revaluation account (CGRA) - on account of revaluation of foreign currency assets and gold due to exchange rate and gold price changes - as well as reverse repo/standing deposit facility (SDF) outstanding amounts, representing absorption of excess liquidity (Chart 2b). In fact, a large part of the moderation of the balance sheet size as a per cent of GDP in 2021-22 reflects the gradual unwinding of unconventional liquidity injections given their embedded sunset dates and a pick up in nominal GDP. 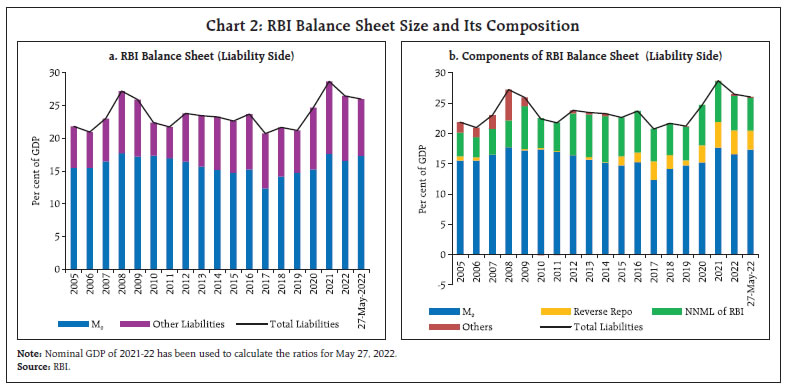 In view of the large difference between balance sheet size and base money, it may be pertinent to examine their relationship with inflation separately. The relationship between growth in balance sheet size and inflation is observed to be flatter than that between growth in reserve money and inflation (measured by both CPI and WPI) (Chart 3). As explained above, while balance sheet size has received greater attention in the post-COVID period, it is the base money and other monetary aggregates that matter to any analysis of monetary sources of inflation. Accordingly, we focus on reserve money and its relationship with broad money and GDP to analyse the dynamic relationship between money and inflation.
As one would expect, money and inflation being two nominal variables, there is a high degree of co-movement between growth in money supply and inflation in India (Chart 4). Moreover, the strength of the relationship (as measured by correlation coefficient) has also increased over time (though remain statistically insignificant between CPI inflation and M0), suggesting money’s role as a valuable source of information for inflation analysis, notwithstanding their cause-and-effect dynamics. In fact, the correlation of (one year) lagged money growth with inflation (that accounts for the monetary transmission lag), which had weakened with the progressive de-emphasis on money (and increasing emphasis on interest rate) as the policy instrument since the adoption of multiple indicator approach in 1998-99, has increased post-GFC, especially during the flexible inflation targeting (FIT) period (Chart 5a). A similar trend is observed in case of correlation of lagged money growth with wholesale price index (WPI) inflation (Chart 5b)7. In an endogenous money supply process, normal accommodation of inflation up to a limit (threshold or target) could yield a positive relationship. In an exogenous money supply process under a monetary targeting regime, however, targeted money growth ex ante may accommodate tolerable inflation, but in the event of inflation overshooting the tolerable level policy induced monetary contraction could yield a negative relationship ex post8. 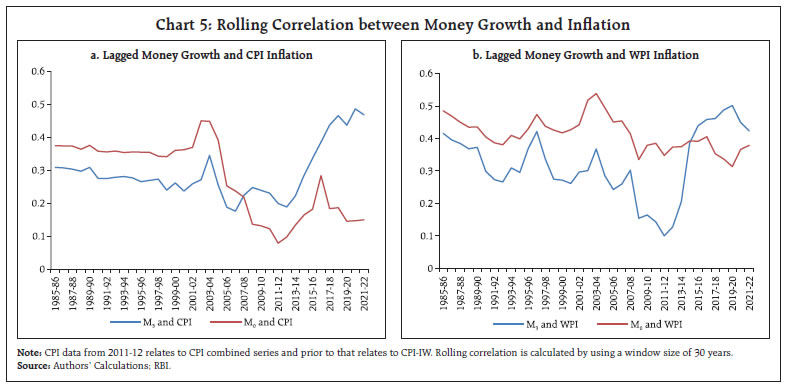 A formal test of the direction of causality between reserve money and inflation supports unidirectional Granger causality9, i.e., reserve money growth Granger causing inflation in India during the sample period 1971-72 to 2021-2210. But in the case of broad money growth, causality turns bi-directional, i.e., broad money growth not only Granger causes inflation but is also caused by inflation (Table 1). On the other hand, RBI balance sheet growth and inflation do not exhibit any statistically significant causal relationship, corroborating the need for focusing on monetary aggregates instead of balance sheet size for inflation analysis in India. Given the above empirical evidence on money (both reserve money and broad money) Granger causing inflation, it is important to understand the relationship between the two during periods of exogenous shocks and different states of the business cycle, so as to assess whether every increase in money supply is inflationary. Insights on whether the relationship of money with inflation is symmetric or asymmetric over the business cycle could be of critical significance to monetary policy, even when policy is conducted by changing the interest rate, as that can influence the speed and timing of rate actions, which, in turn, could influence money demand and restore price stability. Table 1: Granger Causality Test Results
(Sample: 1971-72 to 2021-22) | | Hypothesis | Lag | F-Stat | P-value | | M0 Growth Doesn’t Cause CPI Inflation | 3 | 4.15** | 0.01 | | CPI Inflation Doesn’t Cause M0 Growth | 3 | 0.97 | 0.42 | | M3 Growth Doesn’t Cause CPI Inflation | 2 | 3.37** | 0.04 | | CPI Inflation Doesn’t Cause M3 Growth | 2 | 4.45** | 0.02 | | Balance Sheet Growth Causes CPI Inflation | 1 | 0.99 | 0.32 | | CPI Inflation Causes Balance Sheet Growth | 1 | 1.72 | 0.20 | The lag length selected to perform the Granger causality test is based on ‘Likelihood Ratio (LR) test’.
**: Null hypothesis of no causality is rejected at less than 5 per cent level of significance. | It is evident from experience that during periods of extreme exogenous shocks such as the COVID pandemic or the GFC, the relationship between reserve money and broad money breaks down due to risk averse behaviour of economic agents (reflected in higher precautionary household savings in the form of currency, which raises the currency to deposit ratio and in turn lowers the money multiplier)11. Due to liquidity hoarding and the fear of restrained access to liquidity, income velocity of money may fall, at times by a large magnitude. In order to restore monetary (M3) balance in the economy and to ensure that risk averse behaviour due to uncertainty does not freeze financial markets, central banks commit to and provide ample liquidity to the system, i.e., they compensate for the fall in velocity of money by increasing the reserve (base) money. All of the liquidity injected, however, does not get absorbed in the system, as a result of which a part of it flows back to the central bank and remains as idle balances in the balance sheet of the central bank (such as outstanding reverse repo/SDF balances in India). Thus, a part of the liquidity injected by the central bank supports higher money creation to compensate for the drop in velocity while another part remains merely as unutilised liability of the central bank until the economy recovers from the shock. The pace at which the economy may recover after a shock is an important indicator to early warn the ominous risks to inflation. Thus, while money growth in the event of an exogenous adverse shock may have to be higher than any non-inflationary norm for normal times, as the shock dissipates money growth must normalise to ward off risks to inflation. In India, reflecting the preference of economic agents to hoard liquidity in a crisis and also limited opportunities to spend after the pandemic, the transaction velocity of money (i.e, nominal GDP divided by M3 money stock) declined sharply after COVID from 1.3 in 2019-20 to 1.1 in 2020-21 and 2021- 22 (Chart 6a). The money multiplier (i.e., M3 divided by base money) also declined from 5.57 in 2019-20 to 5.48 in 2020-21 and further to 5.20 in 2021-2212, as the currency to deposit ratio rose from 0.16 to 0.17 and further to 0.18 during the corresponding period (which is equivalent to about 200 bps increase in CRR in terms of impact on money multiplier) (Chart 6b)13. Higher growth in reserve money (18.8 per cent in 2020-21) and money supply (12.2 per cent) during this period needs to be assessed keeping in view the changes in velocity and money multiplier. A similar pattern was also observed in the aftermath of the GFC when velocity fell. Thus, in crisis situations money growth may have to be somewhat higher to compensate for the decline in velocity, and to meet the requirement of money demand associated with the same level of nominal GDP in the economy. Only when money growth is not contained even after velocity returns to normal levels after a crisis that excess money injection can be inflationary. Moreover, when velocity normalises (i.e., rises after a fall), a lower order of M3 growth may coexist with higher growth in nominal GDP, unlike the perceived proportional relationship between M3 growth and growth in nominal GDP, which holds only in normal times when velocity may exhibit reasonable stability. 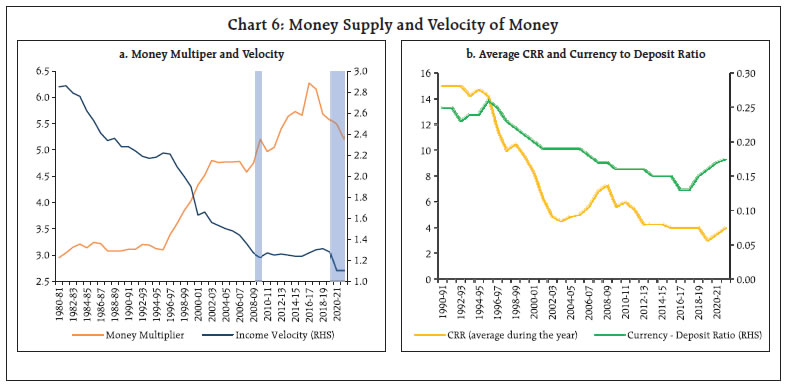 Section IV: Exploring the Fuzzy Dynamics Recent empirical research covering the impact of balance sheet policies on inflation highlights that: (a) the association between money growth and inflation is modest, unless initial conditions – high level of inflation, large fiscal deficit and weak central bank independence – are adverse, causing a disproportionate increase in inflation with expansion in money supply, and (b) announcements of unconventional monetary policies (UMPs) that cause monetary expansion may not always increase inflation expectations, particularly when such policies are used in response to an exceptional shock like the COVID pandemic (Agur et al., 2022). For an assessment of excess primary money as a cause of inflation, it is important to recognise that both exogenous and endogenous views may be at work at the same time. When adverse food and fuel shocks raise inflation temporarily, monetary policy may accommodate such inflation, particularly the first-round impact, making the causality run from inflation to money supply14. On the other hand, when a central bank increases surplus liquidity in the system in sync with an accommodative monetary policy stance, the causality is reversed and expected to run from exogenous money to economic growth (or growth in nominal GDP, which would comprise the impact of policy stimulus on both real GDP and inflation). Different channels of monetary policy – lower term premium, depreciated exchange rate, higher asset prices – may still allow the exogenous money channel to work. Thus, when both exogenous and endogenous dynamics are at play, the impact of excess money supply on inflation could be largely viewed as an empirical country-specific and context-specific issue. In view of the complex interactions between central bank liquidity measures, money creation process and inflation dynamics during periods of exogenous shocks, it is important to examine the nature of the relationship from an empirical perspective. Anecdotal evidence suggests that the inflationary impact of crisis-time liquidity/money may be contingent on the nature of credit growth in the economy (which is the main medium for absorption of surplus liquidity in the system), i.e., whether it is weak due to prevailing slack in the economy or grows at above-trend pace to stimulate recovery and thereby close the output-gap. In India, in the post- COVID period, actual credit growth has been around its declining long-term trend (Chart 7a) and capacity utilisation rate has also hovered below its long-term average (Chart 7b) suggesting the continuing presence of slack in the economy. Against this backdrop, the possible presence of asymmetric impact of money growth on inflation is examined below. We examine the causal impact of money supply on CPI inflation using a standard vector autoregression (VAR) model with a vector of three endogenous variables Υt = [πt, Δγt, Δmt]´ covering data for the period 1996:Q2 to 2022:Q1. Here, πt represents CPI inflation (year-on-year), Δγt refers to real GDP growth (year-on-year) and Δmt is money supply growth (year-on-year). The VAR is estimated with an interactive dummy which takes the value of one for positive output gap (expansion) and zero for others (contraction/no change), and by interacting the dummy variable with money supply growth. The parameters of VAR models are estimated by using Bayesian methods with Jeffrey’s (uninformative) priors. The posterior distributions of the parameters are obtained through a Gibbs sampler algorithm. The responses to money supply shock are identified through a recursive identification scheme based on 50000 draws. The impulse responses from Bayesian VAR models (the median values) suggest that both GDP growth and inflation rise in response to higher money supply, measured in terms of either M3 or M0, when full sample data are used but without the interactive dummy (Charts 8 and 9; first column). 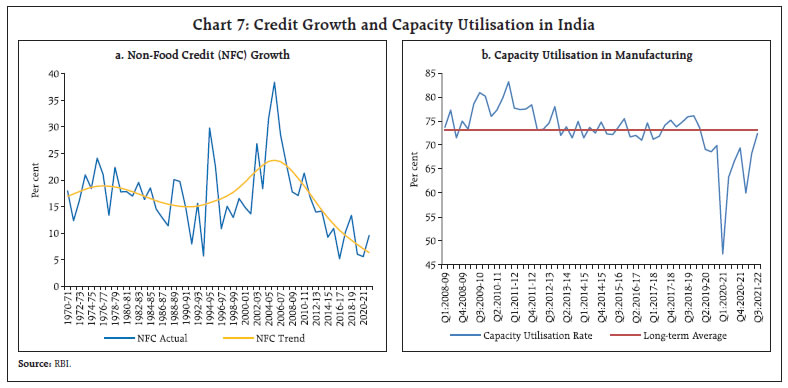
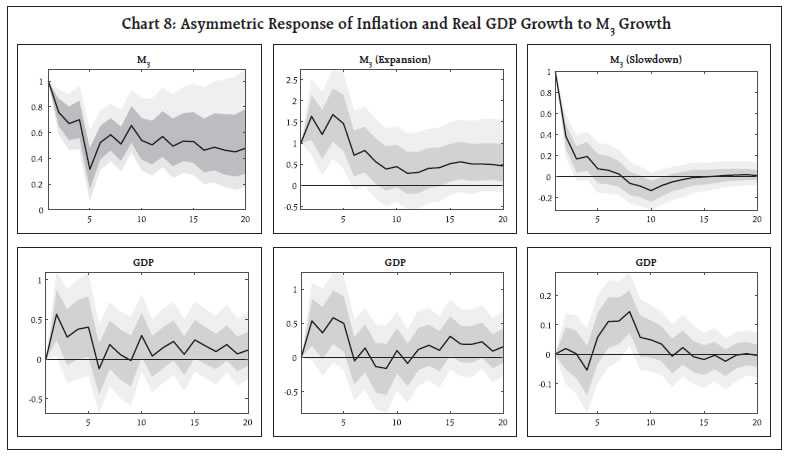 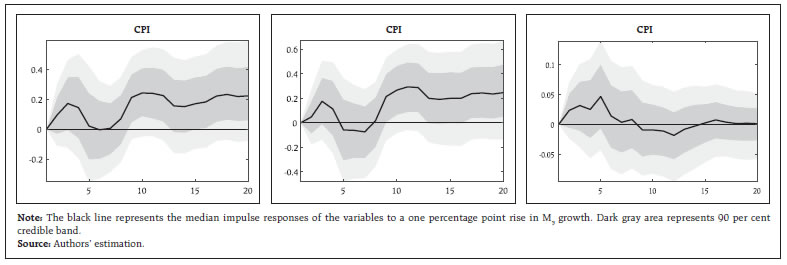 When the state of the business cycle is incorporated through the interactive dummy, it is found that the impact of an increase in money supply on inflation is positive and statistically significant during periods of economic expansion while the impact is statistically weak during periods of economic slowdown or when the output-gap is negative. Additionally, the impact of money supply on inflation is persistently higher and positive for a long period when there is no slack in the economy. These results suggest that money supply expansion during periods of economic slack may not be inflationary, but once the economy recovers to the steady state position, curbing excess growth in money may be necessary to secure price stability. V. Conclusion In India, the size of the RBI’s balance sheet does not exhibit any statistically significant causal relationship with CPI inflation. The reserve money or primary money created by the RBI constitutes only a part of the balance sheet size, which multiplies through the banking system to determine the stock of broad money (or M3) in the system at any point in time. Empirically it is found that both reserve money and broad money exhibit statistically significant causal influence on inflation, highlighting their continuing utility as reference indicators to early warn risks to the inflation outlook in India, notwithstanding the progressive de-emphasis of monetary aggregates in the conduct of monetary policy across the world in view of the established edge of interest rate as the more effective policy instrument. While the endogenous money view – i.e., it is the demand for money that decides the supply of money in a monetary policy regime where policy is conducted by changing the interest rate – holds sway, the exogenous money view may be still relevant, particularly when excess exogenous money created by a central bank allows accommodation of supply shock induced inflation and/or a stimulus-led revival in demand. It is important therefore to assess money growth: (a) by taking into account occasional large exogenous shocks that could significantly alter the values of velocity of money and money multiplier; and (b) by recognising the asymmetric impact of money growth on inflation during periods of economic slowdown and periods of expansion. In India, notable declines in income velocity of money and the money multiplier in the post-COVID period warranted higher growth in both reserve money and broad money to meet the transaction financing needs of the economy, which need not be construed as inflationary, unless empirically established. Empirical results suggest that money growth does not pose risks to inflation in the presence of economic slack. When the economy is in an expansionary phase, however, an increase in money supply can cause higher inflation. These findings indicate that money growth during the COVID period was not a primary source of inflation, but as the economy recovers to its trend level and velocity of money normalises, curbing excess money growth timely can help secure the goal of price stability. References Agur, I., Capelle, D., Dell’Ariccia, G., & Sandri, D. (2022). Monetary Finance Do Not Touch, or Handle with Care?. IMF Research Department Paper, January. Carpenter, S., and Demiralp, S. (2010). Money, Reserves, and the Transmission of Monetary Policy: Does the Money Multiplier Exist?. Finance and Economics Discussion Series, Federal Reserve Board, Washington DC, 2010-14. Cadamuro, L., and Papadia, F. (2021). Does money growth tell us anything about Inflation? Bruegel- Working Papers, NA-NA. Friedman, M. (1970). Counter-Revolution in Monetary Theory. Wincott Memorial Lecture, Institute of Economic Affairs, Occasional Paper 33. Heinz , Gerit. and Köhling, Stefan. (2021). Inflation and the Money Multiplier. CIO Special, October 14. Pattanaik, S. and Sankaran, S. (2011). The Velocity Crowding-out Impact: Why High Money Growth is not Always Inflationary. RBI Working Paper Series, No. 6. Patra, M.D., Behera, H. and John, J. (2021). Is the Phillips Curve in India Dead, Inert and Stirring to Life or Alive and Well?, RBI Bulletin, November. Patra, M. D. (2022). RBI’s Pandemic Response: Stepping out of Oblivion. Keynote Address delivered at the C D Deshmukh Memorial Lecture organised by the Council for Social Development, Hyderabad on January 28, 2022. Ranade, A. (2022). Excess Cash in Circulation has Both Winners and Losers. Mint, May 31, Mumbai. Rangarajan, C. (2022). Hear the Liquidity Sloshing. The Economic Times, January 25. RBI (2017). Monetary Policy Report, Box IV.2, October 4, Reserve Bank of India. ___ (2022), Report on Currency and Finance 2020-21, March, Reserve Bank of India. Stella, M. P., Singh, M. M., and Bhargava, A. (2021). Some Alternative Monetary Facts. IMF Working Paper, No. 2021/6. The Economist (2022a). Fired Up. Special Report on Private Markets, February 26. The Economist (2022b). Balance-sheet Manoeuvres. Special Report on Central banks, February 26. Williams, J.C. (2012). Monetary Policy, Money, and Inflation. Presentation to the Western Economic Association International, July 2.
|