With increasing demand for ground water from farm and non-farm sectors, enhancing irrigation efficiency is critical for sustainable agriculture. This article computes the area-weighted cost of irrigation, estimates technical efficiency of irrigation and identifies factors influencing technical efficiency for 19 agriculturally important States in India. The study finds a declining trend in the area-weighted cost of irrigation partly reflecting the subsidised power supply and lower irrigation efficiency in most of these states. Cost and availability of energy to the farm sector along with the depth of ground water level appear to influence the irrigation efficiency. There is a need for redesigning irrigation policy including promotion of improved technological interventions to correct the inter-state irrigation imbalances. Introduction Globally, availability of adequate water and its balanced distribution to various sectors of the economy is emerging as a key concern. Water resources are becoming increasingly scarce due to growing demands from households for drinking and sanitation; from the farm sector for irrigation purposes; and from the non-farm sectors, including the energy sector1. To illustrate, nearly a quarter of the world’s population living in 17 countries face ‘extremely high’ water stress (as per World Resources Institute’s Aqueduct Water Risk Atlas). India ranked 13th in this list with a population more than three times the combined population of the other 16 nations (GoI, 2019). The supply of clean and usable water has not kept pace with the demand from various sectors making the balanced allocation among these sectors a policy challenge. Agriculture sector absorbs the largest share of water in most economies, particularly in the emerging and developing economies even as the rate of ground water replenishment remains low (Chart 1). The share of the sector in overall demand for water is one of the highest in India as well, while the per capita groundwater replenishment rate is very low. In India, even as the share of the agriculture and allied sector in total gross value added (GVA) in the economy has been declining since independence, the sector continues to absorb a major share of water for irrigation purposes. The share of irrigation in overall water demand is predicted to moderate from 85 per cent in 2010 to around 74 per cent by 2050; however, the quantity of water demanded in absolute terms is expected to increase by 1.6 times (GoI, 2019) (Chart 2). To meet the growing demand for water from the agriculture sector, irrigation infrastructure has expanded at a considerable pace, making India a food sufficient nation by reducing its dependence on monsoons. However, the expansion of irrigation infrastructure driven by increase in the area irrigated through canals, tanks and wells in the 1950s has shifted to a rise in the area under tube wells since the 1960s, which in turn has led to fast depletion of ground water (Chart 3). While the adoption of newer technology such as automated irrigation, water harvesting, micro irrigation, intensive cultivation techniques and the gradual shift away from water intensive crops such as paddy and sugarcane have come up as potential solutions to this problem, their impact remains less than desirable. 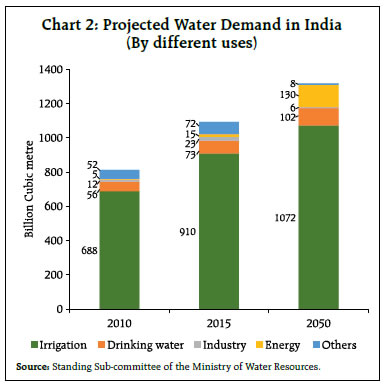

 With the ground water level depleting fast, issues related to the cost of irrigation and the efficiency of water use has gained importance in recent years to address the conflicting objectives of ensuring food security and raising farmers’ income on the one hand, and maintaining environmental sustainability, on the other. While issues related to the cost of irrigation and water use efficiency have been analysed in the extant literature, most of them pertain to specific years and time periods. Projections of future water demand assume that the irrigation efficiency will increase from current levels of 35-40 per cent to around 60 per cent (GoI, 2019). This provides the context for studying the dynamics of irrigation efficiency with a forward-looking perspective. Amidst dynamic changes in water consumption, cropping pattern and irrigation technologies, there is a need to analyse the trends in cost and efficiency of irrigation services and identify factors to improve efficiency. In this backdrop, the article examines three major issues. First, it computes an area-weighted cost of irrigation for 19 States. Second, it estimates state-wise irrigation efficiency using the Data Envelopment Analysis (DEA). Finally, it identifies the determinants of irrigation efficiency based on a random panel Tobit regression. The study uses the Comprehensive Cost of Cultivation data published by the Ministry of Agriculture and Farmers’ Welfare for 19 States for the period from 2002-03 to 2017-18. Although it has few limitations, this is a rich dataset in terms of information (GoI, 2008; Nawn, 2013). The remainder of the paper is structured as follows. Section II presents some stylised facts on the progress of irrigation and agricultural productivity in India. The computation of state-wise area-weighted average costs of irrigation has been taken up in Section III. Irrigation efficiency is estimated in section IV followed by identification of some of its determinants in Section V. The last section concludes the article with some policy suggestions. II. Stylised Facts India has made considerable progress in strengthening the access to irrigation over the years. Irrigation area coverage increased from around 17 per cent of net sown area (NSA) at the time of independence to around 50 per cent in 2017-18 (as per latest available data) (Chart 4a). Similarly, the irrigation intensity (ratio of gross irrigated area to net irrigated area) recorded an increase from 110 per cent in 1950-51 to around 144 per cent in 2017-18. Consequent to the progress in irrigation and adoption of high yielding varieties, agricultural productivity has increased. In terms of the irrigation and productivity relationship, India needs to increase the productivity via irrigation, as has been the case in some other countries (Chart 4b). 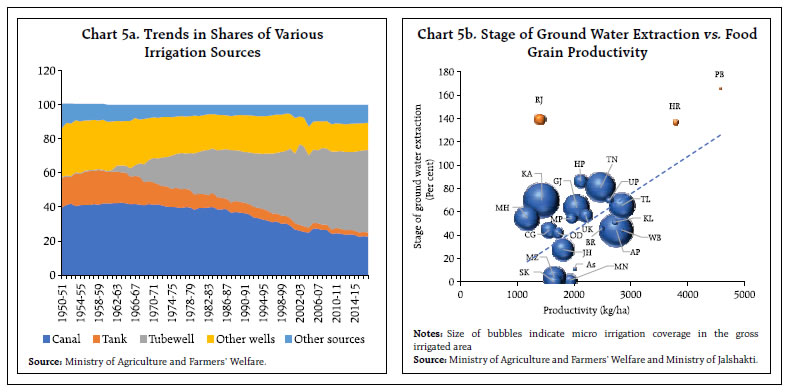 The development of irrigation infrastructure, however, appears to be biased towards certain sources of irrigation, states and crops. First, the dominance of tube wells in the overall irrigation infrastructure has continuously increased since the 1960s and currently it occupies almost half of the total net irrigated area (Chart 5a). This has resulted in rising pressure on ground water reserve and higher energy demand to extract the ground water. Simultaneously, many of the efficient and sustainable structures used earlier such as tanks and ponds are losing their importance. In addition, modern technologies like micro irrigation are yet to be adopted by the farm sector in India on a large scale. Second, there is also a wide variation among the states in terms of affordable irrigation accessibility depending on the ground water availability and extent of subsidy provided by the state governments in the electricity tariffs for agricultural purposes (Gulati et al., 2019). While the tariff rates on power supply for agriculture are almost nil in the states like Andhra Pradesh, Karnataka, Punjab, Tamil Nadu and Telangana, the rates charged varied across other states (GoI, 2019a). There are also wide variations across the states in terms of quality of electricity supply, depth of water table and relative proportions of tube wells run by cheaper electricity and costlier diesel pumps. In particular, ground water extraction is more than the replenishable levels in Punjab, Haryana and Rajasthan (Chart 5b). Further, these states, which are on the verge of groundwater extinction, have minimal coverage under micro irrigation. 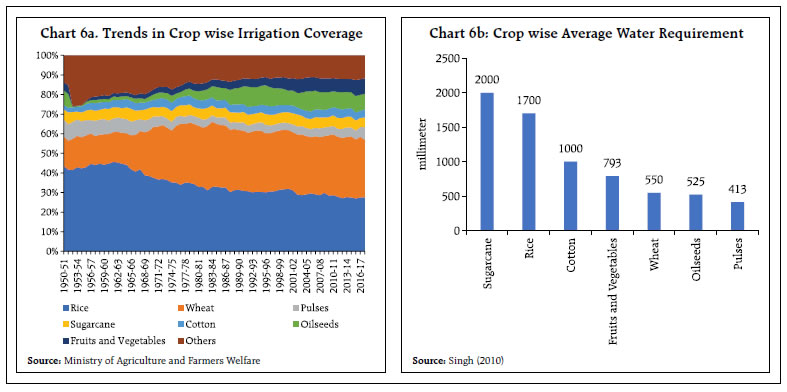 Thirdly, though the share of irrigated area under crops that require relatively lesser amount of water per crop cycle such as wheat, oilseeds, fruits and vegetables have increased over time (Chart 6a), substantial volume of irrigated water continues to be consumed by water intensive crops like sugarcane, rice and cotton (Chart 6b). Crops like pulses, fruits and vegetables which have relatively higher water productivity are still not preferred by the farmers in irrigated tracts. III. Cost of Irrigation Irrigation is one of the factors raises agricultural productivity. Substantial portions of agricultural production in India comes from the irrigated areas on account of higher productivity as compared to the rainfed areas. Further, productivity varies widely across different sources of irrigation. Evidence suggests that tube well irrigated areas have been found to have higher crop productivity as compared to other sources (Dhawan, 1987). Cost of irrigation depends on various factors including frequency of irrigation supply, depth of ground water, ownership of the sources (community or individual) and type of water markets (primary or secondary). The distribution of these factors varies widely across states resulting in differences in the cost of irrigation. Most of the studies on cost of irrigation are based on primary survey in the selected tracts for specific years (Sankarnaryanan et al., 2011; Narayanamoorthy and Jothi, 2019). The Comprehensive Scheme on the Cost of Cultivation by the Directorate of Economics and Statistics gives the crop wise data on various costs and returns, including the cost of irrigation (termed as irrigation charges2) for the states. Using this dataset, we compute the state wise area-weighted average irrigation charges in 19 states from 2002-03 to 2017- 18 based on data availability. The area weighted cost of irrigation has been computed using the following Where, IC = Area weighted cost of irrigation; ci= irrigation charge for the ith crop; GIAi = Gross irrigated area under the ith crop; and i= number of crops (1, 2, 3, …, n) Cross-sectional data for 2017-18 shows that Kerala, Assam and Odisha had the lowest area-weighted irrigation charges while Uttar Pradesh had the highest charges followed by Maharashtra, Bihar and Madhya Pradesh (Chart 7). The relatively lower cost of irrigation in states like Punjab, Tamil Nadu, Andhra Pradesh and Karnataka could be partly explained by the 100 per cent subsidised electricity for agricultural purposes (GoI, 2019). The trend shows that there appears to be a gradual decline in the area-weighted average cost of irrigation over the years in most of the states, except in Bihar, Madhya Pradesh, Himachal Pradesh, Jharkhand and Uttar Pradesh (Chart A3, Annex I). The incremental cost of irrigation with declining water table, however, is not incurred by the farmers due to subsidised power supply (Gulati et al., 2019). The rising cost of irrigation in Bihar, Madhya Pradesh, Himachal Pradesh, Jharkhand and Uttar Pradesh may be due to various factors. First, many farmers may not have irrigation facility of their own and may end up generally purchasing from other farmers at higher rates (secondary irrigation markets). Second, the declining water table in these states could have increased the cost of energy for drawing water. Third, farmers are often compelled to use diesel run pumps for irrigation due to lack of access to uninterrupted power supply leading to higher expenditure. IV. Irrigation Efficiency Irrigation efficiency is estimated using the Data Envelopment Analysis (DEA) methodology (Charnes, Cooper and Rhodes, 1978; and Banker, Charnes and Cooper, 1984). DEA is a non-parametric linear programming approach for evaluating the performance of a set of peer entities called decision-making units (here, the States). It calibrates the technical efficiency based on the estimated best-practice or efficient frontier, or envelopment surface made up by a set of Pareto-efficient states (efficiency score= 1). The efficiency of the states has been calculated in relation to this and gets the score range between 0 and 1. The study utilises two input variables, namely area weighted cost of irrigation3 and area coverage under irrigation and one output variable, that is ‘value of output’ for estimating technical efficiency. We have estimated output oriented technical efficiency of irrigation (IE) under the assumption of constant returns to scale. The estimation results reveal that Kerala and Assam lead with maximum technical efficiency (Table 1). The results are on expected lines as the irrigation coverage (20.3 per cent and 11.9 per cent, respectively) as well as irrigation charges (₹9.8/ha and ₹70.5/ha, respectively) are comparatively lower than other states. The value of output is on the higher side due to significant presence of horticulture and plantation crops [54 per cent of total area under coconut, rubber, and tapioca (Jhonson, 2018)] in Kerala which consume less water but fetch higher market value for the products as compared to other crops. As regards Assam, the high irrigation efficiency can be attributed to minimal cost of irrigation resulting from higher water table levels as compared to other States. The irrigation efficiency for the remaining states lies in the range of 20 per cent to 60 per cent for the Triennium Ending4 (TE) 2018. States like Chhattisgarh, Karnataka, Madhya Pradesh and Odisha have low irrigation efficiency on an average. | Table 1. State wise Status of Major Irrigation Related Variables (for Triennium Ending 2018) | | States | Irrigation Efficiency | Area under water guzzlers5 (%) | Ground water (m) | Share in all India public procurement of rice (%) | Share of tubewells (%) | Share of other irrigation sources (%) | Energy consumption by non-agri sector (%) | Area weighted cost of irrigation (₹/ha) | Micro irrigation Coverage (%) | Energy availability for agriculture sector (KWh/ capita) | | Andhra Pradesh | 0.4 | 62.3 | 8.6 | 6.1 | 42.3 | 13.0 | 72.2 | 771.3 | 19.5 | 167.36 | | Assam | 1.0 | 78.8 | 4.4 | 0.1 | 10.9 | 61.4 | 99.4 | 258.1 | 0.2 | 1.88 | | Bihar | 0.2 | 44.5 | 5.6 | 2.0 | 62.6 | 6.3 | 97.6 | 2496.1 | 0.3 | 11.61 | | Chhattisgarh | 0.3 | 76.5 | 8.7 | 6.6 | 33.7 | 8.5 | 77.6 | 634.9 | 4.6 | 34.29 | | Gujarat | 0.4 | 11.1 | 16.4 | 0.0 | 26.5 | 55.3 | 80.4 | 1765.7 | 11.5 | 249.34 | | Haryana | 0.4 | 25.6 | 16.3 | 16.9 | 63.0 | 0.0 | 71.9 | 2246.1 | 0.5 | 237.58 | | Himachal Pradesh | 0.5 | 24.1 | 7.0 | 0.0 | 21.8 | 75.0 | 99.3 | 194.2 | 3.3 | 3.15 | | Jharkhand | 0.5 | 20.9 | 8.1 | 0.2 | 12.4 | 85.6 | 99.4 | 706.3 | 8.6 | 1.81 | | Karnataka | 0.3 | 33.7 | 8.9 | 0.0 | 44.8 | 25.2 | 62.8 | 895.2 | 21.7 | 157.99 | | Kerala | 1.0 | 27.1 | 7.7 | 0.5 | 10.8 | 69.4 | 98.4 | 47.6 | 0.5 | 5.69 | | Madhya Pradesh | 0.2 | 9.0 | 10.8 | 8.8 | 12.3 | 70.1 | 62.1 | 1746.9 | 2.0 | 83.28 | | Maharashtra | 0.6 | 27.3 | 9.2 | 0.5 | 66.7 | 0.0 | 76.7 | 3208.1 | 10.6 | 107.27 | | Odisha | 0.3 | 94.4 | 5.9 | 5.9 | 13.7 | 4.5 | 98.1 | 104.1 | 2.0 | 4.59 | | Punjab | 0.5 | 41.0 | 17.4 | 35.5 | 72.0 | 0.0 | 72.3 | 1050.3 | 0.1 | 234.05 | | Rajasthan | 0.3 | 1.3 | 25.2 | 1.2 | 47.6 | 28.2 | 58.1 | 2413.4 | 2.3 | 74.04 | | Tamil Nadu | 0.4 | 57.7 | 10.6 | 0.2 | 19.8 | 57.8 | 86.0 | 1792.2 | 15.2 | 143.11 | | Uttar Pradesh | 0.3 | 36.1 | 8.3 | 5.2 | 74.9 | 10.0 | 80.7 | 4108.8 | 0.7 | 28.08 | | Uttarakhand | 1.0 | 51.4 | 13.9 | 1.2 | 56.8 | 20.9 | 98.7 | 1189.0 | 3.1 | 42.38 | | West Bengal | 0.3 | 43.9 | 7.4 | 3.1 | 0.0 | 100.0 | 96.7 | 1596.6 | 0.2 | 8.84 | The trend analysis shows that states like Andhra Pradesh, Bihar, Gujarat, Punjab, Rajasthan, Tamil Nadu, Uttar Pradesh and West Bengal have recorded declining trends in irrigation efficiency, especially during the recent years (Chart A4, Annex I). On the other hand, Jharkhand and Maharashtra have recorded increasing trends. V. Factors influencing Irrigation Efficiency Based on the the efficiency scores obtained in the previous section using the DEA methodology, an attempt is made to find out the potential factors that determine efficiency of states using a random panel Tobit regression (Luoma et al., 1996; Chilingerian 1995; Kirjavainen and Loikkanen 1998; Romagnoli et al., 2021) [Annex III]. Four models with different determinants, namely area under water guzzling crops, share of different sources of irrigation, public procurement policy, energy availability to farm sector and depth of ground water level, were fitted. Two variables, namely energy availability to farm sector and depth of ground water level were observed to have a significant impact on irrigation efficiency across all the models. The marginal effects also corroborate the negative impact of these variables on irrigation efficiency. The higher rate of energy consumption by the farm sector reveals the excessive water usage for irrigation leading to inefficiency. Deeper ground water levels pull down the water pumping efficiency of the motors resulting in increased irrigation inefficiency. Although the irrigation efficiency values generally show similar trends across most of the states, the wide variations in socio-economic and geological conditions indicate that a “one-size-fits-all” policy may not work for development of efficient irrigation practices in India (Table 1). Some of the major factors affecting the efficiency of irrigation are discussed below. 1. Area under water guzzling crops: States like Odisha, Assam, Chhattisgarh, West Bengal, Punjab, Bihar and Andhra Pradesh have very high share of acreage under the water guzzlers like rice and sugarcane. There is a need for shifting the cropping pattern as per the location-specific water availability (Jain et al., 2019; Dangar et al., 2021; Fishman et al., 2015). Technologies like the System of Rice Intensification (SRI) need to be expanded and incentivised among the farmers which not only has the potential to improve land productivity by 46 per cent in the rice-based cropping system but also reduce the water requirement by 40 per cent (Naryanamoorthy and Jothi, 2019). 2. Over-exploitation of groundwater: The water table is at alarming levels in Rajasthan, Punjab, Haryana, Chhattisgarh, Gujarat, Uttarakhand, Madhya Pradesh and Tamil Nadu. The continuing practice of traditional flood irrigation techniques leading to excessive use of ground water aided by cheap availability of electricity has led to sharp decline in water table. Cheaper access to unlimited groundwater increases inefficiency by depleting the water table and thus, increasing the energy requirement for irrigation. One of the solutions to tackle this energy-irrigation nexus is the introduction of water saving technologies like micro irrigation on a larger scale in these states (Palanisami et al., 2011). However, except for Karnataka, Andhra Pradesh and Tamil Nadu, micro irrigation coverage in the gross irrigated area in States is very low. Apart from micro irrigation, other available policy options are two feeder power supply6 (separate feeders for agriculture at subsidised rates and for domestic consumption at non-subsidised rates); and hybrid tariff policies (location specific mix of flat and metered tariff) (Sidhu et al., 2020). The use of solar irrigation pumps with buyback scheme of surplus power has also been experimented and are being promoted by the government7 to curb the excess groundwater usage. 3. Share of tube well irrigation: The depletion of ground water has been significantly associated with the increase in tube well coverage in the irrigated area. Especially in states like Rajasthan, Punjab, Uttar Pradesh and Haryana where the share of tube wells has increased at an unprecedented rate, there is a need to revive the traditional sources of irrigation, including tanks, farm ponds, diggis8 and other water harvesting cum irrigation structures, on a larger scale. These structures can furnish irrigation supply much higher than the demand and would also help in rainwater harvesting and ground water recharge (Chinnasamy and Srivastava, 2021). On the other hand, in states like Uttar Pradesh and Bihar, with the higher cost of irrigation, there is a need to decrease the dependency of diesel run tube wells and enhance access to power supply through adequate electricity in the grid connected farms and promoting solar irrigation pumps in the remaining farms. 4. Food grain procurement policies: States like Punjab and Haryana (and recently also Andhra Pradesh) have relatively higher share in rice procurement at the assured minimum support prices (MSPs). This encourages the farmers to go for rice cultivation in large areas using ground water making the irrigation supply inefficient and unsustainable. Studies have often argued for increase in MSPs of pulses as they incur less social cost in terms of water usage (GoI, 2016). 5. Crop Diversification towards horticulture crops: As seen in Kerala, the higher irrigation efficiency appears to be driven by low cost of irrigation as well as higher value of output realised per hectare. Horticulture crops consume relatively less quantity of water per hectare of cultivation, although quality in terms of water supply schedule is an important determinant of production. Moreover, these crops are more remunerative than food grains. Thus, shifting towards region specific horticulture crops would not only increase the irrigation efficiency but also would be more environmentally and economically sustainable. The government has initiated Crop Diversification Programme in Punjab, Haryana, and Western Uttar Pradesh; however, the progress has remained insignificant (Mukherjee, 2022). Based on the stage of development of irrigation infrastructure, the composition of irrigation sources and the cropping pattern, we have identifed the state wise issues and related policy suggestions (Table 2). States like Kerala, Assam, Himachal Pradesh, Jharkhand and Odisha need to increase the area under irrigation. The states, where outreach of power supply is inadequate, can explore solar irrigation pumps which can help overcome the requirement of grid connection of the farms, whereas micro irrigation needs to be taken up on a large scale in Punjab, Rajasthan, Haryana, Gujarat and others. The irrigation costs need to be brought down in Bihar and Uttar Pradesh by reducing the dependence on diesel run pumps and expanding the access of quality power supply for irrigation. In Maharashtra, the cost has remained on the higher side due to hard rock aquifers leading to frequent events of discontinued discharge from the wells and well failures (Gulati et al.,2019). Though this problem was also reported in Karnataka and Tamil Nadu, which is reflected in the low irrigation efficiency values, its impact on cost has been masked due to higher subsidies. In such areas there is also a need to ensure artificial recharge of the aquifers. Further, the pricing policy needs to be inclusive of the social cost of groundwater extraction to guide the crop diversification. In addition to these policy measures there is also a need to expand various other technological innovations including SRI cultivation, use of drought tolerant and less water consuming crop cultivars, and in situ and ex situ water conservation technologies. | Table 2. State-wise Issues and Policy Priorities for Irrigation Development | | State | Issues | Policy priority | | Andhra Pradesh | High rice procurement; decline in share of tanks | Reducing the share of paddy in the cropping system and revitalising tanks. | | Assam | High area under water guzzlers and low share of tube wells | Expansion of area under irrigation | | Bihar | Higher cost of irrigation | Need to improve power infrastructure | | Chhattisgarh | High area under water guzzlers | Crop diversification away from water guzzlers. | | Gujarat | Low water table | Expansion of area under micro irrigation | | Haryana | Low water table, high share in rice procurement, low share of minor irrigation sources | Shifting away from rice-based cropping system. Expansion of area under micro-irrigation | | Himachal Pradesh | Lower irrigation coverage | Expansion of area under irrigation | | Jharkhand | Low irrigation coverage | Expansion of area under irrigation | | Karnataka | Low water table (though not at alarming stage), Hard surface aquifers. | Expansion of area under micro-irrigation; Artificial groundwater recharge structures | | Kerala | Lower irrigation coverage | Expansion of area under irrigation | | Madhya Pradesh | Low water table (though not at alarming stage) | Expansion of area under micro-irrigation | | Maharashtra | Low water table (though not at alarming stage), Hard surface aquifers, Low irrigation coverage, low share of minor irrigation sources. | Expansion of area under micro-irrigation; Artificial groundwater recharge structures | | Odisha | Large area under water guzzlers, low irrigation coverage | Shifting away from rice-based cropping system; Expansion of area under irrigation | | Punjab | Low water table, High paddy procurement, low share of minor irrigation sources | Shifting away from rice-based cropping system; Expansion of area under micro-irrigation | | Rajasthan | Low water table, high cost of irrigation | Expansion of area under micro-irrigation; Replacing costly diesel pumps with solar irrigation pumps. | | Tamil Nadu | Low water table (though not at alarming stage), Hard surface aquifers. | Expansion of area under micro-irrigation; Artificial groundwater recharge structures | | Uttar Pradesh | Increase in the minor irrigation sources, High cost of irrigation | Promoting the minor irrigation infrastructure and power supply | | Uttarakhand | Low water table | Expansion of area under micro-irrigation | VI. Conclusion and Way Forward Agricultural production process continues to be highly water intensive in India. The depleting ground water and increasing demand from the non-farm sectors pose challenges for sustainable agriculture and food security. In this light, using the State-wise and crop-wise data, this article computes and examines the trends in State-wise area-weighted average cost of irrigation; estimates and analyses the trends in State-wise technical efficiency of irrigation using the methodology of Data Envelopment Analysis; and identifies determinants of IE based on random panel Tobit regression. Findings suggest that the State-wise area weighted average cost of irrigation generally showed a declining trend over the years perhaps reflecting the impact of increased access to subsidised power. However, the costs are still high in some states. Estimated technical efficiency of irrigation shows that majority of the agriculturally important Indian states lie far away from the efficiency frontier and have also recorded declining efficiency over time. The random panel Tobit regression models suggest that energy availability to the farm sector and ground water accessibility are the significant determinants of efficiency. If the current low efficiency water management practices continue alongside the expanding rural electrification and low electricity tariffs for agriculture, it could further amplify imbalances in agriculture. There is a need for concentrated policy focus on efficient irrigation technologies like micro irrigation and cropping pattern diversification away from water guzzling crops, particularly in states where efficiency is declining. References Atkinson, S. E., & Wilson, P. W. (1995). Comparing mean efficiency and productivity scores from small samples: a bootstrap methodology. Journal of Productivity analysis, 6(2), 137-152. Badiani, R., & Jessoe, K. (2013). The impact of electricity subsidies on groundwater extraction and agricultural production. Department of Agriculture and Resource Economics Working Paper, University of California Davis. Retrieved. Banker, R. D., Charnes, A., & Cooper, W. W. (1984). Some models for estimating technical and scale inefficiencies in data envelopment analysis. Management science, 30(9), 1078-1092. Charnes, A., Cooper, W. W., & Rhodes, E. (1978). A Data Envelopment Analysis Approach to Evaluation of the Program Follow through Experiment in US Public School Education. Carnegie-Mellon Univ Pittsburgh Pa Management Sciences Research Group Chilingerian, J. A. (1995). Evaluating physician efficiency in hospitals: A multivariate analysis of best practices. European journal of operational research, 80(3), 548-574. Dangar, S., Asoka, A., & Mishra, V. (2021). Causes and implications of groundwater depletion in India: A review. Journal of Hydrology, 596, 126103. Dhawan, V. (2017). Water and agriculture in India. In Background paper for the South Asia expert panel during the Global Forum for Food and Agriculture (Vol. 28). Fishman, R., Devineni, N., & Raman, S. (2015). Can improved agricultural water use efficiency save India’s groundwater? Environmental Research Letters, 10(8), 084022. Gautam, T. K., Paudel, K. P., & Guidry, K. M. (2020). An evaluation of irrigation water use efficiency in crop production using a data envelopment analysis approach: A case of Louisiana, USA. Water, 12(11), 3193. GoI (2008). Manual on Cost of Cultivation Surveys. Department of Economics and Statistics, Ministry of Agriculture and Farmers’ Welfare. GoI (2016). Incentivising Pulses Production Through Minimum Support Price (MSP) and Related Policies. Ministry of Finance. September 16, 2016. https://taxindiaonline.com/RC2/pdfdocs/Pulses_report_16th_sep_2016.pdf GoI (2019). Water and Related Statistics. Annual Publication. Central Water Commission, Ministry of Jal Shakti and Ganga Rejunevation. GoI (2019a). Electricity Tariff & Duty and Average Rates of Electricity Supply in India (March 2019), pp. 8. Greene, W. H. (2003). Econometric analysis. Pearson Education India. Gulati, A., Sharma, B., Banerjee, P and Mohan, G. (2019): Getting More from Less: Story of India’s Shrinking Water Resources, NABARD and ICRIER report, Indian Council for Research on International Economic Relations, New Delhi. pp170. Jain, R., Kishore, P., & Singh, D. K. (2019). Irrigation in India: Status, challenges, and options. Johnson, D. (2018). Cropping Pattern Changes in Kerala, 1956–57 to 2016–17. Review of Agrarian Studies, 8(2369-2020-2003). Kirjavainen, T., & Loikkanen, H. (1998). What explains the differences in cost and efficiency between schools? In More Efficient Public Finances: VATT Yearbook 1998. State Economic Research Center VATT. Luoma, K., Järviö, M. L., Suoniemi, I., & Hjerppe, R. T. (1996). Financial incentives and productive efficiency in Finnish health centres. Health Economics, 5(5), 435-445. Mukherjee, S. (2022). Farmers gaining from paddy buy up 80% in 6 years, but Punjab needs more. Business Standard (February 19). Narayanamoorthy, A., & Jothi, P. (2019). Water saving and productivity benefits of SRI: a study of tank, canal, and groundwater irrigated settings in South India. Water Policy, 21(1), 162-177. Nawn, N. (2013). Using cost of cultivation survey data: changing challenges for researchers. Economic and Political Weekly, 139-147. Oulmane, A., Ali, C., & Frija, A. (2019). The water use efficiency and its determinants in small horticultural farms in Algeria. SN Applied Sciences, 1(10), 1-9. Palanisami, K., Mohan, K., Kakumanu, K. R., & Raman, S. (2011). Spread and economics of micro-irrigation in India: evidence from nine states. Economic and Political Weekly, 81-86. Romagnoli, L., Giaccio, V., Mastronardi, L., & Forleo, M. B. (2021). Highlighting the drivers of italian diversified farms efficiency: A two-stage dea-panel tobit analysis. Sustainability, 13(23), 12949. Shah, T. (2005). Groundwater and human development: challenges and opportunities in livelihoods and environment. Water Science and Technology, 51(8), 27-37. Sidhu, B. S., Kandlikar, M., & Ramankutty, N. (2020). Power tariffs for groundwater irrigation in India: A comparative analysis of the environmental, equity, and economic tradeoffs. World Development, 128, 104836. Simar, L., & Wilson, P. W. (1998). Sensitivity analysis of efficiency scores: How to bootstrap in nonparametric frontier models. Management science, 44(1), 49-61. Simar, L., & Wilson, P. W. (2000). A general methodology for bootstrapping in non-parametric frontier models. Journal of applied statistics, 27(6), 779-802. Singh, J.V. (2010). Water Requirement of Different Crops. Agropedia. Retrivied from: http://agropedia.iitk.ac.in/content/water-requirement-different-crops Srivastava, A., & Chinnasamy, P. (2021). Water management using traditional tank cascade systems: a case study of semi-arid region of Southern India. SN Applied Sciences, 3(3), 1-23. Wang, F., Yu, C., Xiong, L., & Chang, Y. (2019). How can agricultural water use efficiency be promoted in China? A spatial-temporal analysis. Resources, Conservation and Recycling, 145, 411-418. Wang, X. Y. (2010). Irrigation water use efficiency of farmers and its determinants: Evidence from a survey in northwestern China. Agricultural Sciences in China, 9(9), 1326-1337. Watto, M. A., & Mugera, A. W. (2014). Measuring Production and Irrigation Efficiencies of Rice Farms: Evidence from the Punjab Province, Pakistan. Asian Economic Journal, 28(3), 301-322. Xue, M., & Harker, P. T. (1999). Overcoming the inherent dependency of DEA efficiency scores: a bootstrap approach. Unpublished Working Paper, Wharton Financial Institutions Center, University of Pennsylvania.
Annex I
Annexe II | Table A1: Review of Other Studies which employ the DEA Methodology | | Study | Objective(s) | Data and Methodology | Major Findings | | Chilingerian (1995) | To check the clinical efficiency of physicians in a hospital and to identify the factors associated with the high performance | DEA and Multifactor Tobit analysis | Found out 24 inefficient physicians from the sample and the tobit analysis revealed two broad categories of technically efficient physicians. Moreover, the study brought out the fact that blending of DEA with censored regression would produce better results. | | Luoma et al. (1996) | To check the efficiency of Finnish health centres and the determining factors. | DEA and Tobit model | More generous resources tend to increase inefficiency while a high share of doctors and low share of supporting staffs promote efficiency. In addition to this low elderly population long distance to the nearest hospital are positively connected to the efficiency. | | Kirjavainen and Loikkanen (1998) | Efficiency difference estimation among Finnish senior secondary schools | DEA and Tobit model | Average efficiency ranged between 82-84 per cent. Small classes, heterogeneous student bodies negatively affecting efficiency whereas well educated parents enhancing the efficiencies of school. Private schools found to be more inefficient as compared to public schools. | | Wang et al. (2019) | Estimation of water use efficiency and its influencing factors in China | DEA and Tobit model | Overall water use efficiency in the Chinese provinces estimated as 0.582 and eastern china occupies maximum number of provinces with higher water efficiencies. The positive influencing factors identified as export dependence, technical progress and educational value. Industrial structure identified as negatively influencing factor while government intervention had little influence on water efficiency. | | Gautam et al. (2020) | Irrigation water use efficiency of soybean in Louisiana, USA. | DEA supplemented with Russell measure | Producers are overusing irrigation water by 37%. The study suggests the need of appropriate management practices including rescheduling, input management and other best irrigation management practices. | | Badiani and Jessoe (2013) | Tried to find out the relationship between electricity subsidy, ground water extraction and agricultural productivity in Indian scenario. | Agricultural production model by taking relevant variables for the study. | The dead weight loss of the electricity subsidies is quite low and results positive agricultural implications both in terms value and crop composition as it is shifting more towards the water intensive crops. The study suggests that a 10% reduction in agricultural subsidies produce a 6.7 % reduction in ground water extraction. Additionally, the study indicates the environmental cost and plausible sustainability issues due to the over extraction of ground water. | | Fishman et al. (2015) | Attempted to answer, ‘Can improved agricultural water use efficiency save India's groundwater’? | Scenario analysis (naive and realistic scenarios with appropriate technological mix) | The results revealed that micro irrigation techniques like drip and sprinkler irrigation have the capacity to reduce the ground water extraction by two-third. More than technical intervention in the farm the farmer’s water use decisions impact the water table depletion. Moreover, the study adds the importance of conservation incentives along with the technological interventions. | | Jain et al. (2019) | Bird’s eye view of the irrigation status in India along with challenges and potential options | Blend of both meta-analysis as well as descriptive and tabular analysis. | The paper indicated that due to outrageous dependency on groundwater resulted in depletion of water table in 64% of the districts in the country between TE 2002 to 2016. Additionally, the paper points out the importance of micro irrigation over surface irrigation in the country to improve the water use efficiency. Two preconditions identified as important factors determining the adoption of water efficient technologies. | | Sidhu et al. (2020) | Effect of power tariffs (flat tariffs and metered tariffs) on ground water extraction in India and its environmental, economic and equity trade-offs. | Tabular, graphical, and descriptive analysis. | Though flat tariffs have low administrative costs and equitable distributional outcomes, but it doesn’t provide any incentive to the farmers for water conservation. On the other hand, metered tariff promotes judicious consumption but it’s disadvantageous to the low-income farmers since their over dependency on big ground water owners. By considering the heterogeneity of agricultural practices and ground water availability in the country the paper suggests adoption of location specific tariff policies in a flexible manner. | | Dangar and Mishra (2021) | To identify the natural and man-made factors responsible for ground water depletion in Ganga river basin | Hydrological Simulation model | Results identified as non-renewable ground water abstraction (80%) is the significant contributor of ground water depletion in the basin. Severe and frequent droughts in the area intensified the withdrawal and slowed down the recharge. The study suggested appropriate changes in the cropping pattern, metering of ground water level and enhanced water use efficiency are crucial factors responsible for sustainable ground water usage in the area. | | Romagnoli et al. (2021) | Estimation of Italian diversified farms efficiency and the major drivers. | Two step DEA-Tobit analysis | There is much scope for improving the Incidence of diversifies firms. Also, regression results indicate that incidence of output from other gainful activities increases efficiency significantly. However, rising intermediate costs have a negative impact on efficiency parameters. Geographical and managerial factors found to be influencing the efficiency scores in multiple ways. | | Watto and Mugera (2014) | Estimation of technical efficiency and irrigation water use efficiency of groundwater irrigated cotton farms in Punjab, Pakistan | Stochastic frontier model | The study results proposed that both tube-well owners and water buyers can increase the production by 19% and 28% respectively. Irrigation water use inefficiencies are more severe than the technical inefficiencies. | | Oulmane et.al. (2019) | Estimation of water use efficiency and its determinants in small horticultural farmers in Algeria. | DEA and Tobit analysis | Average technical efficiency scores obtained are 68% and 79% respectively for CRS and VRS assumptions. Water use efficiency is determined by variables such as level of education and technical know-how, total number of cultivated house and water resources, credit access, green houses etc. | | Wang (2010) | Irrigation water use efficiency and its determinants in Northwest China | DEA and Tobit regression | Average technical efficiency estimated as 0.62. The study suggested the scope of 38.49% of further expansion of wheat production by efficient use of inputs. Farmer’s age, farm size, education and income affect the irrigation water efficiency positively. |
Annexe III
Factors determining irrigation efficiency Panel Tobit Regression The efficiency scores obtained from first step have been considered as the dependent variable in the subsequent stage. Since the dependent variable irrigation efficiency parameter varies between 0 to 1, the ordinary least square (OLS) method would produce biased and inconsistent estimates (Greene, 2003). Moreover, the DEA values are relative efficiency values which can result in correlation between indices thereby rendering OLS regression ineffective (Atkinson and Wilson, 1995). Thus, we estimated the parameters by using the maximum likelihood estimation procedure. To produce consistent and nonbiased parameter estimates the DEA scores are corrected using a smoothing homogeneous bootstrapping procedure (Simar and Wilson,1998, 2000). It is basically a resampling technique which can address the inherent dependency problem of efficiency scores (Xue and Harker,1999) The general form of the random effect9 Tobit model is: Six relevant variables10 were selected which included share of tube wells, energy availability for agriculture sector, ground water level, share of canals, area under water guzzling crops and procurement of food grains; and four different models estimated by panel Tobit analysis. Descriptive statistics of the selected panel variables are listed in Table A2 depicts the efficiency parameter calculated from DEA ranges from 0.142 to 1 and the kernel density plot (Chart A5) shows the bimodal nature of the distribution. | Table A2: Descriptive statistics of panel variables | | (n=304) | | Variable | Description | Mean | Std. Dev. | Min | Max | Expected Sign | | Technical Efficiency | - | 0.58 | 0.26 | 0.15 | 1.00 | NA | | Share of tube wells | Per cent of gross irrigated area in gross sown area | 34.20 | 23.88 | 0.00 | 74.92 | - | | Energy availability for the agriculture sector | KWh/capita | 115.09 | 116.87 | 0.51 | 416.71 | - | | Ground water level | Dummy variable=1 if >/= nation average11; =0 otherwise | 0.47 | 0.50 | 0.00 | 1.00 | - | | Share of Canals | Per cent | 28.02 | 18.45 | 0.00 | 82.74 | +/- | | Area under water guzzling crops | Per cent | 40.82 | 24.12 | 0.58 | 94.43 | - | | Food grain Procurement | Per cent share in all India | 5.19 | 9.12 | 0.00 | 50.65 | - | The results of the panel Tobit random effect model are given in Table A3 which explains the various factors impacting the irrigation efficiency of 19 Indian states for a period of 16 years (2002-2017). | Table A3: Second stage panel Tobit regression result | | Model 1 | Log likelihood=65.4 | Wald chi sq.=11.7 | | Variable | Estimate | SE | Z Value | P>Z | Marginal Effect | | Constant | 0.809 | 0.148 | 5.450 | 0.000 | | | Share of canals | -0.001 | 0.003 | -0.360 | 0.721 | -0.001 | | Energy availability for the agriculture sector | -0.001 | 0.000 | -2.760 | 0.006 | -0.001 | | Share of tube wells | -0.002 | 0.003 | -0.820 | 0.411 | -0.002 | | Ground water level | -0.062 | 0.031 | -1.990 | 0.046 | -0.055 |
| Model 2 | Log likelihood=67.1 | Wald chi sq.=11.3 | | Variable | Estimate | SE | Z Value | P>Z | Marginal Effect | | Constant | 0.699 | 0.089 | 7.890 | 0.000 | | | Share of canals | -0.001 | 0.002 | -0.380 | 0.707 | -0.001 | | Energy availability for the agriculture sector | -0.001 | 0.000 | -2.830 | 0.005 | -0.001 | | Food grain procurement | 0.008 | 0.006 | 1.420 | 0.156 | 0.007 | | Ground water level | -0.061 | 0.034 | -1.800 | 0.072 | -0.056 |
| Model 3 | Log likelihood=65.2 | Wald chi sq.=14.5 | | Variable | Estimate | SE | Z Value | P>Z | Marginal Effect | | Constant | 0.772 | 0.135 | 5.730 | 0.000 | | | Share of tube wells | -0.002 | 0.002 | -1.060 | 0.288 | -0.002 | | Energy availability for the agriculture sector | -0.001 | 0.000 | -3.030 | 0.002 | -0.001 | | Area under water guzzling crops | 0.000 | 0.001 | 0.000 | 0.997 | 0.000 | | Ground water level | -0.060 | 0.028 | -2.170 | 0.030 | -0.053 |
| Model 4 | Log likelihood=68.2 | Wald chi sq.=16.6 | | Variable | Estimate | SE | Z Value | P>Z | Marginal Effect | | Constant | 0.760 | 0.146 | 5.200 | 0.000 | | | Share of tube wells | -0.002 | 0.002 | -1.160 | 0.244 | -0.002 | | Energy availability for the agriculture sector | -0.001 | 0.000 | -2.990 | 0.003 | -0.001 | | Area under water guzzling crops | 0.000 | 0.002 | 0.210 | 0.833 | 0.000 | | Ground water level | -0.059 | 0.035 | -1.690 | 0.090 | -0.054 | | Share of canals | -0.001 | 0.003 | -0.420 | 0.678 | -0.001 | | Food grain procurement | 0.009 | 0.006 | 1.380 | 0.169 | 0.008 |
|