The financial resource gap of the domestic economy, measured by the net acquisition of financial assets less net increase in financial liabilities, narrowed in 2019-20. While households and financial corporations remained net lenders, net borrowings of the non-financial corporations and general government increased during the year. Dependency on foreign resources, however, declined in 2019-20 as compared to a year ago. Net flows to the general government sector from other depository corporations and other financial corporations increased in 2019-20. A major proportion of investments of other financial corporations was in G-sec. Currency and deposits remained the preferred investment avenues for the households. Introduction The extensive framework used by the Reserve Bank of India (RBI) to compile accounts covering financial stocks and flow of funds (FSF) for the Indian economy, following the System of National Accounts (SNA), 2008, presents instrument-wise financial accounts1 for the five institutional sectors2 on a ‘from-whom-to-whom’ (FWTW) basis (Annex I). The set of accounts provides essential macroeconomic information at the inter-sectoral level in an accessible yet rigorous format, disentangling portfolio shifts across sectors caused by economic transformation and development as well as portfolio adjustments on account of significant economic events. In the wake of COVID-19 and the intermittent lockdowns, the data collection system was disrupted for some time3, throwing up several challenges, particularly for the non-government non-financial sector. Efforts have been sustained, however, to augment the compilation with methodological refinements and improvements in sourcing of data4. The changing pattern of financial flows across the five institutional sectors in the past decade has altered the share of these sectors in total financial assets, albeit moderately. In terms of sectoral share in both financial assets and liabilities, financial corporations (FCs) dominated by commercial banks constitute the largest sector. Households and the private non-financial corporations (PvNFCs) follow in that order in terms of the asset size, whereas the PvNFCs and the general government (GG) sector follow FCs in terms of total liabilities. Compared with their share in total assets, households’ share in total liabilities remain much smaller. The share of public NFCs (PuNFCs) in total assets shrunk to 1.3 per cent in 2019-20 from 2.0 per cent in 2011-12, whereas those of the central and state governments remained stable. The relatively minor share of the rest of the world (RoW) sector in both assets and liabilities reflects the preponderant domestic orientation of the economy (Chart 1). This article, apart from imparting important understanding about instrument-wise borrowing and lending relationships between institutional sectors, presents financial flows on a FWTW basis for 2019-20. The article is organised into five sections – Section II presents the progress on the G-20 Data Gaps Initiative-2 (DGI-2) followed by a brief account of the sectoral financial resource gaps in section III. Section IV discusses the sectoral mapping of the financial flows, and section V concludes with policy perspectives. Annex I outlines the framework and methodology of compilation, while Annex II presents the major improvements introduced in this round of compilation. II. Progress under Data Gaps Initiative-2 The sixth progress report of DGI-2, October 2021 – ‘Countdown to December 2021’5 acknowledged the delay in the DGI-2 work programme due to the pandemic. Nevertheless, the participating economies were advised to continue to take forward the agreed recommendations6, in particular, recommendation II.8 on sectoral accounts which states, “The G-20 economies to compile and disseminate, on a quarterly and annual frequency, sectoral accounts flows and balance sheet data, based on the internationally agreed template, including data for the other (non-bank) financial corporations sector, and develop from-whom-to-whom matrices for both transactions and stocks to support balance sheet analysis.” As per the progress report, six G-20 nations, viz., Canada, France, Germany, Italy, Turkey and the US, based on self-assessment7, have fulfilled the target requirements for annual and quarterly financial accounts and balance sheets. Spain has completed both annual and quarterly accounts and the Netherlands has completed its quarterly accounts with detailed information. Indonesia has finished the compilation and reconciliation of the annual and quarterly sectoral accounts and balance sheets for 2015-19, while China has published flow of funds (FoF) account for both financial and non-financial transactions at an annual level, making gradual strides towards quarterly reporting. Russia published main financial instruments on an annual and quarterly basis and has prioritised to extend the sectoral and instrument-wise breakdown in near future. Apart from financial accounts, the US is also progressing towards developing quarterly data for non-financial transactions at the sectoral level. India has been disseminating financial balance sheets for the five institutional sectors and bifurcation of financial flows into transactions and valuation changes (for mutual funds, insurance, pension and provident funds, households and the central bank) on an annual basis since 20198 when the flow of funds were augmented with sector-wise outstanding positions for the first time. The Reserve Bank has been publishing the FoF accounts for the Indian economy from 1951-52 onwards, and on a FWTW basis since 1964. The work in India, consistent with the evolving international best practices, has progressed under various committees set up from time to time. The current work plan is being guided by the recommendations of the Committee on Financial Sector Statistics, 2018 (Chairman: R.H. Dholakia) which include inter alia: (i) release of higher frequency data – quarterly as well as annual with a reduced lag; (ii) coverage of new variables; and (iii) coverage of new aspects such as, flows vs. stocks and transactions vs. valuation. In 2019-20, compilation and dissemination of quarterly accounts for the household sector began including the stock and flow of financial assets and liabilities of the households9 to gross domestic product (GDP) ratio. Some further improvements have been made possible with the availability of better sources of data, inter alia, loans and advances and equity investments of the central government (CG) from the Finance Account by Controller General of Accounts (CGA); relatively detailed information regarding Regional Rural Banks’ (RRBs’) assets and liabilities from Key Statistics and Financial Statements of Regional Rural Banks published by the National Bank for Agriculture and Rural Development (NABARD); and information on Rural Co-operative Banks (RCBs) from the National Federation of State Co-operative Banks (NAFSCOB) report – Basic Data on performance of StCBs, DCCBs, PACs, NAFSCOB10 (Annex II). Furthermore, net flow of resources from the household sector to mutual funds is arrived at by adding net sales of Individual (retail), High Net-worth Individual (HNI) and Hindu Undivided Family (HUF11) categories. III. Sectoral Financial Resource Gap The financial resource gap of the domestic economy – measured by the net acquisition of financial assets less net increase in financial liabilities narrowed in 2019-20 (Chart 2). While households and financial corporations remained net lenders, net borrowings of public non-financial corporations and general government increased during 2019-20. The financial net worth of each sector is derived by netting out outstanding external financial liabilities from outstanding financial assets. Being prime savers in the economy and lenders to other sectors, households enjoy the highest financial net worth followed by FCs, whereas GG and NFCs have consistently remained in a deficit position in the economy (Table 1). 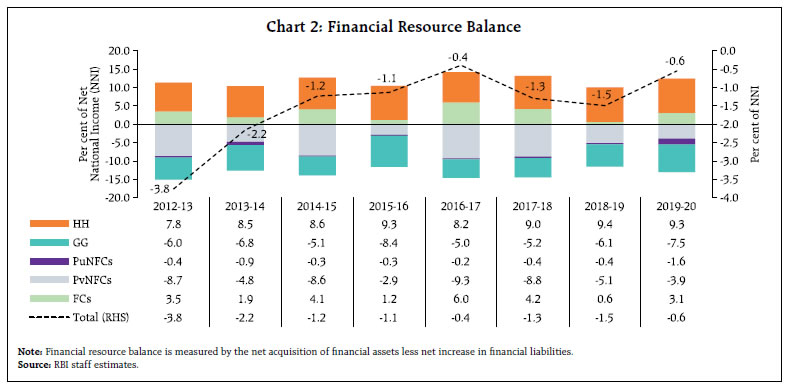
Table 1: Sectoral Financial Net Worth
(Per cent of NNI at current market prices) | | | 2011-12 | 2012-13 | 2013-14 | 2014-15 | 2015-16 | 2016-17 | 2017-18 | 2018-19 | 2019-20 | | Financial Assets | | 1 | FCs | 222.5 | 224.3 | 224.3 | 227.4 | 227.0 | 226.8 | 230.0 | 230.0 | 235.6 | | 2 | NFCs | 162.7 | 150.9 | 123.9 | 120.6 | 122.8 | 109.3 | 125.8 | 111.2 | 120.8 | | | 2.1 PuNFCs | 11.7 | 10.7 | 9.8 | 8.9 | 8.0 | 7.5 | 7.5 | 7.5 | 7.4 | | | 2.2 PvNFCs | 151.0 | 140.2 | 114.0 | 111.7 | 114.9 | 101.8 | 118.3 | 103.8 | 113.4 | | 3 | GG | 29.3 | 28.9 | 27.5 | 27.1 | 25.7 | 26.5 | 27.4 | 27.7 | 28.5 | | 4 | HH | 123.9 | 121.7 | 120.3 | 122.0 | 122.5 | 122.2 | 124.5 | 127.6 | 129.6 | | 5 | RoW | 46.0 | 48.0 | 50.1 | 50.6 | 49.7 | 45.6 | 45.2 | 44.6 | 46.4 | | Financial Liabilities | | 1 | FCs | 192.9 | 193.6 | 194.1 | 196.3 | 196.3 | 194.1 | 195.6 | 197.0 | 200.3 | | 2 | NFCs | 165.4 | 162.9 | 145.0 | 144.7 | 136.5 | 129.6 | 139.1 | 129.3 | 133.8 | | | 2.1 PuNFCs | 12.8 | 12.0 | 11.7 | 10.8 | 10.1 | 9.4 | 9.5 | 9.6 | 11.0 | | | 2.2 PvNFCs | 152.6 | 151.0 | 133.2 | 134.0 | 126.4 | 120.2 | 129.6 | 119.7 | 122.9 | | 3 | GG | 85.2 | 84.2 | 83.4 | 82.5 | 84.2 | 83.7 | 84.1 | 85.2 | 90.2 | | 4 | HH | 39.9 | 39.1 | 38.3 | 37.9 | 37.4 | 37.0 | 38.0 | 39.0 | 41.3 | | 5 | RoW | 21.5 | 20.8 | 22.5 | 23.4 | 23.5 | 21.4 | 21.8 | 21.0 | 24.1 | | Financial Net Worth | | 1 | FCs | 29.7 | 30.7 | 30.2 | 31.1 | 30.8 | 32.8 | 34.3 | 33.0 | 35.3 | | 2 | NFCs | -14.4 | -19.1 | -20.3 | -26.6 | -25.9 | -30.6 | -36.4 | -37.5 | -40.4 | | | 2.1 PuNFCs | -1.2 | -1.2 | -1.9 | -1.9 | -2.1 | -1.9 | -2.0 | -2.1 | -3.5 | | | 2.2 PvNFCs | -13.2 | -17.8 | -18.4 | -24.7 | -23.8 | -28.6 | -34.4 | -35.3 | -36.8 | | 3 | GG | -55.8 | -55.3 | -55.8 | -55.4 | -58.5 | -57.2 | -56.8 | -57.5 | -61.7 | | 4 | HH | 84.0 | 82.6 | 82.0 | 84.1 | 85.1 | 85.2 | 86.5 | 88.6 | 88.3 | | 5 | RoW | 24.5 | 27.2 | 27.6 | 27.2 | 26.2 | 24.2 | 23.4 | 23.7 | 22.3 | Note: Financial net worth is calculated as the difference between outstanding financial assets and financial liabilities (excluding shareholders’ equity).
Source: RBI staff estimates. |
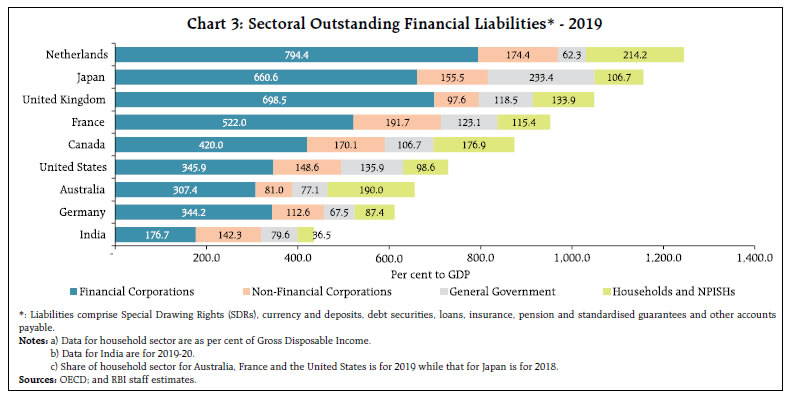 A cross-country comparison of the position of outstanding financial liabilities as at end-December 2019 based on the OECD database12 against the comparable data at end-March 2020 for India based on our calculations, shows the significantly higher levels of indebtedness in the advanced economies (AEs). For the select economies, FCs contribute the maximum share to total outstanding financial liabilities (Chart 3). IV. Financial Flows across Sectors: 2019-20 Mapping of sectoral financial flows is essentially based on information aggregated from individual balance sheets of respective economic entities. The sectoral flows are captured from snapshots of the holdings and issuance of various financial instruments and counterparty positions at the end of the financial year. It provides a clearer picture of the financial relationship between the institutional sectors and also residents and non-residents, describing who finances whom, by what type of instrument, and in what amount. Net flows (uses minus sources) across various sectors of the economy are presented in a network plot (Chart 4). Despite a fall in the relative share, households and GG continue to be the largest lender and borrower in the economy, respectively. As compared to the previous year, net flows to GG from other depository corporations (ODCs) and other financial corporations (OFCs); and to PvNFCs from RoW increased in 2019-20, as visible in the thick directional edges. Instrument-wise Investment in Financial Assets Loans and advances remained the most preferred instrument for deployment of resources during 2019-20, followed by currency and deposits. A major proportion of investments of OFCs and the Reserve Bank were in debt securities – while the former had a higher share in G-sec, the Reserve Bank mostly invested in foreign securities (Chart 5). Investment via equity and investment funds were dominated by investments from corporates and RoW. Currency and deposits remained the preferred investment avenues for the households followed by insurance, pension and provident funds. The sector-wise flows of financial assets and liabilities during 2019-20 have been expounded in the following sub-sections: IV.1 Financial Corporations ODCs constitute the largest sub-sector of FCs. In 2019-20, they comprised 52.1 per cent of total financial assets of FCs, followed by OFCs (36.0 per cent) and the central bank (11.9 per cent). Among the ODCs, scheduled commercial banks (SCBs) have a lion’s share (44.2 per cent) in the total financial assets of FCs, highlighting the bank-based nature of the Indian financial system. Within OFCs, insurance sector has the major weight, followed by non-deposit taking NBFCs (NBFC-ND), provident and pension funds and mutual funds (Chart 6).
IV.1.1 Central Bank The financial net worth of the Reserve Bank increased to 7.3 per cent in 2019-20 from 6.0 per cent in 2018-19, with the institution continuing to be one of the net lending sectors. In view of the growth slowdown in the Indian economy in 2019-20, the Reserve Bank had pre-emptively shifted its monetary policy stance from neutral to accommodative in June 2019. This led to an expansion in the Bank’s financial assets to 24.6 per cent of GDP in 2019-20 from 21.7 per cent of GDP in 2018-19. The financial liabilities13, however, increased to 18.2 per cent of GDP in 2019-20 from 16.4 per cent in the previous year. The flow of currency in circulation, which had decelerated a year before, increased marginally during 2019-20, taking the currency-GDP ratio to 12.1 per cent. Deposits with the Reserve Bank increased during 2019-20, primarily on account of liquidity injection resulting in reverse repo with ODCs despite a reduction in reverse repo rate14. In keeping with the objective of financial stability, the Reserve Bank increased its holding of gold and foreign currency assets (FCAs). The monetary gold reserve increased both on account of an increase in gold holding and a rise in international prices of gold. The stock of FCAs15 grew by 24.9 per cent during 2019-20 as against 2.7 per cent in 2018-19. The maximum growth was observed in the deposits with other central banks and the Bank for International Settlements (BIS), followed by investment in debt securities. FCAs made valuation gains driven by the ‘flight to safety’, with the outbreak of the pandemic. The investment in domestic securities, viz., dated Government securities and T-Bills increased by 8.5 per cent in 2019-20 as compared with 44.1 per cent in the preceding year due to various liquidity management operations. Furthermore, an increase in several liquidity augmenting measures by the Reserve Bank such as long-term repo operations (LTROs) and targeted LTROs in the latter half of the year led to an extension of loans and advances to ODCs. IV.1.2 Other Depository Corporations A confluence of factors, viz., economic slowdown, deleveraging of corporate balance sheets, risk aversion on the part of banks and the write-off of non-performing assets (NPAs) had led to a steady decline in the financial assets of ODCs as per cent of GDP since 2014-15. A turn around took place during 2019-20 on account of the improved asset quality, stronger capital and provision buffers and return to profitability (Chart 7). As compared to 2018-19, however, deposits growth lost the steam across SCBs, co-operatives and NBFCs-D in the backdrop of a slowdown in GDP growth, with major moderation in co-operative banks. Competing asset classes became attractive due to easing of interest rates and solvency issues related to a private sector bank also brought about some reassignment of deposits (RBI, 2020b). 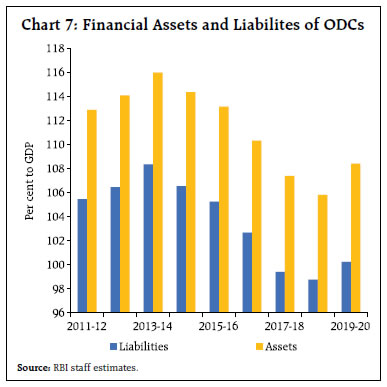 On the assets side, reflecting both risk aversion and tepid demand in a slowing economy in 2019-20, credit outgo of SCBs decelerated while their investment in risk-free government securities improved, as reflected in the overall trend of ODCs (Chart 8). Following a similar pattern, credit growth of NBFCs-D moderated while their investments – specifically in mutual funds accelerated. In case of HFCs-D, growth in their financial assets decelerated owing to a sharp decrease in loans and advances following increased stress in the real estate sector (RBI, 2020b). The co-operative banking institutions with an extensive reach to the unbanked and credit-deprived segments of the society, however, registered an increase in financial assets by 11.3 per cent in 2019-20 relative to 3.1 per cent in 2018-19, mainly driven by loans and advances extended to households. 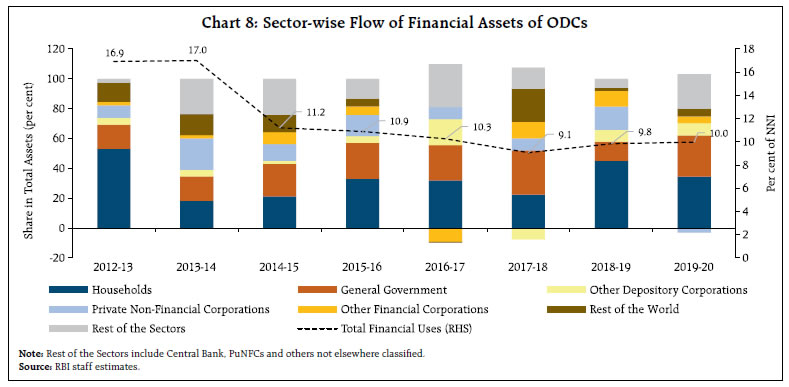
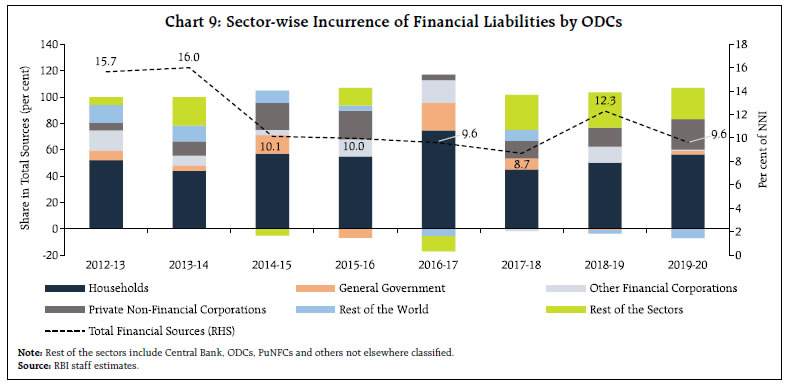 Household deposits is the most important instrument comprising the liabilities of ODCs, followed by deposits from PvNFCs (Chart 9). Capital infusion in public sector banks by the government received a boost in 2019-20, taking the government’s shareholding in SCBs to 56.6 per cent from 41.9 per cent in the preceding year. This was reflected in an increased liability of ODCs towards the government. Within co-operatives, urban co-operative banks (UCBs) relied chiefly on household deposits for their funds, whereas deposits from other co-operatives together with borrowings from OFCs aided the rural co-operative banks (RCBs) in financing their operations. Reliance on banks for funds rose for both NBFCs-D and HFCs-D in the context of the Infrastructure Leasing and Financial Services (IL&FS) default and the related downgrades (RBI, 2020b). Issuance of debentures by HFCs-D also contracted during 2019-20. The ODCs’ liability towards RoW contracted during the year because of the ongoing global economic slowdown and India experiencing one of the highest outflows amongst emerging market peers (RBI, 2020a). IV.1.3 Other Financial Corporations The financial assets and liabilities of OFCs, which had been expanding over the last few years, contracted by 1.0 and 0.6 percentage points of GDP, respectively, in 2019-20 (Chart 10). The moderation in the growth of financial assets and liabilities of OFCs, however, needs to be seen against the lower GDP growth recorded during the year. HFCs-ND witnessed a marginal contraction in their financial assets and liabilities whereas the growth in case of NBFCs-ND decelerated in 2019-20, as compared to the double-digit growth in the last two years. Following the trend of NBFCs-D, the reliance on loans has continued to rise for NBFCs-ND post-IL&FS default and the related downgrades. Foreign liabilities of the NBFCs-ND rose owing to easing of external commercial borrowings (ECB) norms by the Reserve Bank, which helped them in accessing foreign funds (RBI, 2020b). The liabilities of the four all-India financial institutions (AIFIs)16 which are a part of OFCs, are primarily driven by the deposits of ODCs, debt securities of the OFCs, ODCs and CG and equity shares of CG. While the majority equity holding in SIDBI (around 85 per cent) rests with ODCs and OFCs, CG has the complete ownership in case of the other three. 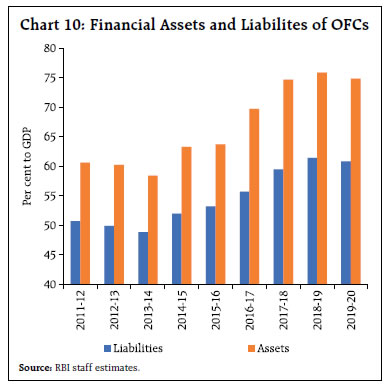 Market prices of equity and investment funds in the balance sheets of OFCs contracted significantly owing to the stock market crash in February-March 2019-2017. GG securities remained the favourable investment avenue for OFCs in recent years, coupled with intra-sectoral lending in 2019-20 (Chart 11). Headwinds in the aftermath of the IL&FS episode leading to an erosion in confidence, liquidity pressure and rating downgrades got exacerbated when the COVID-19 pandemic hit in March 2020, resulting in a substantial deceleration in asset growth of NBFCs-ND in 2019-20 (RBI, 2020b). The gross financial assets of insurance and provident funds continued their increasing trend in 2019-20, mainly driven by investment in government debt securities. Following the notification18 on the Employees’ Provident Fund Organisation (EPFO) investment, there has been a diversification of investment portfolio towards Exchange Traded Funds (ETFs). The financial assets of pension funds increased in 2019-20 with both the National Pension System (NPS) and the Atal Pension Yojana (APY) registering growth in their subscriber base. In case of AIFIs, loans and advances increased broadly to all the sectors except households. 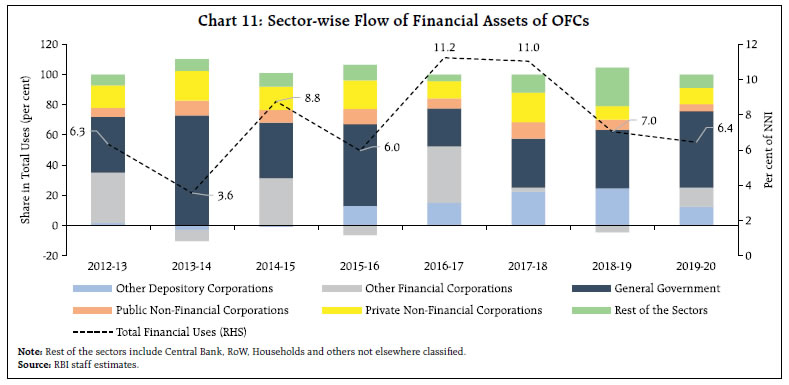 IV.2 Non-Financial Corporations With the majority of assets being non-financial in nature, financial net worth of NFCs is significantly lower than their total net worth. At an aggregate level, financial resource gap of PuNFCs deteriorated to (-) 1.6 per cent in 2019-20 from (-) 0.4 per cent in 2018-19, while that of PvNFCs improved to (-) 3.9 per cent from (-) 5.1 per cent in the previous year. In 2019-20, increased borrowing by the central public sector enterprises (CPSEs) pulled up the financial liabilities of the PuNFCs. On the other hand, the growth in financial assets decelerated sharply due to a drop in the value of equity investments and other account receivables. PvNFCs – the third largest sector after FCs and households in terms of size of total financial assets and liabilities – accounted for 20.2 per cent of financial assets of the economy in 2019-20. The incurrence of financial liabilities by PvNFCs exhibited an uptick from 2018-19 along with asset acquisition. In terms of instruments, loans and borrowing from FCs has been the predominant source of finance for PvNFCs followed by equity. IV.3 General Government19 GG and NFCs are the only two sectors with a negative resource balance. While the financial assets of GG improved marginally to 25 per cent of GDP, the financial liabilities amplified to 80 per cent in 2019-20, of which the liabilities of CG stood at 53 per cent of the GDP. Moreover, the growth in financial liabilities outpaced that in financial assets by a notable 3.4 percentage points. Both central and state governments finance majority of their debts via issuance of marketable debt securities, which are primarily subscribed by ODCs, OFCs and households (Chart 12). Akin to the previous years, the subscription pattern of debt securities remained similar during 2019-20. The Food Corporation of India (FCI) that operates on a no-profit and no-loss basis and also receives support by way of subsidies and grants from the government is classified as part of CG20. The National Small Saving Fund (NSSF) borrowing by the FCI since 2016-17, considered as borrowing by CG, stood at ₹2,54,600 crore as at end-March 2020. In case of state governments, while their net market borrowings increased by about 40 per cent, gross market borrowings rose by 32.7 per cent (RBI, 2020c). The asset composition of CG is dominated by three instruments, namely, equity investment (35.9 per cent); loans and advances (28.6 per cent); and debt securities (18.0 per cent). Over the last decade, CG’s investment portfolio moved away from debt securities to equity and loans and advances. Particularly, CG’s equity in the state co-operative banks and other banks (excluding RBI) increased by 21.9 per cent, from around ₹3.6 lakh crore in 2018-19 to ₹4.4 lakh crore in 2019-20. For state governments, most of their financial assets are held in the form of deposits followed by equity and debt securities. IV.4 Households (including NPISHs) Households, apart from being the biggest source of consumption expenditure, contribute significantly to financial surplus for investment into financial and non-financial assets in the economy. Growth in both financial assets and liabilities of the household sector weakened in 2019-20 with a sharper moderation in financial assets. As a result, the financial surplus of the household sector reduced slightly by 0.1 percentage point to 9.3 per cent of NNI in 2019-20 (Chart 13). 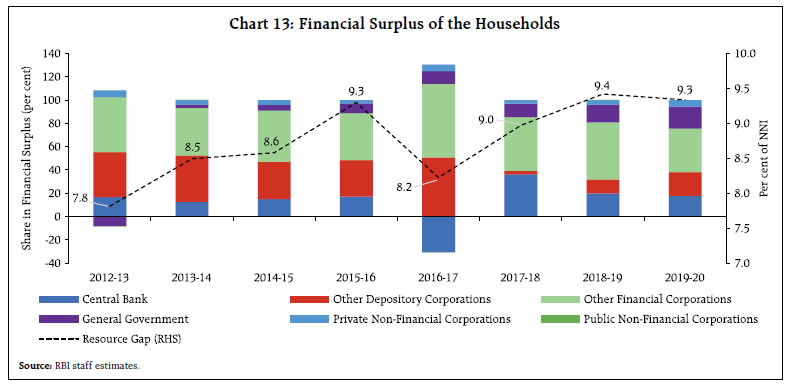 The rise in the household financial savings to 11.6 per cent of GDP in 2020-21 has already confirmed the ballooning of household financial assets, owing to reduction in discretionary expenditure and the associated surge in precautionary/forced saving despite stagnant/reduced income. The share of ODCs in the flow of financial assets, which reduced to a negligible level in 2017-18 – owing to remonetisation led large withdrawal of cash by the households – soared to almost 21 per cent in 2019-20. This surge is expected to further strengthen in 2020-21, on account of feeble non-essential consumption spending, particularly in the first quarter. Furthermore, a steady flow of resources is maintained from the households to the insurance sector, which is likely to accentuate in 2020-21. The share of deposits and insurance has been gradually rising, accounting for almost 63 per cent of household financial assets in 2019-20 followed by equity, currency, debt securities and investment in mutual funds. The shift in household’s preference towards investment funds is also reflected in the secular rise in their outstanding asset value, which however, plummeted following massive sell-offs by foreign portfolio investors in March 2020. IV.5 Rest of the World India remained a net borrower from RoW in 2019-20. Dependency on foreign resources, however, declined in 2019-20 as compared to a year ago. It is further corroborated by the narrowing of India’s current account deficit (CAD) to (-) 0.9 per cent of GDP in 2019-20 from (-) 2.1 per cent in 2018-19, on the back of lower trade deficit amidst a slowdown in the global economy and growing global investment concerns due to disruptions in supply chains. Despite multiple headwinds, major sources of foreign capital increased, and net capital inflows were more than sufficient to finance the lower CAD. As at end-March 2020, two-third of RoW’s total financial liabilities was towards the Reserve Bank in the form of reserve assets21, particularly securities and deposits with other central banks. Besides reserve assets, around one-third was towards NFCs in the form of debt securities and equity. The liability of RoW increased by 20.8 per cent in 2019-20 over its preceding year primarily led by a surge in the Reserve Bank’s subscription to debt securities issued abroad (Chart 14). Acquisition of equities and debt securities of NFCs by RoW remained robust in 2019-20. Besides, India was able to sustain the pace of foreign direct investment in 2019-20, on the back of continuous economic reforms. However, foreign portfolio investment (FPI) flows were largely influenced by global developments and remained volatile since the beginning of 2019-20, despite several confidence building measures by the government and the Reserve Bank. An unprecedented wave of global risk aversion in the wake of COVID-19 led to net selloffs by the end of the financial year. In fact, outflows from EMEs in Q4:2019-20 were the largest ever flight to safety. A slew of measures was undertaken by the government and the Reserve Bank to encourage foreign inflows, viz., increase in the limit for FPI investment, rationalisation of Know Your Customer (KYC) norms for foreign investors, hike in the short-term investments by FPIs in CG securities (including T-Bills) and state development loans. These measures helped reverse the FPI outflow considerably by end-March 2020. A combination of factors like abundant global liquidity, favourable overseas interest rates and liberalisation measures led to robust ECB inflows in 2019-20. Overall, the net acquisition of assets by RoW in 2019-20 remained almost stable at the level of 2018-19 (Chart 15). 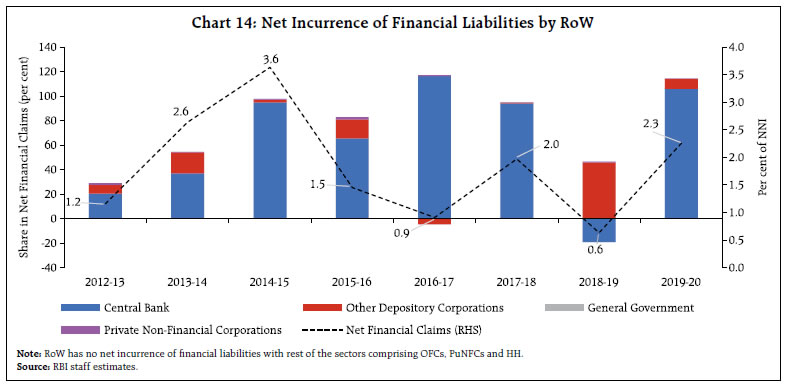 V. Conclusion The financial resource gap of the economy, measured by the net acquisition of financial assets less net increase in financial liabilities, narrowed in 2019-20. Households and financial corporations continued to provide liquidity to the deficit sectors, with reduced requirement of external funding. Net borrowing from RoW declined sharply in 2019-20. The financial resource balance of the Reserve Bank remained in the positive territory – ensuring timely and appropriate liquidity support to various sectors of the economy, especially in the backdrop of a general slowdown in the economy. Better performance of the other depository corporations in terms of generating surplus resources may be attributed to the enhancement in asset quality and decline in the NPAs of the banking sector. Within non-deposit taking segment, the growth in case of NBFCs-ND decelerated in 2019-20, as compared to the double-digit growth recorded in the preceding two years. The financial liabilities of both central and state governments amplified with the share of the central government remaining higher than that of the state governments. 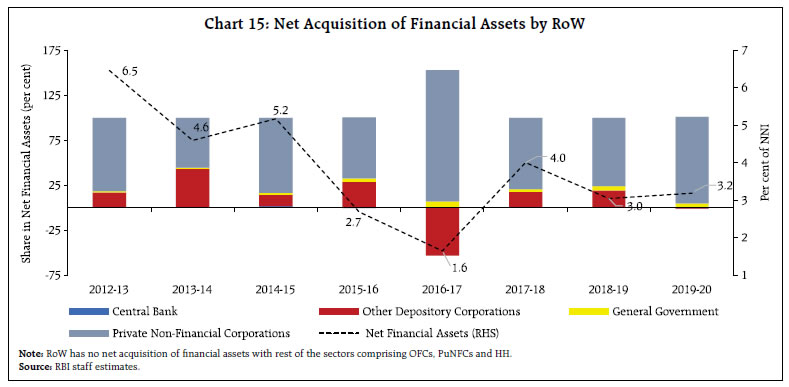 Going forward, various policy measures initiated to tide over the disruptions in the pandemic year 2020-21, would affect the net lending/borrowing position of the sectors. The government sector resources would reflect the impact of wide-ranging fiscal support measures undertaken in the wake of multiple pandemic waves. The relevance of foreign exchange reserves buffer to provide a cushion to tackle unforeseen economic and financial shocks, may become more evident and would be reflected in the Reserve Bank’s financial accounts. The allocation of SDR 12.57 billion to India by the IMF on August 23, 2021 would accordingly have implications for the financial accounts of the associated sectors viz., the central bank, central government, and rest of the world. Policy initiatives like asset monetisation and higher infrastructure and capital expenditure by the central government could help improve asset quality of both the public and private non-financial corporations. On account of the pandemic restrictions, bank credit reportedly suffered a broad-based slowdown, except for agriculture. On the liabilities side, however, banks reported higher deposit growth which was reflected in a spike in the household sector’s financial savings due to a decline in discretionary spending. Owing to pandemic-induced slowdown in 2020-21, the Indian economy registered a current account surplus for the first time since 2003-04 on the back of a compressed trade deficit. While households and financial corporations are expected to continue generating higher financial surpluses, better balance sheet position of corporates and banks could facilitate higher flow of resources to the productive sectors of the economy supported by greater digitisation. References FSB (2021), “G20 Data Gaps Initiative (DGI-2) The Sixth Progress Report – Countdown to December 2021” International Monetary Fund and Financial Stability Board, https://www.fsb.org/2021/10/g20-data-gaps-initiative-dgi-2-the-sixth-progress-report-countdown-to-december-2021/ Government of India (2020), “Union Budget 2020-2021”, Ministry of Finance, Government of India, https://www.indiabudget.gov.in/budget2020-21/index.php NABARD (2020), “Annual Report 2019-20”, National Bank for Agriculture and Rural Development, https://www.nabard.org/auth/writereaddata/tender/1008203730Nabard%20English%20Annual%20Report%20for%20Website.pdf National Statistical Commission (2018), “Report of the Committee on Financial Sector Statistics”, Ministry of Statistics & Programme Implementation, Government of India, https://mospi.gov.in/documents/213904/0/Report_of_the_Committee_on_Financial_Sector_Statistics-2182018+%281%29.pdf/4d759d97-08d8-425e-4ea8-71474ac2f8c7?t=1595174128318 OECD (2017), “Understanding Financial Accounts”, Edited by Peter Van De Ven and Daniele Fano, OECD Publishing, Paris, https://doi.org/10.1787/9789264281288-en. Prakash, Anupam, Anand Prakash Ekka, Kunal Priyadarshi, Chaitali Bhowmick and Ishu Thakur (2020), “Financial Stocks and Flows of the Indian Economy:2016-17 to 2018-19”, RBI Bulletin, July 2020, https://rbidocs.rbi.org.in/rdocs/Bulletin/PDFs/1FINANCIALSTOCKS76894282D5104115A83911082958A7B9.PDF RBI (2015), “Manual on the Compilation of Flow of Funds Accounts of the Indian Economy”, Reserve Bank of India, https://rbidocs.rbi.org.in/rdocs/PublicationReport/Pdfs/FM2190C3DC5C5442C587DF978335851933.PDF RBI (2020a), “Annual Report 2019-20”, Reserve Bank of India, https://rbidocs.rbi.org.in/rdocs/AnnualReport/PDFs/0RBIAR201920DA64F97C6E7B48848E6DEA06D531BADF.PDF RBI (2020b), “Report on Trend and Progress of Banking in India 2019-20”, Reserve Bank of India, https://rbidocs.rbi.org.in/rdocs/Publications/PDFs/0RTP2020_F3D078985540A4179B62B7734C7B445C9.PDF RBI (2020c), “State Finances: A Study of Budgets of 2020-21”, Reserve Bank of India, https://rbidocs.rbi.org.in/rdocs/Publications/PDFs/0SF_271020FCF77451F1DF744B2B244875C785B8EF3.PDF SNA (2008), “System of National Accounts”, United Nations, the European Commission, the Organisation for Economic Co-operation and Development, the International Monetary Fund, and the World Bank Group, https://unstats.un.org/unsd/nationalaccount/docs/sna2008.pdf
Annex I:
Framework of the Financial Stocks and Flow of Funds of the Indian Economy Institutional Sectors of the Economy The detailed sectoral classification has been presented in Exhibit 1. The financial corporations sector covers corporations that are principally engaged in financial intermediation or in auxiliary financial activities including insurance and pension funds. It plays an important role of channelising funds from savers to investors. The sector is further disaggregated into subsectors on the basis of their function and type of financing – central bank which exercises control over the financial system; ODCs which engage in financial intermediation via liabilities in the form of deposits; and OFCs. The non-financial corporations sector encompasses incorporated legal entities that are involved in production of non-financial goods and services. It consists of both public and private non-financial corporations that may be listed or unlisted with limited liability. The general government sector consists of all the government departments, offices and other bodies mainly involved in the non-market production of goods and services, for collective consumption by government itself (e.g., public administration, defence police, etc.) and for individual consumption by the public (e.g., health and education). The sector is classified into central government and the state governments. The household sector acts both as a consumer of final goods and services, and as an investor in financial and non-financial assets. Furthermore, it incorporates NPISHs that produce non-market goods and services and are not controlled by the government. The RoW sector consists of all the non-resident institutional units, be it non-resident governments, corporations, or persons, that enter into transactions with resident units, or that have other economic links with resident units. Classification of Financial Instruments The financial instruments (Table A.1) used for compiling FSF account is consistent with the list of instruments specified in SNA 2008, which have been grouped together on the basis of similar characteristics. | Table A.1: Classification of Financial Instruments | | SNA 2008 Code | Financial Instrument | | F1 | Monetary gold and SDRs | | F11 | Monetary gold | | F12 | SDRs | | F2 | Currency and Deposits | | F21 | Currency | | F22 + F29 | Deposits | | F3 | Debt Securities | | F4 | Loans | | F5 | Equity and Investment fund shares/units | | F51 | Equity | | F52 | Investment fund shares/units | | F6 | Insurance, pension and standardised guarantee schemes | | F61 | Non-life insurance technical reserves | | F62 | Life insurance and annuity entitlements | | F63 | Pension entitlements | | F64 | Claims of pension funds on pension managers | | F66 | Provisions for calls under standardised guarantees | | F8 | Other accounts receivable/payable | | F81 | Trade credits and advances | | F89 | Other accounts receivable/payable | Monetary gold is the reserve asset held exclusively by the central bank in the form of gold bullion with no corresponding liability. Similarly, SDRs are international reserve assets, owned by central government and the monetary authority to supplement monetary gold. Currency, consisting of notes and coins, can be a liability of central bank (domestic currency) and the non-resident authorities (foreign currency). Deposits comprise instruments such as bank accounts, demand deposits, savings and fixed-term deposits. It can be a liability of the central bank, ODCs and RoW. Debt securities include negotiable instruments, viz., T-bills, commercial paper, bonds, and asset-backed securities that serve as evidence of debt. Loans are non-negotiable financial assets that include instruments like overdrafts, instalment loans, claims on or liabilities to the IMF, and repo agreements. Equity and investment fund shares do not provide the owner with a right to a predetermined amount, but only to a residual claim on the assets of the issuer of these instruments. Investment fund shares are issued by collective investment vehicles that pool funds for investment in financial and non-financial assets and are disaggregated into money market and non-money market fund shares. Insurance, pension, and standardised guarantee schemes consists of life and non-life insurance and annuities entitlements, pension, and non-pension entitlements. These are the liabilities in the insurance and pension fund subsectors and assets of the participants in the schemes. Other account receivable or payable includes trade credit and advances extended to corporations, government, households and NPISHs, and RoW, and other receivables or payables related to taxes, dividends, social contributions, wages and salaries.
Annex II:
Refinements in Methodology and Data Sources The compilation of financial stocks and flow of funds, which involves a large variety of data sources is subject to certain limitations on account of missing information, measurement errors and incompatibilities. Consequently, statistical discrepancies emerge as a difference between aggregate sources and uses of funds notwithstanding efforts to minimise them. Nonetheless, timely compilation and availability of institutional statistics with instrument-wise details is the most significant prerequisite for minimising discrepancies. In this round of compilation, the major improvements introduced are as follows: -
As per the SNA 2008, reserves are not to be classified as part of financial transactions as they do not create a counterpart liability. Accordingly, the reserve funds have not been considered as the financial liabilities. -
The financial assets of CG have been revised using better sources of data for the loans and advances, and equity investments. In line with the SNA 2008, the entire SDR allocations have been treated as liability of the CG. -
As per the extant practice, RRBs accounts used to be compiled using the aggregates from the Reserve Bank’s Report on Trend and Progress (RTP) of Banking in India. For the sectoral mapping, shares as calculated from the balance sheet of SCBs were applied. In this article, the NABARD report – Key Statistics and Financial Statements of Regional Rural Banks has been used. -
Akin to RRBs, the compilation of FSF account for RCBs was carried out using the aggregates from the RTP. The current article has instead used information from the NAFSCOB for computing the sectoral shares for different tiers of the RCBs. -
As per the data made available by Association of Mutual Funds in India (AMFI), net flow of the household sector to mutual funds has been arrived at by adding net sales of Individual (retail), High Net-worth Individual (HNI) and Hindu Undivided Family (HUF) categories.
|