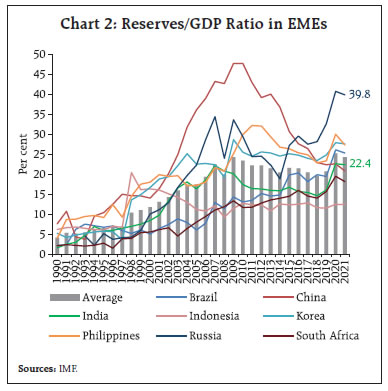
This article analyses the trend of reserve accumulation in Emerging Market Economies (EMEs), with a focus on key drivers and policy objectives. Evidence from a panel auto regressive distributed lag (ARDL) model using data for 16 EMEs suggests that reserve accumulation is largely driven by precautionary motive. A probit model provides evidence that reserves help reduce the probability of currency crisis. For India, higher reserve cover is observed to lower the cost of foreign borrowings and also the hedging cost. Introduction Financial globalization in emerging market economies (EMEs) has exposed them to the spillover effects of shifts in global liquidity conditions in response to monetary policy developments in systemically important advanced economies (AEs). Experience of EMEs during the global financial crisis (GFC), the taper tantrum of 2013 and the recent COVID-19 pandemic underscore the need for adequate foreign exchange reserves buffer to minimise volatility in the value of domestic currencies and safeguard the domestic economy. As a precautionary measure, thus, EMEs have preferred to bolster their safety nets by accumulating reserves, with or without the additional comfort from bilateral, regional or multilateral support lines. Furthermore, SDR allocation equivalent to US$ 650 billion by the IMF to its member countries in 2021 helped augment reserves buffer. Foreign exchange reserves help central banks intervene in the foreign exchange market to curb excessive speculation to safeguard financial stability and manage repercussions of capital flows and credit spillovers (Patel and Cavallino, 2019). The need for holding foreign exchange reserves for precautionary motive was discernible during the episode of sudden stop in early 2020, when several EMEs, including India, used reserves to mitigate volatility in domestic currency markets. However, reserves were partly recouped in EMEs consequent to the recovery in capital inflows in the latter part of 2020 (IMF, 2021). IMF recognises reserves as a first layer self-insurance tool against external shocks, apart from bilateral swap arrangements, regional financial arrangements and its own financial backstop facilities. Nonetheless, IMF in its country assessments has often been prescriptive against holding excess reserves. For instance, in its Article IV Report on India (October 2021), the IMF noted that “further accumulation of reserves is less warranted, and foreign exchange intervention should be limited to addressing disorderly market conditions”. At the same time, the IMF’s External Sector Report (2021) has assessed that India has been maintaining external balances in line with its fundamentals each year during 2012-20. Accretion to India’s reserves buffer in recent years had been an outcome of modest levels of current account deficit (CAD) relative to the size of net capital inflows. This is broadly in line with the trend observed across select EMEs in the post-COVID period, partly reflecting the impact of ultra-accommodative monetary policies in major advanced economies (AEs) in pushing capital to flow out in search of higher return. India’s CAD recorded a sharp decline in 2019-20 and a surplus in 2020-21. On the other hand, the capital account1 recorded surplus in both these years led by foreign direct investment (FDI). Consequently, there was an accretion to foreign exchange reserves to the tune of US$ 147 billion (on BoP basis) during 2019-20 and 2020-21. In 2021-22, reserve accretion (including valuation effect) has been of the order of US$ 30 billion. From an accounting perspective, factors driving changes in foreign exchange reserves are easily identifiable from BoP statistics. However, whether the reserve build-up in a country is for precautionary or mercantilist motive is hard to gauge due to lack of objective criteria on the level of reserve adequacy and intangible nature of benefits associated with reserves buffer. While the precautionary demand for reserves is for the purpose of mitigating the impact of external spillovers, mercantilist approach views reserve accumulation as a means to derive trade benefits and promote domestic industry through exchange rate management. Besides holding reserves buffer, central banks also tend to enter into currency swap arrangements as a complementary form of insurance. Incidentally, during GFC and COVID-19 period, the US Federal Reserve offered swap lines to select foreign central banks in order to enhance their capacity to deliver US dollar funding to institutions in their respective jurisdictions during times of market stress. Similarly, India’s bilateral swap arrangement with Japan enables to swap local currencies against the US dollar for an amount of up to US$ 75 billion. Empirically, foreign exchange reserves in EMEs in the long-run are found to be determined by the current account balance, interest rate differentials, average propensity to import and real effective exchange rate (Sooriyan, 2017). Against this backdrop, this article attempts to answer the question as to why EMEs accumulate reserves and what are the implications of holding reserves. The rest of the article is divided into five sections. Section II provides stylised facts on foreign exchange reserves across EMEs, which is followed by a discussion on sources and composition of India’s foreign exchange reserves in Section III. Estimates of determinants of foreign exchange reserves in EMEs are provided in Section IV. Implications of reserves such as for external sector stability and the cost of foreign currency borrowing are set out in Section V. Section VI concludes the article. II. Stylised Facts II.1 Foreign Exchange Reserves in EMEs Foreign exchange reserves of EMEs have increased manifold since 2000 but the pace accelerated since mid-2000s (Chart 1). Reserves to GDP ratio, which was hovering around 10 per cent during the 1990s for majority of the EMEs, rose sharply and surpassed 20 per cent in the pre-GFC year, i.e., 2007 and increased further after a blip in the GFC year (2008). Increase in global liquidity and easy monetary policies in major AEs were the prominent factors causing capital flows to EMEs. Pro-reform policies and gradual opening up of domestic economies were also cited as the factors driving capital flows to EMEs (Mohan, 2008). However, the pace of reserve accumulation appears to have moderated post-2010 reflecting inter alia the impact of general trend of de-globalisation as evident from declining trade and financial openness amidst rising trade protectionism, growth slowdown and the impact of lower crude oil prices on trade balances of oil/commodity exporting countries. In the aftermath of COVID-19 in early 2020, many EMEs witnessed sudden stops and depleted reserves. However, with the unprecedented monetary easing and large fiscal stimulus by major AEs, capital inflows to EMEs resumed and along with SDR allocation by the IMF, reserve holdings of EMEs reached record levels and a few of them surpassed their earlier peaks (Chart 2). 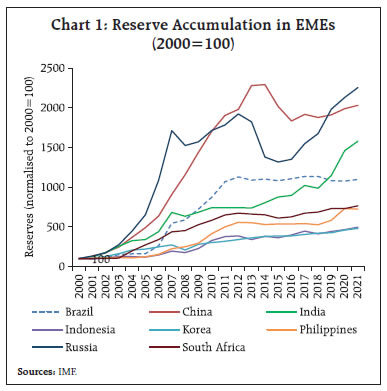
 II.2 Reserve Adequacy Uncertainty of oil price movement and interest rates which affects trade balance and capital flows, respectively, impart volatility to reserve levels in EMEs. As there is no universally accepted definition of reserve adequacy, several benchmarks have been used by policymakers to measure reserve adequacy. From the perspective of precautionary motive, reserve adequacy levels are suggested to be higher for fixed exchange rate countries relative to flexible exchange rate countries. Among different benchmarks, reserve cover of imports, reserve cover of short-term debt (original and residual maturity) and reserves to broad money ratio have been the traditional and most widely applied benchmarks. For example, the popular Guidotti-Greenspan rule suggests an ideal level of reserves to be equal to short-term external debt having maturity of up to one-year. Wijnholds and Kapteyn (2001) suggested reserves to be adequate to cover short-term external debt and an adjusted broad money where the adjustment depends upon the exchange rate regime and country risk. Some studies also suggested model-based reserve adequacy level taking into account the opportunity cost of holding reserves and benefits of smoothing domestic absorption during sudden stops (Jeanne and Rancière, 2011). The IMF’s analytical framework uses an assessing reserve adequacy (ARA) metric2 which includes some of the above indicators. These indicators encompass multiple channels of market pressure and a broader set of risks that an EME can potentially face. The ARA metric is a composite value which takes into account the short-term external debt, broad money, export income coverage and other liabilities. According to the IMF, the ratio of reserves to ARA metric value between 1-1.5 is considered as an adequate level of reserves. Chart 3 shows reserve cover of imports, the most widely used measure of reserve adequacy, which has shown improvement in 2020 over 2019 for all EMEs except Turkey. The trend in reserves based on IMF’s ARA metric also revealed that majority of the EMEs witnessed an improvement in their reserve adequacy. However, Chile, China, Korea and Turkey recorded a decline in their ratio of reserves to ARA metric value in 2020 over 2019 (Chart 4). India’s reserve as a ratio to ARA metric stood at 2 indicating that the reserve level is higher than the assessed value.  India’s reserves in terms of ratio of IMF’s ARA metric reveals that it increased from 1.1 in 2000 to a peak of 2.6 in 2007 before declining during the taper tantrum period to 1.4 and climbing again to 2.0 in 2020. India is not the only country among EMEs recording an increase in reserves to ARA metric ratio (Table 1). However, experience suggests that reserve adequacy in EMEs assessed based on current data may not be appropriate given the susceptibility of EMEs to global financial developments such as monetary policy actions in major advanced economies and the dynamics of commodity prices like gold and crude oil (Reddy, 2006). For example, during the phase of lower oil prices and accommodative monetary policies of major AEs, EMEs like India witnessed reserve accumulation during 2020-21. However, the process of accumulation shifted to depletion with rising trend in oil prices and interest rates in major AEs. 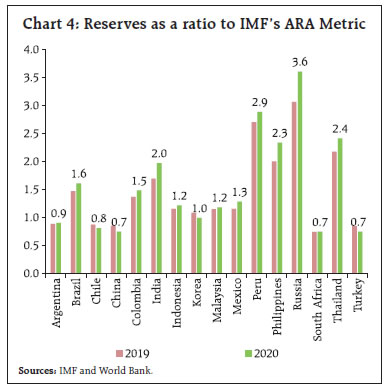
| Table 1: Reserve/ARA Metric (Ratio) | | | 2000 | 2005 | 2006 | 2007 | 2008 | 2009 | 2012 | 2013 | 2019 | 2020 | | Argentina | 0.6 | 1.0 | 0.9 | 1.1 | NA | 1.4 | 1.0 | 0.7 | 0.9 | 0.9 | | Brazil | NA | 0.6 | 0.8 | 1.2 | 1.6 | 1.3 | 1.6 | 1.6 | 1.5 | 1.6 | | Chile | 1.5 | 1.1 | 1.1 | 0.8 | 1.0 | 1.0 | 1.1 | 1.1 | 0.9 | 0.8 | | China | NA | 1.5 | 1.6 | 1.8 | 2.0 | 2.0 | 1.6 | 1.5 | 0.8 | 0.7 | | Colombia | 1.0 | 1.3 | 1.3 | 1.5 | 1.6 | 1.5 | 1.4 | 1.4 | 1.4 | 1.5 | | India | 1.1 | 2.0 | 2.2 | 2.6 | 2.1 | 2.0 | 1.4 | 1.4 | 1.7 | 2.0 | | Indonesia | NA | 1.0 | 1.1 | 1.2 | 1.2 | 1.2 | 0.9 | 1.2 | 1.2 | 1.2 | | Korea | 1.1 | 1.3 | 1.2 | 1.1 | 1.1 | 1.2 | 1.1 | 1.1 | 1.1 | 1.0 | | Malaysia | NA | 2.1 | 2.1 | 2.1 | 2.0 | 1.2 | 1.1 | 1.0 | 1.1 | 1.2 | | Mexico | NA | 1.0 | 0.8 | 0.8 | 0.8 | 1.2 | 1.2 | 1.2 | 1.2 | 1.3 | | Peru | 1.3 | 1.8 | 1.8 | 2.3 | 2.7 | 2.5 | 3.0 | 3.2 | 2.7 | 2.9 | | Philippines | NA | 1.1 | 1.2 | 1.5 | 1.8 | 2.1 | 2.6 | 2.4 | 2.0 | 2.3 | | Russia | NA | 1.9 | 2.3 | 1.8 | 1.9 | 1.9 | 1.6 | 1.5 | 3.1 | 3.6 | | South Africa | 0.5 | 0.6 | 0.7 | 0.7 | 0.9 | 0.8 | 0.8 | 0.8 | 0.7 | 0.7 | | Thailand | 1.2 | 1.5 | 1.6 | 1.8 | 2.5 | 2.9 | 2.3 | 2.1 | 2.2 | 2.4 | | Turkey | 0.7 | 0.9 | 0.9 | 0.9 | 0.9 | 0.9 | 1.0 | 1.0 | 0.8 | 0.7 | | Source: IMF. | III. Sources and Composition of India’s Foreign Exchange Reserves Foreign exchange reserves include foreign currency assets (which include investment in foreign government treasury bills, deposits with other central banks), gold, Special Drawing Rights (SDR) and Reserve Tranche Position (RTP). Composition of reserves is determined by taking into account factors which inter alia includes safety, liquidity and return. Some countries, however, also change their reserve composition due to geopolitical concerns. From the operational perspective, central bank interventions, income on reserve assets and allocation of SDRs by the IMF could be the major sources of accumulation of official foreign exchange reserves. From the economic point of view, reserve accretion can be decomposed into contribution of balance of payments and valuation effect. As reserves are held mainly in the form of foreign currency assets and gold, their value is influenced by movement in exchange rate (vis-à-vis the currencies in which reserves are denominated) and the price of gold. Increase in gold price and exchange rate depreciation of the US dollar against major currencies lead to valuation gains resulting into increases in stock of reserves. The valuation gains/ losses usually constitute a smaller portion while a larger chunk is driven by balance of payments surplus; a current account surplus – a phenomenon of higher receipts than payments from goods and services trade, transfers and investment income – or a capital account surplus reflecting an increase in foreign liabilities in the form of foreign investment and loans, or a combination of both. The net valuation effect is usually smaller and temporary as gains in a year/ month may be followed by losses in the next period and vice versa. Thus, reserve accumulation is broadly a reflection of long-term surplus in BoP in current account and/or capital account. For example, reserve accumulation in China, Russia and Thailand occurs mainly due to current account surpluses in contrast to India, Indonesia and Turkey where it is usually driven by capital account surpluses. Reserve accumulation in countries with current account deficit indicates excess of capital flows over CAD or inability to absorb capital inflows. In contrast, reserve accumulation in current account surplus countries indicates excess of domestic savings over investment and the resultant capital outflows due to interest rate differentials. The trend in India’s forex reserves reveals that despite liberalization of the economy and adoption of current account convertibility since the early 1990s, reserve level remained low during the 1990s. However, the reserves started rising since 2000 due to various factors. First, India initiated measures towards capital account convertibility which attracted capital inflows. Second, lower oil prices during the early 2000s contained trade deficit. Third, software services exports and remittances from Indians employed overseas improved the current account of balance of payments to a surplus during 2001-04 and a moderate deficit thereafter till 2007-08. Fourth, foreign capital inflows surged since the mid-2000s. Consequently, India witnessed large accretions to foreign exchange reserves, increasing from US$ 38 billion at end-March 2000 to US$ 113 billion in 2003-04 and crossed US$ 300 billion mark in 2007-08. However, reserves depletion during the GFC period was followed by rising oil prices, ballooning of current account deficit and sudden stops during the taper tantrum period which slowed the pace of reserve accumulation during 2008- 09 to H1:2013-14. Lower oil prices and the consequent moderation in CAD led to further increase in reserves to US$ 425 billion in 2017-18, though a surge in CAD and moderation in portfolio flows caused depletion of foreign exchange reserve after a gap of five years in 2018-19. In subsequent years, the pace of reserve build-up accelerated further amid low external funding requirements. More than half of total reserves of US$ 607 billion (as on March 31, 2022) has been accumulated since April 2012. Sluggish import demand due to COVID-19 related restrictions on movement of people and the slowdown in the domestic economy, supplemented by lower oil prices, contributed to reducing the trade deficit during 2020- 21. On the other hand, invisibles remained broadly stable reflecting lockdown induced external demand for computer services. Consequently, India recorded a current account surplus in 2020-21 after a gap of 16 years. Net capital flows remained broadly strong in 2020-21, despite the transitory impact evident in Q1. For example, FDI bucked the trend at global level and continued to maintain its momentum as evident from an increase in net FDI during 2019-20 and 2020-21. India’s capital market also benefitted from portfolio inflows steered by exceptional monetary policy support in major advanced economies. However, with the revival of domestic economy and rising oil prices since Q3:2021-22, India’s trade deficit increased sharply during Q3:2021-22. On the other hand, reversal of monetary policy stances in major AEs and Russia-Ukraine conflict caused portfolio outflows since October 2021. This has reflected in a depletion of foreign exchange reserves during the past few months. III.1 Episodes of Reserves Accumulation/Depletion Since 1991, there has been an accumulation in foreign exchange reserves in all years barring five years, viz., 1995-96, 2008-09, 2011-12 and 2012-13, and 2018-19 (Table 2). Usually, episode of a depletion or large accumulation coincide with abnormal global economic and financial developments. For example, the depletion in 2008-09 reflected the use of foreign exchange reserves to ease the external financing conditions during GFC, when India recorded FPI outflows; and in 2011-12 and 2012-13 the depletion was caused by higher CAD due to increase in oil prices and gold imports. Similarly, large accretions to reserves in 2007-08 and 2020-21 were an outcome of abundant supply of global liquidity. The reserves built-up out of a current account surplus indicates the nation’s income earned from foreign countries while reserves contributed by a capital account surplus indicate net incurrence of liabilities. Chart 5 shows the contribution of current and capital account in annual change in reserves. As reiterated by the Reserve Bank of India from time to time, India’s reserve accumulation has been contributed mainly by capital account surplus. During the last 20 years, India had current account surplus only in four years i.e., 2001-02 to 2003-04 and in 2020- 21. | Table 2: Reserve Changes and Balance of Payments | | (In US$ Billion) | | Depletion | | | Nominal | BoP Basis | CAD | FDI | FPI | Banking Capital | STC | External Assistance | ECB | Other Items | | 1995-96 | -3.5 | -1.2 | -5.9 | 2.1 | 2.7 | 0.8 | 0.0 | 0.9 | 1.3 | -2.9 | | 2008-09 | -57.7 | -20.1 | -27.9 | 22.4 | -14.0 | -3.2 | -2.0 | 2.4 | 7.9 | -5.6 | | 2011-12 | -10.4 | -12.8 | -78.2 | 22.1 | 17.2 | 16.2 | 6.7 | 2.3 | 10.3 | -9.4 | | 2012-13 | -2.4 | 3.8 | -88.2 | 19.8 | 26.9 | 16.6 | 21.7 | 1.0 | 8.5 | -2.4 | | 2018-19 | -11.7 | -3.3 | -57.2 | 30.7 | -0.6 | 7.4 | 2.0 | 3.4 | 10.4 | 0.5 | | Accumulation (US$ 30 billion >) | | 2003-04 | 36.9 | 31.4 | 14.1 | 2.4 | 11.356 | 6.0 | 1.4 | -2.9 | -2.9 | 1.9 | | 2006-07 | 47.6 | 36.6 | -9.6 | 7.7 | 7.1 | 1.9 | 6.6 | 1.8 | 16.1 | 5.0 | | 2007-08 | 110.5 | 92.2 | -15.7 | 15.9 | 27.4 | 11.8 | 15.9 | 2.1 | 22.6 | 12.2 | | 2014-15 | 37.4 | 61.4 | -27.9 | 32.6 | 40.9 | 11.6 | -0.9 | 1.6 | 2.7 | 0.7 | | 2017-18 | 54.6 | 43.6 | -48.7 | 30.3 | 22.1 | 16.2 | 13.9 | 2.9 | -0.2 | 7.0 | | 2019-20 | 64.9 | 59.5 | -24.7 | 43 | 1.4 | -5.3 | -1.0 | 3.8 | 23.0 | 19.4 | | 2020-21 | 99.2 | 87.3 | 23.9 | 44 | 36.1 | -21.1 | -4.1 | 11.2 | -0.1 | -2.6 | | Source: RBI. |
III.2 Composition of Foreign Exchange Reserves The share of foreign currency assets in total reserves has increased to above 90 per cent from just two-third in 1992-93. Since reserves are maintained as risk buffers, India’s reserves are kept in major convertible currencies and reserve management is guided by the principle of safety, liquidity and return. However, appropriate emphasis on diversification of reserves was given from time to time. For example, the value of gold held as foreign exchange reserve which stood at US$ 10 billion during the GFC year of 2008-09 increased during 2009-10 when the RBI purchased 200 metric tonnes of gold from the IMF in November 2009 (RBI, 2010) and thus the value of gold almost doubled reaching US$ 18 billion in 2009-10 (Chart 6). The RBI continued to build up gold reserves in the subsequent years albeit at a gradual pace from 558 tonnes at end- March 2010 to 744 tonnes at end-September 2021 and thus the value of gold reserves increased from US$ 18 billion to US$ 37 billion. Similarly, allocations of SDR by the IMF in 2009 and 2021 also augmented the SDR component of reserves which valued US$ 19 billion as at end-March 2022. Additions of gold to foreign exchange reserves in an environment of low/negative international interest rates is argued to be beneficial and can benefit a country in terms of sovereign creditworthiness during episodes of financial market volatility and crisis (IIM-A, 2021). IV. Determinants of Foreign Exchange Reserves: Mercantilist Versus Precautionary Motive The literature emphasises mainly two motives behind accumulation of reserves, viz., mercantilist and precautionary. According to the mercantilist view, reserves are accumulated to promote an export led economic growth (Rodrick, 2008, Choi and Taylor, 2017). As per this approach, economies undervalue their currencies using reserves to support exports (Dooley et al., 2004, and Korinek and Serven, 2016). Another strand of literature indicates precautionary motive of holding reserves wherein countries maintain reserves buffer in order to avoid output and consumption losses during ‘sudden stops’ of capital flows (Jeanne and Rancière, 2011). Aizenman and Lee (2005) found reserve accumulation in developing countries being driven by precautionary motive. Reddy (2002) also pointed out that central banks’ demand for reserves is driven by precautionary motive such as intervening in foreign exchange market to curb exchange rate volatility driven by unpredictable flows. However, changes in these motives over a period of time have also been documented (Ghosh et al., 2016). Against this backdrop, an empirical exercise estimating a panel auto regressive distributed lag (ARDL) model was undertaken to identify the long-run determinants of reserves. Following Aizenman and Lee (2005), we estimate demand for foreign exchange reserves for a panel of 16 countries – comprising mainly countries with a floating exchange rate regime. 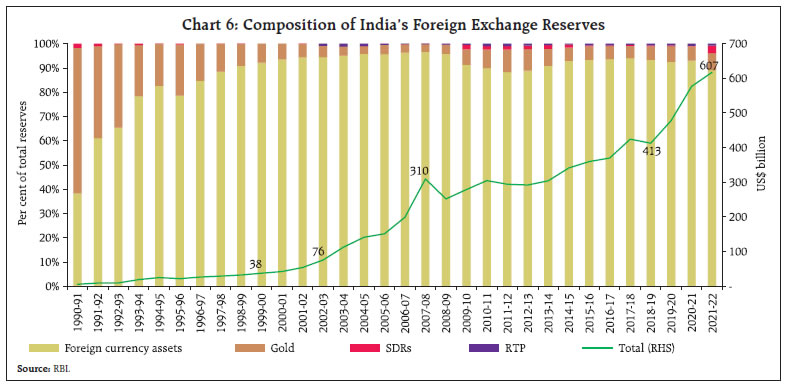 Annual data from 1980 to 2020 on reserves are sourced from the World Bank database; volume of exports (LEXPV) and imports (LIMPV) in the form of index is obtained from the UNCTAD database; terms of trade data (LTOT) from IMF and real effective exchange rate (REER) from BIS for calculating volatility (ERVOL). While LEXPV and LIMPV underline the importance of the size of a country’s cross-border trade transactions, ERVOL is a proxy for capturing instability in foreign exchange market caused by short-term capital flows driven by monetary policy changes in major advanced economies. A priori, higher ERVOL means the need for higher reserves. Similarly, the inclusion of LTOT is to capture the gain/loss that may warrant scaling up of reserves depending on the global price shocks relevant for the country’s basket of exports and imports. Following Aizenman and Lee (2005), the second lag of growth of three-year moving average of real exports index (DLAVGEXPO) was used as a control variable while the ratio of market exchange rate to PPP exchange rate (ERDEV) is also used to capture the mercantilist motive of holding reserves. For precautionary motive, a dummy variable taking value 1 for a year after sudden-stop/currency crisis and 0 other wise (DUMCRISIS) was computed. In view of the mixed evidence with regard to time series properties of the variables chosen i.e., stationary and non-stationary (Annex 1), a panel ARDL model is used. Results in column 2 and 3 in Table 3 reveal that in the long run, favourable terms of trade and an increased volume of exports reduce the demand for reserves. The negative sign of exports Coefficient indicates that reserve accumulation in EMEs is not associated with mercantilist approach. In other words, EMEs tend to reduce reserve holdings during high export performance despite their potential implications for export competitiveness. On the other hand, a positive sign of import index and the Coefficient of variation (CV) of REER may be pointing to the fact of precautionary demand for reserves driven by increase in volume of imports and volatility of REER. The results provided in Table 3 (column 4 and 5) indicate that the Coefficients of variables representing deviations of exchange rate from PPP exchange rates (i.e., ERDEV) and the second lag of growth of three-year moving average of real exports index (DLAVGEXPO) have negative signs.3 | Table 3: Determinants of Foreign Exchange Reserves in EMEs (Dependent variable: log of foreign exchange reserves) | | | Coefficient | t-Statistic | Coefficient | t-Statistic | | 1 | 2 | 3 | 4 | 5 | | LTOT | -9.490*** | -5.44 | -4.329*** | -7.90 | | LEXPV | -0.981*** | -3.26 | | | | LIMPV | 2.280*** | 7.49 | 1.202*** | 28.75 | | ERVOL | 4.647** | 2.17 | | | | DLAVGEXPO (-2) | | | -0.394 | -0.86 | | ERDEV | | | -0.204*** | -6.34 | | DUMCRISIS | | | 0.203** | 2.18 | | Error correction Term | -0.089** | -1.97 | -0.33*** | -3.30 | | Note: *** and ** indicate level of statistical significance at 1 per cent and 5 per cent, respectively. | The negative sign of the Coefficient of exchange rate deviation indicates that depreciation of exchange rate relative to PPP exchange rate does not lead to an increase in reserves implying the absence of mercantilist motive. On the other hand, dummy representing a year after sudden-stop/currency crisis which captures precautionary motive has a positive sign confirming EMEs’ precautionary motive behind accumulating reserves as a self-insurance. V. Implications of Foreign Exchange Reserves As per the IMF’s balance of payments manual, foreign exchange reserves are useful in directly influencing the exchange rate apart from hidden implications for foreign borrowings and confidence in the economy. To quote the IMF (2009)4 “Reserve assets are those external assets that are readily available to and controlled by monetary authorities for meeting balance of payments financing needs, for intervention in exchange markets to affect the currency exchange rate, and for other related purposes (such as maintaining confidence in the currency and the economy and serving as a basis for foreign borrowing).” In this context, evidence with respect to some of the implications of reserves is provided below. V.1 Volatility of Exchange Rate Volatility in forex market due to a global macro-financial shocks may affect trade flows through volatile exchange rates; balance sheet positions of banks; and hedging cost of corporates due to volatile forward rates. Therefore, central banks’ interventions are aimed at curbing excessive volatility in exchange rate. Since central banks’ intervention capacity depends upon the level of reserves, adequacy of reserves matters for the size, frequency and efficacy of interventions to reduce exchange rate volatility. Against this backdrop, the correlation between Coefficient of variation (CV)5 of real effective exchange rate6 (proxy for exchange rate volatility) and the reserves (represented by reserve cover of imports) are computed for select EMEs using data from 1994-2020 (Chart 7A and 7B). The negative and statistically significant correlation Coefficient between reserves and the CV of REER was broadly in line with the evidence of studies on efficacy of central bank intervention in lowering volatility (Berganza and Broto 2012; Fratzscher et. al., 2018). 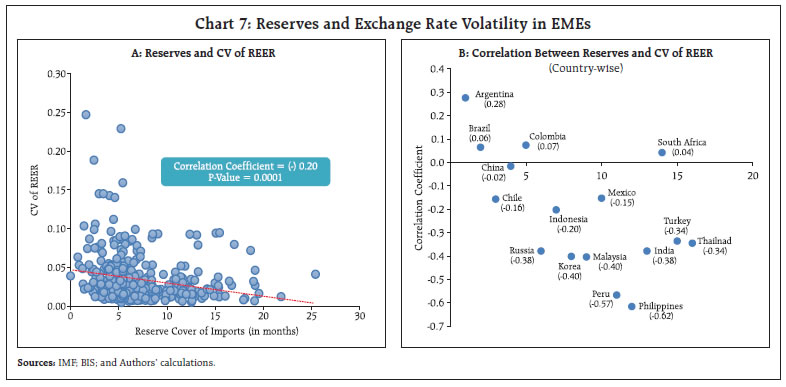 V.2 Forward Premia Forward premium, which is the future price of a currency, serves as a benchmark for hedging cost for corporates with foreign currency exposures (e.g., imports and/or foreign borrowings). Empirical evidence suggests that the size of forex reserves acts as a deterrent against speculative attack and, therefore, reduces sovereign risk premium in adverse economic circumstances (Kohlscheen 2020). Yeyati (2008) argues that reduction in risk premia due to forex reserves through its effects on sovereign credit rating implies lower effective cost of holding reserves. However, forex interventions in the form of forward purchases are found to be associated with increase in forward premia (RBI, 2021). Covered interest rate parity condition suggests that interest rate differential between two countries is reflected in forward rate. In the Indian context, there is a negative relationship between forward premia and the reserve cover of imports (Chart 8). The correlation Coefficient of import cover of reserves with 3-month and 6-month forward premia is found to be negative -0.67 (p-value, 0.00) and -0.65 (p-value, 0.00), respectively, for the period from 1993-94 to 2020-21. Further, the correlation of interest rate on external commercial borrowings (ECBs) proxied by weighted average margin over LIBOR (margin over 6-month LIBOR or reference rate for floating rate loans) with reserve cover of imports during 2004-05 to 2020-21 was negative at -0.48 (p-value, 0.05). This implies that adequate level of reserves are accompanied with low cost of foreign currency borrowings. 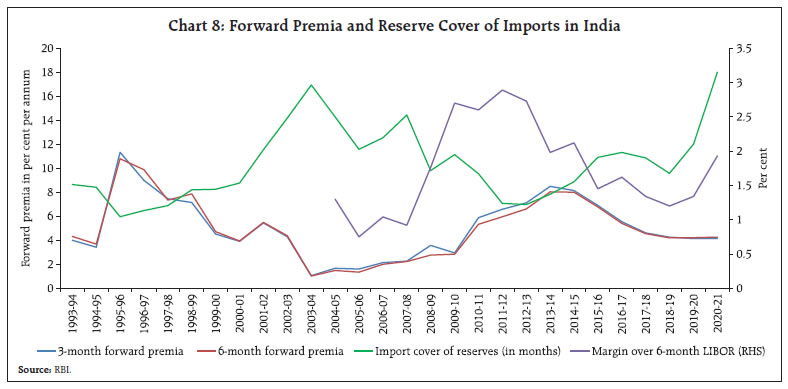 V.3 Role of Reserves in External Sector Stability One of the major arguments given in favour of accumulation of reserves is its role as a deterrence against speculative attack on the currency in the event of sudden stops. A speculative attack can cause sharp depreciation, a currency crisis, which necessitates central banks to intervene in the foreign exchange market or to increase domestic interest rates (Glick and Hutchison, 2011) and the currency crisis raises the probability of a banking crisis (Glick and Hutchison, 2001). Against this backdrop, the role of foreign exchange reserves in currency crisis is examined. A binary response model which takes the value 1 in crisis year and 0 in other years is used and estimated applying a probit model. The sample includes 15 emerging market economies7, a mix of both current account deficit and surplus countries. Annual data from 1980 to 2020 on these 15 countries are used and the sample includes 70 data points of currency crises. Country-wise currency crisis data for the period from 1980 to 2000 as provided in Glick and Hutchison8 (2001) is used. For 2001-20, country-wise currency crisis years identified using exchange market pressure database of Patnaik et al. (2017)9 and real effective exchange rate following Esquivel and Larrain10 (1998). Following IMF (2020) and Goyal (2012), determinants of currency crisis considered for this study includes (i) net foreign assets as per cent of GDP (NFA) [alternatively external liabilities decomposed into debt liabilities as per cent of GDP (external debt) and equity liabilities as per cent of GDP (equity liabilities)]; (ii) reserve cover of imports of goods and services (reserve cover) in months; (iii) external financing requirement measured by stock of short-term external debt at the start of the year and current account deficit; and (iv) the real per capita income (PCI) in US dollar ($). Country-wise net foreign assets data are sourced from ‘External Wealth of Nations’ database of Lane and Milesi-Ferretti (2017) for 1970- 201511. Similarly, data on the composition of external liabilities in terms of debt and equity is obtained from Lane and Milesi-Ferretti (2017) and World Bank data on external debt. The data on current account deficit and short-term debt are taken from the IMF database and the World Bank, respectively. Nominal GDP in US dollar is sourced from World Bank database and used for computing GDP ratios of NFA, external debt and equity liabilities. Results of the Probit model presented in Table 4 show improvement in NFA (i.e. external assets net of external liabilities) reducing probability of currency crisis as observed in earlier studies (IMF, 2020 and Goyal, 2012) pointing to the importance of adhering to a sustainable current account deficit12. However, when NFA is decomposed into debt and equity it reveals that an increase in debt is associated with higher probability of a crisis. On the other hand, an increase in equity liabilities is found to reduce probability of a currency crisis, corroborating the preference for equity inflows over debt in capital account management by EMEs. These findings, viz., probability of a crisis being influenced positively by external debt and negatively by equity liabilities, is in line with the IMF’s External Sector Report, 2020. When debt liabilities were replaced by external financing requirement (taking a first lag of short-term external debt and current account balance) their impact on probability of crisis was found to be more pronounced in terms of the size of Coefficient. Finally, per capita income representing domestic economic conditions was added as an explanatory variable which was found to lower the probability of a crisis, thereby suggesting an important role for strong domestic macroeconomic fundamentals in absorbing adverse external shocks. Table 4: Probit Model Results
(Dependent Variable: Probability of Currency Crisis) | | | 1 | 2 | 3 | 4 | | Constant | -1.392*** | -0.830*** | -2.711*** | -2.520*** | | | (-11.93) | (-3.96) | (-3.97) | (-3.57) | | NFA | -0.007** | | | | | | (-2.15) | | | | | Reserve Cover | | -0.078*** | -0.103*** | -0.100*** | | | | (-2.74) | (-3.20) | (-3.04) | | External Debt | | 0.007** | | | | | | (2.03) | | | | Equity Liabilities | | -0.011*** | -0.017*** | -0.016*** | | | | (-2.77) | (-3.51) | (-3.39) | | External Financing | | | 0.259*** | 0.243*** | | | | | (3.37) | (3.05) | | PCI growth | | | | -7.758*** | | | | | | (-4.68) | | McFadden | 0.01 | 0.08 | 0.10 | 0.15 | | R-Squared | | | | | | LR Statistic | 4.70 | 32.48 | 37.47 | 59.38 | Note: 1. ‘***’ and ‘**’ denotes statistical significance at 1 per cent and 5 per cent probability level, respectively.
2. Figures in brackets are z-statistics.
3. Estimation in column 3 and 4 excludes Chile and Korea for which short-term debt data was not available. | V.4 Composition of External Liabilities While reserve accumulation forms a part of central bank assets, the concomitant increase in liabilities can be seen in the country’s international investment position (IIP) statistics. In view of its varying impact on crisis probability, external liabilities can be analysed by decomposing them into debt and equity. India’s accumulation of external liabilities in the past two years has been largely driven by non-debt creating equity flows. For example, in 2020-21 India witnessed large net inflows of FDI and outflows of ECBs. FPI inflows in 2020-21 were mainly in the form of equity. Further, FPI inflows were from category-I (i.e., central banks, sovereign wealth funds and multilateral agencies) i.e., relatively stable FPI. This has reflected in the lower share of debt liabilities in external liabilities, which declined gradually from 51.5 per cent at end March-2020 to 47.6 per cent at end-March 2021 (Chart 9). Consequently, the reserve cover of debt liabilities increased in recent years to reach 100.1 per cent at end-March 2021 from below 70 per cent during 2013-14, though it is much lower than the highest level of 138 per cent recorded during end- June 2008. 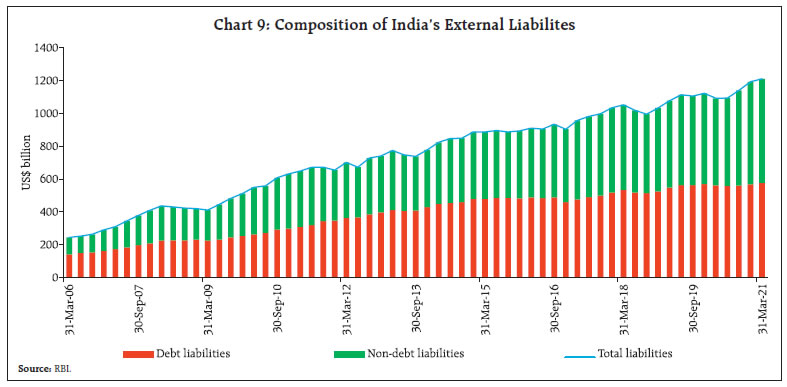 VI. Conclusion This article analyses the trend of reserve accumulation in major EMEs with a focus on key drivers and motives or objectives. It is observed that EMEs accumulated reserves during the COVID-19 period benefitting from abundant global liquidity propelled by ultra-accommodative monetary policies pursued in major advanced economies. Several EMEs witnessed increase in reserves to GDP ratios and reserve adequacy levels. India’s reserve accumulation in recent period has been broadly in line with the trend witnessed across EMEs and an outcome of both capital flows and modest level of current account deficits. Empirical analysis shows that in the long-run reserve accumulation of EMEs is determined by the precautionary motive rather than any mercantilist motive. On the benefits, reserves are found to be helping EMEs in curbing volatility of exchange rates, as evident from the negative relationship between exchange rate volatility and reserve cover of imports. Estimation of a Probit model revealed that an increase in reserves reduces the probability of a currency crisis, thereby implying positive externality of holding reserves. For India, higher reserve cover of imports is found to be associated with lower cost of foreign currency borrowings, viz., forward premia and the interest rate on ECBs. Further, the decomposition of India’s external liabilities reveals lower vulnerability due to rising share of non-debt liabilities in total liabilities and an increased reserve cover of debt liabilities. References: Aizenman J. and Lee J. (2005) ‘International Reserves: Precautionary vs. Mercantilist Views, Theory and Evidence’ IMF Working Paper No 198. Arslan, Y. and Cantú, C. (2019), ‘The size of foreign exchange reserves’ BIS Papers, No. 104 Berganza, J. and Carmen Broto C. (2012), ‘Flexible inflation targets, forex interventions and exchange rate volatility in emerging countries’, Journal of International Money and Finance, Vol. 31 Issue 2, pp. 428–444. Catao L. A.V. and Milesi-Ferretti G. M. (2014) ‘External Liabilities and Crises’ Journal of International Economics Volume 94, Issue 1, pp. 18-32 Choi W. J. and Taylor A.M. (2017) ‘Precaution Versus Mercantilism: Reserve Accumulation, Capital Controls and the Real Exchange Rates’ NBER Working Paper Series. Dooley, M. P., Folkerts-Landau D. and Garber P. (2004), ‘The Revived Bretton Woods System’ International Journal of Finance and Economics 9(4): 307–313. Esquivel G. and Larrain (1998) ‘Explaining Currency Crises’, John F. Kennedy Faculty Research Working Paper No-07. Fratzscher, M. Gloede, O., Menkhoff, L., Sarno, L. and Stöhr T. (2019) ‘When is Foreign Exchange Intervention Effective? Evidence from 33 Countries’ American Economic Journal: Macroeconomics, Vol 11 No 1, pp.132-56. Ghosh, A. R., Ostry J. D., and Tsangarides C. G.(2016), ‘Shifting Motives: Explaining the Buildup in official Reserves in Emerging Markets Since the 1980s’ IMF Economic Review 64: 1–57. Glick, G. and Hutchison, M. (2001) ‘Banking and Currency Crises: How Common Are Twins?’ UCSC Dept. of Economics Working Paper No. 488. Glick, G. and Hutchison. M. (2011) ‘Currency Crises’ FEDERAL RESERVE BANK OF SAN FRANCISCO Working Paper. Goyal R. (2012) ‘Sustainable Level of India’s Current Account deficit’ RBI Working Paper, No. 16. IIMA (2021): ‘Can Central Bank Gold Reserves Reduce Sovereign Credit Risk?’ Available at www.iima.ac.in IMF (2020), ‘2020 External Sector Report: Global Imbalances and the COVID-19 Crisis’. IMF (2021), ‘2021 External Sector Report: Divergent Recoveries and Global Imbalances’. Jeanne, O. and Rancière, R. (2011), ‘The Optimal Level of International Reserves for Emerging Market Countries: A New Formula and Some Applications’ The Economic Journal, Volume 121, Issue 555. Kohlscheen E. (2020), Limiting risk premia in EMEs: The role of FX reserves, Economics Letters, Volume 196. Korinek, A. and Serven L. (2016), ‘Undervaluation through Foreign Reserve Accumulation: Static Losses, Dynamic Gains’ Journal of International Money and Finance 64: 104–136. Lane P. R. & Milesi-Ferretti G. M. (2017). International financial integration in the aftermath of the global financial crisis. IMF Working Paper No.115 Mohan, R. (2008) ‘Capital Flows to India’ Paper presented at the annual meeting of Deputy Governors held at the Bank for International Settlements, Basel. Patnaik, I., Felman J., and Shah A (2017), ‘An exchange market pressure measure for cross country analysis’ Journal of International Money and Finance, 73: 62-77. Patel, N. and Cavallino, P. (2019), ‘FX intervention: goals, strategies and tactics’ BIS papers, No. 104b. RBI (2010), Annual Report 2009-10, Reserve Bank of India. RBI (2021), Monetary Policy Report-October 2021, Reserve Bank of India. Reddy, Y. V. (2002), ‘India’s foreign exchange reserves - policy, status and issues’, Special Lecture, at the National Council of Applied Economic Research, New Delhi. Reddy, Y.V. (2006), Foreign Exchange Reserves: New Realities and Options, Address at the 2006 Program of Seminars in Singapore. Rodrik, Di. (2008), ‘The Real Exchange Rate and Economic Growth’. Brookings Papers on Economic Activity 39(2): 769–797. Sooriyan, S. (2017), ‘The Determinants of Foreign Exchange Reserves in India During 1983-2014’ International Journal of Pure and Applied Mathematics, Volume 113, No. 6, pp.251-260. Wijnholds, O. B. and Kapteyn, A. (2001), ‘Reserve Adequacy in Emerging Market Economies’ IMF Working Paper No. 143. Yeyati, E. L. (2008), ‘The cost of reserves’ Economics letters, Volume 100.
| Annex 1: Panel Unit Root Test Results | | | LLC Test
(Null: Unit root) | IPS test
(Null: Unit root) | | LRESERVES | 2.36 | 2.03 | | | (0.01) | (0.98) | | LTOT | -1.63 | -1.15 | | | (-0.05) | (-0.12) | | LEXPV | -6.95 | -1.69 | | | (0.00) | (0.05) | | LIMPV | -3.55 | 0.81 | | | (0.00) | (0.79) | | ERVOL | -8.91 | -8.68 | | | (0.00) | (0.00) | | LAVGEXPO | -7.00 | -2.67 | | | (0.00) | (0.00) | | EXRATE | -1.19 | -1.17 | | | (0.12) | (0.12) | Note: 1. Figures in brackets are p-values.
2. LLC test assumes common unit root process while IPS test assumes individual unit root process. |
|