The Schumpeterian creative destruction process requires a dynamic reallocation of resources from weak and vulnerable firms to strong firms having high growth potential. Zombie firms that often survive longer than desirable taking advantage of countercyclical policy support, however, tend to thwart that process. Using firm-level data for India, this article finds that monetary policy does not hinder the creative destruction process by misallocating credit flows to zombies during periods of economic slowdown, but zombies seem to have dampened the effectiveness of monetary policy at the margin as they use borrowed resources more for their survival than for undertaking new investment. Introduction There is a growing evidence-based realisation that business cycles are costly and stabilisation policies are more beneficial than widely thought (Jordà, Schularick and Taylor, 2020). Because of the endogenous effects from weak cyclical conditions on the growth trajectory, aggressive and proactive countercyclical policy actions may be optimal (Cerra, Fatás and Saxena, 2020). It has often been argued that in the post-global financial crisis (GFC) period, the slowdown in productivity growth – a secular pre-GFC trend that was only amplified by the crisis – might have also been partly the result of ultra-accommodative monetary policy, that created an enabling environment for weak banks to evergreen loans to zombies and keep them alive (Obstfeld and Duval, 2018). The Schumpeterian creative destruction process requires a dynamic reallocation of resources from weak and vulnerable firms to strong firms with high growth potential, but policy interventions to protect weak firms and mitigate job losses can hinder medium-term progress and involve technological “sclerosis” (Caballero and Hammour, 1996). The countercyclical policy response, thus, involves a choice – preserving existing jobs versus encouraging creative destruction, allowing jobs and resources to move away from unsuccessful firms towards more successful firms (G30, 2020). Globally, there has been an increase in the number of perpetually loss-making zombie firms, who use more credit/external finance to service debt regularly, enabling them to remain in business (Banerjee and Hofmann, 2020). Weak banks often lend to such zombie firms at higher interest rates, enabling the survival of such weak banks in a financial system. Accommodative monetary policy and low- interest rates also help zombies – dubbed widely as the “living dead” – to remain in business. Following the unpleasant Japanese experience with the zombies in the 1990s, it has been progressively realised that zombification may be a global phenomenon, and accordingly, research attention has shifted to multiple facets of this challenge – zombies crowd-out growth opportunities of more productive firms and their rising presence in an economy can lower potential growth (McGowan, Andrews and Millot, 2018); countries operating with weak banks and weak insolvency regimes allow zombies to thrive (Andrews and Petroulakis, 2019); the “zombie credit channel” thrives in a weakly capitalised banking (financial) system, and accommodative monetary policy in such a system can propel a practice of “loan evergreening” enabling weak banks and weak firms to stay afloat, with the latter servicing debt timely using new borrowings from the former, and the former thereby also postponing recognition of bad assets to stay above the minimum regulatory capital requirement (Acharya, 2019); “…Schumpeter’s theory of creative destruction is not corroborated in the data” (Bosio, Djankov, Jolevski and Ramalho, 2020); and, the risk of death of a weak firm decreases the longer it survives as a zombie (Nurmi, Vanhala and Virén, 2020). The nature of the firms operating in an economy – strong, weak or zombies – can often influence the outcome of monetary policy response and the impact of a shock on the economy. Strong firms may pile up surplus cash in the event of a recession, deleverage to strengthen the balance sheet and remain prepared to take advantage of the cyclical pick-up. Weak firms, with limited liquid assets and collaterals and poor credit history, however, may face the heat of flight to quality, leading to lower access to credit when they may need it the most, that too at higher rates (or external finance premium). Counter-cyclical monetary policy can help contain the propagation of a shock by protecting weak firms. The creditworthiness of borrowers is endogenous to an adverse shock, as they suffer cash-flow disruptions (or liquidity stress) at a time when their net worth (or capacity to present collateral or own equity) goes down. While the net worth of a firm is pro-cyclical (i.e., a recession lowers the capacity of a firm to borrow), the external finance premium is countercyclical (i.e., in a recession, given information asymmetry, banks may either charge higher interest rate or ration credit1), and therefore a counter-cyclical monetary policy (that can mitigate the risk of excessive increase in external finance premium and propel credit supply from banks to the vulnerable) becomes necessary. Both the balance sheet channel and credit channel of monetary policy could help stabilise the economy following an exogenous shock. As regards the balance sheet channel, first, lower interest rates may increase the value of marketable collaterals (such as shares and bonds); second, debt servicing burden may decline to the extent that loans are contracted at variable rates of interest; and third, cash flows of firms may improve when the aggregate demand situation in the economy responds to the monetary stimulus. All these three forces could help reduce the external finance premium for the firms. The credit channel (or the credit supply channel) can also mitigate the risk of credit rationing. In an atmosphere characterised by growing presence of zombies, however, stabilisation policies can potentially endanger the medium-term growth trajectory by hampering creative destruction. Set against this context, this article focuses on examining how the influence of zombies in the Indian economy has changed over time, and how zombies respond to monetary policy vis-à-vis non-zombies. Section II outlines the relevance of a clear distinction between zombies and non-zombies in empirical firm- level research to monetary policy analysis. It also explains the approach followed in this paper for the identification of zombies, and then presents a factual assessment of how zombies have performed relative to non-zombies over time in India. Section III examines empirically the sensitivity of (a) borrowings from banks, (b) investment, and (c) cost of finance of zombies to changes in the monetary policy rate and liquidity conditions relative to non-zombies. While monetary policy is captured through the weighted average call money rate (WACR) – it being the operating target of monetary policy in India, liquidity condition is captured through net surplus/deficit position under the liquidity adjustment facility (LAF) as a percentage of net demand and time liabilities (NDTL). Concluding observations are presented in Section IV. II. Some Evidence of Zombification in India In India, the non-government non-financial corporate sector comprises firms in both organised and unorganised sectors. The information available on the former has both listed and unlisted companies, while many small and medium enterprises are in the unorganised sector. The analysis presented in this paper is based on the Prowess database of the CMIE and therefore relates to the organised sector. Past studies using this dataset for India have found that smaller firms rely more on external finance compared with larger firms2. Importantly, “alternative finance” within “external finance” – i.e., finance raised from friends/relatives/family, business partners and trade credit, often without legal contracts – is the primary source for small and medium enterprises (SMEs) and unlisted firms, with financing from banks and markets coming second in the pecking order for them, unlike large and listed firms. Moreover, contrary to perceptions, firms relying more on alternative finance, rather than finance from banks and markets, exhibit stronger growth (Allen, Chakrabarti, De and Qian, 2012)3. Changes in the leverage of non-zombie firms (or their recourse to external finance as opposed to internal finance), unlike zombies, could depend on the state of the business cycle, which may impact not only their cash flows but also their decisions on the timing and size of new investment. The investment cycle could go through either a period of temporary cyclical slowdown or protracted weakness, depending on several causative factors (Pattanaik, Behera, Kavediya and Shrivastava, 2020). In the case of the latter, the unholy relationship between zombies4 and weak banks (that face the risk of falling below the minimum regulatory capital requirement in the event of defaults) may strengthen. The response of firms (their leverage) to business cycles, and counter-cyclical monetary policy, may differ between zombies and non-zombies. Depending on the relative importance of zombies in the leverage cycle in the overall non-financial non-government corporate sector, the effectiveness of monetary policy – in stabilising the business cycle versus promoting zombies – could be assessed. In India, limited literature is available on the effect of the business cycle on the leverage of firms (Pattanaik and Sengupta, 2018). To the best of our knowledge, no research is available on how counter-cyclical monetary policy operates through the leverage profile of zombies versus non-zombies, and accordingly, whether monetary policy impedes creative destruction and thereby contributes to misallocation of resources. On the role of Zombies in India, Kashyap, Mahapatro and Tantri (2021) found evidence of indirect evergreening in India (i.e., weak firms increase leverage by borrowing through related parties from weak banks, but decrease real investment) which often goes undetected. Such resource misallocation supports the crowding-out effects ascribed to zombies. In empirical research, it is not that straightforward though to identify zombies and distinguish them from firms that face stress due to an adverse shock striking the economy or those that by design may be promoted through subsidies and directed credit. Kulkarni, Ritadhi, Vij and Waldock (2019) deployed a novel approach using supervisory data to identify Indian zombies as those firms that are 60-90 days past due (but still not classified as NPAs) and of below AA credit rating. 11 per cent of borrowers in India, as per this approach, were found to be zombies. For the empirical analysis (in the next section), annual financial statements of non-financial firms have been considered in this article for the period 2000-01 to 2019-20. This is an unbalanced panel data. Firms are classified into zombies and non-zombies based on the following criteria: A firm is categorized as a zombie at time t if: -
The leverage of the firm is above the median leverage; -
Interest coverage ratio (ICR) < 1; -
Rating is in the risky category; and -
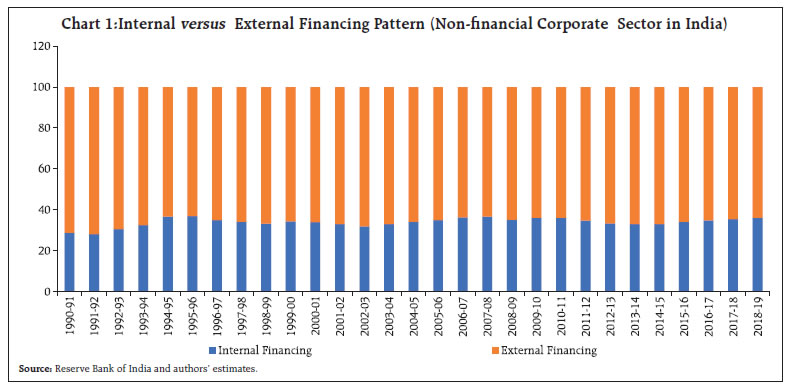
Debt growth is positive. Among the above-mentioned classification filters, (1), (2) and (3) indicate the degree of financial distress facing a firm, while condition (4) reflects its access to external financing. Detailed definitions of other variables considered for the study are provided in Appendix-1. The summary statistics of variables used in the analysis have been provided separately for zombies and non-zombies in Table 1. It can be observed that there are no significant differences between zombies and non-zombies in respect of their age (i.e., the number of years in business) and size; however, on profitability, zombies, on average, have delivered only negative return on their assets, unlike non-zombies. The average debt of non-zombies is below 35 per cent of their total assets, while zombies have debt levels of about 65 per cent of their total assets. Part of this high difference in leverage could be the result of the choice of the first classification filter. The average cost of funds, defined as the ratio of their total interest expenses to average debt, is only 40 basis points higher for zombies. Zombies have relationships with fewer banks on average compared to non-zombies, but the length of the relationship continuing with a bank is higher for non-zombies than zombies. Investment, measured by the ratio of annual addition of fixed assets to total assets is lower for zombies, though for non-zombies the average investment is not significantly higher. From the perspective of rating, since zombies are identified based on the average rating of different instruments, they fall in the risky category vis-à-vis non-zombies. In India, close to two-thirds of the total financing of non-financial corporates is secured from external sources, corroborating the significance of examining not only the external finance premium channel of monetary policy but also the importance of zombification to the effectiveness of monetary policy (Chart 1). As per the scheme of identification laid out earlier, around 10 per cent of non-financial firms in India could be viewed as zombies (Chart 2). This share increased in the post-global financial crisis (GFC) period up to 2016, and subsequently, some stabilisation has been observed. While the post-GFC increase could have been an outcome of the massive policy stimulus that was directed at containing the damage to the real economy from the GFC, the recent stabilisation may be on account of the welcome change in India’s credit market conditions following the new insolvency and bankruptcy (IBC)-led regime that is relatively less tolerant of non-performing businesses staying alive for long. | Table 1: Summary Statistics | | | Obs. | Mean | Std. Dev. | Median | Kurtosis | Skewness | | Non-zombies | | Age (years) | 24137 | 30.90 | 20.23 | 26.00 | 6.31 | 1.56 | | Size | 24137 | 8.25 | 1.66 | 8.12 | 2.48 | 0.33 | | ROA (%) | 24137 | 3.59 | 6.21 | 3.22 | 4.73 | -0.35 | | Leverage (%) | 24137 | 33.15 | 24.77 | 31.60 | 638.68 | 13.12 | | Cost of Funds (%) | 24137 | 10.11 | 5.08 | 9.79 | 4.63 | 0.82 | | Bank Relationship | 24137 | 4.87 | 4.13 | 4.00 | 4.76 | 1.48 | | Bank Relationship Length | 24137 | 10.81 | 7.75 | 9.00 | 2.28 | 0.59 | | Investment | 21198 | 0.06 | 0.09 | 0.03 | 77.91 | 5.47 | | Bank Borrowings | 16154 | 2744.98 | 5283.64 | 686.35 | 13.93 | 3.22 | | Mean Rating | 24137 | 6.18 | 2.12 | 6.33 | 2.67 | -0.70 | | Zombies | | Age (years) | 2046 | 27.56 | 18.24 | 24.00 | 6.67 | 1.61 | | Size | 2046 | 7.59 | 1.65 | 7.43 | 2.41 | 0.49 | | ROA (%) | 2046 | -5.08 | 6.90 | -2.86 | 1.99 | -0.56 | | Leverage (%) | 2046 | 66.00 | 37.81 | 58.07 | 59.93 | 5.60 | | Cost of Funds (%) | 2046 | 10.41 | 4.43 | 10.73 | 4.16 | 0.08 | | Bank Relationship | 2046 | 4.43 | 4.10 | 3.00 | 5.60 | 1.72 | | Bank Relationship Length | 2046 | 8.77 | 7.16 | 7.00 | 2.85 | 0.88 | | Investment | 1726 | 0.04 | 0.09 | 0.01 | 31.96 | 4.82 | | Bank Borrowings | 1453 | 3027.63 | 5462.31 | 745.50 | 11.56 | 2.87 | | Mean Rating | 2046 | 1.67 | 0.66 | 2.00 | 1.98 | 0.41 | Note: Please refer to Appendix-1 for explanation of variables used in this table.
Source: Centre for Monitoring Indian Economy (CMIE) and authors’ estimates. |
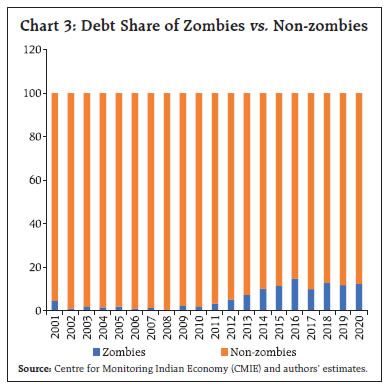
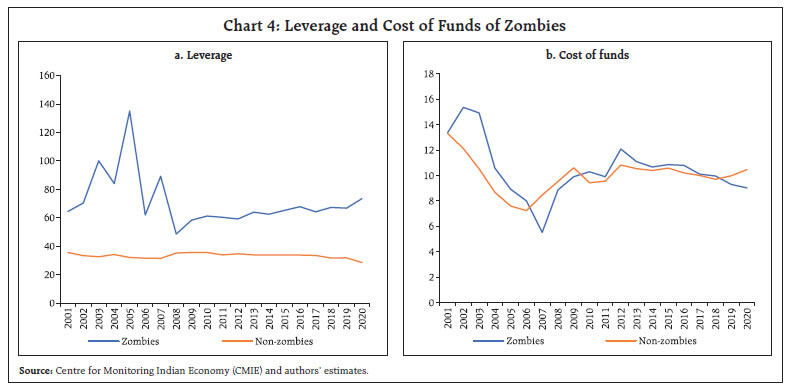
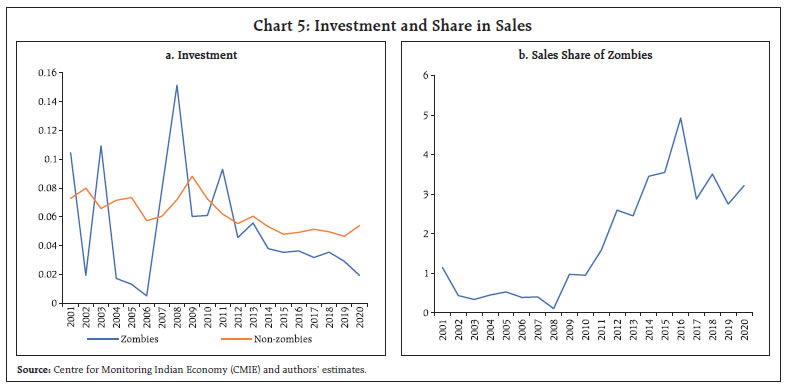
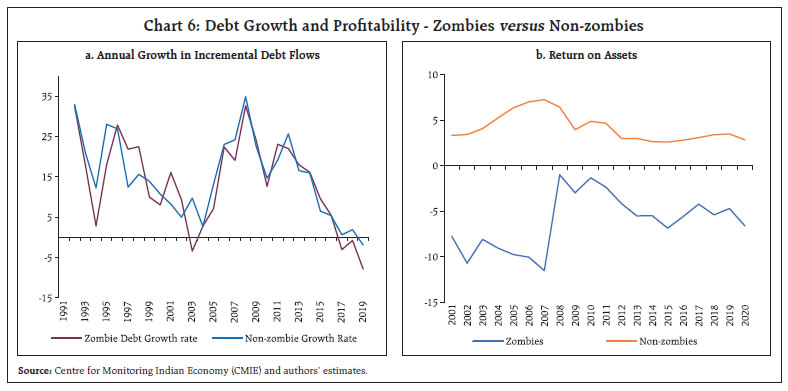
 What emerges as a particularly striking finding is that zombies in India, post-GFC, have increased their share in total non-financial corporate sector debt to more than 10 per cent (Chart 3). Further analysis corroborates the expected differences between zombies and non-zombies in key financial parameters – zombies in India operate with significantly higher leverage, defined by total debts to total assets, compared to non-zombies, but surprisingly they manage to borrow funds at costs somewhat similar to what non-zombies pay (Chart 4). Despite their greater leverage, the share of zombies in total sales of the non-financial corporate sector has declined in recent times, which can be viewed as an evidence of zombies in India contributing to misallocation of resources and hampering creative destruction in the economy (Chart 5). Moreover, while the year-on-year (Y-o-Y) growth in debt of zombies has been very similar to that of non- zombies, the former lagged consistently in generating profits, which is another noticeable evidence of resource misallocation (Chart 6). 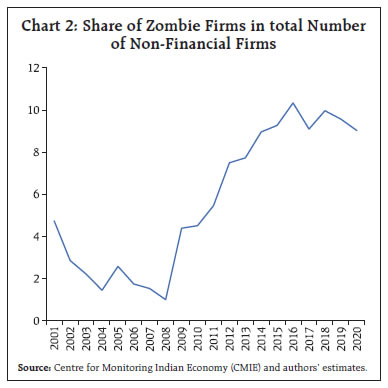
 III. Empirical Analysis Creative destruction and the effectiveness of monetary policy in stabilising business cycle are often studied in isolation in empirical research, even as the latter could potentially undermine the former, and the former can also potentially ease the burden on monetary policy to support growth over an extended period, implying that both issues may be interconnected. This paper aims to examine only one aspect of this interconnectedness, i.e., whether growth supportive monetary policy protects zombies and thereby clogs the creative destruction process in the Indian economy. Monetary policy actions tend to operate by impacting the cost of funds of firms and their volume of new borrowings (or change in leverage), which in turn may influence new investment decisions (or change in fixed assets). It would be interesting to know how the cost of funds, new borrowings and new investment of zombies and non-zombies respond to monetary policy shocks, under different liquidity conditions. Accordingly, the following three empirical issues are emphasised in this paper: -
The impact of monetary policy on the cost of funds of zombies versus non-zombies; -
Sensitivity of bank borrowings to changes in the cost of funds of zombies versus non-zombies; and -
Sensitivity of investment to changes in bank borrowings of zombies versus non-zombies. 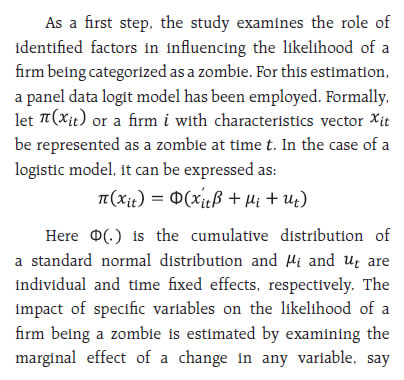 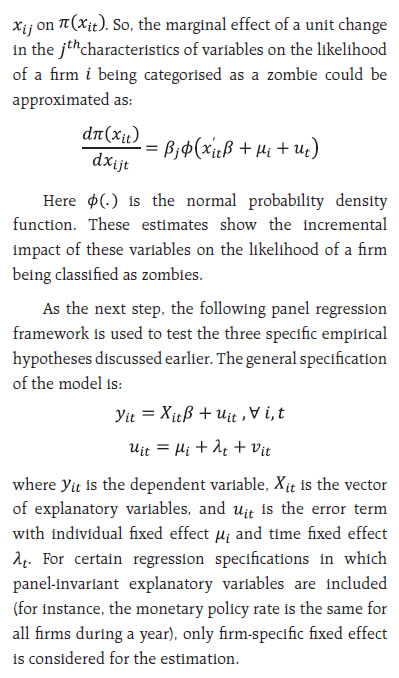 Monetary policy is captured through the weighted average call rate (WACR) – the operating target of monetary policy in India, to study the impact on the cost of funds of firms. In addition to WACR, the role of firm-specific factors such as their size, profitability, and the number and length of banking relationships that may determine the cost of funds are also included in the model. To assess whether the credit channel of monetary policy works at the firm level, the differential bank borrowing pattern of zombies and non-zombies in response to changes in their cost of funds is also estimated. The response pattern is separately studied for surplus and deficit liquidity phases [captured through annual average net liquidity adjustment facility (LAF) positions as a percentage of net demand and time liabilities (NDTL)]. To examine whether zombies borrow from banks to undertake new investment or to just survive by meeting current expenses, the sensitivity of investment of firms to new borrowings is studied next. Bank borrowings can be broadly categorised into two types: short-term borrowings and long-term borrowings, with the latter often indicating the intention of new investment by firms. In the data sample used in this paper, around 40 per cent of total bank borrowings are found to be of long-term. Before proceeding to examine the three empirical issues, the importance of specific factors that may characterise a firm as a zombie (or influence the likelihood of a firm as a zombie) is assessed first (Table 2). A firm with a higher age profile (or that survives longer) is relatively less likely to be a zombie; but overall, zombies tend to succeed in surviving long enough, posing risks to creative destruction. A higher return on assets lowers a firm’s likelihood of being a zombie. There are two interesting findings on banking relationships: first, firms having relationships with a lesser number of banks are more likely to be zombies; second, firms with shorter banking relationships are also more likely to be zombies. A longer banking relationship helps banks in acquiring soft information about firms, which in turn may contribute to the realistic assessment of a firm’s creditworthiness. The banking relationship structure for zombies is expected to differ from that of non-zombies in a competitive banking system that may progressively assign greater importance to the risk-return profile and outlook of firms rather than the past relationship with a firm. Zombies tend to depend more on bank borrowings (evident for overall as well as long-term loans) as market sources may differentiate better between good and bad firms and deny access to the latter. On the first empirical issue of interest, estimates suggest that a 100-basis point reduction in WACR lowers the cost of funds of firms by 35 basis points in the same year (Table 3). Surprisingly, in some specifications, zombies seem to manage lower average cost of funds, which could be an indication of the impact of evergreening to avoid higher explicit recognition of NPAs and the associated higher capital charges by banks, or also simple relationship-based banking that some banks may prefer to protect as long as the magnitude of the problem is manageable. The interactive dummy coefficient highlights that compared to non-zombies, the cost of funds of zombies is more sensitive to changes in WACR. An interest rate shock, expectedly, matters more to zombies but, from the standpoint of the effectiveness of monetary policy, it is found that cost of funds of all firms (zombies and non-zombies) change in response to changes in WACR. Again, along the expected lines, firms that are larger and profitable have lower average costs of funds. The lower average cost of funds tends to stimulate higher bank borrowings for all firms (Table 4). During liquidity surplus phases, borrowings are also generally higher, attesting to the overall effectiveness of monetary policy. As one would expect, bank borrowings of zombies are comparatively higher than non-zombies. However, importantly, zombies borrow relatively less compared to non-zombies during surplus liquidity conditions, which does not support the perception that pro-growth counter-cyclical monetary policy may at times clog the creative destruction process in the economy. Normally, in a period of economic slowdown, good firms may accumulate cash surpluses while bad firms may need more credit to survive. Banks that may be driven by credit growth targets could still meet the credit needs of the latter, but in a well-supervised banking system, the increasing emphasis on the risk sensitivity of new assets created by banks may refrain them from doing so, despite the challenge of being viewed as risk-averse. Effective bank supervision and credible insolvency and bankruptcy procedures could, thus, lower the probability of accommodative monetary policy impeding creative destruction in an economy. An increase in bank borrowings in response to an accommodative monetary policy shock is found to raise the investment of firms, defined as the ratio of incremental addition of fixed capital to total assets (Table 5). The sensitivity of investment, however, is found to be lower for zombies. The interactive dummy coefficient validates similar results even for long-term bank borrowings. Given that bank borrowings of zombies account for around 10 per cent of total bank credit absorbed by all non-financial firms in the past five years, they seem to be dampening the effectiveness of monetary policy to some extent. The real investment response to an accommodative monetary policy shock could strengthen if further improvement in resource allocation in the banking system could lower the share of zombies in the flow of new credit from banks. An accommodative monetary policy stance often aims at boosting the flow of credit to productive sectors of the economy and by intent, therefore, it does not work against the process of creative destruction, which is also corroborated by the empirical results of this article. IV. Conclusion In the post-Global Financial Crisis (GFC) period, return to a robust and durable growth trajectory has been elusive for a vast majority of countries, even as counter-cyclical policies have experimented with extreme variants of conventional and unconventional measures to support growth. In the process of doing so, a perception has developed that such policies may be hindering creative destruction and thereby contributing, quite inadvertently though, to lower trend investment and productivity growth. With the number of zombie firms – that cannot service debt, but still manage to borrow more to survive – rising globally over time, empirical examination of the relevance of this perception has acquired significance. In India, zombies are estimated to account for about 10 per cent of total debt of the non-financial corporate sector and they have also absorbed about 10 per cent of total bank credit extended to all firms in the economy. As one would expect, they are found in general to be highly leveraged; generate a negative return on assets over successive years and borrow more to survive rather than undertake new investment. Their average cost of funds is more sensitive to monetary policy shocks. Their borrowings from banks, however, often do not give rise to higher real investment activity, unlike non-zombies. This validates that accommodative monetary policy is effective overall in lowering the cost of funds, stimulating higher flow of credit and raising new investment, but it gets dampened at the margin by zombies who tend to use borrowed resources, including long-term bank loans, less for new investment and more for survival. Importantly, during surplus liquidity conditions, which often accompany accommodative phases of monetary policy, credit flows to zombies remain weaker than flows to non- zombies, which could largely be due to the salubrious impact of risk-based supervision and the insolvency and bankruptcy regime that may no longer support evergreening of zombies. The empirical findings, i.e., no evidence of surplus liquidity flowing excessively to zombies during phases of accommodative monetary policy corroborate that monetary policy in India has not hindered the creative destruction process and, therefore, does not pose any attendant risks to trend growth. With further improvement in resource allocation through the banking system, however, there is scope for enhancing the effectiveness of counter-cyclical monetary policy. References Acharya, V. V. (2019). Creating zombies and disinflation: A cul de sac for accommodative monetary policy. VoxEU. Org, November 11. Adalet McGowan, M., Andrews, D., & Millot, V. (2018). The walking dead? Zombie firms and productivity performance in OECD countries. Economic Policy, 33(96), 685–736. Allen, F., Chakrabarti, R., De, S., & Qian, M. (2012). Financing firms in India. Journal of Financial Intermediation, 21(3), 409–445. Andrews, D., & Petroulakis, F. (2019). Breaking the shackles: Zombie firms, weak banks and depressed restructuring in Europe. ECB Working Paper No 2240 / February. Banerjee, R., & Hofmann, B. (2020). Corporate zombies: Anatomy and life cycle. BIS Working Papers No. 882, September 2. Beranke, B. S., & Gertler, M. (1989). Agency costs, net worth, and business fluctuations. American Economic Review, 79(1), 14–31. Bosio, E., Djankov, S., Jolevski, F., & Ramalho, R. (2020). Survival of Firms during Economic Crisis. World Bank Policy Research Working Paper No. 9239. Caballero, R. J., & Hammour, M. L. (1996). On the timing and efficiency of creative destruction. The Quarterly Journal of Economics, 111(3), 805–852. Cerra, M. V., Fatás, A., & Saxena, M. S. C. (2020). Hysteresis and business cycles. International Monetary Fund Working Paper WP/20/73. G30 (2020). Reviving and Restructuring the Corporate Sector Post-Covid. URL: https://group30.org/publications/detail/4820 Jordà, Ò., Schularick, M., & Taylor, A. M. (2020). Disasters everywhere: The costs of business cycles reconsidered. Federal Reserve Bank of San Francisco Working Paper 2020-11. https://doi.org/10.24148/wp2020-11 Kashyap, N., Mahapatro, S., & Tantri, P. L. (2021). They Do It Anyway: Detecting Indirect Evergreening. Available at SSRN 3775286. Kulkarni, N., Ritadhi, S. K., Vij, S., & Waldock, K. (2019). Unearthing zombies. Georgetown McDonough School of Business Research Paper No. 3495660. Nurmi, S., Vanhala, J., & Virén, M. (2020). The life and death of zombies--evidence from government subsidies to firms. Bank of Finland Research Discussion Paper, (8). Obstfeld, M., & Duval, R. (2018). Tight monetary policy is not the answer to weak productivity growth. VoxEU, January 10. Pattanaik, A., & Sengupta, R. (2018). Business cycle effect on leverage: A study of Indian non-financial firms. IGIDR Working Paper WP-2018-001 Indira Gandhi Institute of Development Research: Mumbai, India. Pattanaik, S., Behera, H., Kavediya, R., & Shrivastava, A. (2020). Investment slowdown in India--an assessment. Macroeconomics and Finance in Emerging Market Economies, 1–16. Stiglitz, J. E., & Weiss, A. (1981). Credit rationing in markets with imperfect information. The American Economic Review, 71(3), 393–410.
Appendix-1 | Variables | Definition | | Age | Age of a firm at time t is defined as (t – the year of incorporation) number of years. | | Size | The logarithm of total assets. | | Return on assets (ROA) | Net income (i.e., profit after tax) to total assets (in per cent). | | Leverage | Total debt to total assets (in per cent). | | Cost of funds | Interest expenses to total average debt (in per cent). | | Bank relationship (BR) | The number of banks with which a firm has a relationship at time t. | | Bank relationship length (BRL) | The maximum year of relationship with a bank (among all bankers) (in years). | | Investment | Addition to fixed capital in a year (new investment) to total assets (in per cent). | | Bank borrowings | Amount of bank borrowings during a year, including both short-term and long-term borrowings (in million rupees). | | Average rating | The average rating is the average rating for different instruments of a firm at time t. The lowest rating value is 1, representing default; the highest rating value is 8; any rating value of less than 4 falls under the risky category. | | Zombie Dummy | A dummy variable which takes the value of 1 if the firm is categorised as a zombie, else it is 0. | | LAF Dummy | A dummy variable which takes the value of 1 for the years when net LAF was in surplus, else it is 0. | | Source: Centre for Monitoring Indian Economy (CMIE) and authors’ estimates. |
| Table 2: Factors that Determine the Likelihood of a Firm being a Zombie | | | Marginal Effects | | P(Zombie Dummy=1) | P(Zombie Dummy=1) | P(Zombie Dummy=1) | P(Zombie Dummy=1) | | Age | -0.00692*** | -0.00403*** | -0.00483*** | -0.00425*** | | | (0.00123) | (0.00128) | (0.00155) | (0.00154) | | Number of Banking Relationships | -0.0136** | -0.00287 | -0.0177** | -0.00844 | | | (0.00556) | (0.00572) | (0.00839) | (0.00678) | | Return on assets | -0.120*** | -0.120*** | -0.126*** | -0.126*** | | | (0.00304) | (0.00302) | (0.00392) | (0.00391) | | Bank relationship length | | -0.0205*** | -0.0185*** | -0.0179*** | | | | (0.00319) | (0.00378) | (0.00375) | | Bank borrowings | | | 0.0526** | | | | | | (0.0207) | | | Long-term bank borrowing share | | | | 0.00287*** | | | | | | (836 × 10-6) | | Constant | -1.620*** | -1.563*** | -1.833*** | -1.665*** | | | (0.0529) | (0.0520) | (0.132) | (0.0751) | | N | 26183 | 26183 | 17607 | 17607 | | Firm fixed effect | Yes | Yes | Yes | Yes | | Year fixed effect | Yes | Yes | Yes | Yes | Standard errors in parentheses. * p < 0.1, ** p < 0.05, *** p < 0.01.
Source: Authors’ estimates. |
| Table 3: Sensitivity of Cost of Funds to Monetary Policy Changes | | | (1) | (2) | (3) | (4) | (5) | | Cost of Funds | Cost of Funds | Cost of Funds | Cost of Funds | Cost of Funds | | WACR | 0.356*** | 0.356*** | 0.340*** | 0.356*** | 0.320*** | | | (0.0201) | (0.0201) | (0.0207) | (0.0201) | (0.0321) | | Size | -0.262*** | -0.260*** | -0.258*** | -0.259*** | -0.261*** | | | (0.0534) | (0.0535) | (0.0535) | (0.0571) | (0.0571) | | ROA | -0.0261*** | -0.0277*** | -0.0275*** | -0.0277*** | -0.0276*** | | | (0.00559) | (0.00577) | (0.00577) | (0.00579) | (0.00579) | | Zombie Dummy | | -0.139 | -2.062*** | -0.139 | -0.141 | | | | (0.124) | (0.616) | (0.124) | (0.124) | | Zombie Dummy × WACR | | | 0.291*** | | | | | | | (0.0914) | | | | BR | | | | -0.000781 | -0.0437 | | | | | | (0.0166) | (0.0344) | | BR × WACR | | | | | 0.00656 | | | | | | | (0.00460) | | Constant | 10.06*** | 10.06*** | 10.15*** | 10.06*** | 10.31*** | | | (0.457) | (0.457) | (0.458) | (0.465) | (0.498) | | N | 26183 | 26183 | 26183 | 26183 | 26183 | | Overall R2 | 0.00992 | 0.0101 | 0.0104 | 0.0100 | 0.00993 | | Firm fixed effect | Yes | Yes | Yes | Yes | Yes | | Year fixed effect | No | No | No | No | No | | Standard errors in parentheses. * p < 0.1, ** p < 0.05, *** p < 0.01. Source: Authors’ estimates. |
| Table 4: Sensitivity of Bank Borrowings to Changes in Cost of Funds | | | (1) | (2) | (3) | | log(Bank Borrowings) | log(Bank Borrowings) | log(Bank Borrowings) | | Cost of funds | -0.0148*** | -0.0149*** | -0.0160*** | | | (0.00188) | (0.00188) | (0.00194) | | Zombie Dummy | 0.367*** | 0.436*** | 0.299*** | | | (0.0250) | (0.0298) | (0.0701) | | LAF Dummy | 0.0259** | 0.0387*** | 0.0384*** | | | (0.0113) | (0.0117) | (0.0117) | | Zombie Dummy × LAF Dummy | | -0.199*** | -0.146*** | | | | (0.0470) | (0.0472) | | Zombie Dummy × Cost of funds | | | 0.0125** | | | | | (0.00567) | | Constant | 6.735*** | 6.732*** | 6.743*** | | | (0.0208) | (0.0208) | (0.0214) | | N | 17607 | 17607 | 17607 | | Overall R2 | 0.00340 | 0.00418 | 0.00471 | | Firm fixed effect | Yes | Yes | Yes | | Year fixed effect | No | No | No | Standard errors in parentheses. * p < 0.1, ** p < 0.05, *** p < 0.01.
Source: Authors’ estimates. |
| Table 5: Sensitivity of Investment to Changes in Bank Borrowings | | | (1) | (2) | (3) | | Investment | Investment | Investment | | Long-term bank borrowings | 162 × 10-8*** | 181 × 10-8*** | | | | (367 × 10-9) | (379 × 10-9) | | | Zombie Dummy | -0.0112*** | -0.00823** | -0.0108** | | | (0.00309) | (0.00343) | (0.00534) | | ROA | 631 × 10-6*** | 626 × 10-6*** | 731 × 10-6*** | | | (161 × 10-6) | (161 × 10-6) | (158 × 10-6) | | Long-term bank borrowings × Zombie Dummy | | -132 × 10-8** | | | | | (662 × 10-9) | | | Long-term bank borrowings / total bank borrowings | | | 423 × 10-6*** | | | | | (391 × 10-7) | | Long-term bank borrowings / total bank borrowings × Zombie Dummy | | | 220 × 10-6 | | | | | (102 × 10-6) | | Constant | 0.0839*** | 0.0839*** | 0.0691*** | | | (0.0140) | (0.0140) | (0.0135) | | N | 17259 | 17259 | 15788 | | Overall R2 | 0.0178 | 0.0176 | 0.0600 | | Firm fixed effect | Yes | Yes | Yes | | Year fixed effect | Yes | Yes | Yes | Standard errors in parentheses. * p < 0.1, ** p < 0.05, *** p < 0.01.
Source: Authors’ estimates. |
|