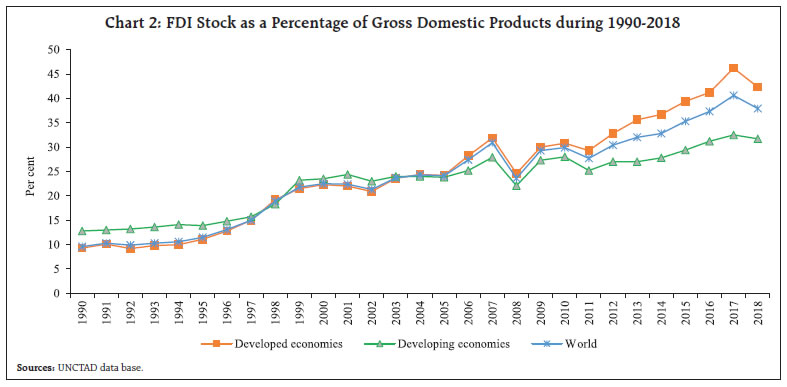
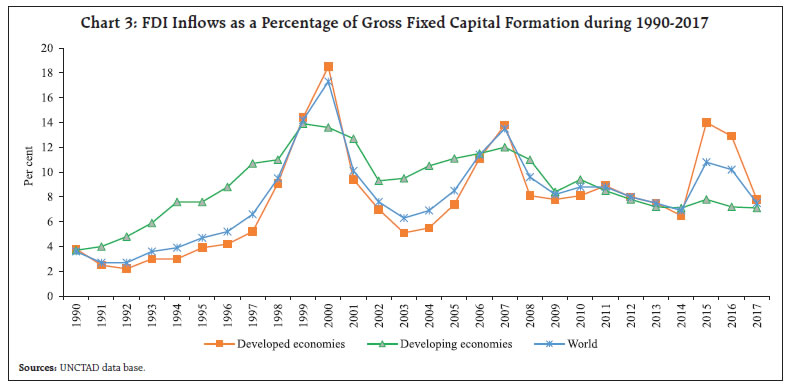
Foreign Direct Investment (FDI) is a stable means of financing capital requirements of a growing economy and both developed and emerging economies have made major efforts for augmenting the information base on FDI at market value. In India, major advancements have been made in this regard with the implementation of the Co-ordinated Direct Investment Survey (CDIS) of the International Monetary Fund (IMF) and compilation of Foreign Affiliate Trade Statistics (FATS). The empirical results from the analysis of key factors influencing FDI inflows indicate that trade openness, economic growth, market size, labour cost and capital account openness of the host countries are major determinants of FDI flows. I. Introduction Foreign investment plays a significant role in the development of any economy in the world. It supports economic growth by meeting the investment requirements of a capital deficit economy by bridging its saving-investment gap. Many foreign investors bring new technology, best practices and governance along with financial capital which leads to skill transfer and productivity gains. While new business can generate employment, greater competition from new companies can also improve efficiency in the host country. Foreign investment, a component in a country’s national financial accounts, can come through equity and debt. It is associated with investor’s lasting management interest in the recipient economy and, therefore, is a more stable component. While foreign portfolio flows remain important for financing current account deficit, many countries give attention and incentives for FDI, both in general as well as in selective sectors. This article focusses on inward FDI component of capital stock for India which has risen from US$ 1.7 billion in 1990 to over US$ 427.0 billion in 2019. We also discuss the availability of consistent data for use in analysis, its limitations including the valuation issues and comparison of statistics generated by partner countries. The remainder of the article is organised in five sections. Section II presents a summary of evolution of FDI policy in India since independence. Development of global capital flows and trends in inward FDI for India are discussed in Section III. The CDIS initiative, FDI information base and the valuation issue of FDI investment based on Indian data are discussed in Section IV. Section V presents empirical analysis of the factors influencing inward FDI by taking into consideration major countries in terms of their FDI stocks at market value in India using panel regression analysis. Conclusions are presented in Section VI. II. Evolution of FDI Policy in India – A Brief In 1948, when the first survey of India’s international assets and liabilities was undertaken by the Reserve Bank of India (RBI), the stock of foreign investment in the country stood at ₹256 crores, flowing largely from the UK and the bulk of it was in natural resource seeking and trading. Soon after independence, India embarked on a strategy of import substituting industrialisation in the development planning framework. By March-1950, the industrialisation strategy pivoted to the development of local capability in heavy industries including the machinery manufacturing sector. Limitation in expansion of domestic technology, skills, entrepreneurship and the foreign exchange crisis of 1957-58 led to further liberalisation in the government’s attitude towards FDI. The government issued a list of industries in 1961 where foreign investments were to be welcomed, taking into account the gaps in capacity in relation to plan targets. FDI stock in the country more than doubled to ₹566 crores in 1964 from ₹256 crores in 1948 and increased further to ₹916 crores in March 1974 (Hooda, 2011). Creation of locational advantages led to a sharp jump in the share of manufacturing in the FDI stock to over 40 per cent from around 20 per cent at the time of independence and covered consumer, intermediate and capital goods. The Foreign Investment Board was formed in 1968 to deal with all cases involving foreign investment or collaboration with up to 40 per cent foreign equity and a Cabinet Committee was formed to screen those with more than 40 per cent foreign ownership. By 1985, India started facing balance of payments problems. The problem worsened in 1991 owing to a number of issues, such as the withdrawal of non-resident Indian (NRI) deposits, outflows of short-term capital from banks and waning of export performance. As a part of the subsequent macro-economic stabilisation and structural adjustment programme, the Indian Rupee was devalued and a New Industrial Policy (NIP) was announced in July 1991. The NIP and subsequent policy amendments liberalised the industrial policy regime in the country especially as it applies to FDIs. This included abolition of industrial approval system in all industries other than strategic or environmentally sensitive industries, automatic approval of 51 per cent FDI in 34 high priority industries, doing away with mandatory technology transfer agreements, setting up of Foreign Investment Promotion Board (FIPB), etc. New sectors such as mining, banking, telecommunications, highways construction and management were opened to private, including foreign owned companies. During the last decade, India focused on increasing FDI inflows and introduced a comprehensive FDI liberalisation strategy. During 2015, FDI rules were relaxed in 15 major sectors which include agriculture, civil aviation, construction, defence, manufacturing and mining. In 2016, direct investment regulations were amended further to encourage foreign investment in start-ups and liberalise the investment regime for foreign venture capital investors. During 2019, restrictions on foreign investment in single-brand retail trading, airlines and power exchanges were relaxed. In the beginning of 2020, FDI policy for e-commerce was liberalised in order to safeguard the interests of domestic offline retailers. III. Global Capital Flows and Inward FDI for India The FDI has progressed faster than global trade over the past few decades. While the developed economies continued to be most financially integrated under massive policy support from key central banks since 1990, more developing countries have meanwhile liberalised their financial systems and direct investment policies. As a result, FDI flow accelerated rapidly since the early 1997 until the financial crisis of 2007-2008. During 2009, a wave of inflows was observed, followed by another surge in FDI inflows from 2010 due to worsened European debt crisis. In 2014, a surge in cross-border mergers and acquisitions (M&A) amounting to US$721 billion from US$432 billion led to the global rebound of the direct investment flows. FDI flows, however, continued to decline in developed countries and economies in transition from 2017 mainly due to lifting of tax liabilities on accumulated foreign earnings. FDI flows in the developing countries remained stable thereby increasing their share in global FDI to 54 per cent in 2018 from 46 per cent in 2017. However, despite the slowdown in FDI since 2017, the US remained the largest recipient of FDI, followed by China, Hong Kong and Singapore. FDI inward stock remains substantial as a percentage of GDP for developing countries and developed countries (Chart 1 & 2). The FDI flows to developing countries soared during the 2000-2018 period. As a result, their FDI flows turned out to be higher than developed countries and attracted more than half of global FDI flows. Inward FDI stocks of developing countries during 1990-2018 constituted 24.6 per cent of their GDP, as compared to 22.7 per cent in developed countries. FDI inflows during 1990-2017 represented an average share of almost 9 per cent of gross fixed capital formation in developing countries, compared to 8 per cent in developed countries (Chart 3). Top ten performers among developing countries and developed countries, measured by inward FDI flows from 2000 to 2018 provide the different dimensions of developing and developed countries’ attractiveness to FDI (Table 1 & 2). Among the developing countries, China is the highest recipient of FPI, possibly due to cheap onshore money-market instruments as compared to most of the other developing countries. US, on the other hand, remained the largest recipient of FPI due to its innovative and sustainable capital market which attracts portfolio investors across the world. 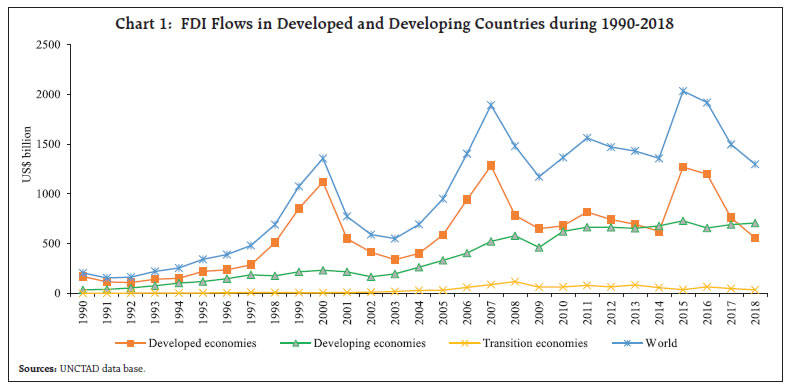
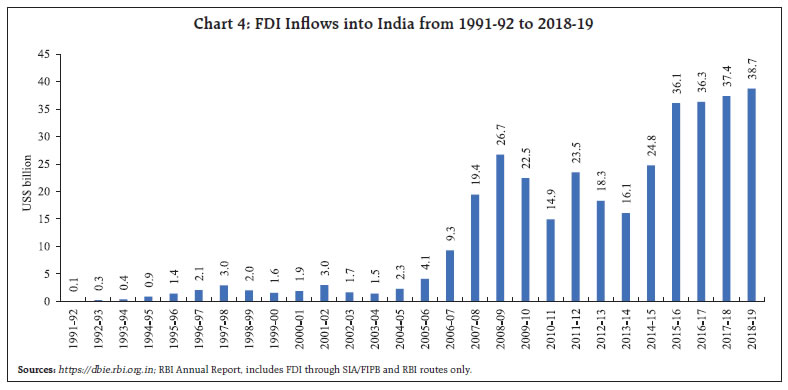
 In the last decade of 20th century, India witnessed a drastic increase in foreign direct investment, accompanied by a marked change in the policy stance of the Government. In 1991, a series of policy measures were announced to liberalise and strengthen the FDI environment in the country. As a result, FDI inflows to India rose manifold from US$ 2.0 billion in 1998-99 to over US$ 26.7 billion just before the crisis in 2008. The global financial crisis (2008) impacted GDP growth and FDI flows worldwide and India was not an exception. FDI inflows to India moderated till 2013-14. In 2013, the annual rate of GDP growth slowed down to 4 per cent, and the current account deficit reached nearly an unprecedented level of 5 per cent of GDP. These macroeconomic uncertainties exacerbated foreign investors’ concern to invest in India. Amidst high inflation and other macroeconomic issues, India witnessed a drop of FDI flows from 2012-13 to 2013- 14. During September 2014, the Government of India launched the ‘Make in India’ initiative to facilitate investment, foster innovation and build best in class manufacturing infrastructure. The reform made a positive foreign investment climate in India and helped in increasing growth in FDI inflows mainly due to strong investment in top three industry recipients viz., ‘manufacturing’, ‘communication’ and ‘financial services’. FDI inflows into India demonstrate increasing trend during 2014-15 to 2018-19 (Chart 4). | Table 1: Top 10 FDI - Source Economies of Developing Countries in 2018 and FPI Inflows in 2018 | | Economy | (US$ billion and Per cent of GDP) | US$ billion | | FDI Inflows | Per cent of GDP | Portfolio Inflows | | 2018 | Average Growth (Per cent) 2000-18 | 2018 | Average Share in GDP (Per cent) 2000-18 | 2018 | Average Growth (Per cent) 2000-18 | | China | 139.0 | 10.6 | 1.7 | 3.2 | 60.7 | 1.2 | | China, Hong Kong SAR | 115.7 | 48.4 | 26.8 | 29.4 | -2.4 | 0.3 | | Singapore | 77.6 | 42.6 | 24.4 | 19.3 | -3.7 | -0.5 | | Brazil | 61.2 | 25.1 | 4.1 | 3.3 | -3.1 | -0.2 | | Cayman Islands | 57.4 | 26.4 | N.A | N.A | N.A | N.A | | British Virgin Islands | 44.2 | 11.1 | N.A | N.A | N.A | N.A | | India | 42.3 | 35.7 | 1.6 | 1.6 | -4.4 | -0.2 | | Mexico | 31.6 | 11.8 | 3.2 | 2.8 | 2.4 | -0.4 | | Indonesia | 22.0 | 13.0 | 1.8 | 1.2 | -3.7 | -1.4 | | Vietnam | 15.5 | 24.7 | 6.3 | 5.5 | N.A | N.A | | Sources: FDI Inflows from UNCTAD data base; Portfolio Inflows from World Development Indicator and FDI Inflows as per cent of GDP from OECD. |
| Table 2: Top 10 FDI - Source Economies of Developed Countries in 2018 and FPI in 2018 | | Economy | (US$ billion and Per cent of GDP) | US$ billion | | FDI Inflows | Per cent of GDP | Portfolio Inflows | | 2018 | Average Growth (Per cent) 2000-18 | 2018 | Average Share in GDP (Per cent) 2000-18 | 2018 | Average Growth (Per cent) 2000-18 | | United States of America | 251.8 | 14.2 | 1.3 | 1.8 | 142.4 | 0.7 | | Netherlands | 69.7 | -7.0 | 7.2 | 25.2 | -54.0 | -0.3 | | United Kingdom | 64.5 | 25.8 | 2.8 | 4.6 | 5.6 | 0.5 | | Australia | 60.4 | 78.6 | 4.3 | 3.5 | -7.1 | 0.1 | | Spain | 43.6 | 39.3 | 3.5 | 3.2 | -15.6 | 0.6 | | Canada | 39.6 | 6.2 | 2.7 | 3.3 | 20.1 | -0.2 | | France | 60.4 | -18.0 | 2.1 | 2.1 | -20.7 | 0.4 | | Germany | 37.3 | -11.5 | 4.3 | 2.1 | -42.0 | -0.6 | | Italy | 25.7 | -20.5 | 1.9 | 1.2 | -5.4 | -0.5 | | Israel | 24.3 | 28.7 | 5.6 | 3.8 | -8.3 | -2.0 | | Sources: FDI Inflows from UNCTAD data base; Portfolio Inflows from World Development Indicator and FDI Inflows as per cent of GDP from OECD. |
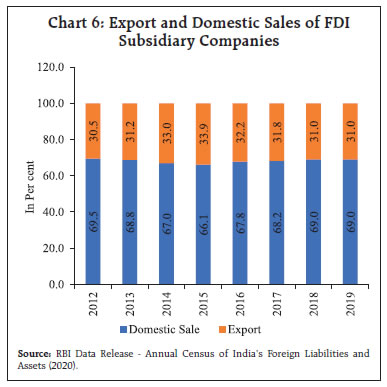
| Table 3: Share in Cumulative FDI Inflows to India (2015-2019) | | Country | Cumulative Inflows (%) | | Singapore | 27.7 | | Mauritius | 27.0 | | USA | 7.5 | | Netherlands | 7.5 | | Japan | 7.0 | | Total | 76.7 | | Source: RBI Annual Report (2018-19), includes FDI through SIA/FIPB and RBI routes only. | During 2015 to 2019, India received a cumulative FDI inflow to the extent of US$ 173.3 billion and the share of top five investing countries in India stood at 76.7 per cent. Singapore and Mauritius together accounted for more than half of total foreign investment in India with Singapore having the highest share of 27.7 per cent in total cumulative FDI flows (Table 3). Three major sectors viz., ‘manufacturing sector’, ‘communication services’ and ‘financial services’ together accounted for more than 50 per cent share in FDI inflows amounting US$ 89.6 billion during 2015-2019 (Chart 5). IV. FDI Information Base and CDIS India’s first census of Foreign Liabilities and Assets (FLA) was conducted in 1948, where the information was collected under the International Monetary Fund and Bank Act, 1944. Data were compiled at different intervals in the subsequent period. Since 1997, reporting was annual, but participation was not mandatory up to 2010. From 2010-11, reporting was made mandatory for the Indian companies which have received FDI and/or made Overseas Direct Investment (ODI). This enabled India to participate in CDIS of IMF since 2010 round. The CDIS data (both inward and outward direct investment) of India at market prices, cross-classified by country of direct investment, published by IMF on annual basis are now available for use of researchers and analysts. The FDI companies started submitting detailed data on FDI and /or ODI data as part of the Reserve Bank’s Annual FLA census since 2012-13. The information on Foreign Affiliate Trade Statistics (FATS) i.e., exports, imports, domestic sales and purchases of subsidiaries of foreign companies are also collected simultaneously. 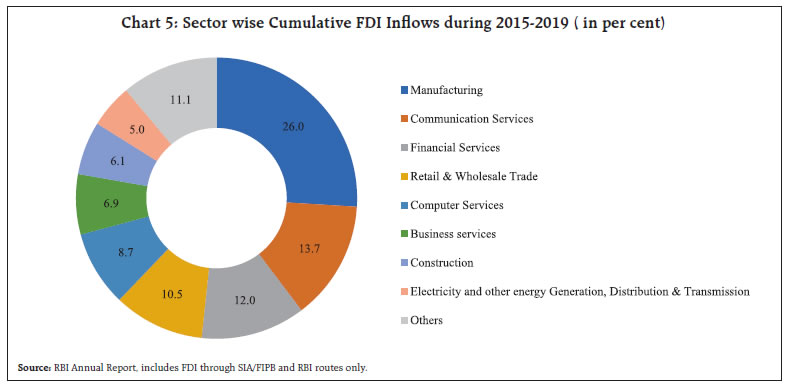 The census on FLA of Indian direct investment companies (2018-19) shows that nearly 95 per cent of the total FDI stock (₹32,92,902 crores at market value in March 2019) was held in equity. At the aggregate level, FDI share in total equity at face value of responding companies was over 81 per cent as nearly three-fourth of the companies that reported inward direct investment were Indian subsidiaries of foreign companies. With increasing globalisation, Indian companies are more outward-looking and making overseas investment with lasting interest. The ratio of outward to inward direct investment of India is estimated to be around 18 per cent in both the year March 2018 and 2019. Over 96 per cent of the companies, which reported inward direct investment, were unlisted and they estimated the share of non-resident equity holding in the net worth of the company using own-fund book value (OFBV) method of equity investment, prescribed by IMF. The FLA database captures the stock of equity both at face value as well as at market value. As on end March 2019, the share of manufacturing sector in total FDI equity stake of FDI companies stood at 46.2 per cent at face value and 53.3 per cent at market value due to difference in the ratio of market value to face value of equity across sectors (Table 4). The ratio of market value of FDI companies’ equity to face value stood at 5.1 in March 2019 at aggregate level but it varied from 2.1 to 11.9 across sectors. The reason for the same could be several factors including corporate profitability, medium-term growth and potential growth. The high correlation of 0.9 between face value and market valuation suggests that these factors have influence in equity across sectors (Table 5). As per FLA census 2018-19, around 75 per cent of the inward FDI reporting companies were FDI subsidiaries which have reported activity wise inward FAT statistics. A major portion of the business of FDI subsidiaries mainly concentrated in the domestic market. The share of export of FDI subsidiaries in total sales accounted for 31.8 per cent on an average during 2012-2019 (Chart 6). ‘Information and communication services’ remained the major export-oriented sector during 2018-19. The foreign subsidiaries largely depend on Indian domestic market for procurement of raw materials, parts etc. (Table 6 & Chart 7). | Table 4: Sector-wise Equity Participation of FDI Companies: March 2019 | | (₹ Crore) | | Activity | Total Equity (Including Resident & Non-Resident) | FDI Equity Stake | | At Face Value | At Market Value | | 1. Agriculture-related, Plantations & Allied activities | 1,838 | 1,698 | 7,060 | | 2. Mining | 1,657 | 1,390 | 6,456 | | 3. Manufacturing | 3,21,314 | 2,81,560 | 16,64,304 | | 4. Electricity, gas, steam and air conditioning supply | 47,545 | 27,136 | 59,016 | | 5. Water supply; sewerage, waste management and remediation activities | 1,996 | 1,792 | 2,745 | | 6. Construction | 25,160 | 19,647 | 41,009 | | 7. Information and communication | 58,874 | 45,448 | 5,41,385 | | 8. Other Services | 2,92,143 | 2,30,651 | 799410 | | Total | 7,50,527 | 6,09,322 | 31,21,385 | | Source: RBI Data Release - Annual Census of India’s Foreign Liabilities and Assets (2020). |
| Table 5: Equity Ratio (Market Value to Face Value), GDP Growth: Sector-wise | | | Ratio of Market Value to Face Value | Average Real GDP Growth (2000-19) | | 1. Agriculture-related, Plantations & Allied activities | 4.2 | 3.2 | | 2. Mining | 4.6 | 4.2 | | 3. Manufacturing | 5.9 | 7.5 | | 4. Electricity, gas & Water supply | 3.7 | 6.6 | | 5. Construction | 2.1 | 6.6 | | 6. Information and Communication | 11.9 | 18.3 | | 7. Other Services | 3.5 | 8.3 | | Total | 5.1 | 7.0 | | Sources: RBI Press Release (2020) and CSO data. |
 CDIS is a worldwide statistical data collection effort to bridge information gaps in cross-border investment led by the IMF. It is designed to improve both the availability and quality of FDI data, both overall and by immediate counterpart economy. In CDIS, countries voluntarily report their calendar-year-end direct investment position by immediate counterparties broken down between equity and debt at market value. The changes in market valuation of outstanding foreign liabilities and assets are different from the corresponding Balance of Payments (BoP) flows during a year, as the former includes valuation changes too. | Table 6: Activity wise share of total FDI at Market Value and total Export : 2018-19 | | Sl. No. | Activity | Share of Total FDI at Market Value (Per cent) | Share of Total Export (Per cent) | | 1 | Information and communication | 16.7 | 45.5 | | 2 | Financial and insurance activities | 14.0 | 1.4 | | 3 | Motor vehicles, trailers and semi-trailers | 6.9 | 7.2 | | 4 | Other Services activities | 5.2 | 10.7 | | 5 | Food products | 4.7 | 0.8 | | 6 | Chemicals and chemical products | 4.0 | 1.6 | | 7 | Machinery and equipment n.e.c. | 3.6 | 3.4 | | 8 | Pharmaceuticals, medicinal and chemical products | 3.5 | 3.0 | | 9 | Wholesale and retail trade; repair of motor vehicles and motorcycles | 3.2 | 7.6 | | 10 | Others | 38.2 | 18.8 | | Total | 100.0 | 100.0 | | Source: RBI Data Release - Annual Census of India’s Foreign Liabilities and Assets (2020) |
 Since all CDIS-participating countries report partner country-wise direct investment (inward or outward or both), an exercise is carried out to verify the stock position of inward direct investment from top nine source countries which together account for 78.9 per cent of FDI stock in India as per FLA census results March 2019. USA had the largest share (17.8 per cent) in total FDI stock in March 2019 (Table 7). It is worth mentioning that the stock of FDI, reported by investing and invested countries differ in many cases due to various reasons and cannot be attributed only to 3-months difference in reference date alone. The difference can also be on account of estimation methodology (census vs. surveys) on coverage of investor/invested firms, accounting and valuation issues, reporting errors, etc. | Table 7: Source Country-wise FDI at Market Value | | Country | FDI in India (₹ Crore) | | As per FLA Census results (March’19) | Reported by Partner Country in CDIS (December’18) | | USA | 5,84,978 | 3,20,933 | | United Kingdom | 5,17,369 | 1,28,814 | | Mauritius | 5,09,914 | 8,79,038 | | Japan | 2,82,724 | 1,69,877 | | Netherlands | 2,50,491 | 1,76,888 | | Germany | 1,63,773 | 1,95,789 | | Switzerland | 1,59,576 | 44,273 | | Republic of Korea | 79,578 | 42,646 | | France | 48,135 | 44,199 | | All the above countries | 25,96,538 | 20,02,456 | | Singapore | 4,13,174 | Not Reported | | Other countries | 2,83,190 | All Not Reported | | All Countries | 32,92,902 | All Not Reported | | Sources: RBI Data Release (2020) and IMF web-site http://cdis.imf.org | V. Empirical Analysis of Factors Influencing FDI flows In this section, we present results of a panel exercise to determine the key factors influencing FDI inflows in the major partner countries which have substantial portion of FDI stock in India. The data set comprises observations for the period from 2009-10 to 2017-18 for these major economies viz., USA, UK, Mauritius, Japan, Netherlands, Germany, Switzerland, Republic of Korea, France and India. The entire dataset has been sourced from the Global Development Finance, published by the World Bank, IMF, the Organisation for Economic Cooperation and Development (OECD) and World Bank database. The FDI flows have been measured as FDI inflows to GDP ratio and regressed over a range of explanatory variables. Drawing from the literature review, some of the variables that have been considered to influence the FDI flows are: market size (PPP), trade openness (OPEN), exchange rate (ER), labour participation rate (LABOR), tax revenue to GDP (TAX_GDP), macroeconomic sustainability (GFD_GDP) and capital account openness index (KA_OPEN) of the selected countries. Market size is defined as GDP in purchasing power parity (PPP) terms i.e. GDP per capita based on purchasing power parity (PPP). Trade openness has been defined as sum of current receipts and payments to GDP ratio. Low labour costs and tax rates in a country have a positive impact on FDI (Bayraktar, 2013). The variable considered here is the rate of labour force participation which is described as the proportion of the population of ages 15-64 that is economically active in supplying labour for the production of goods and services during a specified period. FDI would also depend to a significant extent on the exchange rate movements and GDP growth rate of the host economy (Cevis and Camuran, 2007). Accordingly, GDP growth (GDP_GROWTH) has also been considered as independent variable. Results show that the influence of financial openness (refers to the process of easing capital control) on FDI is far more direct than that of development of the financial market. The improvement of financial openness may significantly increase FDI in the host country. The Chinn-Ito index, a measure of the country’s degree of capital account openness, introduced in Chinn and Ito (2006) has been considered as an independent variable. The index (KA_OPEN) is constructed based on a number of binary dummy variables that quantify the tabulation of restrictions on cross-border financial transactions reported in the IMF’s Annual Report on Exchange Arrangements and Exchange Restrictions (AREAER). Higher values of this index imply that the more open the country is to cross-border capital transactions. The value of KA_OPEN index ‘1’ represent that the country is fully open on cross-border financial transactions and expect higher FDI inflows. The fiscal sustainability, captured through Gross Fiscal Deficit (GFD) of central government finances to GDP ratio has also been taken as one of the explanatory variable. The study considered panel fixed effects1 regression model and the equation is as follows: 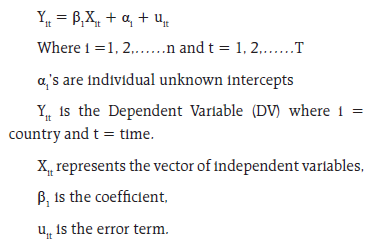 The Hausman test suggests that Panel fixed effect model would be appropriate and Panel fixed effect regression equation was estimated for 10 countries (n=10) and 9 years (T=9) for the period 2010 to 2018. As per expectations, the coefficients of the pull factors (variables) viz., trade openness, growth rate, labor participation rate and the index of capital account openness (KA_OPEN) were found to be positive and statistically significant. Similarly, market size captured through per capita GDP of host countries in PPP terms was also found to be positively impacting FDI flows. However, the exchange rate, GFD to GDP ratio (which capture fiscal sustainability) and tax to GDP ratio were found to be statistically insignificant though their signs were as per prior expectations. The panel result shows that higher degree of openness, growth of the economy, larger market size, substantial labor participation are among the key factors which attract FDI inflows to the host country. Further, higher degree of capital account openness of the country may also play a significant role in attracting more FDI flows (Table 8). | Table 8: Results of Panel Fixed Effect Estimation | | Variable | Coefficient | Std. Error | t-Statistic | Prob. | | C* | 154.505 | 42.762 | 3.613 | 0.0007 | | PPP** | 0.002 | 0.001 | 2.182 | 0.0336 | | OPEN* | 0.935 | 0.246 | 3.798 | 0.0004 | | GDP_GROWTH** | 2.950 | 1.380 | 2.137 | 0.0373 | | LABOR* | 2.816 | 0.956 | 2.946 | 0.0030 | | KA_OPEN* | 3.613 | 1.084 | 3.334 | 0.0022 | | ER | -0.058 | 0.051 | -1.145 | 0.2575 | | GFD_GDP | -0.728 | 1.046 | -0.696 | 0.4893 | | TAX_GDP | -0.247 | 0.767 | -0.321 | 0.7491 | | R2 = 0.87 Adj R2 = 0.82 | D.W stat. = 1.7 | | * Significant at 1% level ** Significant at 5% level. | VI. Conclusion Over the period, a number of information bases on FDI Statistics for India have become available. Global concepts help in understanding the statistical methodologies that countries employ in compiling the statistics and the resultant statistics can be used for cross-country comparison. Of course, countries with liberal investment scheme experience major challenges in estimation of foreign investment. India’s FLA census, which is a part of global CDIS initiative has been a major step forward in this regard as it gives consistent annual data on face value as well as at market value of FDI in India based on complete enumeration. Differences in direct investment estimates as per the FLA census and as reported by the partner country in CDIS for major FDI source countries result from difference in reference date, coverage of investor/ invested firms, estimation methodology (census/ surveys), accounting and valuation issues, reporting errors, etc. Global statistical organisations like IMF, World Bank, OECD, UNCTAD, European Commission, etc. are involved in standardisation of concepts and methods to address such statistical discrepancies in cross-border statistics. An analysis of the recent trends in FDI flows at the global level and across regions/countries suggests that India has generally attracted higher FDI flows and continued to remain among the top attractive destinations for international investors in line with its robust domestic economic performance and gradual liberalisation of the FDI policy as part of the cautious capital account liberalisation process. The analysis on FLA census results summarised the interesting facets of sector-wise distribution of investment and related performance (FAT statistics) for foreign subsidiary companies. Foreign trade had a substantial share in the business where import intensity in purchase remained higher than export in sales for foreign subsidiary companies. An empirical analysis of factors influencing inward FDI, considering major countries in terms of its FDI stock position in India reflects that inward FDI is significantly influenced by the trade openness, economic growth prospects, market size, labour cost and capital account openness of the host countries. References 1. Cevis, I., and Camuran, B. (2007), “The economic determinants of Foreign Direct Investment in developing countries and transition economies”, The Pakistan Development Review, 46(3):285–299. 2. Chinn, Menzie D. and Hiro Ito (2006), “What Matters for Financial Development? Capital Controls, Institutions, and Interactions”, Journal of Development Economics, Volume 81, Issue 1, Pages 163-192 (October). 3. Division of International Trade and Finance of the Department of Economic and Policy Research, Reserve Bank of India (2010-11), “Foreign Direct Investment Flows to India”, https://rbidocs.rbi.org.in/rdocs/Content/PDFs/FDIST_110412.pdf. 4. Department for Promotion of Industry and Internal Trade, GoI, Press Note No. 1(2020 Series), “Review of Foreign Direct Investment (FDI) policy in Insurance Sector”. 5. Department for Promotion of Industry and Internal Trade, GoI, Press Note No. 2(2020 Series) “Review of Foreign Direct Investment (FDI) policy on Civil Aviation: Review of Foreign Direct Investment (FDI) policy for curbing opportunistic takeovers/ acquisitions of Indian companies due to the current COVID-19 pandemic”. 6. International Monetary Fund (2008), “Balance of Payments and International Investment Position Manual”, Sixth Edition (BPM6). 7. International Monetary Fund (1992), “Report on the Measurement of International Capital Flows”,https://www.elibrary.imf.org/view/books/071/05673-9781557753076-en/05673-9781557753076-en-book.xml. 8. Ms. Sapna Hooda (2011), “A Study of FDI and Indian Economy, National Institute of Technology”, Kurukshetra, Deemed University, Kurukshetra, Haryana, India, https://nitkkr.ac.in/nit_kuk/docs/Sapna_Hooda_Thesis_A_Study_of_FDI_and_Indian_Economy.pdf. 9. Nihal Bayraktar (2013),” Foreign Direct investment and Investment Climate”, Pennsylvania State University-Harrisburg, USA. 10. Press Note No. 4(2019 Series), “Review of Foreign Direct Investment (FDI) policy on various sector”. 11. Reserve Bank of India, “Annual Census of India’s Foreign Liabilities and Assets”, RBI Bulletin, https://rbidocs.rbi.org.in/rdocs/Bulletin/PDFs/2AR_BUL10022014.pdfd and https://rbidocs.rbi.org.in/rdocs/Bulletin/PDFs/02AR_10041829F7F8EB034F4055ADE629893A9C0926.PDF. 12. Reserve Bank of India, Press Release (2020). “Finances of Foreign Direct Investment Companies 2018-19”. 13. UNCTAD/WIR, “World Investment Report”, https://unctad.org/publications-search?f[0]=product%3A397.
|