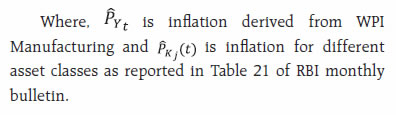
The article explores the patterns in return on physical capital (RoPC) in manufacturing sector using the firm level Annual Survey of Industries (ASI) data for 2017-18. The aggregate RoPC is estimated at 19.5 per cent which seems comparable to the returns observed in other developing countries. The government (public) firms showed marginally higher returns than their non-government (public) counterparts. However, the average return of Non-Government (private) entities is significantly higher than Government (private). Amongst the regions, the north-east outperforms others primarily due to Pharma industry in Sikkim and Petroleum industry in Assam. I. Introduction A key factor which spurs value creation and capital accumulation in manufacturing is the return on assets vis-à-vis the weighted average cost of capital (WACC). However, in reality, firms hold cash and cash equivalents to tide over financing constraints rather than investing in productive assets. In that case, it makes sense to exclude liquid assets from the total assets and focus on the return on fixed assets/physical capital for estimating the marginal product of capital (Sharma et al., 2019). Return on physical capital (RoPC) is an important variable which is factored in by firms while deciding the level of capital to be deployed in production. It is akin to a barometer which helps firms to ascertain whether they are over or under investing. Over-investment depresses the returns and if it falls below the cost of capital, the firm destroys value. At the same time, high returns signal the capital market to allocate more capital to that sector thereby enhancing value. According to McKinsey (2020) report, nearly 700 of the top 1,000 manufacturers in India produced returns to capital that were less than their cost of capital in 2018, thereby destroying value. In contrast, the sectors that generated healthier returns saw rise in capital investment during the four years from 2016 to 2019. In the neoclassical framework, the marginal product of capital would be equalised in equilibrium. However, in the real world many frictions exist which impede the free flow of capital. It has been found that different attributes of firms affect RoPC. The ownership pattern is often cited as one of the major factors which affect the RoPC of a firm. Overwhelming evidence suggests that private firms are more efficient than public firms (Arocena & Oliveros, 2012; Megginson & Netter, 2001; OECD, 2003, p35). Also, the performance of a firm generally improves with higher degree of private ownership. Apart from the ownership pattern of the firms, evidence suggests that age also affects RoPC. There is abundant literature on the variation of RoPC of firms with age stressing the role of Economic Darwinism1 and intangible capital2. Consequently, the RoPC of older firms is expected to be higher than younger firms. After a threshold, firms enter into a phase of terminal decline with diminishing RoPC and eventually cease to exist. The effect of size of the firm on RoPC has been discussed extensively in the literature and the results of these studies have been mixed (Tybout, 2000; Idson and Oi,1999; Beck et al., 2005). This study also attempts to investigate the relationship between the size of the firm and its RoPC. Regional variation in RoPC can have far reaching consequences on the flow of resources. Neo-classical theory predicts that capital will flow to hitherto low-income regions where RoPC is high owing to low capital intensity. Nonetheless, if developed regions exhibit high RoPC, inequality across regions may worsen further. On similar lines, efficient markets should channelise the capital from low-return to high-return manufacturing activities which is also investigated in this article. For our analyses, we use firm level data for the year 2017-18 published by Annual Survey of Industries (ASI), which is the principal source of industrial statistics for formal manufacturing sector in India. To the best of our knowledge, this is the first paper to examine the different attributes of firms and their relationship with RoPC using firm level ASI data. The rest of the article is divided into 5 sections. Section 2 reviews the literature related to survey findings on firm-level data. We discuss the nuances of data in Section 3 followed by methodology for our analysis in Section 4. Results are presented in Section 5. Finally, Section 6 lays out concluding remarks and policy implications. II. Literature Review In a cross-country analysis of return on capital (RoC), India’s RoC (measured as ratio of share of capital and capital to output ratio) averaged at 18.6 per cent through 1995-2007 period close to the level found in other emerging countries (18.1 per cent). However, India’s RoC was significantly higher than those of highly developed and transition economies which were at 12.8 and 10.8 per cent, respectively (Nan-Ting et al.,2015). In another study, the firm-level mean return on assets (ROA) for India was estimated at 11.3 per cent for the period 1997-2014. In perspective, the average returns for developing and developed countries were found to be 10.8 and 7.8 per cent, respectively (Chari A et al., 2020). ROA (calculated as the ratio of EBIDTA3 to market value of assets of the firm) was used as a measure of the marginal product of capital. The dollar weighted return in US dollars and local currency has been estimated for India to be around 13.9 per cent in local currency as against that of the average return of 12.4 and 8.3 per cent for developing countries and developed countries respectively (Lingxia et al., 2019). In the international context, a study on China shows that return on physical capital has decreased from 1998 levels but is still comparable to the rest of the world, even though the investment rates have been high in China. The aggregate returns hovered around 20 per cent in 2005 (Bai et al., 2006). In Ethiopia, there is a higher annual median return to capital in the informal sector (52–140 per cent) than the formal sector (15–21 per cent (Siba, 2015). On similar lines, a study of formal manufacturing sector of five African countries showed the annual median return to be around 22 per cent (Bigsten et al., 2000). Taking into cognizance the wide variation in RoPC, many studies have investigated into the factors responsible. Many studies have reported that the financial performance of the firms improves as they grow old due to accumulation of intangible capital like organisational capital, R&D stocks etc., with time (Atkeson and Kehoe 2005; Hsieh and Klenow 2014). ‘Economic Darwinism’ is another channel which facilitates this process where the inefficient firms are forced to exit and only the efficient firms grow old (Jovanovic, 1982). This leads to improvement in returns on capital for older cohorts owing to survival bias. Another important factor that has a profound effect on performance of firms is the type of ownership. Ownership structures have been extensively debated in the literature and post great depression, government ownership was overwhelmingly favoured against the laissez faire. However, with the mounting evidence of the failure of state-owned enterprises across the world, there emerged a palpable impetus for privatisation. In the process, many different types of ownership structures with varying degrees of private ownership emerged. There is ample literature pointing towards improved efficiency on account of privatisation subject to additional factors (UNDP, 2015; Mathur, 2007; Gupta, 2005; Djanko, 2002; Frydman, 1999). As regards impact of firm size on RoPC, academic literature is divided. The argument that the returns should increase with the size of the firm is due to economies of scale. Many studies have found a positive relation between firm size and its performance (Doğan, 2013; Asimakopoulos et al. ,2009; Lee ,2009; Alsawalhah, 2012; Akbas, 2012; Ghafoorifard et al.,2014; Kipesha, 2013; Enofe ,2013, Vijayakumar and Tamizhselvan, 2010; Pervan and Višić, 2012). However, some studies have found contrary results (Becker et al., 2010; Salawu, et al., 2012; Banchuenvijit, 2012). III. Data ASI data consist of manufacturing firms in the formal sector that are registered under the Factories Act 1948 i.e., which employ more than 20 persons in firms with power and 40 persons for firms operating without power. In this study, we consider the latest firm level ASI data which is available for year 2017-18. The National Statistical Office (NSO) publishes firm level data organised across 14 blocks (A to N) (Annex A1). The processed dataset obtained after joining all the blocks consists of around 41,400 firms from all over India (See Chart 1). After gross value addition (GVA) calculations on this subset, all factories barring around 1600 entities were found to have positive GVA4. Fifty-five per cent of the firms were found to be located in urban areas while the rest were in rural hinterlands. Following the new limits on turnover and investment in plant and machinery as advised in MSME Act 2020, we also classify the firms into Micro, Small, Medium and Large categories. We find the dataset to be a heterogeneous mix of factories with number of firms ranging between 4700 to 15600 in each category. 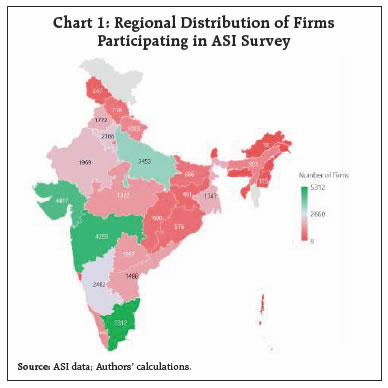 The locations of the firms are also classified into regions for a zonal analysis. The dataset is a mix of old and new firms with varying labour, capital and turnover (See Chart 2). As the capital and GVA variables range over a wide spectrum, it necessitates a logarithmic transformation to render a meaningful probability density function. IV. Methodology Several methods can be used to measure return to capital. The return to capital in financial markets may be used as a proxy for estimating aggregate return to capital. This method would be plausible in countries having well-developed financial markets, however, this is not so in the Indian context. Alternatively, return to capital can be estimated by regressing output on a measure of the capital stock. However, this method would produce biased estimates of the return to capital, since the capital stock is bound to be affected by omitted variables that also affect aggregate output. The method used in this article is quite simple in the sense that it is based on only one assumption and one accounting identity (Chong-En Bai et al., 2006). Consider a decision by a firm at the margin to purchase a unit of capital for use in production. If it is assumed that the firm takes the output price as given, the nominal return from this transaction is 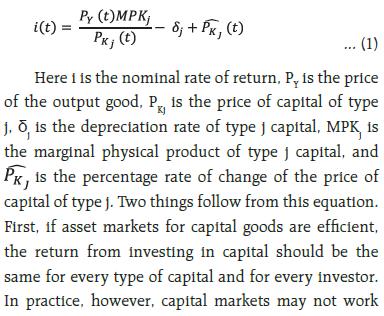

 ASI provides the details of capital units by asset types. Different asset types have different useful lives. Following the RBI KLEMS manual, we have assumed 80 years of lifetime for buildings, 20 years for transport equipment, and 25 years for machinery and equipment. For Information and Communication Technology (ICT) assets, the useful life of 5 years has been assumed. Accordingly, using double declining balance rate; depreciation rate of 2.5 per cent, 10 per cent, 8.0 per cent and 40 per cent has been assigned to buildings, transport equipment, machinery and equipment and ICT assets respectively. Zero depreciation for land has been assumed. V. Empirical Findings a. Type of Organisation ASI defines an organisation as public limited company where number of shareholders is at least 7 and there is no upper limit for number of shareholders. On the other hand, private limited companies have number of shareholders between 1 and 200. Private firms are not listed on the exchange whereas public firms may or may not be listed on the exchange. It is emphasised that, in this context, public does not mean government firms as is used in common parlance. As opposed to the popular narrative, RoPC of the public manufacturing firms – both Government and non-Government, is nearly equal to 17 per cent (Chart 3)5. In fact, the Government (public) firms have slightly higher returns at 17.7 vis-à-vis 17.3 per cent of the non-government (public) firms. The existence of large number of shareholders acts as a check on political interference that would adversely impact the valuation of the company. Management becomes more focused on commercial performance when subject to continuous monitoring by analysts and comparison with peers. 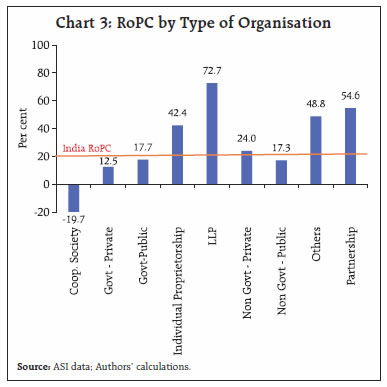 However, the story changes when we compare government (private) with non-government (private) entities. The RoPC of government (private) is 12 per cent whereas it is significantly higher at 24 per cent for the non-government (private) firms. The low return on government (private) is on expected lines since these firms are generally engaged in strategic sectors where profitability is not the primary motive. Also, the government tends to divest the more profitable firms first as they command higher value in the capital markets. Nevertheless, the share of government (private) is very small in manufacturing sector with less than 1 per cent of total value added. Over eighty per cent of value addition takes place in non-government (public) and non-government (private) companies. A noteworthy observation is the higher RoPC of non-government (private) firms vis-à-vis non-government (public) across all firm sizes. Higher returns of unlisted firms vis-à-vis listed firms has been corroborated by many studies (Mikkelson et al.,1997; Rutto, 2013; Kuria, 2014; Pastusiak et al., 2016; Sarkar et al., 1998; Sharma et al., 2019). It is argued that separating management from ownership creates principal-agent problem which leads to agency costs. The agents’ decisions may not be geared to maximise the welfare of the Principal. Moreover, listing of firms imposes additional compliance burden, restrains the decision-making and increases tax burden. Cooperative sector in Indian manufacturing exhibited negative returns to capital due to total emoluments paid to the employees exceeding the GVA in this particular year. The high emoluments in the cooperative sector may not come as a surprise since the orientation of the cooperatives is towards maximising welfare of members and quite often the owners of the cooperative firms work in the same firm (McKillop et al., 2020). Moreover, in the cooperative sector, remuneration is often out of alignment with the performance. b. Variation with Size of the Firm Returns on physical capital yield an inverted U – shaped curve with size of the firm (as defined in the MSME Act 2020) [See Chart 4]. The monotonous increase in returns from micro to small to medium enterprises can be attributed to rising productivity of firms with size and higher economies of scale. However, as the asset size of the firms increases, its ability to raise low-cost capital from formal institutional sources also increases. The easing of financial constraints encourages more investment, which helps bigger firms become more capital intensive, thereby leading to diminishing marginal returns. Similar results were obtained when number of persons employed was taken as the metric for size (Chart 5). c. Activity-wise RoPC Manufacture of tobacco products, computer, electronic and optical products, pharmaceuticals, medicinal chemical and botanical products, machinery and equipment (n.e.c.)6 are among the activities which offer very high returns on physical capital. There are three major groups of basic metals industry, viz., basic iron and steel; basic precious and other non-ferrous metals; and casting of metals. The iron and steel industry, which is also the largest among the three, yielded particularly poor returns as a result of excess global capacity. Bans on iron ore mining and cancellation of coal blocks also adversely affected this industry. Apart from this, India suffered from a unique dichotomy wherein the Indian steel mills are extremely cost effective, but the steel industry is globally uncompetitive (Niti Aayog, 2017). Furthermore, electricity, gas, steam and air conditioning supply, textiles, chemicals and chemical products too yielded below average returns. Activity wise returns are presented in Annex A2. 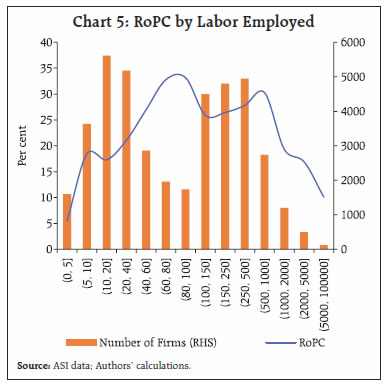 d. Regional Variations A considerable variance marks the returns across states (Annex A3). Notably, West Bengal, Odisha, Jharkhand, Gujarat, Chhatisgarh, and Andhra Pradesh fare worse than the national average. The north-eastern states outshine the other regions (Chart 6). Most of the value addition in formal manufacturing in these states stems from the pharma sector of Sikkim and coke and refined petroleum products in Assam. The capital investment in Sikkim’s pharma sector can be accredited to the North East Industrial Investment Promotion policy, which was started in 2007 under which the industries set up were given a ten-year tax exemption. While this ended in 2017, these companies can still avail similar benefits under various provisions. 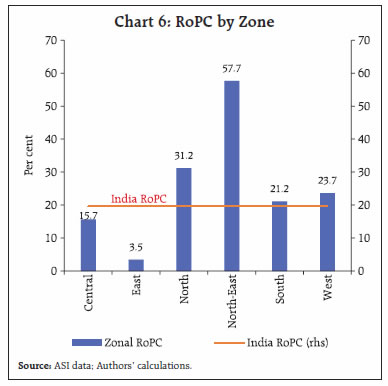 Intangible capital, viz., R&D stocks, patents, etc., is a much more critical input for value addition than physical capital in pharma industry, therefore, the RoPC tends to be usually high in this sector. In Sikkim, RoPC is further bolstered by the benign policy environment, which offers 100 per cent excise and income tax benefits along with freight subsidies. Additionally, ample availability of land, uninterrupted supply of power, low manufacturing and labour costs provide a conducive environment for the industry7. Sikkim is fast emerging as the pharma hub of India rivalling Gujarat, Maharashtra and Himachal Pradesh. Manufacture of coke and refined petroleum products in Assam exhibited very high RoPC for the period 2017-18 despite being highly capital-intensive in nature. However, pharma and petroleum products industries, being knowledge and capital intensive, have limited avenues in generating local employment opportunities commensurate to their value addition. Furthermore, a little over 90 per cent of value addition in manufacturing in North-East has taken place only in Sikkim and Assam. Meghalaya comes at a distant third with around 6 per cent contribution in value addition mainly in the manufacturing of other non-metallic mineral products. The contribution of other states in the region is miniscule. The eastern region of the country has the lowest RoPC due to low returns to investment in base metal industries in Odisha (Annex A4). The state has the highest investment in fixed capital in India and most of the value addition (around 75 per cent) takes place in the basic metals industry. Another related question is how the return of the industrialised states has fared vis-à-vis the poorer states. For this, the major states were divided into three groups viz., high income, middle income and low income based on the initial net value added per capita in registered manufacturing sector (Madhuresh, 2021)8. Barring a few isolated instances, the richer states continually maintained higher returns while the poorer states consistently lagged behind especially after 1997-98 (Chart 7). e. Variation with Age of Firm The RoPC of the firms tends to rise as they mature, however, it starts plunging after around 40 years (Chart 8). One strand of literature emphasises the role of selection mechanism. Firms learn about their efficiency as they operate in the industry. The efficient ones grow and survive; the inefficient decline and exit (Jovanovic, 1982). Therefore, the firms which are older are more likely to be efficient whereas the younger cohorts are a mixed bag of efficient and inefficient entities, thereby bringing the aggregate RoPC down. Another branch in the literature argues about the role of intangible capital, viz., organisational capital and R&D stocks. Firms accumulate organisational capital through a learning process as they age (Atkeson and Kehoe, 2005). The older firms have higher organisational capital and R&D stocks, which the younger firms lack, thus, garnering greater returns compared to their younger counterparts. The older firms are also likely to have more pricing power whereas the younger firms are constrained to operate on low markups for quite some time till they expand their presence in the market. However, these benefits of aging start to diminish after a threshold. 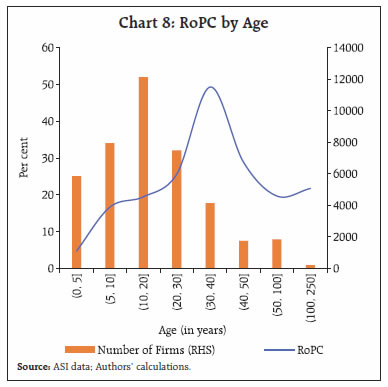 Finally, the relationship of RoPC with capital intensity (K/L) has been explored and as expected, diminishing returns to physical capital set in with increasing capital intensity (Chart 9). VI. Conclusion The economic literature is replete with multifarious methodologies of estimating RoPC, the results of which are not strictly comparable to each other. Most of the studies point out that India’s RoPC is close to the average return yielded by most emerging economies, which turns out to be significantly higher than the developed/transition economies. In our sample, which uses firm level data, the aggregate RoPC is estimated at 19.5 per cent which seems comparable to the returns observed in other developing countries. Notwithstanding aggregate returns, a germane issue is the variation of returns based on the attributes of firms. The RoPC for public firms in government and non-government sector is almost same at 17 per cent. However, returns of non-government private firms are significantly higher at 24 per cent as compared with returns of the government (private) firms at 12 per cent. Inverted U-shaped relationship is discernible between firms’ size and their returns. The returns of MSMEs increase with size and peak at medium enterprises but decrease for large firms owing to the diminishing marginal returns to capital (larger firms are more capital intensive vis-à-vis the MSMEs). Similar, relationship exists when labour employed is used as a yardstick to measure the size of the firms. It is found that the returns increase with the age of the firm, peaking at 30-40 years age-bracket before tapering off subsequently, indicating that the returns physical capital increase as the firms gain experience, enhance their capacities, gain pricing power and acquire better managerial skills as compared with the younger firms. Looking at the regional disparity in returns, north-eastern region fared much better than other regions. However, most of the value addition has taken place in pharma industry of Sikkim and petroleum products industry of Assam. A particularly disconcerting trend is the conspicuous under-performance of poor states vis-à-vis the richer states in terms of returns yielded by physical capital. Furthermore, this return differential has persisted over the last four decades. Nonetheless, the growth rate of capital in the poorer states has surpassed the middle-income and rich states in the last decade and these states are becoming increasingly capital intensive (Madhuresh, 2021). However, high growth rate of capital but with low returns somewhat neutralises the welfare gains that should have accrued to these states. The fillip to capital growth may prove to be transitory in the absence of commensurate rise in returns to capital which in turn, can be enhanced by improving public infrastructure such as road connectivity, low-cost uninterrupted power supply, telecom connectivity, law and order, etc. References Akbas, H., and Karaduman, H. (2012). The effect of firm size on profitability: An empirical investigation on Anusha Chari & Jennifer S. Rhee, 2020, ‘The Return to Capital in Capital-Scarce Countries’, NBER Working Papers 27675, National Bureau of Economic Research, Inc. Arocena, P., & Oliveros, D. (2012), ‘The efficiency of state-owned and privatized firms: Does ownership make a difference?’ International Journal of Production Economics, 140(1), 457–465. http://doi.org/10.1016/j. ijpe.2012.06.029 Asimakopoulos, I., Samitas, A., and Papadogonas, T. (2009). Firm-specific and Economy Wide Determinants of Firm Profitability: Greek Evidence Using Panel Data. Managerial Finance, 35(11), 930-939. Atkeson, A., & Kehoe, P. J. (2005), ‘Modeling and measuring organization capital’, Journal of Political Economy, 113(5), 1026–1053. https://doi.org/10.1086/431289 Bai, C.-E., Hsieh, C.-T., & Qian, Y. (2006), ‘The return to capital in China’ (No. w12755). National Bureau of Economic Research. https://doi.org/10.3386/w12755 Banchuenvijit, W. (2012), Determinants of Firm Performance of Vietnam Listed Companies. Academic and Business Research Instıtute. Beck, T., Demirgu¨c¸-Kunt, A., & Maksimovic, V. (2005), ‘Financial and legal constraints to growth: Does firm size matter?’ The Journal of Finance, 60(1), 137–177. Becker-Blease, J., Kaen, F., Etebari, A., and Baumann, H. (2010). Employees, firm size and profitability in U.S. manufacturing industries. Investment Management and Financial Innovations, 7(2), 7-23. Bigsten, A., Isaksson, A., Soderbom, M., Collier, P., Zeufack, A., Dercon, S., Fafchamps, M., Gunning, J. W., Teal, F., Appleton, S., Gauthier, B., Oduro, A., Oostendorp, R., & Pattillo, C. (2000), ‘Rates of return on physical and human capital in Africa’s manufacturing sector’, Economic Development and Cultural Change, 48(4), 801–827. Dhavan, R., & Sengupta, S. (2020, October 30), ‘A new growth formula for manufacturing in India’, McKinsey. https://www.mckinsey.com/industries/advanced-electronics/our-insights/a-new-growth-formula-for-manufacturing-in-india# Djankov, S., & Murrell, P. (2002) ‘Enterprise restructuring in transition: A quantitative survey’, Journal of Economic Literature, 40(3), 739–792. Doğan, M. (2013). Does Firm Size Affect The Firm Profitability? Evidence from Turkey. Research Journal of Finance and Accounting, 4(4), 53-59. Ehi-Oshio, O., Adeyemi, A., and Enofe, A. (2013). Determinants of Corporate Profitability in DevelopingEconomies. European Journal of Business and Management, 5(16), 42-50. Frydman, R., Gray, C.W., Hessel, M., Rapaczynski, A., 1999. When does privatization work? The impact of privateownership on corporate performance in transition economies. Quarterly Journal of Economics 114, 1153–1191. Ghafoorifard, M., Sheykh, B., Shakibaee, M., and Joshaghan, S. (2014). Assessing the Relationship between Firm Size, Age and Financial Performance in Listed Companies on Tehran Stock Exchange. International Journal of Scientific Management and Development, 2 (11), 631-635. Gupta, N., 2005. Partial privatization and firm performance. Journal of Finance, 60, 987–1015. Hsieh, C.-T., & Klenow, P. (2014), ‘The life cycle of plants in India and Mexico’, The Quarterly Journal of Economics, 129(3), 1035–1084. Idson, T. L., & Oi, W. Y. (1999), ‘Workers are more productive in large firms’, American Economic Review, 89(2), 104–108. Ike Mathur, Wanrapee Banchuenvijit, The effects of privatization on the performance of newly privatized firms in emerging markets, Emerging Markets Review, Volume 8, Issue 2, 2007, Pages 134-146, Khanna, Sushil. (2015). The Transformation of India’s Public Sector Political Economy of Growth and Change. Economic and Political Weekly. Kipesha, E. (2013). Impact of Size and Age on Firm Performance: Evidences from Microfinance Institutions in Tanzania. Research Journal of Finance and Accounting, 4(5)105-116. Lee, J. (2009). Does Size Matter in Firm Performance? Evidence from US Public Firms. International Journal of the Economics of Business, 16 (2), 189-203. Lingxia Sun, Dong Wook Lee, Dollar-weighted return on aggregate corporate sector: How is it distributed across countries? Pacific-Basin Finance Journal, Volume 57, 2019. Madhuresh Kumar (2021). Regional Economic Convergence in the Manufacturing Sector: An Empirical Reflection. RBI working papers, 02/2021. McKillop, D., French, D., Quinn, B., Sobiech, A. L., & Wilson, J. O. S. (2020), ‘Cooperative financial institutions: A review of the literature’, International Review of Financial Analysis, 71, 101520. https://doi.org/10.1016/j.irfa.2020.101520 Megginson, W. L., & Netter, J. M. (2001), ‘From State to Market: A Survey of Empirical Studies on Privatization’, Journal of Economic Literature, 39(2), 321–389. http://doi.org/10.1257/jel.39.2.321 Nan-Ting Chou & Alexei Izyumov & John Vahaly, 2016, ‘Rates of return on capital across the world: are they converging?’, Cambridge Journal of Economics, Oxford University Press, vol. 40(4), pages 1149-1166. Nishimura, K. G., Nakajima, T., & Kiyota, K. (2005), ‘Does the natural selection mechanism still work in severe recessions?: Examination of the Japanese economy in the 1990s’, Journal of Economic Behavior & Organization, 58(1), 53–78. https://doi.org/10.1016/j.jebo.2004.03.008 OECD. (2003), ‘Privatising State-Owned Enterprises. Paris: Organisation for Economic Co-operation and Development’ Retrieved from http://www.oecd-ilibrary.org/content/book/9789264104099-en Pervan, M., & Višić, J. (2012). Influence of firm size on its business success. Croatian Operational Research Review, 3(1), 213-223. Petrei, A. (1973), ‘Rates of Return to Physical Capital in Manufacturing Industries in Argentina’, Oxford Economic Papers, 25(3), new series, 378-404. Retrieved February 22, 2021, from http://www.jstor.org/stable/2662320 Rao, S. (2015), ‘Is the private sector more efficient? A cautionary tale’ (Discussion paper 10). Singapore: UNDP Global Centre for Public Service Excellence. Salawu, R. O., Asaolu, T. O., & Yinusa, D. O. (2012). Financial policy and corporate performance: an empirical analysis of Nigerian listed companies. International Journal of Economics and Finance, 4(4), 175. Saraswat V and Bansal R (2017). Need for New Steel Policy. Niti Ayog, Working Paper. Sarkar, J., Sarkar, S., & Bhaumik, S. K. (1998), ‘Does ownership always matter? —Evidence from the Indian banking industry,’ Journal of Comparative Economics, 26(2), 262–281. https://doi.org/10.1006/jcec.1998.1516 Senchack, A. J., & Lee, W. Y. (1980), ‘Comparative dynamics in a life cycle theory of the firm’, Journal of Business Research, 8(2), 159–185. https://doi.org/10.1016/0148-2963(80)90009-0 Shubita, F., and Alsawalhah, M. (2012). The Relationship between Capital Structure and Profitability.International Journal of Business and Social Science, 3(16), 104-112. Siba, E. (2015), ‘Returns to physical capital in Ethiopia: Comparative analysis of formal and informal firms’, World Development, 68, 215–229. https://doi.org/10.1016/j.worlddev.2014.11.016 Turkish manufacturing companies. European Journal of Economics, Finance and Administrative Sciences, 55, 21-27. Tybout, J. R. (2000), ‘Manufacturing firms in developing countries: How well do they do, and why?’, Journal of Economic Literature, 38(1), 11–44. Vijayakumar, A., & Tamizhselvan, P. (2010). Corporate size and profitability-an empirical analysis. Journal for Bloomers of Research, 3(1), 44-53.
| Annex A1: Broad Structure of ASI Data 2017-18 | | Block | Nature of data | Important information | No. of rows | | A | Identification parameters of selected unit | Industry code, State, District | 66,688 | | B | Particulars of the factory like name and address of the individual unit, type of organisation, year of initial production, etc. | Type of organisation,
Year of initial production | 66,688 | | C | Fixed assets | Land, Building, Plant and machinery, Transport equipment, Computer equipment, Pollution control equipment, Total fixed assets | 5,73,160 | | D | Working capital and loans | Raw Materials & Components,
Fuels & Lubricants,
Spares, Stores & others,
Semi-finished goods,
Finished goods,
Total inventory | 9,50,334 | | E | Employment and labour cost | Man-days worked,
Average number of persons worked, Wages/ salaries | 5,06,313 | | F | Other expenses | Operating expenses, Rent paid for plant & machinery and other fixed assets, Interest paid, Repair and maintenance expenditure of buildings and other fixed assets, Insurance charges, R&D Expenses | 55,376 | | G | Other output or receipts | Receipts from manufacturing and non-manufacturing services, rent received from plant and machinery, land,buildings and other fixed assets | 50,173 | | H | Indigenous input items consumed | Units of consumption of coal, gas, electricity and petroleum | 6,12,444 | | I | Imported input items consumed | Quantity and price of imported items consumed | 30,383 | | J | Products and by-products manufactured by the unit | Quantity manufactured and sold, gross sale value, taxes and subsidies | 1,32,238 |
Annex A2: RoPC by Sector
Annex A3: RoPC by State
| Annex A4: Classification of Zones | | Region | States / Union Territories | | Central | Madhya Pradesh | | Eastern | Bihar, Chhattisgarh, Jharkhand, Odisha, West Bengal | | Northern | Chandigarh, Haryana, Himachal Pradesh, Jammu & Kashmir, NCT of Delhi, Punjab, Rajasthan, Uttar Pradesh, Uttarakhand | | North-Eastern | Arunachal Pradesh, Assam, Manipur, Meghalaya, Nagaland, Sikkim, Tripura | | Southern | Andaman & Nicobar Island, Andhra Pradesh, Goa, Karnataka, Kerala, Puducherry, Tamil Nadu, Telangana | | Western | Dadara & Nagar Havelli, Daman & Diu, Gujarat, Maharashtra |
|