This article examines the near-term outlook for private investment activity in India based on data relating to investment intentions of the private corporate sector as per investment phasing plan indicated by project proposals. In 2020-21, reflecting the impact of Covid, there was a noticeable drop in the number of new projects sanctioned and also slower progress on projects already in the pipeline. Data on phasing plans for 2021-22 relating to projects in the pipeline point to persisting near-term risks to the investment outlook. Introduction Capital expenditure (capex) of the private corporate sector is a key lead indicator of the investment climate in the economy. Private investment can drive and contain higher growth and promote economic development. An assessment of the private investment outlook, therefore, is vital to gauge the prospects for growth. The annual accounts of companies having the details on investment are, however, published with a considerable time lag, limiting their usefulness to short-term forward looking analysis. A review of literature reveals that countries often use survey based methods to generate information on envisaged corporate investment plans and investment sentiment. The results of such surveys pave the way for assessment of both current investment climate and investment intentions that are likely to materialise in the short to medium-term. Following international best practices, efforts have been geared towards conducting surveys in India also since the late 1980s for the assessment and forecasting/nowcasting of private investment. For long, the Reserve Bank has been tracking capex plans of the private corporate sector through the projects that are funded by financial institutions for providing an outlook on investment based on the methodology adopted by Rangarajan (1970)1 on time phasing of capex. Such articles were published initially in the Economic and Political Weekly and subsequently in the Bulletin since 1989. The primary source of data on investment intentions are the financiers of capex projects viz., banking sector and financial institutions (FIs)2 as well as external commercial borrowings (ECBs)3, foreign currency convertible bonds (FCCBs), rupee denominated bonds (RDBs) and initial public offerings (IPOs), follow-on public offerings (FPOs) and rights issues during a year. Additionally, granular level data on capex projects from the capex database of the Centre for Monitoring Indian Economy (CMIE), dealing with their progress, right from announcement to completion (for completed projects), termination (for abandoned/ shelved projects) and intermediate events (for live projects) have also been used to assess the life cycle of projects (Box 1). Box 1: Life Cycle of Capex Projects The life cycle4 of a capex project typically begins with its announcement and progresses through different stages thereafter such as, obtaining various approvals, getting financial closure, sanction of loans, start of implementation, etc. The end of this cycle could either be a successful event, namely completion of the project, or an unsuccessful event, by way of an exit5 prior to its completion. The projects, which have not ended (through completion of all stages), are treated as live projects. Some of the projects which get stalled for some time in between announcement and completion are termed as “Stalled” projects. Announcements and Completions The number of completed private projects declined substantially during 2020-21. It may be noted that it had dipped marginally only during 2008-09, the year of global financial crisis, and rose subsequently till 2011-12 with some volatility. It increased since 2013-14 till 2018-19 consistently before sliding in 2019-20 reflecting the prevailing weak outlook prior to the emergence of the pandemic. It nosedived in 2020-21 indicating severity of the pandemic. The number of new announcements also declined further in 2020-21. The declining trends of announcements and completions may impact the phasing profile of capital expenditure going forward (Chart 1). 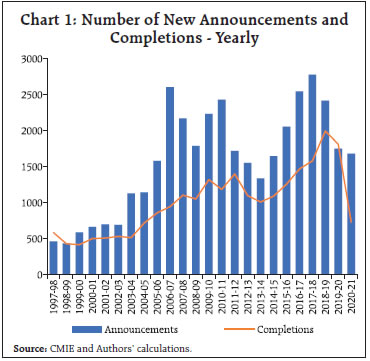 The monthly data reveals that only eight private projects were completed in April 2020, which witnessed the country-wide lockdown. There has been some recovery since then, although these numbers appear to be substantially lower than an average monthly number of a normal year. A relatively higher number of private projects announcements during Q2:2020-21 may cover the backlog, viz. pending/overdue announcements, which could not take place during Q1:2020-21 due to the intensified lockdown that prevailed in the quarter (Chart 2). Average Time to Completion The dataset of completed projects confirms that the average time to completion of a project since the date of announcement has a positive relationship with its cost size. This appeared to have increased during and around the period of the global financial crisis and remained high since then till 2014-15. The average time increased again since the trough of 2016-17 till 2020-21. It may be noted that the rise in the average time to completion in the Covid induced year 2020-21 is largely driven by significant increase in the same for the cohort of large projects (cost size ₹1,000 crore-₹5,000 crore). The number of such projects, which got completed, dipped noticeably in 2020-21, in line with the decline in the number of completions across all the cost-size groups. It is important to note that there is no mega project (cost size ₹5,000 crore and above), which got completed in the year (Chart 3). Average Time to Abandonment / Shelving / Stalling The average time of private projects, which could not be completed and ended either as abandoned or shelved has risen significantly over the years since the global financial crisis till 2017-18 (for abandoned projects) and 2015-16 (for shelved projects). From the compiled average time to abandon or shelving of projects after their respective announcements, it may be inferred that many projects, which were announced prior to the financial crisis (a boom period) were abandoned or shelved. Interestingly, after 2017-18, there has been a moderation in these numbers, which may reflect that either announcement of such projects have slumped or execution planning has improved. The average time to stalling of projects also increased gradually after the global financial crisis but moderated since 2017-18 (Chart 4). | The article is organised under six sections. Section II sets out the methodology and its limitations. Section III addresses the characteristics of projects sanctioned or contracted during the period of review, funding thereof, and distributional aspects in terms of regions and industries. Section IV deals with the phasing profile of the sanctioned/ contracted loans/financing and estimates growth of corporate investment. Section V presents an analysis of private placements and foreign direct investment made during the year. Section VI concludes the study. II. Methodology and Limitations As indicated earlier, the short-term (one-year ahead) forecasting of capex based on phasing details of corporate projects financed by financial institutions was pioneered by Dr. C. Rangarajan in 1970. For the estimation of capex under this methodology, data on projects in the private corporate sector are obtained from banks/FIs, supplemented with data on finances raised for capex purposes through other sources such as ECBs/FCCBs/IPOs/FPOs/rights issues. Based on ex ante phasing plans furnished by the companies at the time of appraisal by banks/FIs, an estimate of the likely level of capex that would have been made during the year is obtained. In this analysis, due care has been taken to ensure that each project enters the information set only once, even if it is financed through more than one source, by using databases internal to the Reserve Bank as well as information provided by the Securities and Exchange Board of India (SEBI). Projects that are not financed through any of the aforementioned sources or of a size lower than ₹10 crore are not covered. Projects with private ownership below 51 per cent or undertaken by trusts, central and state governments, and educational institutions are also excluded. The estimates are obtained based on the assumption that companies adhere to their ex ante expenditure plans. However, these estimates may digress from the ex post estimates of corporate fixed investment available in the National Accounts Statistics (NAS). This is in view of the possibility that some ex ante intentions may not fructify into realised investment in terms of their amount and timing of investment and some projects may be self-financed. III. Characteristics of Projects sanctioned / contracted The investment climate, which remained lacklustre in 2019-20, faced bigger challenges in the wake of the pandemic and has remained subdued since the beginning of 2020-21. The life cycle of existing projects got stretched coupled with lower number of fresh announcements (Box 1). This has been further corroborated by the data on sanctioned financial assistance for projects by banks/FIs during 2020-21. The fresh sanction of projects in the first half of 2020-21 dwindled to 68 projects, a record low compared to 137 projects sanctioned during H1:2019-20, clearly indicating the role of Covid-19 pandemic. The majority of banks/FIs reported ‘Nil’ projects during H1:2020-21, which points to very subdued investment climate of private corporate sector owing to pandemic induced uncertainties. The second half of 2020-21 showed some signs of recovery in terms of number of projects, which got financial assistance from the banks/FIs, though the investment climate remained subdued in terms of total cost of projects sanctioned by these entities. In all, banks and FIs sanctioned only 220 project proposals of the private companies during 2020-21, a record low6 in the recent years. The total cost of projects sanctioned too declined sharply to ₹75,558 crore in 2020-21 from ₹1,75,830 crore in 2019-20 (Annex: Table A1). A total of 344 companies raised an amount of ₹40,382 crore through ECBs/FCCBs and did not avail of any financing from the banks/FIs. Further, 12 companies did not avail of any bank finance or ECBs/FCCBs but raised ₹663 crore for their capex needs through domestic equity issues. Altogether, investment plans of 576 projects were made during 2020-21 aggregating to ₹1,16,603 crore as against 827 projects with investment intentions totalling ₹2,71,374 crore in 2019-20 (Annex: Table A1-A4). The characteristics of projects sanctioned/ contracted according to size, purpose, industry and location are described as below: (a) Size-wise The size-wise distribution of projects showed a noticeable decrease in the number of mega projects (₹5,000 crore & above) from five in 2019-20 to one in 2020-21 along with a decrease in its combined share in the total project cost. Similarly, the number of large projects of size ₹1000 crore-₹5000 crore declined from 36 (in 2019-20) to 24 in 2020-21. The relative share of such projects although increased to 53.5 per cent in 2020-21 from 37.4 per cent in 2019-20, which indicates higher relative presence in the small cohort of projects sanctioned in 2020-21. As observed in this article earlier (Box 1), the span of the life cycle of projects from announcement to completion is generally longer for larger projects. Accordingly, the phasing plan of mega/large projects may have a bearing on the capex in the longer-term (Annex: Table A5). (b) Purpose-wise The purpose-wise pattern of projects reveals that investments in green field (new) projects accounted for the predominant share (94.1 per cent) in the total project cost sanctioned by banks and FIs during 2020-21. This was higher as compared to corresponding shares in recent years (76.8 per cent in 2018-19 and 79.8 per cent in 2019-20). Expansion and modernisation of existing projects constituted about 5.9 per cent in the total project cost (Annex: Table A6). (c) Industry-wise The infrastructure sector, comprising (i) power, (ii) telecom, (iii) ports and airports, (iv) storage and water management, (v) SEZ, industrial, biotech and IT park, and (vi) roads and bridges, has seen an increase in its share from 61.5 per cent in 2019-20 to 74.3 per cent in 2020-21. This can be attributed to the surge in its two largest components, viz., ‘power sector’ and ‘roads & bridges’. However, the total project cost decreased from 2019-20 to 2020-21 across the board with many industries registering significant declines. For example, the total cost of projects sanctioned in the ‘power sector’ dipped from ₹57,855 crore in 2019-20 to ₹37,253 crore, although its relative share increased in 2020-21. Similarly, the total cost of projects sanctioned in case of ‘roads and bridges’ also dipped from ₹32,522 crore in 2019-20 to ₹16,224 crore. It may be recalled that at the aggregate level, the total cost of projects declined by more than half (57 per cent) in 2020-21 from the previous year (Chart 5 and Annex: Table A7). 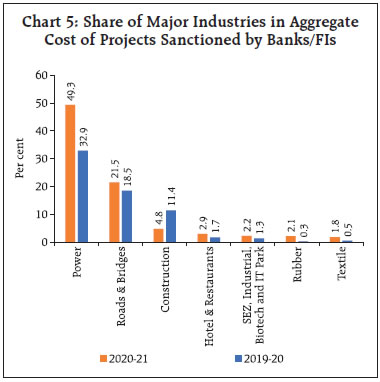 As the role of infrastructure investment is vital in spearheading long-term economic development of the country, it has been accorded high priority in various government plans and a slew of measures were also announced from time to time to scale up the infrastructure sector in order to spur up economic activities. The National Infrastructure Pipeline (NIP) launched recently by the Government of India has set a five-year roadmap with the projected infrastructure investment of ₹111 lakh crore during the period 2020-25, in which projects shall be funded jointly by the central government, state government and private sector. The industry details corroborate the same as reflected in the projects sanctioned, notwithstanding the overall subdued investment climate due to the pandemic. Going forward, successful implementation of these new infrastructure projects (roads & bridges and construction) has the potential for stimulating growth. However, the pandemic would have posed a major impediment in timely implementation of these projects in the short run, which should ease with the gradual opening of the economy. (d) State-wise The deciding factors for the location of a project are access to raw materials, availability of labour, adequate infrastructure, market size, and growth prospects. Data for the last five years (2016-17 to 2020-21) revealed that more than half (52.3 per cent) of the projects were taken up in five states, viz. Gujarat, Maharashtra, Karnataka, Andhra Pradesh, and Tamil Nadu. The spread of projects encompassing more than one state has increased during the quinquennial period of 2016-21 over the quinquennial period of 2011-16, despite significant decline in its share in 2020-21 (Chart 6 & Chart 7). In 2020-21, Rajasthan and Gujarat each accounted for the highest share (17.1 per cent) in the total cost of projects sanctioned by banks/FIs followed by Andhra Pradesh (15 per cent), Uttar Pradesh (13.7 per cent), Maharashtra (8.5 per cent), Haryana (7.8 per cent), Karnataka (6.1 per cent). Rajasthan and Andhra Pradesh are the two states to have registered a significant gain (by more than 10 percentage points) in their shares from the previous year which also rose during the quinquennial period. On the other hand, states like Karnataka, Telangana, Tamil Nadu and Jharkhand registered a decline in their share from the previous year (Chart 8 and Annex: Table A8).
IV. Phasing Profile of Investment Intentions The information on the phasing profile of envisaged capex from the cohort of projects sanctioned during different years helps in generating short-term (one-year ahead) forecasting of capex. The phasing from the cohort of projects sanctioned by the banks/ FIs in 2020-21 indicates that 38.4 per cent (₹29,013 crore) of the total proposed expenditure would have been incurred by the private corporate sector in 2020-21, 34.6 per cent (₹26,166 crore) in 2021-22 and another 18.8 per cent (₹14,179 crore) in the years beyond 2021-22. Around 8.2 per cent of total cost of the sanctioned projects in 2020-21 was already spent prior to 2020-21. From the planned expenditure, the capex envisaged in 2020-21 through banks/FIs showed a decline over the previous year by 10.9 per cent (from ₹1,38,288 crore to ₹1,23,240 crore) (Annex: Table A1). The capex planned to be incurred from resources raised through international bond markets also shrank by around 59 per cent, which remained positive in the previous three consecutive years. The capital market (equity route) enabled the financing of envisaged capex of ₹159 crore in 2020-21, which was markedly lower than from the previous years (Annex: Table A2, A3). To sum up, it is assessed that a total capex (from all channels) of ₹1,60,407 crore would be incurred by the private corporate sector in 2020-21, translating into a sharp dip of 30 per cent from the planned phasing of the previous year. This sharp dip is attributed to all the channels of financing (Annex: Table A4). The phasing profile of the envisaged capex based on the pipeline projects7 already sanctioned by the banks/FIs in the previous years indicates a decline from ₹94,227 crore in 2020-21 to ₹68,469 crore in 2021-22. The same also stands lower at ₹1,07,535 crore in 2021-22 (₹1,13,171 crore in 2020-21) considering all channels of financing together. However, it is quite possible that many of these might not have realised during 2020-21 and some other may not get realised in 2021-22 due to contingency pandemic related uncertainties (Annex: Table A1 and A4). V. Corporate Investment Financed by Private Placements and Foreign Direct Investment In recent years, the corporate sector has resorted to debt instruments like bonds and debentures and foreign direct investment (FDI) as alternative sources of capex financing. Data on debt-private placements reveals that mobilisation of funds through private placement of debt (bonds and debentures) rose substantially during the period from 2013-14 to 2016-17 but moderated largely thereafter from 2016-17 to remain below the peak attained in 2016-17. It increased in 2020-21 after dipping in 2019-20. The preference for FDI as an alternative source of capex financing is also observed, with an upsurge in FDI amount consistently from 2012-13 barring 2017-18. Accordingly, the FDI equity inflows stood at a record high in 2020-21 (Table 1). | Table 1: Private Placements and FDI | | (in ₹ crore) | | Period | Debt Private Placements* | Foreign Direct Investment** | | 2011-12 | 27,040 | 165,146 | | 2012-13 | 59,188 | 121,907 | | 2013-14 | 56,042 | 147,518 | | 2014-15 | 97,358 | 181,682 | | 2015-16 | 118,317 | 262,322 | | 2016-17 | 153,356 | 291,696 | | 2017-18 | 136,599 | 288,889 | | 2018-19# | 129,971 | 309,867 | | 2019-20# | 105,699 | 353,558 | | 2020-21# | 128,930 | 442,569 | *: Only for the manufacturing and services companies in the private sector
**: FDI inflows includes equity capital only
#: Provisional Data
Source: Prime Database and Government of India | VI. Conclusion This article uses data on investment intentions by the private corporate sector based on the phasing plans (ex-ante) of their project proposals to arrive at the aggregate investment intentions and assess the outlook for investment activity in the near term. Even before Covid-19, the economy had been witnessing sluggish investment intentions, as reflected by the lower number of new announcements of projects as well as elongation of the life cycle of existing projects. The pandemic impacted adversely appetite for new projects during 2020-21 and also posed impediments to timely completion of projects in the pipeline. Monitoring the life cycle relating to the pipeline projects – the extent of the elongation of the cycle and more importantly the range of possible outcome (completion/abandonment/deferment etc.) – would, therefore, be important. The phasing profile of envisaged capex shows persisting near-term risks to the private investment outlook in 2021-22, even though in 2021-22, while new projects would shape the outlook for private investment; existing in the pipeline though moderate can get a fillip by deferred pipeline investment from 2020-21 to 2021-22 positively increasing overall thrust to private investment.
Annex | Table A1: Phasing of Capex of Projects Sanctioned by Banks/FIs | | Year of sanction ↓ | No. of Projects | Project Cost in the Year of Sanction
(₹ crore) | Project Cost due to Revision/ Cancellation&
(₹ crore) | 2011-12 | 2012-13 | 2013-14 | 2014-15 | 2015-16 | 2016-17 | 2017-18 | 2018-19 | 2019-20 | 2020-21 | 2021-22 | Beyond 2021-22 | | 1 | 2 | 3 | 4 | 5 | 6 | 7 | 8 | 9 | 10 | 11 | 12 | 13 | 14 | 15 | | up to 2011-12 | | | | 2,90,613 | 1,78,643 | 86,858 | 21,408 | 3,044 | 869 | | | | | | | | 2012-13 | 414 | 1,96,345 | 1,89,483 (3.5) | 36,664 | 56,725 | 48,976 | 27,325 | 11,219 | 6,447 | 2,045 | | | | | | | 2013-14 | 472 | 1,34,019 | 1,27,328 (5.0) | 1,332 | 15,139 | 34,769 | 44,925 | 19,909 | 7,105 | 2,677 | 1,472 | | | | | | 2014-15 | 326 | 87,601 | 87,253 (0.4) | | 98 | 14,822 | 34,589 | 25,765 | 9,535 | 1,246 | 162 | 1,036 | | | | | 2015-16 | 346 | 95,371 | 91,781 (3.8) | | | 3,787 | 7,434 | 37,517 | 28,628 | 8,079 | 4,964 | 1,152 | 220 | | | | 2016-17 | 541 | 1,82,807 | 1,79,249 (2.0) | | | 1,352 | 3,952 | 25,388 | 71,186 | 41,075 | 21,643 | 8,566 | 4,001 | 2,086 | | | 2017-18 | 485 | 1,72,831 | 1,68,239 (2.6) | | | | 620 | 15,184 | 12,445 | 63,001 | 41,436 | 22,767 | 10,202 | 2,342 | 242 | | 2018-19 | 409 | 1,76,581 | 1,59,189 (9.8) | | | | | 569 | 6,862 | 11,000 | 59,973 | 47,080 | 21,248 | 9,759 | 2,698 | | 2019-20 | 320 | 2,00,038 | 1,75,830 (12.1) | | | | | | | 4,049 | 14,524 | 53,978 | 58,556 | 28,116 | 16,607 | | 2020-21 | 220 | 75,558 | | | | | | | | | 2,491 | 3,709 | 29,013 | 26,166 | 14,179 | | Total# | | | | 3,28,609 | 2,50,605 | 1,90,564 | 1,40,253 | 1,38,595 | 1,43,077 | 1,33,172 | 1,46,665 | 1,38,288 | 1,23,240 | 68,469 | 33,726 | | Percentage change | | | | | -23.7 | -24.0 | -26.4 | -1.2 | 3.2 | -6.9 | 10.1 | -5.7 | -10.9 | * | | # : Column totals indicate envisaged capex in a particular year covering the projects which received financial assistance in various years. The estimates are ex ante incorporating only envisaged investments. They are different from those actually realised/utilised.
* : Per cent change for 2021-22 is not worked out as capex from proposal that are likely to be sanctioned in 2021-22 is not fully available.
& : Figures in bracket are percentage of revision/cancellation. |
| Table A2: Phasing of Capex Projects* Funded Through ECBs/ FCCBs/RDBs** | | Loans contracted in ↓ | No. of Companies | Total loan contracted
(₹ crore) | 2011-12 | 2012-13 | 2013-14 | 2014-15 | 2015-16 | 2016-17 | 2017-18 | 2018-19 | 2019-20 | 2020-21 | 2021-22 | Beyond 2021-22 | | 1 | 2 | 3 | 4 | 5 | 6 | 7 | 8 | 9 | 10 | 11 | 12 | 13 | 14 | | up to 2011-12 | | | 38,342 | 15,673 | 2,400 | 100 | | | | | | | | | | 2012-13 | 519 | 65,692 | | 37,792 | 20,267 | 6,300 | 1,333 | | | | | | | | | 2013-14 | 563 | 80,736 | | | 56,197 | 20,976 | 3,563 | | | | | | | | | 2014-15 | 478 | 57,327 | | | | 36,791 | 16,806 | 3,151 | 575 | 2 | 2 | | | | | 2015-16 | 314 | 38,885 | | | | | 28,998 | 7,311 | 2,572 | 4 | | | | | | 2016-17 | 346 | 22,154 | | | | | | 14,953 | 6,005 | 1,192 | 2 | 2 | | | | 2017-18 | 419 | 37,896 | | | | | | | 17,822 | 13,054 | 6,484 | 529 | 7 | | | 2018-19 | 515 | 72,490 | | | | | | | | 46,221 | 17,725 | 1,236 | 5,398 | 1,910 | | 2019-20 | 495 | 95,491 | | | | | | | | | 65,367 | 17,157 | 11,717 | 1,250 | | 2020-21 | 344 | 40,382 | | | | | | | | | | 18,084 | 21,523 | 775 | | Total& | | | 38,342 | 53,465 | 78,864 | 64,167 | 50,700 | 25,415 | 26,974 | 60,473 | 89,580 | 37,008 | 38,645 | 3,935 | | Percentage change | | | | 39.4 | 47.5 | -18.6 | -21.0 | -49.9 | 6.1 | 124.2 | 48.1 | -58.7 | # | | * : Projects which did not receive assistance from banks/FIs.
** : Rupee Denominated Bonds (RDBs) have been included since 2016-17.
# : Per cent change for 2021-22 is not worked out as capex from proposals that are likely to be drawn in 2021-22 is not fully available.
& : The estimates are ex ante incorporating only envisaged investment. They are different from those actually realised/utilised. |
| Table A3: Phasing of Capex of Projects Funded Through Equity Issues* | | Equity issued during ↓ | No. of Companies | Capex Envisaged
(₹ crore) | 2011-12 | 2012-13 | 2013-14 | 2014-15 | 2015-16 | 2016-17 | 2017-18 | 2018-19 | 2019-20 | 2020-21 | 2021-22 | Beyond 2021-22 | | 1 | 2 | 3 | 4 | 5 | 6 | 7 | 8 | 9 | 10 | 11 | 12 | 13 | 14 | | up to 2011-12 | | | 1,186 | 455 | | | | | | | | | | | | 2012-13 | 25 | 1,135 | | 533 | 494 | 108 | | | | | | | | | | 2013-14 | 21 | 454 | | | | 384 | 70 | | | | | | | | | 2014-15 | 24 | 1,078 | | | | 189 | 557 | 332 | | | | | | | | 2015-16 | 40 | 4,511 | | | | 11 | 644 | 2,753 | 849 | 183 | 71 | | | | | 2016-17 | 29 | 1,159 | | | | | 14 | 471 | 368 | 163 | 143 | | | | | 2017-18 | 51 | 1,538 | | | | | | | 419 | 327 | 787 | 5 | | | | 2018-19 | 39 | 609 | | | | | | | | 506 | 90 | 13 | | | | 2019-20 | 12 | 53 | | | | | | | | 2 | 49 | 2 | | | | 2020-21 | 12 | 663 | | | | | | | | | | 139 | 421 | 103 | | Total& | | | 1,186 | 988 | 494 | 692 | 1,285 | 3,556 | 1,636 | 1,181 | 1,140 | 159 | 421 | 103 | | Percentage change | | | | -16.7 | -50.0 | 40.1 | 85.7 | 176.7 | -54.0 | -27.8 | -3.5 | -86.1 | # | | * : Projects which did not receive assistance from banks/FIs/ECBs/FCCBs/RDBs.
#: Per cent change for 2021-22 is not worked out as capex from proposals that are likely to be implemented in 2021-22 is not fully available.
& : The estimates are ex ante incorporating only envisaged investment. They are different from those actually realised/utilised. |
| Table A4: Phasing of Capex of Projects Funded Through Banks/FIs/IPOs/ECBs/FCCBs/RDBs*/IPOs | | Year of sanction ↓ | No. of Companies | Project Cost
(₹ crore) | 2011-12 | 2012-13 | 2013-14 | 2014-15 | 2015-16 | 2016-17 | 2017-18 | 2018-19 | 2019-20 | 2020-21 | 2021-22 | Beyond 2021-22 | | Banks/ FIs/ECBs/ FCCBs/ RDBs/IPOs | | 1 | 2 | 3 | 4 | 5 | 6 | 7 | 8 | 9 | 10 | 11 | 12 | 13 | 14 | | up to 2011-12 | | | 3,30,141 | 1,94,771 | 89,258 | 21,508 | 3,044 | 869 | | | | | | | | 2012-13 | 958 | 2,56,310 | 36,664 | 95,050 | 69,737 | 33,733 | 12,552 | 6,447 | 2,045 | | | | | | | 2013-14 | 1,056 | 2,08,518 | 1,332 | 15,139 | 90,966 | 66,285 | 23,542 | 7,105 | 2,677 | 1,472 | | | | | | 2014-15 | 828 | 1,45,658 | | 98 | 14,822 | 71,569 | 43,128 | 13,018 | 1,821 | 164 | 1,038 | | | | | 2015-16 | 700 | 1,35,177 | | | 3,787 | 7,445 | 67,159 | 38,692 | 11,500 | 5,151 | 1,223 | 220 | | | | 2016-17 | 916 | 2,02,562 | | | 1,352 | 3,952 | 25,402 | 86,610 | 47,448 | 22,998 | 8,711 | 4,003 | 2,086 | | | 2017-18 | 955 | 2,07,673 | | | | 620 | 15,184 | 12,445 | 81,242 | 54,817 | 30,038 | 10,736 | 2,349 | 242 | | 2018-19 | 963 | 2,32,288 | | | | | 569 | 6,862 | 11,000 | 1,06,700 | 64,895 | 22,497 | 15,157 | 4,608 | | 2019-20 | 827 | 2,71,374 | | | | | | | 4,049 | 14,526 | 1,19,394 | 75,715 | 39,833 | 17,857 | | 2020-21 | 576 | 1,16,603 | | | | | | | | 2,491 | 3,709 | 47,236 | 48,110 | 15,057 | | Total& | | | 3,68,137 | 3,05,058 | 2,69,922 | 2,05,112 | 1,90,580 | 1,72,048 | 1,61,782 | 2,08,319 | 2,29,008 | 1,60,407 | 1,07,535 | 37,764 | | Percentage change | | | | -17.1 | -11.5 | -24.0 | -7.1 | -9.7 | -6.0 | 28.8 | 9.9 | -30.0 | # | | * : Rupee Denominated Bonds (RDBs) have been included since 2016-17.
# : Per cent change for 2021-22 is not worked out as capex from proposals that are likely to be sanctioned in 2021-22 is not fully available.
& : The estimates are ex ante incorporating only envisaged investment, they are different from those actually realised/utilised. |
| Table A5: Size-wise Distribution of Projects Sanctioned by Banks/FIs: 2011-12 to 2020-21 | | Period | | Less than ₹100 crore | ₹100 crore to ₹500 crore | ₹500 crore to ₹1000 crore | ₹1000 crore to ₹5000 crore | ₹5000 crore & above | Total | | 2011-12 | No. of Projects | 420 | 145 | 36 | 26 | 9 | 636 | | | Per cent Share | 8.3 | 17.0 | 13.7 | 27.6 | 33.4 | 100 (1,91,592) | | 2012-13 | No. of Projects | 245 | 119 | 20 | 23 | 7 | 414 | | | Per cent Share | 4.8 | 14.6 | 7.3 | 26.8 | 46.4 | 100 (1,89,483) | | 2013-14 | No. of Projects | 306 | 115 | 25 | 21 | 5 | 472 | | | Per cent Share | 8.3 | 20.0 | 13.9 | 29.1 | 28.7 | 100 (1,27,328) | | 2014-15 | No. of Projects | 223 | 65 | 18 | 19 | 1 | 326 | | | Per cent Share | 9.0 | 16.6 | 14.6 | 47.8 | 12.0 | 100 (87,253) | | 2015-16 | No. of Projects | 214 | 76 | 34 | 21 | 1 | 346 | | | Per cent Share | 8.6 | 20.9 | 26.0 | 38.5 | 5.9 | 100 (91,781) | | 2016-17 | No. of Projects | 287 | 180 | 29 | 40 | 5 | 541 | | | Per cent Share | 5.8 | 23.3 | 11.9 | 41.7 | 17.4 | 100 (1,79,249) | | 2017-18 | No. of Projects | 263 | 149 | 28 | 42 | 3 | 485 | | | Per cent Share | 5.2 | 21.0 | 10.8 | 43.8 | 19.1 | 100 (1,68,239) | | 2018-19 | No. of Projects | 220 | 110 | 39 | 36 | 4 | 409 | | | Per cent Share | 4.8 | 17.0 | 17.0 | 39.6 | 21.6 | 100 (1,59,189) | | 2019-20 | No. of Projects | 150 | 84 | 45 | 36 | 5 | 320 | | | Per cent Share | 3.3 | 11.9 | 18.6 | 37.4 | 28.8 | 100 (1,75,830) | | 2020-21 | No. of Projects | 128 | 52 | 15 | 24 | 1 | 220 | | | Per cent Share | 5.5 | 16.8 | 14.2 | 53.5 | 10.0 | 100 (75,558) | Note: i. Figures in bracket are total cost of projects in ₹ crore.
ii. Per cent share is the share in total cost of projects. Percentages may not add to 100 due to rounding. |
| Table A6: Purpose-wise Distribution of Projects Sanctioned by Banks/FIs: 2011-12 to 2020-21 | | Period | Number and Share of Projects | New | Expansion & Modernisation | Diversification | Others | Total | | 2011-12 | No. of Projects | 449 | 172 | 5 | 10 | 636 | | | Per cent Share | 70.6 | 23.1 | 0.1 | 6.3 | 100 (1,91,592) | | 2012-13 | No. of Projects | 303 | 107 | - | 4 | 414 | | | Per cent Share | 84.2 | 14.7 | - | 1.1 | 100 (1,89,483) | | 2013-14 | No. of Projects | 361 | 95 | 2 | 14 | 472 | | | Per cent Share | 65.2 | 20.1 | - | 14.7 | 100 (1,27,328) | | 2014-15 | No. of Projects | 203 | 92 | 2 | 29 | 326 | | | Per cent Share | 39.4 | 14.7 | 0.2 | 45.7 | 100 (87,253) | | 2015-16 | No. of Projects | 260 | 64 | 3 | 19 | 346 | | | Per cent Share | 73.6 | 14.3 | 0.1 | 12.0 | 100 (91,781) | | 2016-17 | No. of Projects | 429 | 97 | 4 | 11 | 541 | | | Per cent Share | 78.6 | 9.9 | 0.1 | 11.3 | 100 (1,79,249) | | 2017-18 | No. of Projects | 396 | 80 | 2 | 7 | 485 | | | Per cent Share | 89.0 | 9.5 | 0.1 | 1.5 | 100 (1,68,239) | | 2018-19 | No. of Projects | 309 | 80 | - | 20 | 409 | | | Per cent Share | 76.8 | 19.3 | - | 3.9 | 100 (1,59,189) | | 2019-20 | No. of Projects | 262 | 37 | 1 | 20 | 320 | | | Per cent Share | 79.8 | 13.7 | - | 6.4 | 100 (1,75,830) | | 2020-21 | No. of Projects | 181 | 38 | 1 | - | 220 | | | Per cent Share | 94.1 | 5.9 | - | - | 100 (75,558) | Note: i. Figures in brackets are total cost of projects in ₹ crore.
ii. Per cent share is the share in total cost of projects. Percentages may not add to 100 due to rounding.
iii. - : Nil/ Negligible. |
| Table A7: Industry-wise Distribution of Projects Sanctioned by Banks/FIs: 2011-12 to 2020-21 | | Industry | 2011-12 | 2012-13 | 2013-14 | 2014-15 | 2015-16 | 2016-17 | 2017-18 | 2018-19 | 2019-20 | 2020-21 | | No. of Projects | Per cent Share | No. of Projects | Per cent Share | No. of Projects | Per cent Share | No. of Projects | Per cent Share | No. of Projects | Per cent Share | No. of Projects | Per cent Share | No. of Projects | Per cent Share | No. of Projects | Per cent Share | No. of Projects | Per cent Share | No. of Projects | Per cent Share | | Infrastructure | 107 | 47.4 | 82 | 47.9 | 87 | 39.8 | 74 | 48.8 | 108 | 72.0 | 204 | 62.6 | 150 | 51.8 | 122 | 60.4 | 99 | 61.5 | 63 | 74.3 | | i) Power | 82 | 42.4 | 71 | 39.4 | 70 | 35.1 | 65 | 42.2 | 92 | 57.1 | 170 | 45.4 | 117 | 36.5 | 78 | 26.8 | 47 | 32.9 | 35 | 49.3 | | ii) Telecom | 1 | 0.0 | 2 | 5.6 | 1 | 0.0 | 1 | 4.9 | 1 | 0.3 | 1 | 0.0 | - | - | - | - | - | - | - | - | | iii) Ports & Airports | 1 | 1.3 | 1 | 1.9 | 1 | 0.8 | - | - | 3 | 2.4 | 8 | 5.7 | 6 | 3.1 | 4 | 14.2 | 4 | 8.4 | 1 | 0.1 | | iv) Storage & Water Management | 12 | 0.5 | - | - | 5 | 1.1 | 2 | 0.6 | 4 | 4.2 | 6 | 3.7 | 2 | 0.4 | 13 | 5.7 | 4 | 0.4 | 5 | 1.2 | | v) SEZ, Industrial, Biotech and IT Park | 11 | 3.2 | 8 | 0.9 | 8 | 1.5 | 3 | 0.9 | 1 | 0.4 | 2 | 0.4 | 9 | 1.6 | 11 | 3.2 | 8 | 1.3 | 5 | 2.2 | | vi) Roads & Bridges | - | - | - | - | 2 | 1.2 | 3 | 0.3 | 7 | 7.6 | 17 | 7.3 | 16 | 10.1 | 16 | 10.4 | 36 | 18.5 | 17 | 21.5 | | Construction | 23 | 1.8 | 20 | 2.8 | 27 | 2.1 | 29 | 4.0 | 26 | 1.8 | 60 | 12.0 | 39 | 5.3 | 26 | 2.3 | 44 | 11.4 | 27 | 4.8 | | Hotel & Restaurants | 51 | 4.6 | 31 | 3.1 | 29 | 2.7 | 15 | 1.1 | 16 | 1.1 | 12 | 0.8 | 29 | 2.9 | 26 | 1.9 | 16 | 1.7 | 4 | 2.9 | | Rubber Products | 18 | 0.9 | 7 | 0.5 | 9 | 0.3 | 8 | 0.8 | 4 | 0.5 | 8 | 0.2 | 10 | 2.5 | 5 | 0.5 | 5 | 0.3 | 17 | 2.1 | | Textiles | 94 | 7.0 | 31 | 1.9 | 58 | 10.3 | 50 | 4.1 | 49 | 4.8 | 57 | 4.1 | 54 | 3.7 | 27 | 3.4 | 11 | 0.5 | 15 | 1.8 | | Chemicals & Fertilisers | 17 | 3.5 | 19 | 1.1 | 15 | 1.0 | 7 | 2.6 | 11 | 1.6 | 10 | 2.1 | 23 | 11.4 | 19 | 2.9 | 12 | 1.3 | 9 | 1.6 | | Food Products | 41 | 1.5 | 36 | 0.9 | 43 | 1.8 | 34 | 2.9 | 26 | 1.8 | 38 | 0.9 | 47 | 2.8 | 28 | 1.4 | 32 | 1.9 | 20 | 1.5 | | Cement | 9 | 2.0 | 11 | 3.9 | 12 | 7.1 | 7 | 3.8 | 5 | 1.9 | 5 | 2.3 | 3 | 0.6 | 10 | 5.1 | 2 | 0.1 | 5 | 1.3 | | Metal & Metal Products | 73 | 16.3 | 51 | 28.9 | 44 | 17.0 | 17 | 17.4 | 14 | 1.5 | 23 | 4.9 | 21 | 9.7 | 16 | 3.0 | 14 | 0.8 | 6 | 0.8 | | Pharmaceuticals | 20 | 0.8 | 10 | 0.4 | 19 | 1.3 | 9 | 1.5 | 11 | 0.3 | 12 | 1.1 | 15 | 0.6 | 23 | 1.6 | 9 | 0.6 | 7 | 0.5 | | Hospitals & Health Services | 9 | 0.3 | 17 | 1.4 | 10 | 0.7 | 2 | 0.1 | 1 | 0.0 | 22 | 1.1 | 18 | 1.8 | 15 | 2.6 | 12 | 0.7 | 7 | 0.3 | | Transport Equipment | 26 | 2.6 | 17 | 0.9 | 16 | 1.2 | 7 | 5.3 | 4 | 2.5 | 9 | 3.6 | 10 | 0.3 | 5 | 0.8 | 5 | 0.4 | 2 | 0.3 | | Mining & Quarrying | 4 | 0.2 | 2 | 0.1 | 1 | 0.6 | 2 | 0.1 | 10 | 2.7 | 4 | 0.4 | 1 | 0.0 | 7 | 5.6 | 6 | 5.3 | 2 | 0.2 | | Others* | 144 | 11.0 | 80 | 5.8 | 102 | 14.1 | 65 | 7.5 | 61 | 7.4 | 77 | 3.9 | 65 | 6.7 | 80 | 8.5 | 53 | 13.4 | 36 | 7.7 | | Total | 636 | 100 | 414 | 100 | 472 | 100 | 326 | 100 | 346 | 100 | 541 | 100 | 485 | 100 | 409 | 100 | 320 | 100 | 220 | 100 | | Total project cost (₹ crore) | 1,91,592 | 1,89,483 | 1,27,328 | 87,253 | 91,781 | 1,79,249 | 1,68,239 | 1,59,189 | 1,75,830 | 75,558 | * : Comprise industries like Agricultural & Related Activities, Paper & Paper Products, Printing & Publishing, Rubber Products, IT Software, Communication, Trading of services, Paper & Paper Products, Entertainment, other manufacturing, other services etc.
- : Nil/Negligible.
Note: Per cent share is the share in total cost of project. Percentages may not add to 100 due to rounding. |
| Table A8: State-wise Distribution of Projects Sanctioned by Banks/FIs: 2011-12 to 2020-21 | | States/Union Territory | 2011-12 | 2012-13 | 2013-14 | 2014-15 | 2015-16 | 2016-17 | 2017-18 | 2018-19 | 2019-20 | 2020-21 | | No. of Projects | Per cent Share | No. of Projects | Per cent Share | No. of Projects | Per cent Share | No. of Projects | Per cent Share | No. of Projects | Per cent Share | No. of Projects | Per cent Share | No. of Projects | Per cent Share | No. of Projects | Per cent Share | No. of Projects | Per cent Share | No. of Projects | Per cent Share | | Rajasthan | 49 | 4.9 | 41 | 5.3 | 24 | 1.4 | 29 | 11.1 | 10 | 0.9 | 23 | 2.8 | 33 | 6.3 | 21 | 7.7 | 23 | 3.8 | 21 | 17.1 | | Gujarat | 75 | 9.0 | 58 | 5.6 | 66 | 14.5 | 71 | 9.5 | 61 | 15.1 | 102 | 23.0 | 71 | 8.0 | 56 | 11.1 | 47 | 15.1 | 54 | 17.1 | | Andhra Pradesh | 52 | 5.1 | 35 | 5.7 | 37 | 4.0 | 24 | 8.1 | 33 | 12.3 | 47 | 8.0 | 22 | 9.9 | 29 | 11.1 | 12 | 4.0 | 7 | 15.0 | | Uttar Pradesh | 42 | 7.8 | 26 | 4.4 | 21 | 1.1 | 20 | 5.4 | 15 | 2.5 | 22 | 3.7 | 30 | 2.4 | 28 | 4.8 | 24 | 5.6 | 30 | 13.7 | | Maharashtra | 86 | 19.1 | 67 | 10.7 | 76 | 19.7 | 38 | 14.8 | 36 | 9.4 | 57 | 8.8 | 65 | 23.3 | 34 | 11.5 | 41 | 6.9 | 13 | 8.5 | | Haryana | 45 | 1.4 | 18 | 1.2 | 15 | 1.1 | 11 | 1.9 | 16 | 3.6 | 13 | 1.6 | 21 | 0.5 | 18 | 1.7 | 20 | 3.4 | 15 | 7.8 | | Karnataka | 39 | 12.0 | 20 | 1.6 | 39 | 6.2 | 27 | 5.4 | 21 | 6.2 | 52 | 6.8 | 64 | 9.6 | 34 | 5.7 | 33 | 17.2 | 11 | 6.1 | | Assam | 3 | 0.2 | 1 | 0.5 | 4 | 0.3 | 2 | 0.2 | 4 | 0.4 | 10 | 0.6 | 5 | 0.8 | 4 | 0.2 | 1 | 0.3 | 3 | 4.4 | | Madhya Pradesh | 16 | 5.6 | 13 | 3.9 | 30 | 6.1 | 14 | 3.9 | 21 | 7.0 | 18 | 7.5 | 10 | 0.7 | 12 | 1.6 | 10 | 1.2 | 19 | 2.8 | | Telangana | - | - | - | - | - | - | - | - | 10 | 3.8 | 51 | 5.5 | 17 | 1.9 | 26 | 9.1 | 12 | 4.0 | 9 | 1.9 | | Chhatisgarh | 11 | 2.4 | 9 | 4.1 | 16 | 10.7 | 8 | 7.4 | 8 | 4.6 | 15 | 4.0 | 7 | 4.8 | 6 | 0.9 | 6 | 0.2 | 3 | 1.2 | | Tamil Nadu | 58 | 5.7 | 22 | 1.8 | 33 | 5.4 | 27 | 2.9 | 26 | 9.3 | 23 | 4.4 | 28 | 6.6 | 32 | 12.8 | 28 | 8.3 | 7 | 0.7 | | Punjab | 37 | 1.7 | 12 | 10.9 | 28 | 1.5 | 6 | 0.3 | 11 | 1.7 | 29 | 2.1 | 31 | 2.2 | 15 | 1.9 | 9 | 0.8 | 4 | 0.7 | | Puducherry | - | - | - | - | 1 | 0.0 | - | - | - | - | 1 | 0.0 | - | - | - | - | - | - | 1 | 0.5 | | West Bengal | 19 | 4.9 | 13 | 1.0 | 12 | 1.2 | 9 | 1.3 | 14 | 3.1 | 18 | 1.7 | 14 | 1.8 | 13 | 1.1 | 7 | 0.9 | 3 | 0.4 | | Jharkhand | 12 | 1.3 | 8 | 1.2 | 4 | 0.3 | 2 | 0.7 | 5 | 0.3 | 1 | 0.0 | 3 | 0.3 | 2 | 0.5 | 4 | 9.4 | 1 | 0.2 | | Jammu & Kashmir | 5 | 0.2 | 10 | 0.2 | 10 | 5.2 | 2 | 0.1 | 9 | 0.2 | 3 | 0.1 | 8 | 2.0 | 11 | 0.4 | 3 | 0.1 | 5 | 0.2 | | Himachal Pradesh | 7 | 0.5 | 5 | 0.3 | 3 | 1.8 | 3 | 0.1 | 8 | 1.4 | 1 | 0.0 | 8 | 2.3 | 7 | 0.3 | 6 | 0.1 | 4 | 0.2 | | Multi-State# | 34 | 4.5 | 15 | 7.7 | 21 | 6.9 | 10 | 9.5 | 13 | 13.5 | 17 | 11.8 | 16 | 7.5 | 15 | 9.8 | 8 | 11.7 | 2 | 1.4 | | Others* | 46 | 14.0 | 41 | 34.1 | 32 | 12.5 | 23 | 17.3 | 25 | 4.6 | 38 | 7.5 | 32 | 9.0 | 46 | 8.2 | 26 | 7.1 | 8 | 0.2 | | Total | 636 | 100 | 414 | 100 | 472 | 100 | 326 | 100 | 346 | 100 | 541 | 100 | 485 | 100 | 409 | 100 | 320 | 100 | 220 | 100 | | Total Cost of Projects (₹ crore) | 1,91,592 | 1,89,483 | 1,27,328 | 87,253 | 91,781 | 1,79,249 | 1,68,239 | 1,59,189 | 1,75,830 | 75,558 | # : Comprise projects over several States/Union Territories.
* : Comprise remaining States/Union Territories.
- : Nil/Negligible or Information not available.
Note: Per cent share is the share in total cost of project. Percentages may not add to 100 due to rounding. |
|